Occurrence and Health-Risk Assessment of Trace Metals in Raw and Boiled Drinking Water from Rural Areas of China


1
Graduate School of Chinese Academy of Geological Sciences, Beijing 100037, China
2
Center of Exploration and Development of Geology and Mineral Resources of Jiangxi Province, Nanchang 330030, China
3
State Key Laboratory of Environmental Geochemistry, Institute of Geochemistry Chinese Academy of Sciences, Guiyang 550081, China
4
University of Chinese Academy of Sciences, Beijing 100049, China
*
Author to whom correspondence should be addressed.
†
These authors contributed equally to this work.
Water 2018, 10(5), 641; https://doi.org/10.3390/w10050641
Submission received: 4 April 2018
/
Revised: 2 May 2018
/
Accepted: 11 May 2018
/
Published: 16 May 2018
(This article belongs to the Section Water Quality and Contamination)
Abstract
:In order to assess the exposure of rural residents to trace metals via drinking water ingestion, 222 drinking water samples of rural areas from 8 provinces in China were collected and 18 trace metals analyzed by inductively coupled plasma mass spectrometer (ICP-QMS). Based on metal concentrations, the health-risk assessment such as chronic daily intakes (CDI) and hazard quotient (HQ) were calculated. Results showed that most metals occurred in the drinking water at very low concentrations, indicating a general good quality, while the concentrations of As, Pb and Zn in some samples from Qinghai, Yunnan and Hunan provinces were higher than World Health Organization (WHO) and Chinese guidelines for drinking water. The values of CDI and HQ indicated a negligible health risk for most Chinese rural residents via drinking water. However, high concentrations of As in drinking water from Qinghai province would pose a serious risk to the local inhabitants. More attention and intensive study should be paid to Zn, Pb and As contents.
1. Introduction
Drinking water quality and security is a global issue. At present, there is an increasing trend that fresh water is under immense stress due to rapid population growth, urbanization and unsustainable consumption of water in industry and agriculture [1,2,3,4,5]. In developing countries, the problem is further aggravated due to the lack of proper management, unavailability of professionals and financial constraints [6,7,8,9,10,11,12,13].
Heavy metals/metalloids are an important kind of pollutant that lead to a degradation of water quality [14]. Trace metals in waters may originate from both natural and anthropogenic processes, such as mineral weathering, industrial activities, municipal wastewater discharge, unsustainable agricultural practices, and traffic activities [15,16]. Landfill impact on water contamination is considered to be one of the most pronounced issues threatening water quality [17,18] Due to the contamination of arsenic (As), drinking water from more than 70 countries is not safe for consumption for approximately 150 million people [19]. High levels of lead (Pb) and vanadium (V) are often detected in tap water supplied by lead pipes [20,21,22]. Bottled water can usually be contaminated by Pb and antimony (Sb) due to the leaching of these elements from the containers [23,24]. The elevated concentrations of toxic metals in drinking water will increase the body loadings which may result in adverse health effects varying from shortness of breath to several types of cancer [3,8,25,26,27].
In China, water contamination is an increasing environmental problem. A high number of lakes and major rivers in China are classified as severely polluted according to the water environmental quality standard of China (GB 3838-2002), with only half of China’s 200 major rivers and less than a quarter of its 28 major lakes and reservoirs suitable for use as drinking water after treatment [28]. It has been reported that 90% of cities in China are suffering from varying degrees of groundwater contamination by metals and other pollutants [29]. It was noted by [30] that contamination of potable water with heavy metals has a considerable impact on the Chinese population’s health. Therefore, it is essential to constantly monitor water quality used for drinking purposes in China, but such work is not always sufficient. Furthermore, drinking water quality monitoring and the available studies on daily intakes of trace metals in drinking water are limited to big cities [31,32,33] or specific sites [34,35]. In rural areas or countryside regions, water quality information is scarce [3,8]. Indeed, water pollution is especially severe in Chinese rural areas [28] (Zhang et al.). In 2006, a national survey of 6948 rural households across China observed that only about half had access to a centralized public water supply and the remainder relied on untreated hand pumps, wells, or surface-water sources [36]. Thus, the objectives of this study were to evaluate drinking water quality in terms of trace metal concentrations in Chinese rural areas and assess the daily metal intakes and associated health risks via drinking water ingestion.
2. Materials and Methods
2.1. Sample Collection
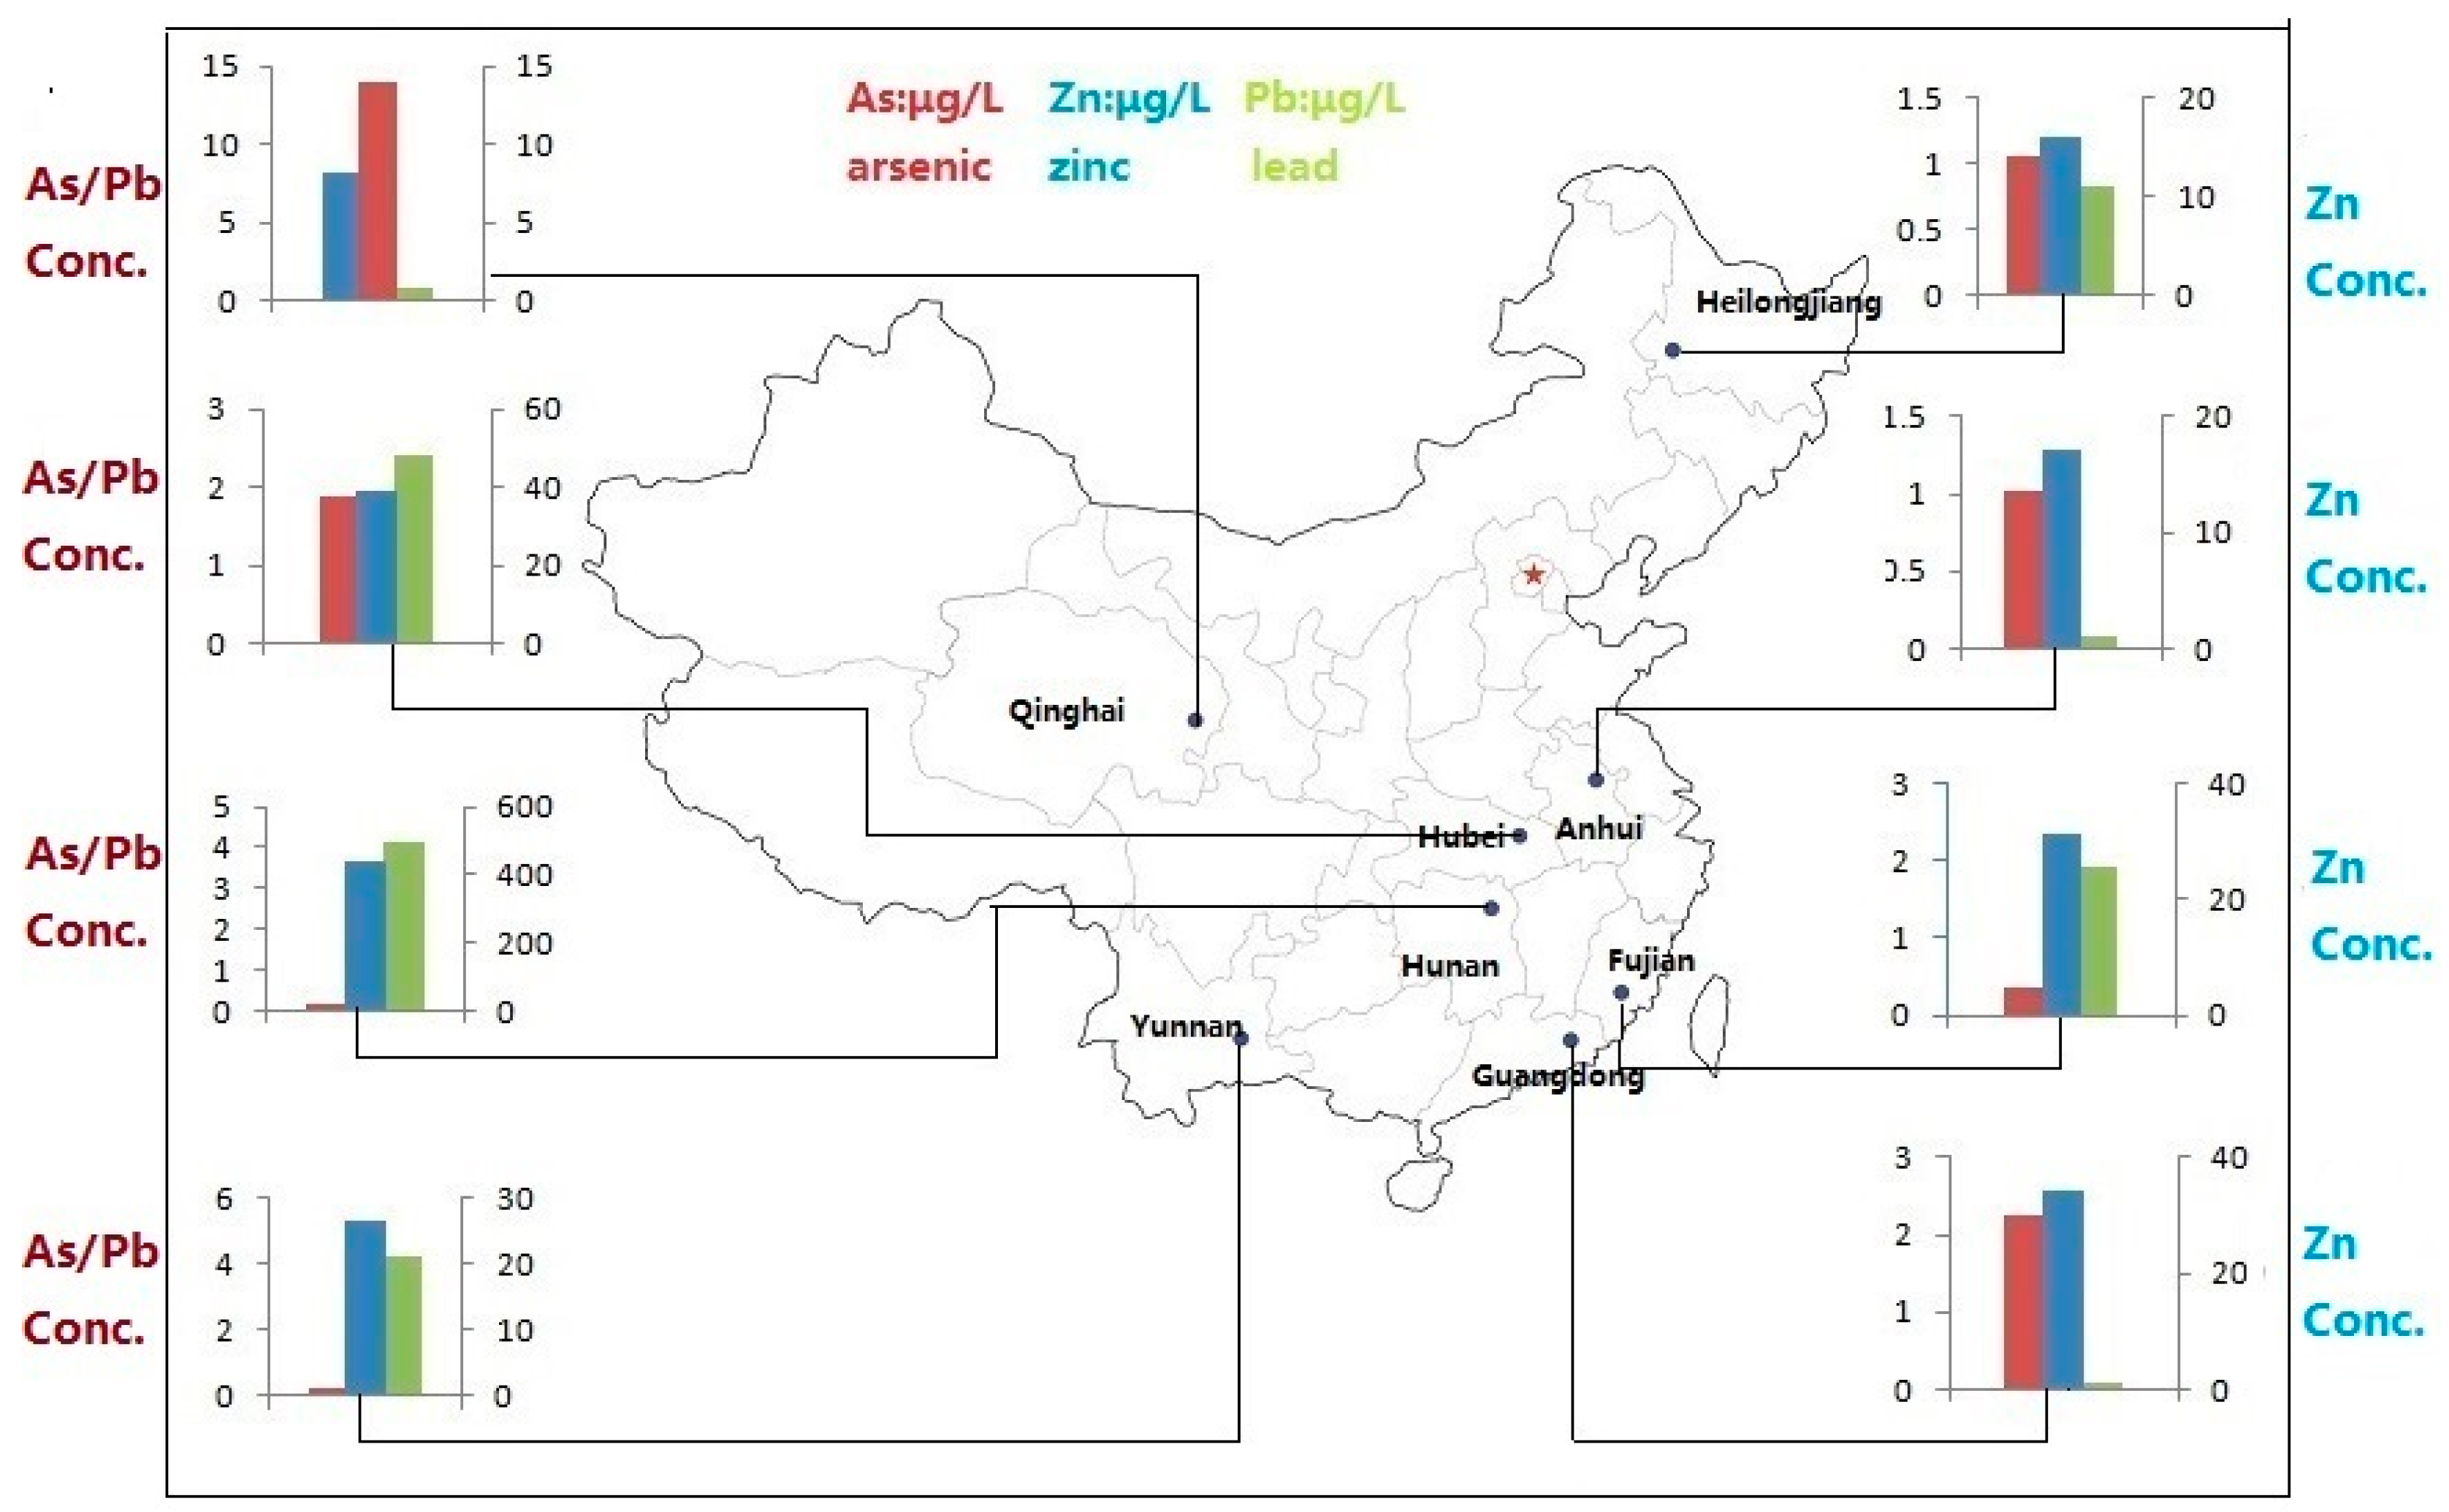
Sampling was conducted in August 2010; 222 drinking water samples (including 59 raw drinking waters and 163 boiled waters) were randomly collected in Chinese rural areas in 8 provinces (Figure 1). Raoping is located at the eastern of Guangdong province, and belongs to the marine subtropical monsoon climate zone; Ezhou is located in the eastern part of Hubei province, and is located on the South Bank of the midstream of the Yangtze River. It belongs to the subtropical monsoon climate zone. Lianyuan is located in the central part of Hunan province and is called “the hometown of non-ferrous metals”. In the subtropical continental monsoon humid climate zone, Pinghe county is located in the south-west of Fujian province and is known as “thoroughfare of eight counties”. Huaiyuan is located in the northern part of Anhui province and is in the transitional zone from the north subtropical to the warm temperate zone. Yuxi is located in the central part of Yunnan province, belonging to the subtropical monsoon climate.; Minhe is located on the eastern edge of Qinghai province and is a continental dry climate on the plateau Daqing is located in the western part of Heilongjiang province and is in the continental monsoon climate zone of the north temperate zone. It is the largest petroleum and petrochemical base in China. All the samples were collected from wellsprings or wells in a 50 mL polypropylene tube pre-cleaned by 15% nitric acid and Milli-Q (18.2 MΩ cm) water [37]. After determination of the pH by pH meter (Beckman Coulter, Inc., Fullerton, CA, USA), the samples were acidified with ultra-pure concentrated 6M nitric acid to pH < 2. Due to local drinking habits, none of the water samples were filtered. Because most families drink boiled water instead of tap water directly in China, the boiled water used can indicate the health risk of drinking water. Furthermore, the water samples were boiled and analysed for trace metal concentrations in an iron kettle.
2.2. Analytical Methods
Analyses of trace metals were performed by a quadrupole inductively coupled plasma mass spectrometer (ICP-QMS) (ELAN DRC-e, PerkinElmer Inc., Waltham, MA, USA). Rhodium was used as an internal standard element to correct for instrumental drifts. Reagent and procedural blanks and a standard sample of known composition were analyzed as part of each batch of samples. The standard reference solutions (SRS) were analyzed to check the measurement precision. The accuracy of the method was checked by running SRS after every 10 samples. The precision of the analytical procedure, expressed as the relative standard deviation (RSD), was better than 10% and the range of precision of analysis procedure was 89% to 105%.
3. Risk Assessment
The exposure pathways of the metals in water include direct ingestion and dermal contact, but the later can be negligible in comparison to oral intake. The daily exposure for ingestion route was calculated according to the modified equation [38,39,40]:
where CDI is the chronic daily intake (μg/kg/d), C is metal concentration in drinking water (μg/L), DI is the average daily intake rate of drinking water (L/d), and BW is body weight in (kg). Carcinogenic risk was determined according to Equation (2) and the hazard quotient for non-carcinogenic risk was calculated by Equation (3) [41]:
where R is the probability of carcinogenic risk (unitless), SF is the cancer slope factor of the contaminant (mg/kg/d) [41].
where HQ is the hazard quotient, and RfD is the reference dose (μg/kg/d) [41].
Descriptive statistics and one-way analysis of variance (ANOVA) were performed by the SPSS software ver. 13.
4. Results and Discussion
4.1. Trace Metal Concentrations
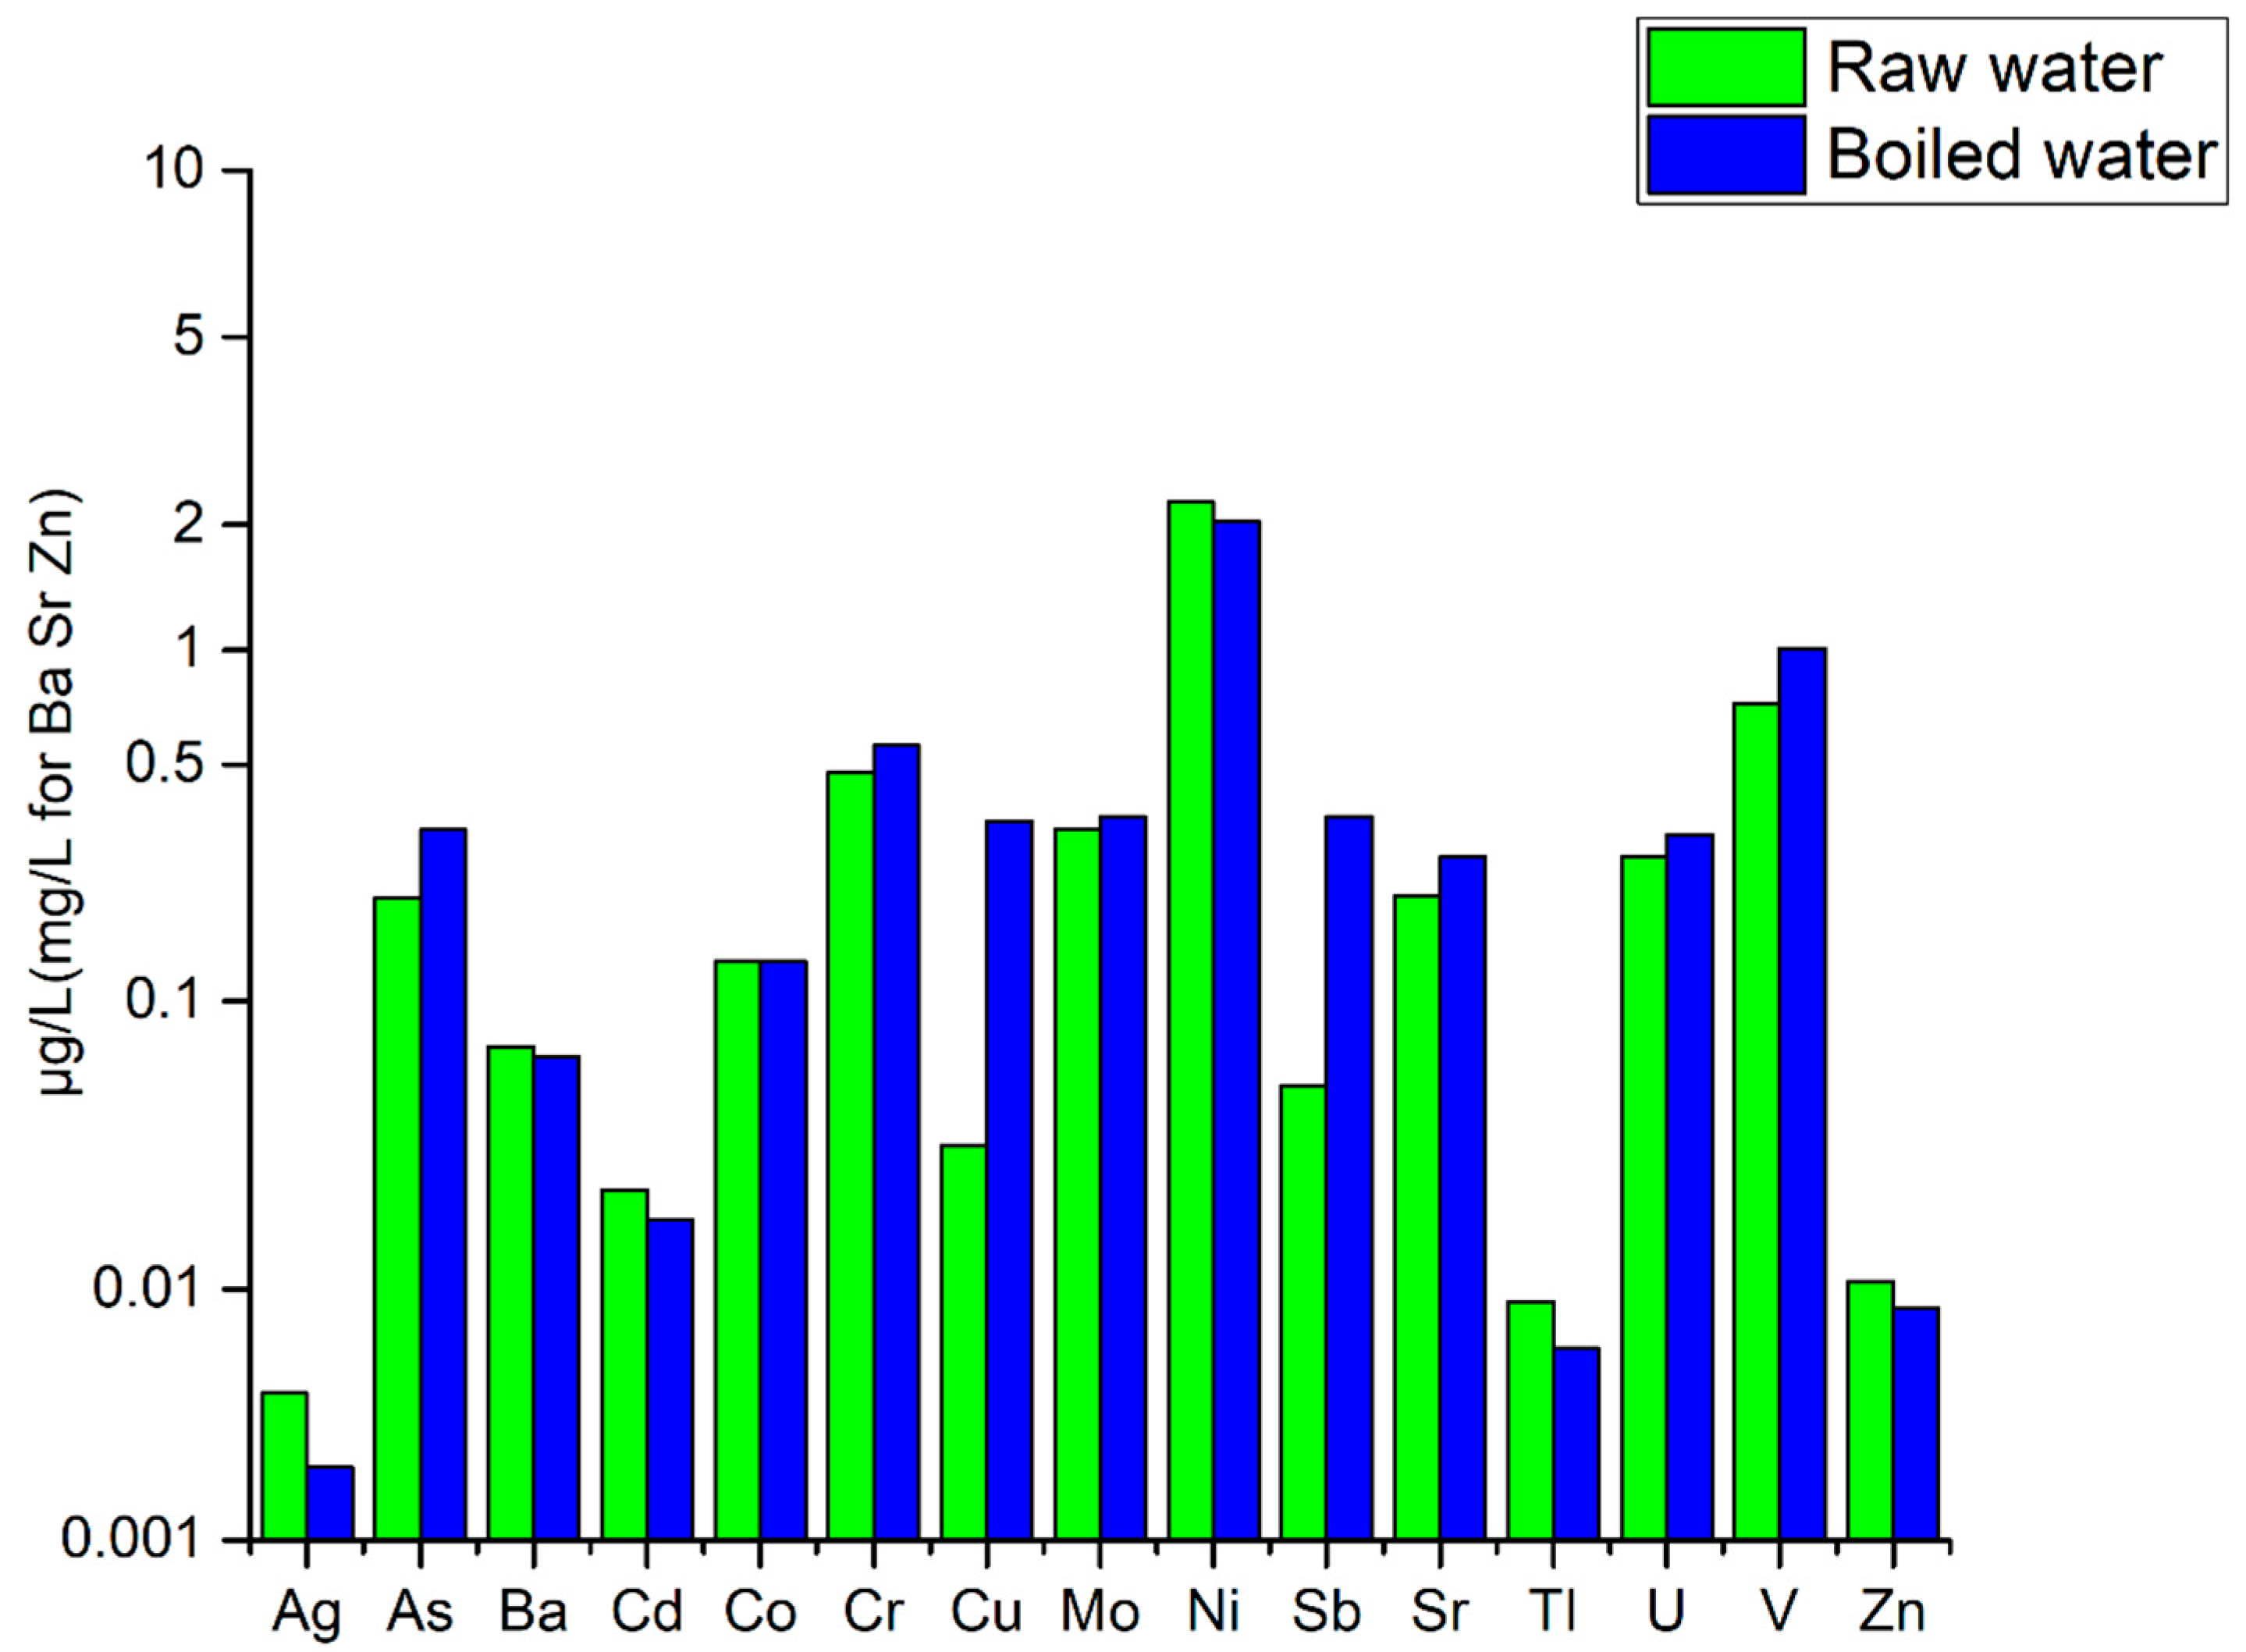
This study focuses on 18 potential trace metals, including Ag, As, Ba, Be, Cd, Co, Cr, Cu, Mo, Ni, Pb, Sb, Sn, Sr, Tl, U, V and Zn. Results are summarized in Table 1, together with corresponding World Health Organization (WHO) (WHO, 2006) and Chinese guidelines for drinking water [42] The median concentrations of studied metals in the raw drinking water were similar to those in the boiled water. However, trace metals in boiled water are generally higher than in raw water. The concentration of nickel is the highest both raw and boiled water among all trace metals (Figure 2). Silver concentration is almost not detected, and the concentration of cadmium and thallium is always low.
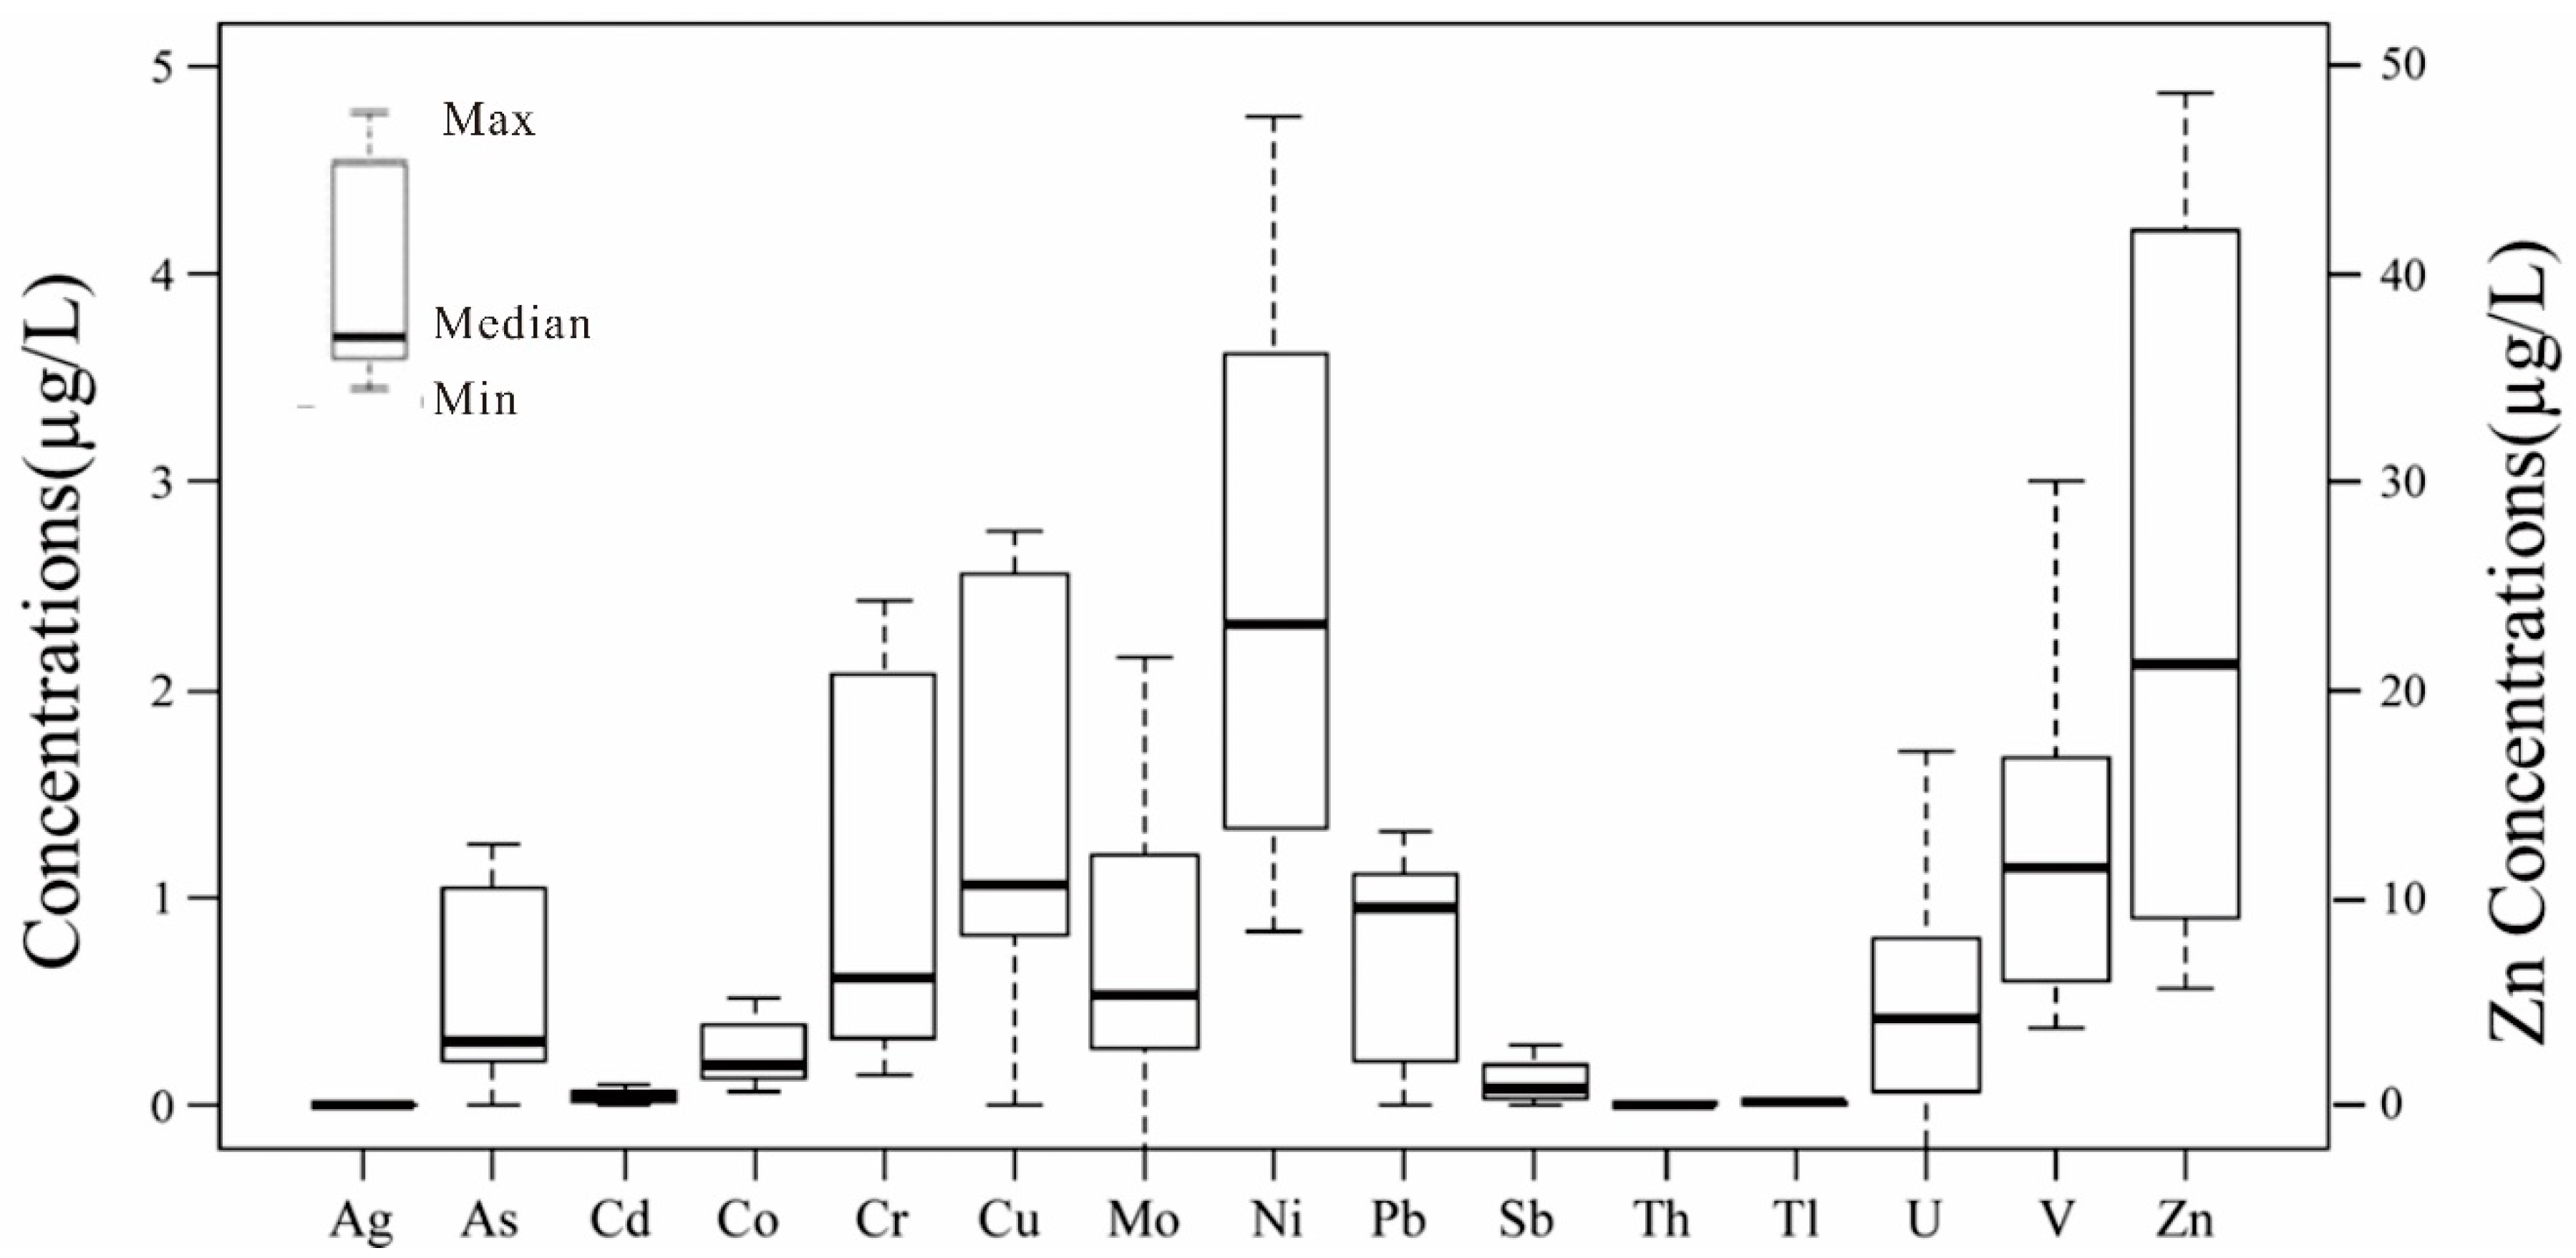
The overall concentrations varied greatly and the maximum concentrations of most metals in the drinking water were well below the existing guideline values [42,43]. The exceptions were As, Pb, Zn and Tl.
As shown in Figure 3, except for zinc, the others correspond to the right coordinate axis. The concentration of zinc is extremely high. The mean concentrations of Ag, As, Cd, Co, Sb, Th, Tl, U are relatively low. The mean concentrations of Cr, Cu, Mo, Ni, Pb, V, Zn are relatively high. The concentrations of As, Mo, Pb, V are relatively concentrated. The concentrations of Cr, Cu, Ni, Zn are relatively dispersive. The concentration of Ni present a normal dispersion, the concentration of Pb, V are left offset prior, As, Co, U are right offset prior.
Because As is a highly toxic element with many carcinogenic effects, its occurrence in drinking water deserves the most concern. The maximum tolerable concentration of 10 μg/L has been established by the national Chinese and WHO drinking water standards (WHO, 2006; MHPRC, 2006). In mainland China, it involves eight provinces, including 40 counties and 1047 villages, with a population of 2,343,238 exposed to high-arsenic water (generally between 50 and 2000 μg/L) [44]. In this study, most of the water samples had As concentrations lower than the Chinese and WHO threshold levels. But three samples from Minhe, Qinghai province, contained significantly high As concentrations (22–100 μg/L). These samples were collected from mineral spring water sites and thus the enrichment of As might be a result of water-rock interaction processes [45]. Indeed, Qinghai is one of the provinces that suffer contamination by high-arsenic water. A highest concentration of 318 μg/L of As in groundwater has been reported in Qinghai province [8,35,42]; As levels investigated in potable water in Qinghai found the highest concentration was 100 and 23.17 μg/L, respectively. Recently, a stricter reference As guideline of 3.4 μg/L has been recommended for drinking water based on male bladder cancer with an excess risk of 10−4 for a 75-year lifetime exposure [46]. In comparison, 5% of the drinking water failed to meet this guideline.
Lead has numerous acute and chronic adverse effects on humans, especially children, by influencing their nervous system and reducing their intelligence. Pb is an ultratrace metal in natural water with concentrations being as low as several ng/L [47]. But elevated Pb has usually been detected in bottled water due to the leaching of Pb from the containers [23,24] and in tap water due to the corrosion of water supply systems [22,48,49]. In the current study, Pb occurs in drinking water at very low concentrations (51%) below the detection limit. However, several samples with Pb concentrations are higher than the WHO and Chinese guidelines of 10 μg/L. These samples were all collected from Yunnan province, which is a major lead mineralization belt in China. So, these elevated concentrations of Pb in the drinking water probably reflect the high natural background [50].
Zinc is an essential element, but excessive intakes can cause demyelinating diseases in humans [51]. The median concentration of Zn in this study was 8.6 μg/L, far below the Chinese guideline value of 1000 μg/L. But Zn concentrations (1060–2260 μg/L) in three samples from Hunan province exceeded the Chinese reference value. Hunan province is regarded as the heartland of Chinese non-ferrous mining and smelting, especially for Zn. It can therefore be concluded that the high concentrations of Zn in drinking water from Hunan must be a result of contamination from the Zn mining/smelting activities [50]. This is in agreement with the findings of Cai et al. [34], where they have reported similar concentrations of Zn (10–2090 μg/L) in contaminated groundwater from Xiangjiang watershed, Hunan province.
According to the above discussion, more attention should be paid to Zn, Pb and As content, and the distribution of these in 8 provinces are shown in Figure 1.
No WHO limits exist for Tl in drinking water although the United States Environmental Protection Agency (USEPA) guideline value for Tl has been set to 2 μg/L [52]. No waters in this study had Tl concentrations that exceeded the USEPA limit. However, China established a much stricter threshold level of 0.1 μg/L for Tl in drinking water considering its high toxicity. Although most waters were far below this level, two samples still surpassed this (0.11 and 0.14 μg/L). The highest value of Tl in the present study was in agreement with the maximum concentration (0.152 μg/L) found in bottled waters from British Isles [53].
Except for the above several outliers, the overall concentrations of the trace metals would indicate a general good quality of the studied waters. In addition, our results were in good agreement with previous studies on drinking water from urban regions of Beijing [3,31,32], and cities from Jiangsu province [33], suggesting that rural drinking water quality regarding trace metals was equal to those from the urban regions. A similar result was obtained from the survey of Gao et al. [54], where no obvious difference was found for Cu, As, Hg and Cd concentrations in drinking water between the urban and suburban areas of Beijing.
Comparing eight cities in China (Table 2 and Table 3), the contents of trace metals in drinking water in the Baoding, Guangdong, Shenyang and Henan are higher than in rural areas. The other three cities is lower than that in rural area. However, trace elements in Beijing were lower after 2012 than before 2011. This indicates that the quality of drinking water in the country has improved.
4.2. Exposure Assessment
Considering the fact that fewer rural residents drink unboiled water, we thus used the data of boiled water for the exposure assessment and the following risk assessment. The chronic daily intakes (CDI) of trace metals via drinking water ingestion were calculated based on Equation (1) listed in Section 3. The average daily intake rate of drinking water has been set to 2.2 L. This value has been proved and widely used for the Chinese population [31,32]. Average body weight was taken as 65 kg according to actual measurement by previous surveys [31,32]. The results of CDI together with background exposure values are presented in Table 5.
The CDI values for most trace metals were much lower than the corresponding background exposure values. Generally, the mean values of CDI accounted for less than 5% of their background values, except Ba (32%), As (15%) and Pb (7.2%). The maximum CDI value (3.37 μg/kg/d or 200 μg/d) for As was 10 times and three times higher than its background exposure value (0.3 μg/kg/d) and tolerable daily intake (TDI) value (1.0 μg/kg/d) [69], respectively, indicating a high health risk. In the arsenic-affected areas of West Bengal, Vietnam and Thailand, daily intakes of As via drinking water ingestion were 216–266 μg/d [70], 1.1–4.3 μg/kg/d [71] and 1.1–4.3 μg/kg/d [72], respectively, similar to the highest value of our study. But in the highly contaminated areas of East Punjab, Pakistan, As concentrations in groundwater could reach 2400 μg/L and the calculated CDI for As could be as high as 4800 μg/d [73]. Although high CDI of As were found in a few sites, its median value (0.01 μg/kg/d or 0.64 μg/d) in this study was much lower than the results from Beijing (0.07 μg/kg/d) [31], Shenzhen (0.029 μg/kg/d) [3] and İzmir, Turkey (0.035 μg/kg/d) [26], but similar to Maryland (0.52 μg/d) [74]. Similarly, the median or mean CDI values for other trace metals (mainly Cd, Cr, Cu, Pb, Mo, Ni, Sb, U and Zn) were also lower than (or similar to) data from the Chinese cities of Beijing [31], Shanghai [32], Shenzhen [3], and cities from Jiangsu province [33], as well as other regions of İzmir, Turkey [26], Kohistan, Pakistan [52], West Bengal, India [67], Japan [75] and Maryland [74]. But the mean CDI values for Cr, Pb, Ni, U and Zn in the present study were higher than the corresponding data from Japan [75].
4.3. Risk Assessment
Lifetime carcinogenic risk in Table 6 was calculated only for As since the slope factor values were not available for the other metals. The slope factor for As was taken as 1.5 (mg/kg/d). Reference dose values of the trace metals used for non-carcinogenic risk assessment are listed in Table 7.
The median and mean values of lifetime carcinogenic risk (R) for As in drinking water were 1.38 × 10⁻⁵ and 1.11 × 10⁻⁴, respectively, which was significantly lower than those results from Beijing (median 1.05 × 10⁻⁴) [31] and İzmir, Turkey (5.20 × 10⁻⁵ and 6.35 × 10⁻⁴ for median and 90th percentile, respectively) [26]. In this study, 98.7% of the individuals had lifetime carcinogenic risks higher than the lowest safe standard (1 in 1,000,000), while 11.3% exceeded the highest safe standards (1 in 10,000). However, people from Qinghai province had cancer risks as high as 5 in 1000. Therefore, some residents from Chinese rural areas may be exposed to drinking water with As concentrations that could lead to cancer.
For the non-carcinogenic risk, hazard quotient (HQ) values for trace metals in this study were found in the order of As >> Sr > Ba > Sb > U > Zn > Mo > Ni > Cd >> Cr ≈ Ag >> Be. Arsenic has the highest HQ values with median and 90th percentile values of 0.03 and 0.27, respectively. Furthermore, three samples had HQ values for As higher than 1 (2.7, 3.2 and 11.2 respectively), indicating that non-cancer health effects would occur if people drink these waters. Apart from these, HQ values for all the other trace metals were far below 1, indicating a negligible non-carcinogenic risk.
It is important to note that HQ was not calculated for Pb since the reference dose value was not available. In addition, the previously established provisional tolerable weekly intake (PTWI) for Pb (25 μg/kg bw) was withdrawn in 2010 by JECFA (Joint FAO/WHO Expert Committee on Food Additives), as it could no longer be considered health protective. Therefore, the health risk of Pb in drinking water has not been assessed like the other metals. In fact, CDI values for Pb were relatively high in some sites from Yunnan province and the highest value was found to exceed the background exposure value for adults. Therefore, an elevated health risk may be posed to this portion of population and this situation will be worse when aggregated exposure over all pathways/routes is considered.
5. Conclusions
The present study conducted a preliminary survey to determine 18 trace metal concentrations in drinking waters supplied to Chinese rural populations and assessed the associated potential health risks. Except for high concentrations of As, Pb and Zn found in a few samples, the overall concentrations of the trace metals indicate a general good quality of the studied waters. The values of CDI and HQ indicated a negligible health risk for most Chinese rural residents via drinking water ingestion. However, high concentrations of As in drinking water from Qinaghai province poses a serious risk to the local inhabitants. More attention should be paid to Zn, Pb and As content and they should be monitored in the future. The results from our study may allow for construction of a database of water quality variables for rural areas. In addition, the CDI obtained in this study may provide useful information for the evaluation of daily metal intake and the associated health risks from total diet.
The uncertainty of the health risk assessment was mainly attributable to the following aspects: (1) seasonal variation in trace metal concentrations was not investigated; (2) water intake rate and consumption habits were not studied; and (3) body weights were not measured. This study provides guidance for drinking water trace metal regulatory activities and public health surveillance actions.
Author Contributions
Guangyi Sun and Junhua Wu conceived and designed the experiments; Junhua Wu performed the field sampling; Yi Man and Lihai Shang carried out the sample preparation and analytical experiments; Junhua Wu and Guangyi Sun contributed reagents/materials/analysis tools; Junhua Wu, Yi Man and Guangyi Sun analyzed the data; Junhua Wu and Yi Man wrote the paper.
Funding
This research was funded by National Natural Science Foundation of China, (grant number 41773146, 41273144, and 41473121) and the Chinese Academy of Sciences through the Hundred Talent Plan (Yin Runsheng).
Conflicts of Interest
The authors declare no conflicts of interest.
References
- Poyraz, B.; Taspinar, F. Analysis, Assesment and Principal Component Analysis of Heavy Metals in Drinking Waters of Industrialized Region of Turkey. Int. J. Environ. Res. 2014, 8, 1261–1270. [Google Scholar]
- Wongsasuluk, P.; Chotpantarat, S.; Siriwong, W.; Robson, M. Heavy metal contamination and human health risk assessment in drinking water from shallow groundwater wells in an agricultural area in Ubon Ratchathani province, Thailand. Environ. Geochem. Health 2014, 36, 169–182. [Google Scholar] [CrossRef] [PubMed]
- Zhu, Z.; Sun, G.; Bi, X.; Li, Z.; Yu, G. Identification of trace metal pollution in urban dust from kindergartens using magnetic, geochemical and lead isotopic analyses. Atmos. Environ. 2013, 77, 9–15. [Google Scholar] [CrossRef]
- Bai, Y.; Wang, M.; Peng, C.; Alatalo, J.M. Impacts of urbanization on the distribution of heavy metals in soils along the Huangpu River, the drinking water source for Shanghai. Environ. Sci. Pollut. Res. 2016, 23, 5222–5231. [Google Scholar] [CrossRef] [PubMed]
- Ding, H.J.; Ji, H.B.; Tang, L.; Zhang, A.X.; Guo, X.Y.; Li, C.; Gao, Y.; Briki, M. Heavy metals in the gold mine soil of the upstream area of a metropolitan drinking water source. Environ. Sci. Pollut. Res. 2016, 23, 2831–2847. [Google Scholar] [CrossRef] [PubMed]
- Azizullah, A.; Khattak, M.N.K.; Richter, P.; Häder, D.P. Water pollution in Pakistan and its impact on public health—A review. Environ. Int. 2011, 37, 479–497. [Google Scholar] [CrossRef] [PubMed]
- Prioteasa, L.; Prodana, M.; Buzoianu, M.; Demetrescu, I. Determination by ICP-MS of Heavy Metals and Other Toxic Elements in Drinking Water from Several Rural Areas of Romania. Rev. Chim. 2014, 65, 925–928. [Google Scholar]
- Geng, M.H.; Qi, H.J.; Liu, X.L.; Gao, B.; Yang, Z.; Lu, W.; Sun, R.B. Occurrence and health risk assessment of selected metals in drinking water from two typical remote areas in China. Environ. Sci. Pollut. Res. 2016, 23, 8462–8469. [Google Scholar] [CrossRef] [PubMed]
- Sun, G.; Li, Z.; Bi, X.; Chen, Y.; Lu, S.; Yuan, X. Distribution, sources and health risk assessment of mercury in kindergarten dust. Atmos. Environ. 2013, 73, 169–176. [Google Scholar] [CrossRef]
- Sun, G.; Chen, Y.; Bi, X.; Yang, W.; Chen, X.; Zhang, B.; Cui, Y. Geochemical assessment of agricultural soil: A case study in Songnen-Plain (Northeastern China). Catena 2013, 111, 56–63. [Google Scholar] [CrossRef]
- Sun, G.; Li, Z.; Liu, T.; Chen, J.; Wu, T.; Feng, X. Metal exposure and associated health risk to human beings by street dust in a heavily industrialized city of Hunan province, central China. Int. J. Environ. Res. Public Health 2017, 14, 261. [Google Scholar] [CrossRef] [PubMed]
- Sun, G.; Li, Z.; Liu, T.; Chen, J.; Wu, T.; Feng, X. Rare earth elements in street dust and associated health risk in a municipal industrial base of central China. Environ. Geochem. Health 2017, 39, 1469–1486. [Google Scholar] [CrossRef] [PubMed]
- Liao, X.; Zhang, C.; Sun, G.; Li, Z.; Shang, L.; Fu, Y.; He, Y.; Yang, Y. Assessment of Metalloid and Metal Contamination in Soils from Hainan, China. Int. J. Environ. Res. Public Health 2018, 15, 454. [Google Scholar] [CrossRef] [PubMed]
- Alves, R.I.; Sampaio, C.F.; Nadal, M.; Schuhmacher, M.; Domingo, J.L.; Segura-Muñoz, S.I. Metal concentrations in surface water and sediments from Pardo River, Brazil: Human health risks. Environ. Res. 2014, 133, 149–155. [Google Scholar] [CrossRef] [PubMed]
- Withanachchi, S.S.; Ghambashidze, G.; Kunchulia, I.; Urushadze, T.; Ploeger, A. Water Quality in Surface Water: A Preliminary Assessment of Heavy Metal Contamination of the Mashavera River, Georgia. Int. J. Environ. Res. Public Health 2018, 15, 621. [Google Scholar] [CrossRef] [PubMed]
- Qu, L.; Huang, H.; Xia, F.; Liu, Y.; Dahlgren, R.A.; Zhang, M.; Mei, K. Risk analysis of heavy metal concentration in surface waters across the rural-urban interface of the Wen-Rui Tang River, China. Environ. Pollut. 2018, 237, 639–649. [Google Scholar] [CrossRef] [PubMed]
- Gworek, B.; Dmuchowski, W.; Koda, E.; Marecka, M.; Baczewska, A.H.; Brągoszewska, P.; Sieczka, A.; Osiński, P. Impact of the municipal solid waste Łubna Landfill on environmental pollution by heavy metals. Water 2016, 8, 470. [Google Scholar] [CrossRef]
- Vaverková, M.; Adamcová, D. Evaluation of landfill pollution with special emphasis on heavy metals. J. Ecol. Eng. 2014, 15, 1–6. [Google Scholar]
- Ravenscroft, P.; Brammer, H.; Richards, K. Arsenic Pollution: A Global Synthesis; John Wiley: New York, NY, USA, 2009. [Google Scholar]
- Gerke, T.L.; Scheckel, K.G.; Schock, M.R. Identification and distribuion of vanadinite (Pb5(V5+O4)3Cl) in lead pipe corrosion by-products. Environ. Sci. Technol. 2009, 43, 4412–4418. [Google Scholar] [CrossRef] [PubMed]
- Kim, E.J.; Herrera, J.E.; Huggins, D.; Braam, J.; Koshowski, S. Effect of pH on the concentrations of lead and trace contaminants in drinking water: A combined batch, pipe loop and sentinel home study. Water Res. 2011, 45, 2763–2774. [Google Scholar] [CrossRef] [PubMed]
- Gonzalez, S.; Lopez-Roldan, R.; Cortina, J.L. Presence of metals in drinking water distribution networks due to pipe material leaching: A review. Toxicol. Environ. Chem. 2013, 95, 870–889. [Google Scholar] [CrossRef]
- Shotyk, W.; Krachler, M. Lead in bottled waters: Contamination from glass and comparison with pristine groundwater. Environ. Sci. Technol. 2007, 41, 3508–3513. [Google Scholar] [CrossRef] [PubMed]
- Shotyk, W.; Krachler, M. Contamination of bottled waters with antimony leaching from PET increases with storage. Environ. Sci. Technol. 2007, 40, 1560–1563. [Google Scholar] [CrossRef]
- Morris, R.D. Drinking water and cancer. Environ. Health Perspect. 1995, 103, 225–231. [Google Scholar] [CrossRef] [PubMed]
- Kavcar, P.; Sofuoglu, A.; Sofuoglu, S.C. A health risk assessment for exposure to trace metals via drinking water ingestion pathway. Int. J. Hyg. Environ. Health 2009, 212, 216–227. [Google Scholar] [CrossRef] [PubMed]
- Colak, E.H.; Yomralioglu, T.; Nisanci, R.; Yildirim, V.; Duran, C. Geostatistical Analysis of the Relationship Between Heavy Metals in Drinking Water and Cancer Incidence in Residential Areas in the Black Sea Region of Turkey. J. Environ. Health 2015, 77, 86–93. [Google Scholar] [PubMed]
- Zhang, J.F.; Mauzerall, D.L.; Zhu, T.; Liang, S.; Ezzati, M.; Remais, J. Environmental health in China: Progress towards clean air and safe water. Lancet 2010, 375, 1110–1119. [Google Scholar] [CrossRef]
- Yin, G.X.; Li, Z.S. Groundwater Pollution and Control—An Empirical Study in Jiaozuo City; China Environmental Science Press: Beijing, China, 2005. [Google Scholar]
- Zhao, X.; Höll, W.H.; Yun, G. Elimination of cadmium trace contaminations from drinking water. Water Res. 2002, 36, 851–858. [Google Scholar] [CrossRef]
- Huang, S.B.; Xu, P.; Lagos, G.E.; Wang, Z.J. Winter exposure assessment of copper, zinc and arsenic in drinking water of inhabitants in Beijing, China. Int. J. Environ. Pollut. 2011, 45, 197–214. [Google Scholar] [CrossRef]
- Xu, P.; Huang, S.B.; Wang, Z.J.; Lagos, G. Daily intakes of copper, zinc and arsenic in drinking water by population of Shanghai, China. Sci. Total Environ. 2006, 362, 50–55. [Google Scholar] [CrossRef] [PubMed]
- Liu, N.; Ni, T.H.; Xia, J.; Dai, M.Z.; He, C.Y.; Lu, G.F. Non-carcinogenic risks induced by metals in drinking water of Jiangsu province, China. Environ. Monit. Assess. 2011, 177, 449–456. [Google Scholar] [CrossRef] [PubMed]
- Cai, L.Y.; Wang, Z.X.; Wang, Y.Y.; Yang, Z.H.; Wang, H.Y.; Wu, X. Ingestion risks of metals in groundwater based on TIN model and dose-response assessment—A case study in the Xiangjiang watershed, central-south China. Sci. Total Environ. 2010, 408, 3118–3124. [Google Scholar]
- Virkutyte, J.; Sillanpää, M. Chemical evaluation of potable water in eastern Qinghai province, China: Human health aspects. Environ. Int. 2006, 32, 80–86. [Google Scholar] [CrossRef] [PubMed]
- Zhang, R.; Li, H.X.; Wu, X.F.; Fan, F.C.; Sun, B.Y.; Wang, Z.S.; Zhang, Q.; Tao, Y. Current situation analysis on China rural drinking water quality. J. Environ. Health 2009, 26, 3–5. (In Chinese) [Google Scholar]
- Buschmann, J.; Berg, M.; Stengel, C.; Winkel, L.; Sampson, M.L.; Trang, P.T.K.; Viet, P.H. Contamination of drinking water resources in the Mekong delta floodplains: Arsenic and other trace metals pose serious health risks to population. Environ. Int. 2008, 34, 756–764. [Google Scholar] [CrossRef] [PubMed]
- USEPA. Risk Assessment Guidance for Superfund Volume I: Human Health Evaluation Manual (Part A); USEPA: Washington, DC, USA, 1989.
- Kicińska, A.; Mamak, M. Health risks associated with municipal waste combustion on the example of Laskowa commune (southern Poland). Hum. Ecol. Risk Assess. 2017, 23, 2087–2096. [Google Scholar] [CrossRef]
- De Miguel, E.; Iribarren, I.; Chacon, E.; Ordonez, A.; Charlesworth, S. Risk-based evaluation of the exposure of children to trace elements in playgrounds in Madrid (Spain). Chemosphere 2007, 66, 505–513. [Google Scholar] [CrossRef] [PubMed]
- Integrated Risk Information System (IRIS). Available online: https://www.epa.gov/iris (accessed on 14 May 1028).
- Ministry of Health of the People’s Republic of China (MHPRC). 2006 Standards for Drinking Water Quality (GB 5749-2006); MHPRC: Beijing, China, 2006.
- World Health Organization (WHO). Guideline for Drinking Water Quality, 4th ed.; World Health Organization: Geneva, Switzerland, 2006. [Google Scholar]
- Xia, Y.J.; Liu, J. An overview on chronic arsenic via drinking water in PR China. Toxicology 2004, 198, 25–29. [Google Scholar] [CrossRef] [PubMed]
- Cidu, R.; Frau, F.; Tore, P. Drinking water quality: Comparing inorganic components in bottled water and Italian tap water. J. Food Compos. Anal. 2011, 24, 184–193. [Google Scholar] [CrossRef]
- Liao, C.M.; Shen, H.H.; Chen, C.L.; Hsu, L.I.; Lin, T.L.; Chen, S.C.; Chen, C.J. Risk assessment of arsenic-induced internal cancer at long-term low dose exposure. J. Hazard. Mater. 2009, 165, 652–663. [Google Scholar] [CrossRef] [PubMed]
- Field, M.P.; Sherrell, R.M. Direct determination of ultra-trace levels of metals in fresh water using desolvating micronebulization and HR-ICP-MS: Application to Lake Superior waters. J. Anal. At. Spectrom. 2003, 18, 254–259. [Google Scholar] [CrossRef]
- Conio, O.; Ottaviani, M.; Formentera, V.; Lasagna, C.; Palumbo, F. Evaluation of the lead content in water for human consumption. Microchem. J. 1996, 54, 355–359. [Google Scholar] [CrossRef] [PubMed]
- Harvey, P.J.; Handley, H.K.; Taylor, M.P. Identification of the sources of metal (lead) contamination in drinking waters in north-eastern Tasmania using lead isotopic compositions. Environ. Sci. Pollut. Res. 2015, 22, 12276–12288. [Google Scholar] [CrossRef] [PubMed]
- Han, Z.X.; Bi, X.Y.; Li, Z.G.; Yang, W.L.; Wang, L.X.; Yang, H.; Li, F.L.; Ma, Z.D. Occurrence, speciation and bioaccessibility of lead in Chinese rural household dust and the associated health risk to children. Atmos. Environ. 2012, 46, 65–70. [Google Scholar] [CrossRef]
- Zatta, P.; Lucchini, R.; van Rensburg, S.; Taylor, A. The role of metals in neurodegenerative processes: Aluminum, manganese, and zinc. Brain Res. Bull. 2003, 62, 15–28. [Google Scholar] [CrossRef]
- Smedley, P.L. A survey of the inorganic chemistry of bottled mineral waters from the British Isles. Appl. Geochem. 2010, 25, 1827–1888. [Google Scholar] [CrossRef] [Green Version]
- USEPA. List of Contaminants & Their MCLs. National Secondary Drinking Water Regulations; EPA 816-F-09-0004; USEPA: Washington, DC, USA, 2009.
- Gao, J.J.; Zhang, L.P.; Huang, S.B.; Ma, M.; Wang, Z.J. Preliminary health risk assessment of heavy metals in drinking waters in Beijing. Environ. Sci. 2004, 25, 47–50. (In Chinese) [Google Scholar]
- Guo, Q.J.; Duan, Z.B.; Wu, Z.X. Content and distribution of trace elements in groundwater in the suburb of Beijing City. China Acad. J. Electron. Publ. House 1991, 3, 28–31. (In Chinese) [Google Scholar]
- Lv, L.Q.; Dong, J.J.; Geng, M.Z. Rural drinking water in Penglai from 2006 to 2013 Analysis of trace element detection results. Strait J. Prev. Med. 2015, 21, 63–64. (In Chinese) [Google Scholar]
- Tong, X.X.; Zhou, A.G.; Liu, C.F.; Zhou, J.W.; Zhang, Y.P. Distribution characteristics of trace elements in groundwater in Linzhou, Anyang, Henan Province. Environ. Chem. 2012, 31, 923–924. (In Chinese) [Google Scholar]
- Yang, Y.A.N.G.; Xu, C.; Cheng, G.; Zhu, L.; Liu, W.; Zhao, Q. Preliminary health risk assessment of heavy metals in drinking waters in Baoding City. Environ. Chem. 2014, 33, 292–297. (In Chinese) [Google Scholar]
- Tian, P.Y.; Zhao, J.H.; Wei, J.R.; Chen, B.S. Exposure level of 16 metal elements in drinking water in Beijing. J. Hyg. Res. 2012, 41, 805–808. (In Chinese) [Google Scholar]
- Qu, Y.B.; Liu, L.F.; Zhang, J.P. Healthy risk assessment of trace metals in drinking water in 10 cities Guangdong province. J. Environ. Health 2012, 29, 434–436. (In Chinese) [Google Scholar]
- Haiwei, W.; Cong, L.; Tianye, W.; Yubo, W.; Fengjun, Z. Health Risk Assessment of Heavy Metal in Rural Drinking Groundwater in Shenyang, China. Chin. Agric. Sci. Bull. 2012, 28, 242–247. (In Chinese) [Google Scholar]
- Meng, X.Q.; Kong, W.W.; Xuan, Z.F. Preliminary Evaluation on Drinking Water Source Heavy Metals Pollutant Health Risks in Qingdao City. Arid Environ. Monit. 2012, 26, 14–16. (In Chinese) [Google Scholar]
- Shao, Y.L; Hui, M.Z.; Samuel, O.S.; Gui, H.L.; Jian, Q.Z.; Hong, G.N. Trace elements contamination and human health risk assessment in drinking water from Shenzhen, China. Environ Monit Assess 2015, 187, 4220. [Google Scholar]
- Muhammad, S.; Shah, M.T.; Khan, S. Health risk assessment of heavy metals and their source apportionment in drin king water of Kohistan rejoin, northern Pakistan. Microchem. J. 2011, 98, 334–343. [Google Scholar] [CrossRef]
- Wang, W.Z.; Zeng, X.L.; Xia, Y.; Zou, H.H.; Dai, X.F. Study on contents of 21 trace elements in deep Well ground water. J. Environ. Occup. Med. 2002, 20, 132–133. (In Chinese) [Google Scholar]
- Wang, J.; Liu, G.; Liu, H.; Lam, P.K. Multivariate statistical evaluation of dissolved trace elements and awater quality assessment in the middle reaches of Huaihe River, Anhui, China. Sci. Total Environ. 2017, 583, 421–431. [Google Scholar] [CrossRef] [PubMed]
- Zhang, H.; Jian, Y.G.; Wang, M.; Wang, P.; Shi, G.G.; Ding, M.J. Spatial characterization, risk assessment, and statistical source identification of the dissolved trace elements in the Ganjiang River—Feeding tributary of the Poyang Lake, China. Environ. Sci. Pollut. Res. 2017, 24, 2890–2903. [Google Scholar] [CrossRef] [PubMed]
- Guo, X.; Ji, H.; Li, C.; Gao, Y.; Ding, H.; Tang, L.; Feng, J. The source of trace element pollution of dry depositions nearby a drinking water source. Environ. Sci. Pollut. Res. 2017, 24, 3829–3842. [Google Scholar] [CrossRef] [PubMed]
- Baars, A.J.; Theelen, R.M.C.; Janssen, P.J.C.M.; Hesse, J.M.; van Apeldoorn, M.E.; Meijerink, M.C.M.; Verdam, L.; Zeilmaker, M.J. Re-Evaluation of Humantoxicological Maximum Permissible Risk Levels; RIVM: Bilthoven, The Netherlands, 2001. [Google Scholar]
- Roychowdhury, T.; Tokunaga, H.; Ando, M. Survey of arsenic and other heavy metals in food composites and drinking water estimation of dietary intake by the villagers from an arsenic-affected area of West Bengal, India. Sci. Total Environ. 2003, 308, 15–35. [Google Scholar] [CrossRef]
- Nguyen, V.A.; Bang, S.; Viet, P.H.; Kim, K.W. Contamination of groundwater and risk assessment for arsenic exposure in Ha Nam province. Vietnam. Environ. Int. 2009, 35, 466–472. [Google Scholar] [CrossRef] [PubMed]
- Saipan, P.; Ruangwises, S. Health risk assessment of inorganic arsenic intake of Ronphibun residents via duplicate diet study. J. Med. Assoc. Thail. 2009, 92, 849–855. [Google Scholar]
- Farooqi, A.; Masuda, H.; Kusakabe, M.; Naseem, M.; Firdous, N. Distribution of highly arsenic and fluoride contaminated groundwater from East Punjab, Pakistan, and the controlling role of anthropogenic pollutants in the natural hydrological cycle. Geochem. J. 2007, 41, 213–234. [Google Scholar] [CrossRef]
- Ryan, P.B.; Huet, N.; Maclntosh, D.L. Longitudinal investigation of exposure to arsenic, cadmium, and lead in drinking water. Environ. Health Perspect. 2000, 108, 731–735. [Google Scholar] [CrossRef] [PubMed]
- Ohno, K.; Ishikawa, K.; Kurosawa, Y.; Matsui, Y.; Matsushita, T.; Magara, Y. Exposure assessment of metal intakes from drinking water relative to those from total diet in Japan. Water Sci. Technol. 2010, 62, 2694–2701. [Google Scholar] [CrossRef] [PubMed]
Figure 1.
Sampling location map and distribution of As, Pb and Zn in drinking water. Notes: Using a bar graph expressing arsenic, lead and zinc concentrations in eight provinces. The concentration of zinc in the eight provinces correspond to the right coordinate axis, while others correspond to the left coordinate axis. Except for the highest concentration of arsenic in Qinghai Province, the other seven provinces had the highest concentration of zinc.

Figure 2.
Collation maps of raw and boiled water in eight provinces.

Figure 3.
Boxplot of trace metals in drinking water in rural areas of China.


Table 1.
Summary statistics of trace metal concentrations in raw waters and boiled waters from Chinese rural areas.
Table 1.
Summary statistics of trace metal concentrations in raw waters and boiled waters from Chinese rural areas.
| Metal | Raw Drinking Water (n = 59) | Boiled Water (n = 163) | Guidelines | |||||||||
|---|---|---|---|---|---|---|---|---|---|---|---|---|
| >DL | Min | Median | 90th Percentile | Max | >DL | Min | Median | 90th Percentile | Max | China | World Health Organization (WHO) | |
| Ag | 40 | <0.0004 | 0.004 | 0.014 | 0.018 | 109 | <0.0004 | 0.002 | 0.008 | 0.062 | ||
| As | 59 | 0.025 | 0.208 | 4.25 | 99.6 | 161 | <0.01 | 0.329 | 1.79 | 5.92 | 10 | 10 |
| Ba | 59 | 15.3 | 70.5 | 140 | 384 | 163 | 16.4 | 65.8 | 170 | 309 | 1000 | |
| Be | 29 | <0.002 | <0.002 | 0.168 | 0.700 | 49 | <0.002 | <0.002 | 0.070 | 0.767 | ||
| Cd | 56 | <0.001 | 0.023 | 0.132 | 2.17 | 145 | <0.001 | 0.018 | 0.098 | 1.42 | 5 | 3 |
| Co | 58 | <0.002 | 0.133 | 0.729 | 3.08 | 162 | <0.002 | 0.133 | 0.597 | 2.25 | ||
| Cr | 45 | <0.02 | 0.475 | 3.43 | 4.14 | 122 | <0.02 | 0.563 | 3.16 | 14.4 | 50 | 50 |
| Cu | 30 | <0.02 | 0.033 | 4.42 | 18.1 | 91 | <0.02 | 0.347 | 5.18 | 29.7 | 1000 | 2000 |
| Mo | 58 | <0.003 | 0.330 | 2.66 | 10.0 | 163 | 0.004 | 0.358 | 1.899 | 5.304 | 70 | 70 |
| Ni | 55 | <0.01 | 2.25 | 6.79 | 15.2 | 153 | <0.01 | 2.04 | 6.51 | 19.6 | 20 | 70 |
| Pb | 28 | <0.004 | <0.004 | 3.93 | 15.5 | 79 | <0.004 | <0.004 | 3.28 | 23.6 | 10 | 10 |
| Sb | 52 | <0.001 | 0.053 | 0.296 | 0.653 | 162 | <0.001 | 0.060 | 0.358 | 1.90 | 5 | 20 |
| Sn | 10 | <0.001 | <0.001 | 0.282 | 1.41 | 29 | <0.001 | <0.001 | 0.081 | 1.85 | ||
| Sr | 59 | 5.57 | 210 | 883 | 1220 | 163 | 1.19 | 274 | 801 | 1130 | ||
| Tl | 56 | <0.001 | 0.009 | 0.059 | 0.141 | 153 | <0.001 | 0.006 | 0.045 | 0.102 | 0.1 | |
| U | 59 | 0.002 | 0.274 | 3.25 | 5.41 | 163 | <0.002 | 0.318 | 2.01 | 5.87 | 15 | |
| V | 55 | <0.01 | 0.727 | 5.96 | 78.7 | 158 | <0.01 | 1.01 | 3.84 | 55.1 | ||
| Zn | 57 | <0.05 | 10.7 | 197 | 2260 | 149 | <0.05 | 8.45 | 67.3 | 1270 | 1000 | |
All values are in μg/L; >DL: number higher detection limit.
Table 2.
Comparison of measured data and other trace metals in urban drinking water before 2011.
| Locale | Ba | Cd | Co | Cr | Cu | Mo | Ni | Pb | Sb | Zn | Time a | Reference |
|---|---|---|---|---|---|---|---|---|---|---|---|---|
| Rural area | 2.882 | 0.002 | 0.0101 | 0.0437 | 0.0708 | 0.028 | 0.1007 | 0.0434 | 0.0045 | 1.966 | 2010 | This study |
| Beijing | 128 | ----- | 0.0144 | 3 | 1.35 | 1.13 | ----- | ----- | 0.0755 | 6.2 | 1991 | Guo et al. [55] |
| Penglai | ----- | 0.0003 | ----- | 0.008 | 0.02 | ----- | ----- | 0.01 | ----- | 0.7 | 2006 | Lv et al. [56] |
| Henan | ----- | ----- | 0.4715 | 8.1035 | 2.2895 | ----- | 2.6005 | 0.526 | ----- | 1.8337 | 2010 | Tong et al. [57] |
All values are in μg/L. “-----” symbol indicates that this element in the literature was not reported. a the time of samples collected.
Table 3.
Comparison of measured data and other trace metals in urban drinking water (μg/L).
| Locale | As | Ba | Cd | Cu | Ni | Pd | Sb | V | Zn | Time a | Reference |
|---|---|---|---|---|---|---|---|---|---|---|---|
| Rural area | 0.0457 | 2.882 | 0.002 | 0.0708 | 0.1007 | 0.0434 | 0.0045 | 0.0771 | 1.966 | 2010 | This study |
| Baoding | 0.636 | ----- | 0.292 | 4.318 | ----- | 0.824 | ----- | ----- | 246.42 | 2012 | Yang et al. [58] |
| Beijing | ----- | 0.159 | ----- | 0.007 | 0.00065 | 0.00095 | ----- | ----- | 0.253 | 2010 | Tian et al. [59] |
| Guangdong | 2.45 | ----- | 0.5 | 25 | ----- | 2.5 | ----- | ----- | 5 | 2011 | Qu et al. [60] |
| Shenyang | 0.885 | ----- | 0.1118 | 3.1272 | ----- | 8.8607 | ----- | ----- | ----- | 2011 | Wen et al. [61] |
| Qingdao | 0.0014 | 0.162 | ----- | 0.00377 | 0.0193 | ----- | ----- | ----- | ----- | 2011 | Meng et al. [62] |
| Foshan | 1.67 × 10⁻³ | ----- | 5.71 × 10⁻⁵ | 0.0106 | 2.34 × 10⁻³ | ----- | 2.52 × 10⁻³ | ----- | 0.025 | 2012 | Shao et al. [63] |
a the time of samples collected.
Table 4.
Comparison of measured data and other trace metals in groundwater (μg/L).
| Locale | As | Cd | Co | Cr | Cu | Mo | Ni | Pb | Zn | Reference |
|---|---|---|---|---|---|---|---|---|---|---|
| Rural area | 0.0457 | 0.002 | 0.0101 | 0.0437 | 0.0708 | 0.028 | 0.1007 | 0.0434 | 1.966 | This study |
| Huaihe | ----- | 61.74 | 42.49 | 23.08 | 52.32 | ----- | 46.17 | 154.96 | 10,504.1 | Wang et al. [66] |
| Ganjiang | 1.32 | 0.111 | 0.085 | 0.9 | 2.7 | ----- | 2.62 | 1.15 | 8.81 | Zhang et al. [67] |
| Miyun | 12.97 | 2.76 | 8.65 | 57.73 | 2.7 | 2.53 | 33.77 | 150.87 | 656.78 | Guo et al. [68] |
| Pakistan | ---- | 0.66 | 0.39 | 7.83 | 51.85 | ---- | 4.12 | 9.64 | 951.46 | Muhammad et al. [64] |
| Siberia | 0.65 | ---- | 1.03 | 1.9 | 2.2 | 1 | ---- | ---- | 14.3 | Wang et al. [65] |
| Aotao | ---- | 2.37 | 4.42 | 10.43 | 2.14 | 3.57 | 5.29 | 3.1 | 13.69 | Wang et al. [65] |
Table 5.
Descriptive statistics of exposure assessment.
| Metal | Mean a | S.D. | Min | Median | 90th Percentile | Max | BDI b |
|---|---|---|---|---|---|---|---|
| Ag | 0.0001 | 0.0002 | 6.77 × 10⁻⁶ | 9.78 × 10⁻⁵ | 0.0003 | 0.0021 | |
| As | 0.0457 | 0.2415 | 1.69 × 10⁻⁴ | 9.84 × 10⁻³ | 0.0809 | 3.373 | 0.3 |
| Ba | 2.882 | 2.109 | 5.18 × 10⁻¹ | 2.23 × 100 | 5.635 | 13.00 | 9 |
| Be | 0.0012 | 0.0030 | 3.38 × 10⁻⁵ | 3.38 × 10⁻⁵ | 0.0035 | 0.0260 | |
| Cd | 0.0020 | 0.0065 | 1.69 × 10⁻⁵ | 6.38 × 10⁻⁴ | 0.0037 | 0.0734 | 0.22 c, 0.17 d |
| Co | 0.0101 | 0.0168 | 3.38 × 10⁻⁵ | 4.50 × 10⁻³ | 0.0225 | 0.1042 | 0.3 |
| Cr | 0.0437 | 0.0799 | 3.38 × 10⁻⁴ | 1.80 × 10⁻² | 0.1107 | 0.4874 | 1 |
| Cu | 0.0708 | 0.1476 | 3.38 × 10⁻⁴ | 6.72 × 10⁻³ | 0.1671 | 1.005 | 30 |
| Mo | 0.0280 | 0.0419 | 5.08 × 10⁻⁵ | 1.12 × 10⁻² | 0.0654 | 0.3391 | 4 |
| Ni | 0.1007 | 0.1017 | 1.69 × 10⁻⁴ | 7.16 × 10⁻² | 0.2247 | 0.6634 | 4 |
| Pb | 0.0434 | 0.1049 | 6.77 × 10⁻⁵ | 6.77 × 10⁻⁵ | 0.1147 | 0.7988 | 0.6 e, 2 f |
| Sb | 0.0045 | 0.0070 | 1.67 × 10⁻⁵ | 1.97 × 10⁻³ | 0.0115 | 0.0644 | |
| Sn | 0.0027 | 0.0101 | 1.69 × 10⁻⁵ | 1.69 × 10⁻⁵ | 0.0028 | 0.0627 | |
| Sr | 11.85 | 9.741 | 4.03 × 10⁻² | 8.95 × 100 | 27.31 | 41.29 | |
| Tl | 0.0005 | 0.0008 | 1.69 × 10⁻⁵ | 2.13 × 10⁻⁴ | 0.0017 | 0.0048 | |
| U | 0.0272 | 0.0393 | 3.04 × 10⁻⁵ | 1.00 × 10⁻² | 0.0769 | 0.1987 | |
| V | 0.0771 | 0.2258 | 1.69 × 10⁻⁴ | 2.90 × 10⁻² | 0.1479 | 2.664 | |
| Zn | 1.966 | 7.019 | 1.02 × 10⁻³ | 3.02 × 10⁻¹ | 3.513 | 76.49 | 300 |
All values are in μg/kg/d. Standard Deviation, S.D. a One-half of the detection limit used for samples with concentrations less than limit of detection. b Background daily intake values (BDI, Baars et al. [69]). c Male. d Female. e Adult. f Children.
Table 6.
Descriptive statistics of carcinogenic risk assessment for arsenic.
| Metal | Mean | S.D. | Min | Median | 90th Percentile | Max | Cancer Risk Probability | ||
|---|---|---|---|---|---|---|---|---|---|
| >1 in 103 | >1 in 104 | >1 in 106 | |||||||
| As | 6.65 × 10⁻⁵ | 3.52 × 10⁻⁴ | 2.24 × 10⁻⁷ | 1.28 × 10⁻⁵ | 1.11 × 10⁻⁴ | 5.06 × 10⁻³ | 1.35 | 11.26 | 98.65 |
Table 7.
Descriptive statistics of non-carcinogenic risk assessment.
| Metal | Mean | S.D. | Min | Median | 90th Percentile | Max |
|---|---|---|---|---|---|---|
| Ag | 2.85 × 10⁻⁵ | 4.24 × 10⁻⁵ | 1.35 × 10⁻⁶ | 1.96 × 10⁻⁵ | 6.59 × 10⁻⁵ | 0.0004 |
| As | 1.52 × 10⁻¹ | 8.03 × 10⁻¹ | 5.64 × 10⁻⁴ | 3.28 × 10⁻² | 2.69 × 10⁻¹ | 11.24 |
| Ba | 1.44 × 10⁻² | 1.05 × 10⁻² | 2.59 × 10⁻³ | 1.11 × 10⁻² | 2.82 × 10⁻² | 0.0650 |
| Be | 5.85 × 10⁻⁶ | 1.49 × 10⁻⁵ | 1.69 × 10⁻⁷ | 1.69 × 10⁻⁷ | 1.74 × 10⁻⁵ | 0.0001 |
| Cd | 4.05 × 10⁻³ | 1.30 × 10⁻² | 3.38 × 10⁻⁵ | 1.28 × 10⁻³ | 7.43 × 10⁻³ | 0.1469 |
| Cr | 2.91 × 10⁻⁵ | 5.32 × 10⁻⁵ | 2.26 × 10⁻⁷ | 1.20 × 10⁻⁵ | 7.38 × 10⁻⁵ | 0.0003 |
| Mo | 5.60 × 10⁻³ | 8.38 × 10⁻³ | 1.02 × 10⁻⁵ | 2.25 × 10⁻³ | 1.31 × 10⁻² | 0.0678 |
| Ni | 5.03 × 10⁻³ | 5.09 × 10⁻³ | 8.46 × 10⁻⁶ | 3.58 × 10⁻³ | 1.12 × 10⁻² | 0.0332 |
| Sb | 1.14 × 10⁻² | 1.75 × 10⁻² | 4.17 × 10⁻⁵ | 4.93 × 10⁻³ | 2.89 × 10⁻² | 0.1609 |
| Sr | 1.97 × 10⁻² | 1.62 × 10⁻² | 6.71 × 10⁻⁵ | 1.49 × 10⁻² | 4.55 × 10⁻² | 0.0688 |
| U | 9.05 × 10⁻³ | 1.31 × 10⁻² | 1.01 × 10⁻⁵ | 3.35 × 10⁻³ | 2.56 × 10⁻² | 0.0662 |
| Zn | 6.55 × 10⁻³ | 2.34 × 10⁻² | 3.38 × 10⁻⁶ | 1.01 × 10⁻³ | 1.17 × 10⁻² | 0.2550 |
© 2018 by the authors. Licensee MDPI, Basel, Switzerland. This article is an open access article distributed under the terms and conditions of the Creative Commons Attribution (CC BY) license (http://creativecommons.org/licenses/by/4.0/).
Share and Cite
MDPI and ACS Style
Wu, J.; Man, Y.; Sun, G.; Shang, L. Occurrence and Health-Risk Assessment of Trace Metals in Raw and Boiled Drinking Water from Rural Areas of China. Water 2018, 10, 641. https://doi.org/10.3390/w10050641
AMA Style
Wu J, Man Y, Sun G, Shang L. Occurrence and Health-Risk Assessment of Trace Metals in Raw and Boiled Drinking Water from Rural Areas of China. Water. 2018; 10(5):641. https://doi.org/10.3390/w10050641
Chicago/Turabian StyleWu, Junhua, Yi Man, Guangyi Sun, and Lihai Shang. 2018. "Occurrence and Health-Risk Assessment of Trace Metals in Raw and Boiled Drinking Water from Rural Areas of China" Water 10, no. 5: 641. https://doi.org/10.3390/w10050641
Note that from the first issue of 2016, this journal uses article numbers instead of page numbers. See further details here.