The Water–Energy–Food Nexus: A Fuzzy-Cognitive Mapping Approach to Support Nexus-Compliant Policies in Andalusia (Spain)


Department of Agricultural Economics, Universidad Politécnica de Madrid, ETSIAAB, Avda. Puerta Hierro 2, 28040 Madrid, Spain
*
Author to whom correspondence should be addressed.
Water 2018, 10(5), 664; https://doi.org/10.3390/w10050664
Submission received: 6 April 2018
/
Revised: 1 May 2018
/
Accepted: 15 May 2018
/
Published: 19 May 2018
(This article belongs to the Special Issue Innovation Issues in Water, Agriculture and Food)
Abstract
:Water, energy and food are essential resources for economic development and social well-being. Framing integrated policies that improve their efficient use requires understanding the interdependencies in the water–energy–food (WEF) nexus. Stakeholder involvement in this process is crucial to represent multiple perspectives, ensure political legitimacy and promote dialogue. In this research, we develop and apply a participatory modelling approach to identify the main interlinkages within the WEF nexus in Andalusia, as a starting point to developing a system dynamic model at a later stage. The application of fuzzy cognitive mapping enabled us to gain knowledge on the WEF nexus according to opinions from 14 decision-makers, as well as contributing to raising awareness and building consensus among stakeholders. Results show that climate change and water availability are key drivers in the WEF nexus in Andalusia. Other variables with significant interlinkages within the WEF nexus are food production, irrigated agriculture, energy cost, socio-economic factors, irrigation water use, environmental conservation, and farm performance indicators. The scenario analysis reveals the interdependencies among nexus sectors and the existence of unanticipated effects when changing variables in the system, which need to be considered to design integrated policies.
1. Introduction
Sustainable resource management requires a nexus approach in decision-making that considers trade-offs and synergies across sectors. Water availability and use influence the food and energy sectors and, simultaneously, are influenced by them. Hence, these cross-sectoral connections need to be considered to promote efficiency in the use of resources [1]. The international community increasingly perceives the water–energy–food nexus (WEF) as an overarching concept to address these complex and interconnected resource management challenges [1,2,3]. This WEF nexus is particularly relevant because expected socio-economic development and climate change will increase pressure on resources and drive conflicts between the different sectors over the coming decades [2,4]. Nevertheless, some studies show the existence of policy incoherence in the WEF nexus throughout the world [5]. Understanding the interlinkages in the WEF nexus is crucial for framing integrated policies that improve the natural environment, upon which economic development and social well-being depend. To that end, increasing attention is devoted to developing conceptual and methodological frameworks to describe the interlinkages in the nexus as well as to guide decision-makers in applying the WEF nexus approach. Over recent years, many global studies can be cited [1,2,6]. In addition, since targeted action is required to address local challenges, examples also exist of specific applications of WEF nexus assessments at the river basin level [7,8,9]. These frameworks offer valuable insights into the nexus interconnections that can help to identify conflicts and explore solutions.
Stakeholder engagement is crucial to obtaining relevant bottom-up information, representing multiple perspectives and overcoming governance obstacles. A multi-stakeholder approach is used in the ongoing EU Horizon 2020 project SIM4NEXUS (sustainable integrated management for the nexus of water–land–food–energy–climate for a resource-efficient Europe), which aims to bridge the knowledge gap and develop innovative tools to support policy decision-making in the nexus under climate change conditions. Building on stakeholder knowledge and complexity science modelling, SIM4NEXUS develops system dynamic models (SDM) and serious games for 12 different case studies (from global to regional scales) in order to evaluate nexus-compliant policies [10].
This article focusses on stakeholder engagement for the case study of Andalusia (Spain) within the SIM4NEXUS project. Policy incoherence across sectors in this region has resulted in increasing conflicts among WEF nexus sectors that have negatively affected resource sustainability [11,12,13]. Major pressures on water due to farming intensification and urbanization, over-allocation of water resources and inadequate consideration of the linkages between water saving technologies and energy use have led to environmental degradation [14,15].
Most previous studies with reference to the nexus in Andalusia partially examine the WEF nexus considering two-sector interrelationships; in particular, water and energy or water and agriculture [16,17]. Nevertheless, full comprehension of the interdependencies in the WEF nexus in the region is crucial to avoid unexpected effects and to design effective nexus-compliant strategies. This can only be achieved with the involvement of decision-makers in the process, to ensure integration of multiple perspectives, political legitimacy, as well as consensus building [18].
Participatory modelling with stakeholders has been increasingly applied over the last years to share knowledge and improve understanding of a system. Voinov and Bousquet [19] review the state of the art on stakeholder engagement and discuss the main methodologies applied to engage stakeholders in resource and environmental modelling, among them Bayesian networks (BN) [20], Agent-based models (ABM) [21] and fuzzy cognitive mapping (FCM) [22]. In a recent paper, Voinov et al. [23] review the progress made in applying participatory modelling in environmental decision-making and stress the need to develop comprehensive guidelines to select the best-suited methodology—among the wide range of existing tools and techniques—depending on the modelling objectives as well as the participants involved. In this regard, several frameworks have been proposed to support the process and to achieve the successful participation of stakeholders in conceptual modelling by, among others, Argent et al. [24], Basco-Carrera et al. [25], Gray et al. [26] and Halbe et al. [27].
Among the participatory modelling methodologies, in this study we select FCM because it focusses on knowledge share and stakeholder involvement [28] and allows for interactions and feedbacks between variables (while other methodologies such as BN are based on unidirectional connections). FCM has proven to be very useful in a variety of domains, as emphasized by Papageorgiou and Salmeron [29] in a review of recent applications of this approach. In the environmental field, FCMs have been used to support watershed ecosystems management [30,31,32,33,34], landscape modelling [35,36], forest management [37], farming systems analysis [38], fisheries management [39], bioethanol production from biowaste [40], and intrusion of mining into landscape [41]. FCMs have been also applied to assess climate change impacts and effects of adaptation measures [42,43]. Nevertheless, examples of the implementation of FCMs to the WEF nexus are scarce [44].
Therefore, in this research, we apply FCM to identify the main interconnections within the WEF nexus in Andalusia according to stakeholders’ perceptions. Likewise, our work seeks to raise awareness and build consensus for the WEF nexus among the different stakeholders. In addition, the outcome of this study enables the validation of a conceptual model on the WEF nexus in Andalusia, which is a crucial step to developing an SDM at a later stage.
The article is structured as follows: Section 2 presents a brief description of the FCM methodology, the case study region, stakeholders’ participation, the data collection and analysis process; Section 3 summarizes the main results obtained from the analysis of the maps and the simulation of scenarios; Section 4 presents the discussion of results; Section 5 includes the main conclusions of the research.
2. Materials and Methods
2.1. Fuzzy Cognitive Maps
Fuzzy cognitive maps (FCMs) represent the behaviour of complex systems based on people’s perceptions. FCMs are based on cognitive maps that are graphical representations of causal relationships among variables in a system. These variables can be quantifiable (e.g., temperatures) or not (e.g., water policy). The direction of the causal relationship is represented with signed arrowheads. A positive sign represents a direct causal relationship (a rise in variable A will increase variable B), while a negative sign shows an inverse relationship (a rise in variable A will reduce variable B). Axelrod [45] was the first to use binary cognitive maps to elicit people’s perceptions of a system. As causality is uncertain, Kosko [22] extended the binary causal relationships (0 or 1) by introducing fuzziness in cognitive maps, allowing for in-between states [−1 to 1]. Each interrelation between two variables vi and vj is assigned a weight wij that takes a value between −1 and 1: wij > 0 indicates a positive causal relationship, meaning that an increase (decrease) in the value of vi leads to an increase (decrease) in the value of vj (the higher the weight the stronger the causal relationship); wij < 0 determines a negative causal relationship, where an increase (decrease) in the value of vi drives to a decrease (increase) on the value of vj; wij = 0 depicts no causality between vi and vj [46].
FCM builds on stakeholder understanding and experience of the system. The knowledge elicitation process to develop the FCMs can be performed from questionnaires, by literature review, from data or from interviews where participants individually or in groups develop a map [47]. The number of stakeholders engaged in the process varies widely among FCM works from, for example, seven considered by Solana-Gutierrez et al. [33] to 188 stakeholders considered by Reckien [42].
FCMs are represented in the matrix form E = [wij], where variable vi is placed on the vertical axis and variable vj on the horizontal axis. The causal relationship between two variables (wij) is indicated in the matrix (range from −1 to 1 as mentioned before). Aggregation of individual maps to create the group or social map enables the combination of multiple knowledge sources and helps in understanding complex systems [47,48]. To that end, variables from individual maps are subjectively grouped into broader concepts. Based on these concepts, individual matrices are augmented and condensed through matrix aggregation to create the group matrix [47].
The structure of FCMs can be analysed through matrix indices from graph theory [49]:
- Density (D) provides information on the connectivity of the maps. This index is estimated as the relationship between the number of connections and the maximum number of possible connections between the map’s variables:where D is the density of the map, C is the total number of connections and N is the number of variables.
- Outdegree (od) represents the total strength of connections outflowing from the variable. The index is calculated as the horizontal summation of a variable’s absolute values:where is the outdegree of variable vi and represents the weight in rows.
- Indegree (id) computes the total strength of connections inflowing to the variable. The index is estimated as the vertical summation of a variable’s absolute values:where is the indegree of variable vi and represents the weight in columns.
- Centrality (c) of a variable shows the cumulative strength of connections of this variable to other variables. The index is calculated as the sum of the variable’s indegree and outdegree:where is the centrality of the variable vi, is the total degree of the variable vi, is the outdegree of variable vi and is the indegree of variable vi.
The variables within a map can be classified into different types according to their outdegree and indegree: Transmitter variables (positive outdegree and zero indegree) are considered drivers of the system, receiver variables (zero outdegree and positive indegree) are dependent variables and ordinary variables (both zero outdegree and indegree) are means. The relationship between the number of receiver and transmitter variables (R/T) is an index of complexity of the system. A high number of receiver variables means that many results can emerge from the system. In contrast, many transmitter variables reflect numerous forcing functions, suggesting that causal relationships are poorly developed [46,47].
The system’s behaviour can be analysed through scenario simulation [46] following a two-step process: First, the initial value for each of the vector’s elements, also called activation level, is multiplied with the adjacency matrix to create a new vector. The activation level takes a value ranging between 0 and 1: 0 implies that the variable does not exist in the system in a specific iteration, while 1 means that the variable is present to its full extent. In-between values depict intermediate activation levels. After assigning the activation level (equals 1 for all the variables), the converted vector is iteratively multiplied by the adjacency matrix. The state value of each variable vi in a subsequent iteration is determined by its value in the previous iteration and the value of all the interconnected variables [46].
where is the value of the variable vi at the simulation step k + 1, is the value of variable vi at step k, is the value of variable vj at step k, is the weight of the interrelation between variable vj and variable vi and is the activation function.
To keep results within the interval [0, 1], a logistic function is used:
where x is the value of in the equilibrium point.
After a number of iterations, the system can achieve steady state equilibrium (the state value of each variable vi converges over a number of iterations), move towards a limit cycle (only some values are repeated) or show a chaotic pattern (different values in each iteration) [22].
Second, simulation scenarios are run following the same procedure but, in this case, the activation levels of the variables defining the scenario remain the same during the iterations [22]. Results from simulation scenarios are presented as a relative change to the steady state. Alternative simulation scenarios allow for exploring the behaviour of the system and understanding its complex interrelations.
2.2. Study Region
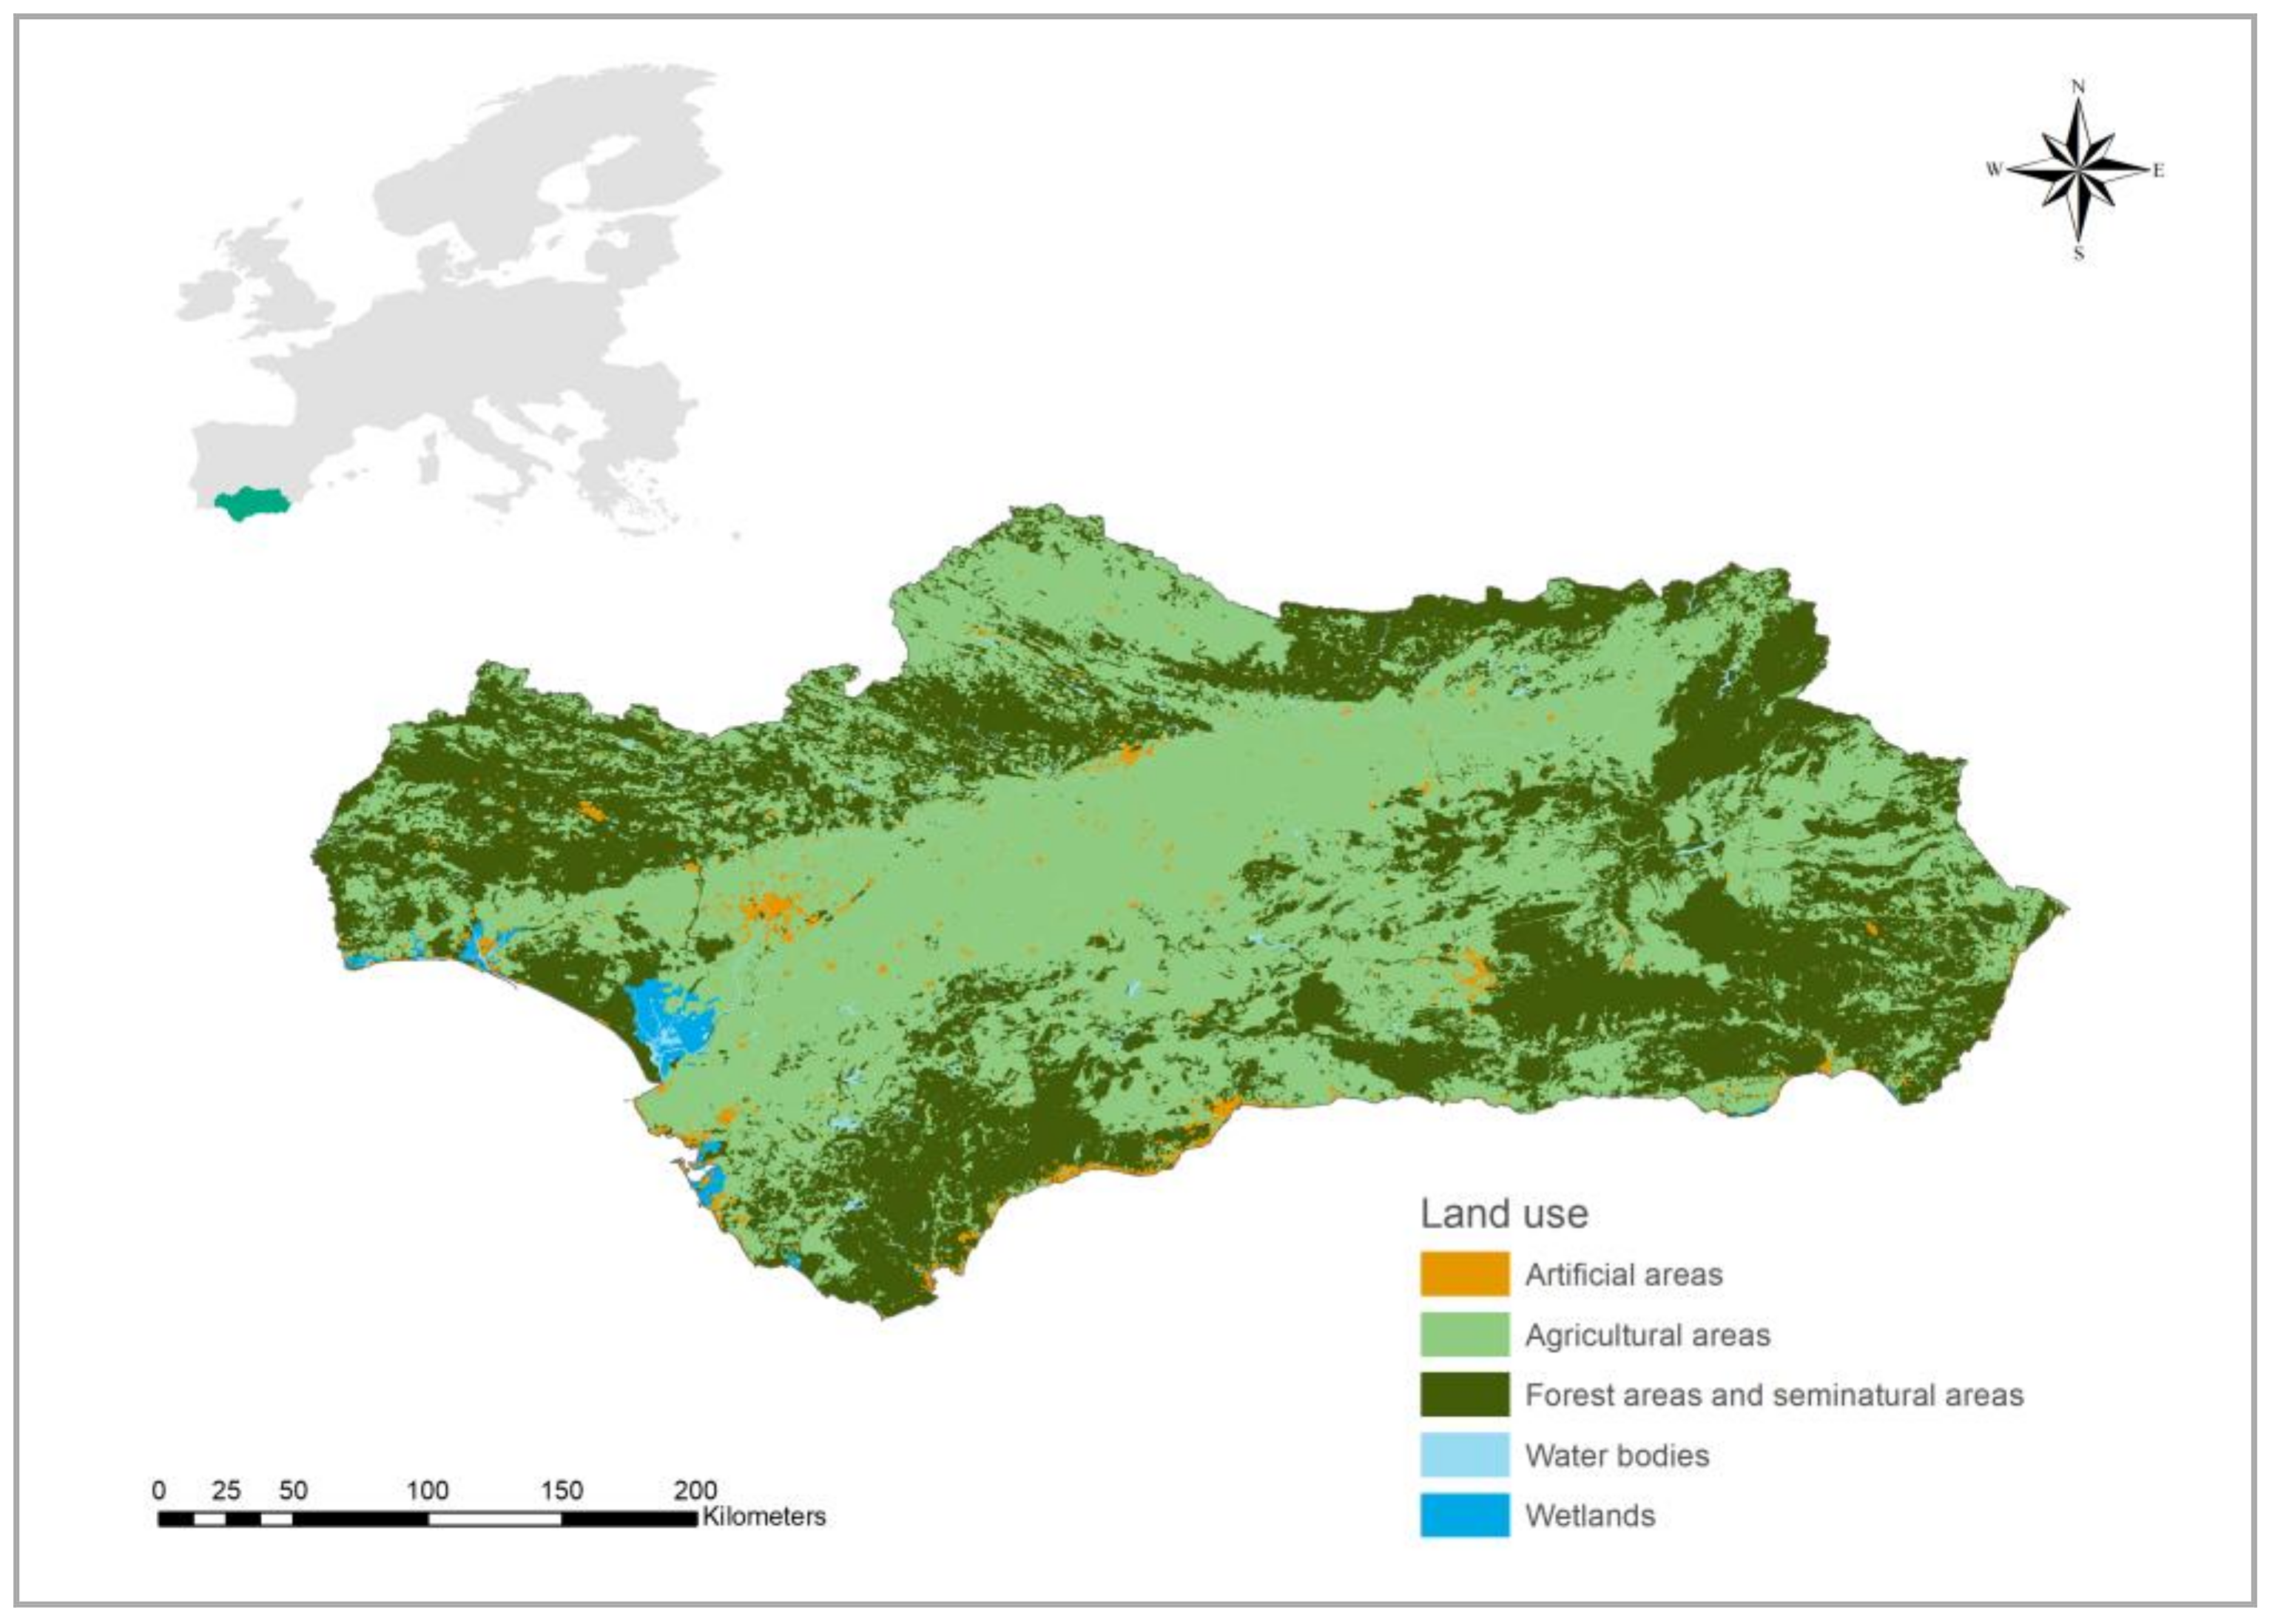
Andalusia is a region located in the south of Spain (Figure 1). It is the most populous Spanish region with 8.4 million inhabitants (18.0% of the national population) and the second largest region with 87,600 km2 (17.3% of the total national area). The strong agricultural sector (5.1% of GDP in 2016) has turned the region into one of the major fruit and vegetable suppliers to the European market. The industrial sector is mainly based on agricultural and consumer goods (17.0% of GDP in 2016) and the services sector, which dominates the regional economy (76.9% of GDP in 2016), depending heavily on tourism [50].
Andalusia has approximately 4.4 million ha of utilised agricultural area (UAA), accounting for roughly 18.7% of the national total. Of the total UAA, one million ha are irrigated; i.e., 29.3% of the total irrigated land in Spain [51]. Irrigation is mainly used for olives, cereals, industrial crops, fruits and vegetables. This area is concentrated in the Guadalquivir river basin, which amounts to approximately 86% of the total irrigated land in Andalusia. The regional agricultural potential heavily relies on irrigated agriculture, which accounts for more than 80% of total water withdrawals, generates more than 64% of production in Andalusia, represents 67% of farm income and is responsible for 63% of agricultural employment [52].
The variability of available water owing to differences in precipitation, along with high demand, has created a delicate water balance in the different river basins in Andalusia. Over recent years, both the National and the Regional Administrations have developed different actions to save water in the agricultural sector [53,54]. Implementation of different irrigation plans have resulted in short-term water savings but might lead to an increase in water demand in the medium term. This is due to the increased interest in high value crops due to higher water supply guarantees and better quality of irrigation systems, but also due to decoupled payments of the Common Agricultural Policy (CAP) that encourage agricultural production adaptation to market [11,55].
Beyond the impact on water and food production, the irrigation plans led to an increase in energy consumption in the agricultural sector because of the replacement of open channels and surface irrigation systems with pressurised systems. The higher energy needs and system maintenance costs combined with the energy market liberalisation in 2008 drove up irrigation costs [56,57]. Thus, energy has become the key irrigation driver; when energy requirements are high, farmers tend to apply deficit irrigation even having water available [58].
2.3. Stakeholders’ Participation
Stakeholders from the water, food and energy sectors in Andalusia were identified through an online investigation and snowball sampling [59]. The selection criteria were to gather experts from the different nexus sectors both at the public and private levels. Therefore, 14 representatives from the regional administration, professional organisations, NGOs and research centres and universities were selected and contacted. The number of stakeholders engaged brought together a broad range of perspectives needed to interpret the interlinkages in the nexus.
As a preliminary step, we conducted phone or face-to-face semi-structured interviews with the selected stakeholders. Seven guiding questions served to get a preliminary understanding of stakeholders’ views on major nexus challenges in Andalusia. The guiding questions were sent via email to the stakeholders before the interview. The semi-structured interviews lasted for approximately 45 min to one hour.
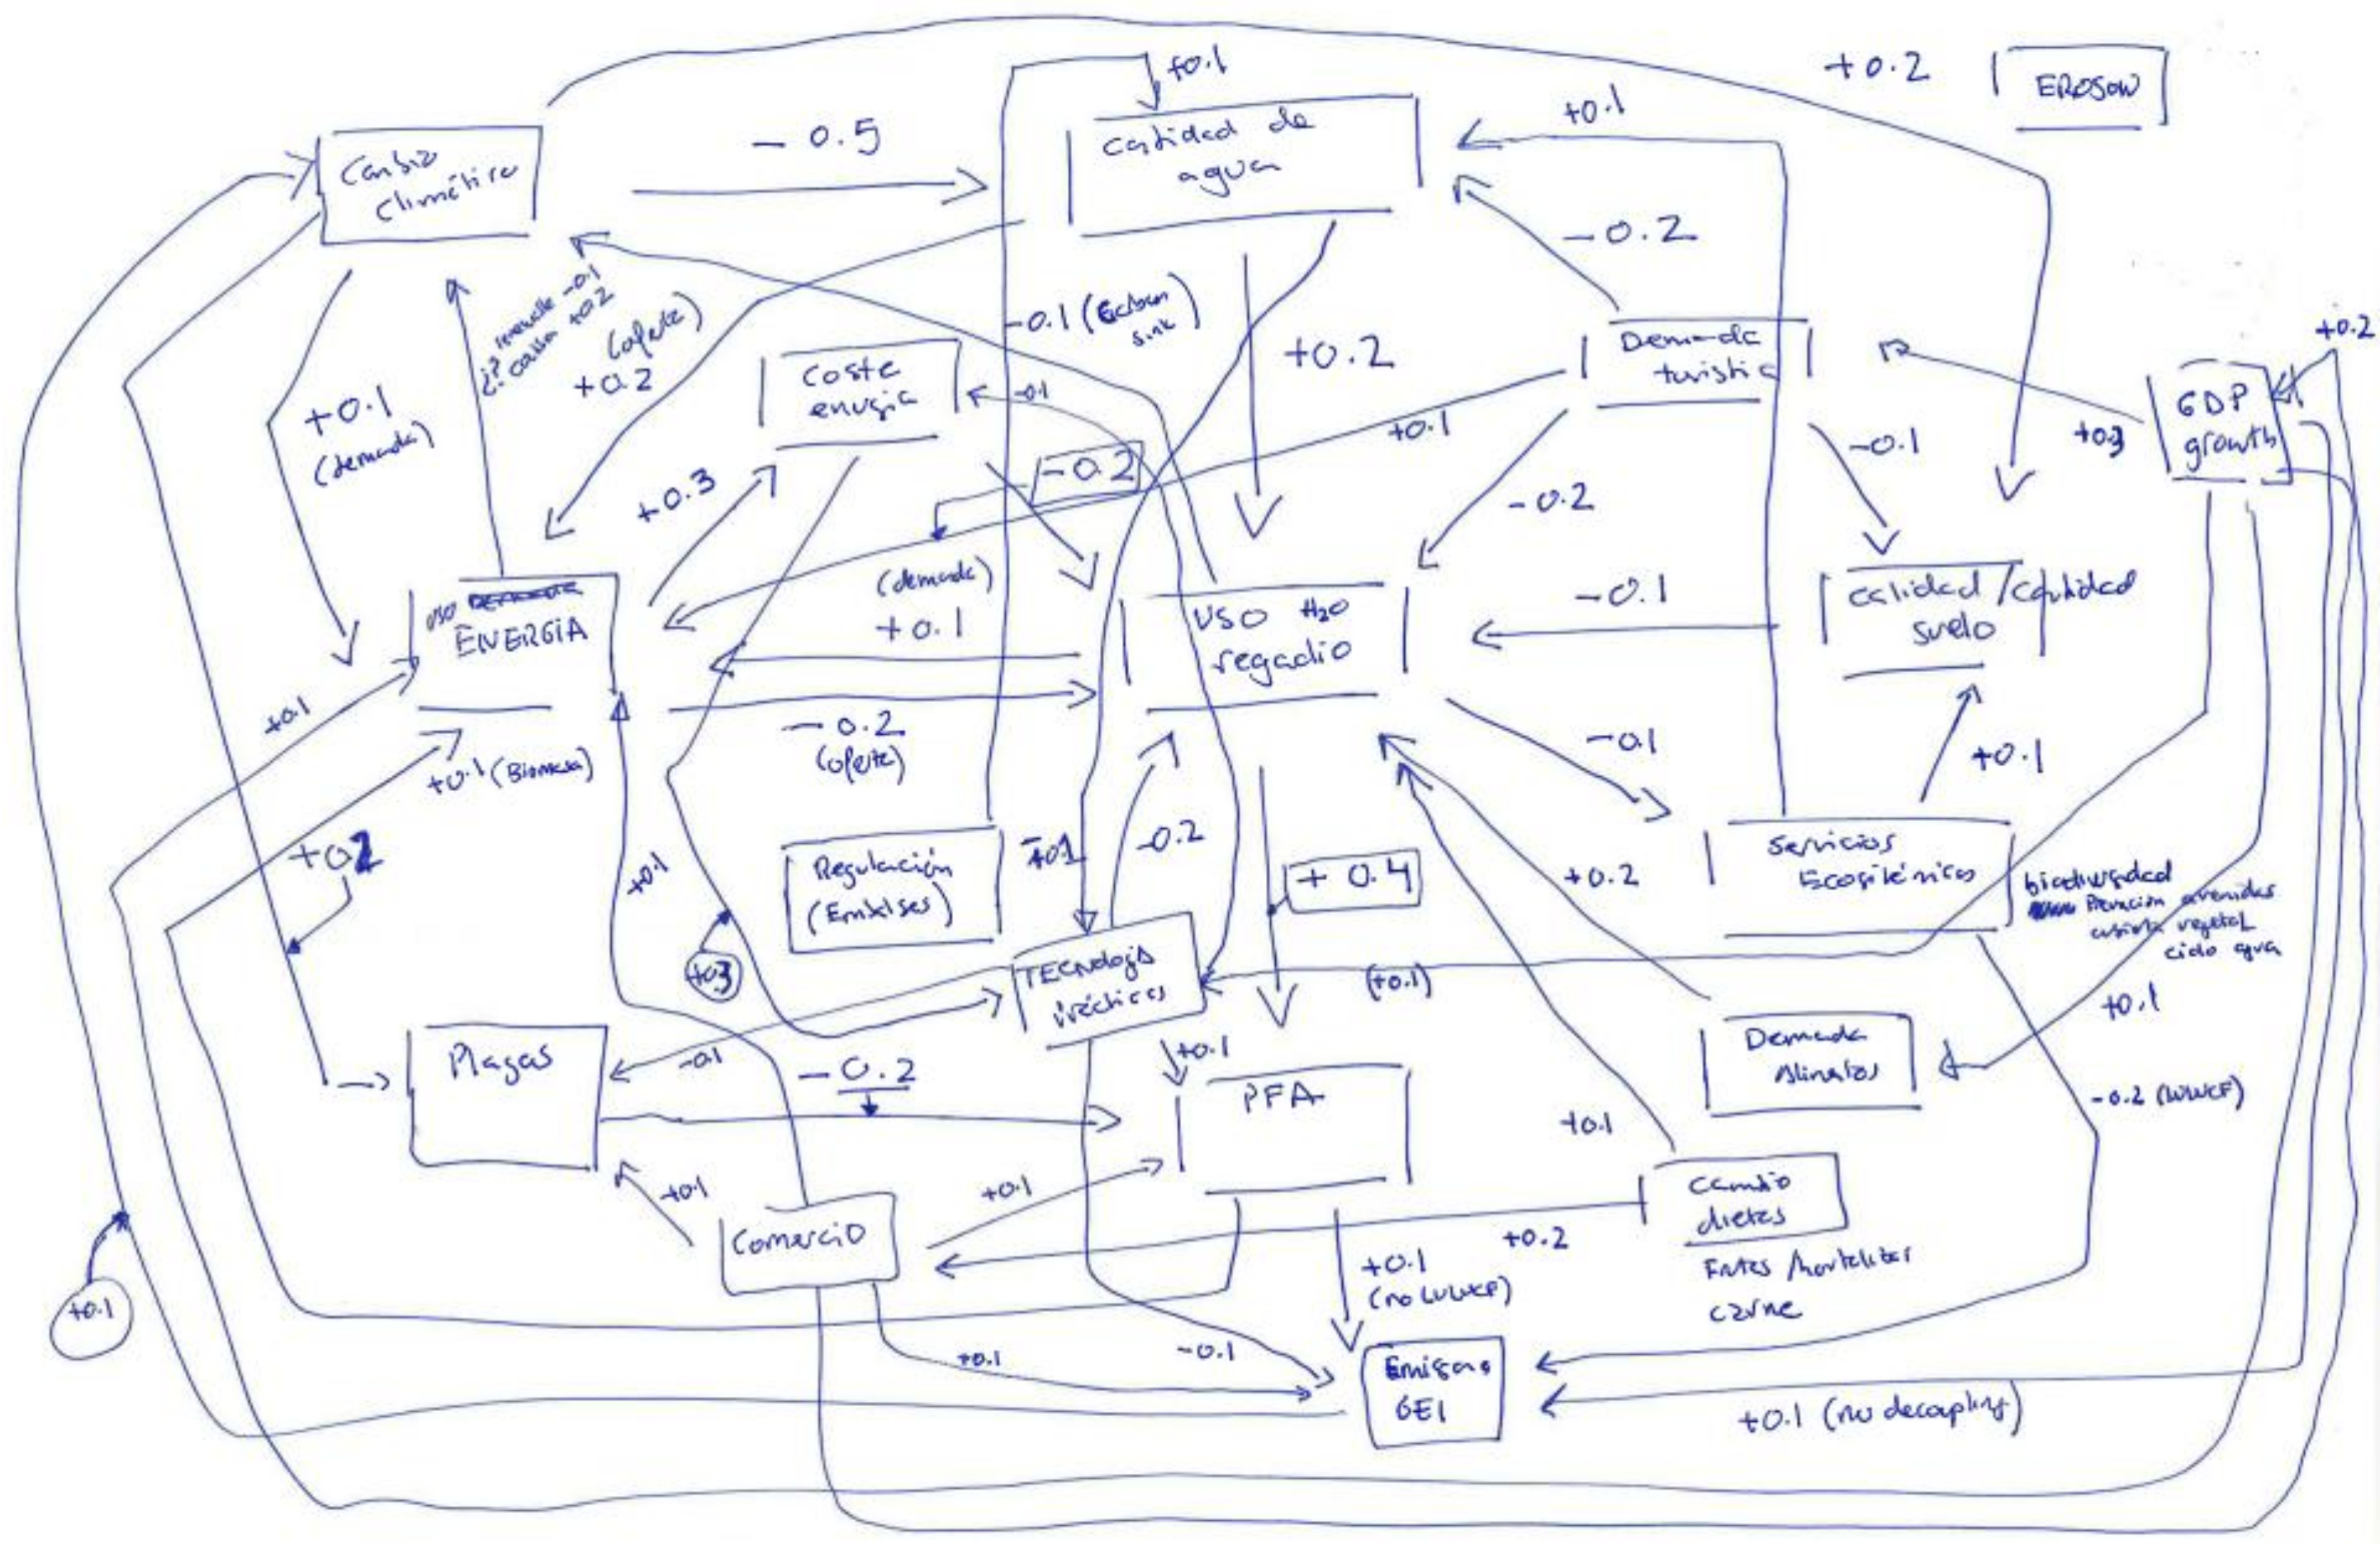
A one-day workshop held in the Regional Government of Agriculture, Fishing and Rural Development in Seville in October 2017 brought together the stakeholders. The portion of the workshop dedicated to stakeholders’ participation consisted of two sessions: (1) Individual mapping and (2) discussion of policy objectives. After explaining cognitive maps using an example, each participant was asked to build a cognitive map to respond to the question: What are the main interlinkages in the water–energy–food nexus in Andalusia? Participants were free to select the map variables to represent their perspectives without restraint. The magnitudes of the causal relationships between the variables were weighted with a value between −1 and +1. As a result of the first session of the workshop, 11 individual maps built by six representatives from the regional administration, two professional organisations, one NGO and two research centres were obtained. Figure 2 shows one of those individual maps, illustrating the type of information provided by workshop’s participants. Three stakeholders either left early or arrived late so that they missed the section that was dedicated to individual map drawing.
After the individual mapping, a round-table discussion during the second half of the workshop offered insights into main nexus challenges in Andalusia. According to these challenges, the group discussion enabled the description of two policy objectives and the corresponding measures to achieve each of them. This valuable information constituted the base for the scenario simulation in this article.
2.4. Data Processing and Analysis
The eleven individual maps built by stakeholders represented the raw data to develop the FCM. The first step in the data processing was to list all variables included in the individual maps and to relate them to the nexus sectors. As stakeholders used different words to define the same concept, we harmonised variable terminology (e.g., crop intensification, production intensification and agricultural intensification were harmonised as “intensification of agricultural production”). Less-repeated variables were aggregated into broader categories according to similarities (e.g., plagues and exotic species were merged in the variable “plagues”) and the names of the variables were standardised across maps. This subjective aggregation condensed 206 variables into 35 standardised variables facilitating the understanding and the analysis of the maps.
Using the standardised variables, we converted each individual map into a matrix. When a causal relationship between two variables was identified by the stakeholder, the same strength of influence provided in the individual map (ranging between −1 and 1) was coded in the matrix (weight wij). When no causal relationship was given in the individual map, zero was used. Once the individual maps were converted into matrices, all those individual matrices were augmented and merged into a single aggregated matrix to deliver the group map. The connection values between two specific variables were summed and averaged over the total number of individual maps. In the aggregated map, contradictory relationships between two given variables in different individual maps (opposite sign) decrease the causal relationship, while consensus on interlinkages (same sign) strengthens the causal relationship.
2.5. Scenario Analysis
The group matrix is used to run alternative simulation scenarios with the FCMapper software [60]. The definition of scenarios built on the policy objectives identified by stakeholders during the workshop as mentioned before:
● Scenario 1: Climate change mitigation
Stakeholders highlighted climate change as one of the major challenges in the WEF nexus. To address this challenge, the reduction in diffuse emissions is established as a major target. Some of the measures proposed to achieve this objective were to promote efficient agricultural machinery and good agricultural practices (carbon capture, reduction of tillage, precision agriculture, use of sensors, smart agriculture), reduce methane emissions and enhance renewable energies.
Based on this information, we simulated a first scenario considering an improvement in agricultural practices (variable "farming practices" set to 1) and an increase in the use of renewable energies (variable "use of renewable energies" set to 1).
● Scenario 2: Sustainable water resources management
Water availability is another key factor in the WEF nexus, especially for irrigated agriculture, which is by far the largest water user in Andalusia. Stakeholders considered that a reduction in water demand for irrigation is crucial to promote sustainable resource management. To that end, they proposed improvements in water infrastructures and management, as well as measures to reduce diffuse pollution.
According to this information, the second scenario simulated the improvement of water infrastructures (variable “water infrastructures” set to 1) and water quality (variable “water quality” set to 1).
3. Results
3.1. FCM Outcomes
The 11 individual maps drawn by stakeholders comprised 206 variables that, after data processing, were aggregated into 35 variables. Individual maps included an average number of 19 variables, which when grouped resulted in 14 variables on average. Most mentioned variables were climate change (climate change aggregates the variables climate, temperature, precipitation, extreme events, droughts and floods) and water availability, which were presented in all of the 11 maps, followed by energy cost and food production depicted in ten and nine maps, respectively.
Table 1 summarises calculated matrix indices for the individual maps (average values) and of the group map. The average number of connections was 25, leading to an average density index of 0.03. The group map gathered all of the variables and had a higher number of connections (C = 209) and density index (D = 0.17). The larger number of connections led to a lower number of transmitter and receiver variables in the group map, where most variables were ordinary. Therefore, the complexity index is higher in the individual maps than in the group map.
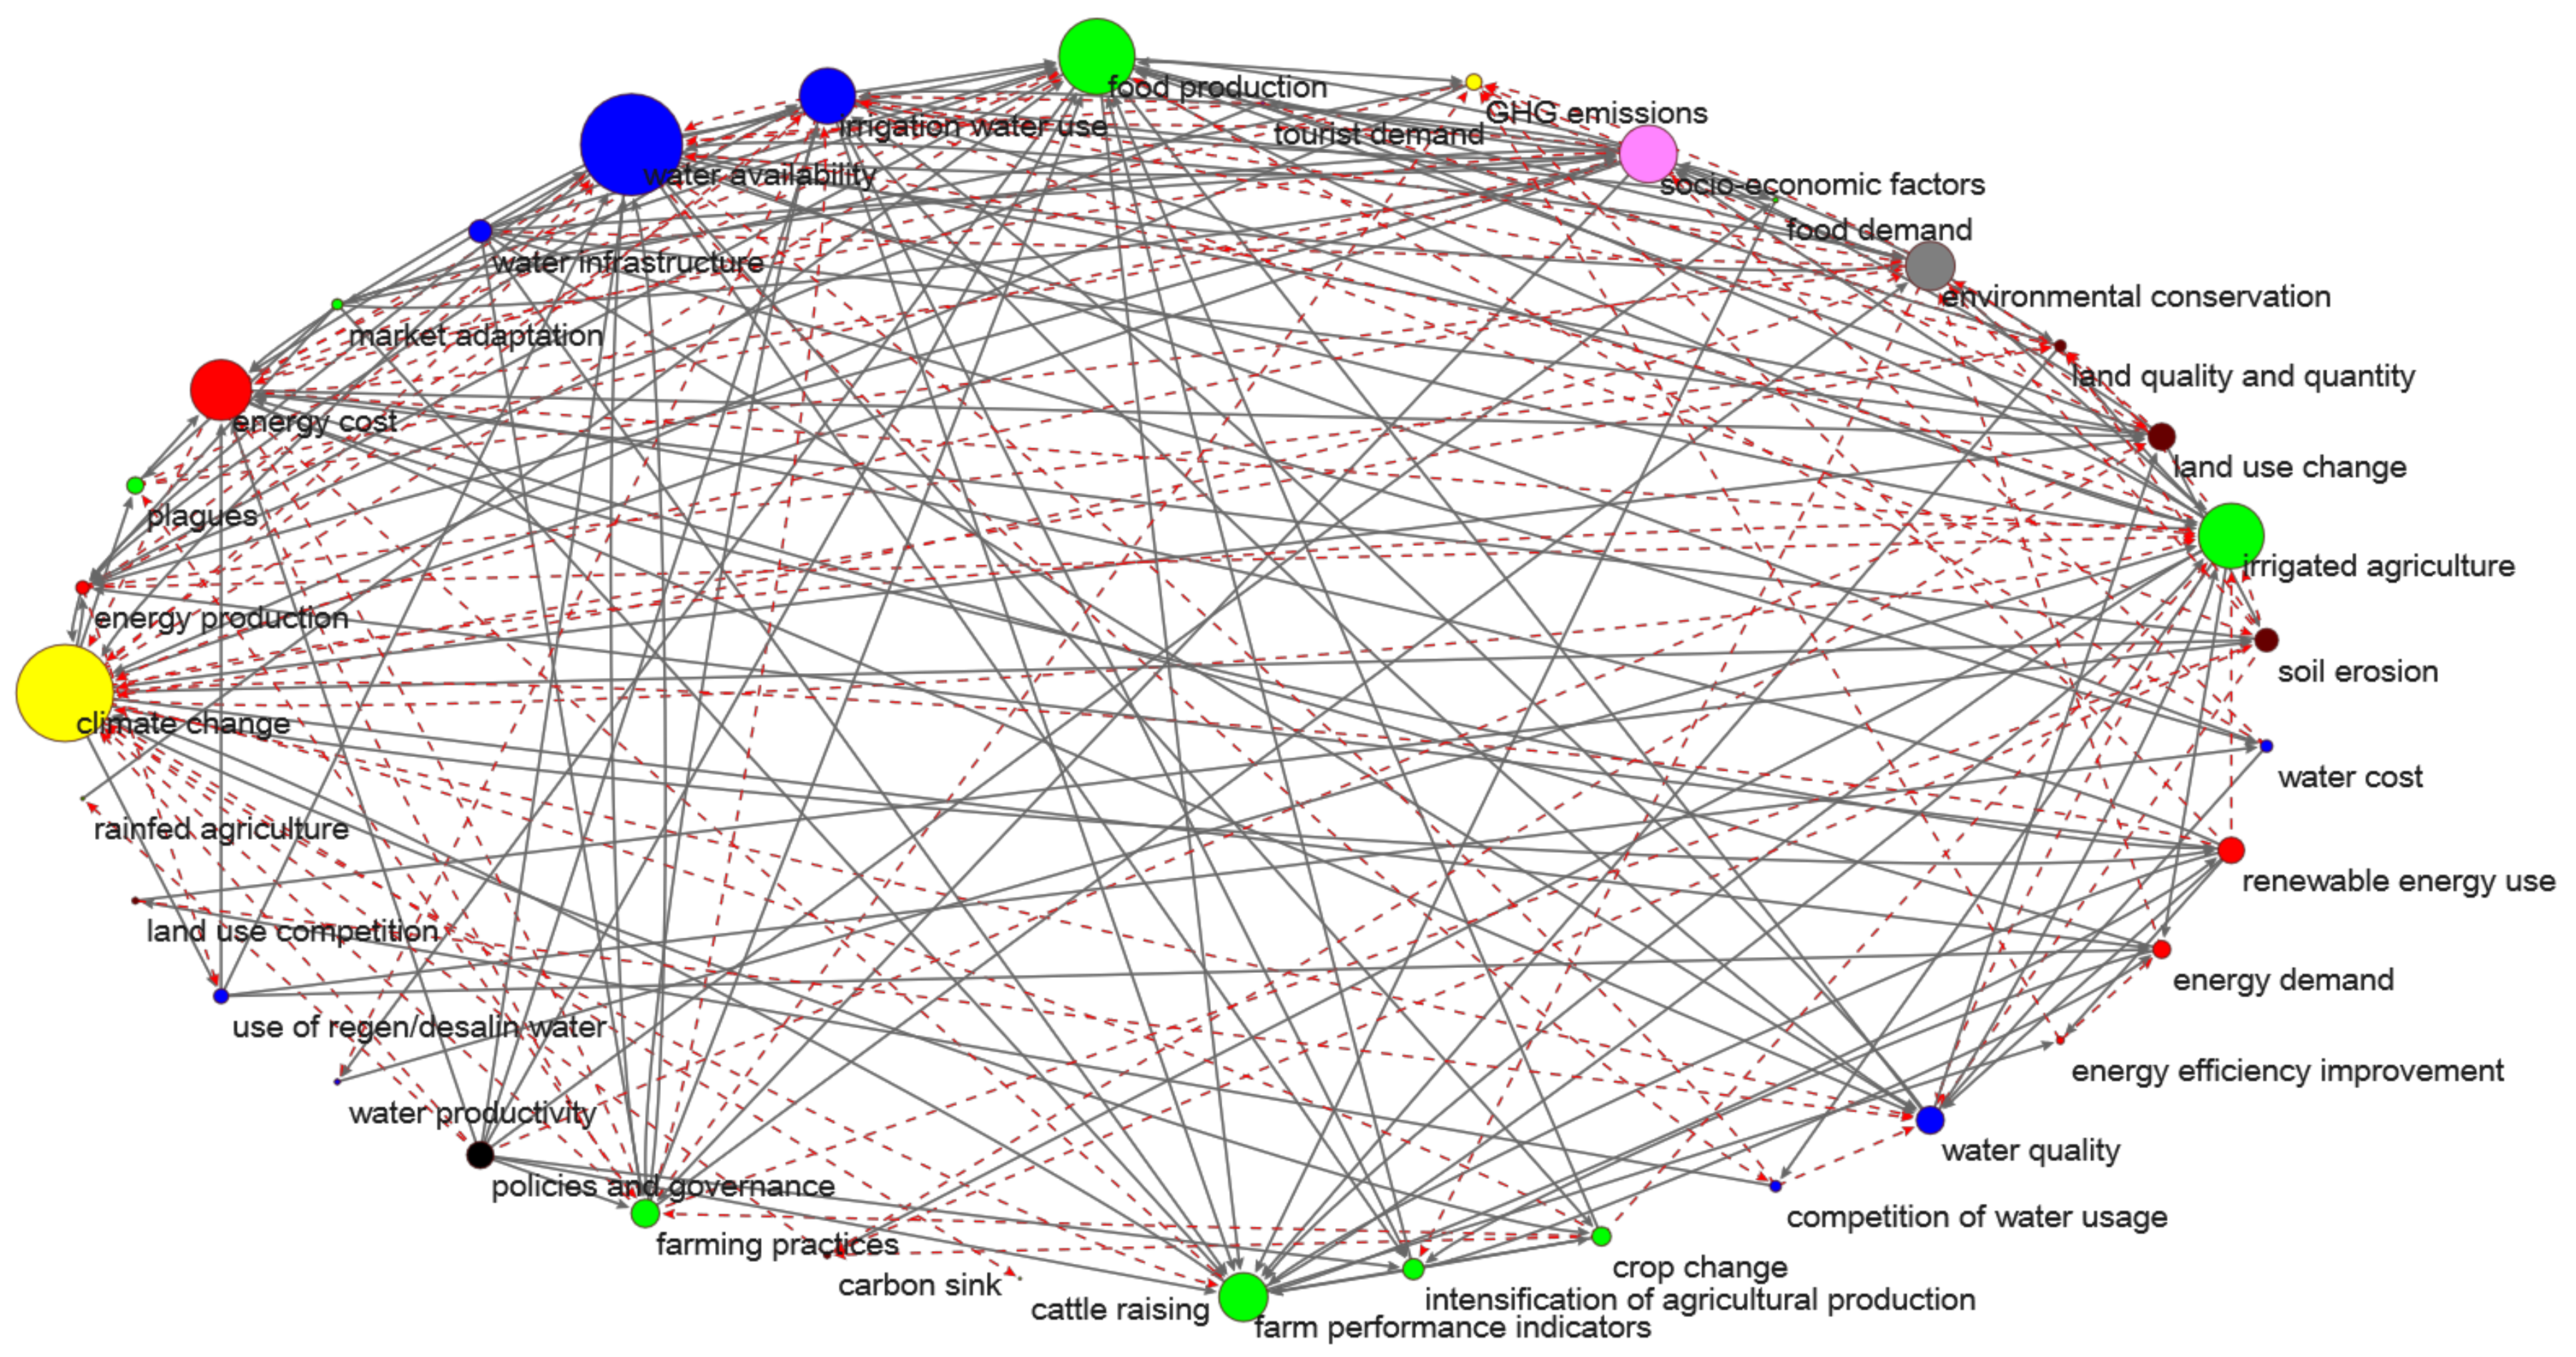
Figure 3 visualises the group map, where circles symbolise concepts of the system and lines reflect causal relationships between concepts (the group map was represented using the Pajek software (http://mrvar.fdv.uni-lj.si/pajek/)). The colour of the circle refers to the different sectors, while the size reflects the centrality of the variable within the system. The most central variables were water availability, climate change, food production, irrigated agriculture, energy cost, socio-economic factors (socio-economic factors aggregates economic development, job generation, GDP growth, equitable distribution of wealth, change in the structure of land ownership, population settlement), irrigation water use, environmental conservation, and farm performance indicators (farm performance indicators aggregate farm income, profitability, competitiveness and sustainability, insurances costs, infrastructure modernisation).
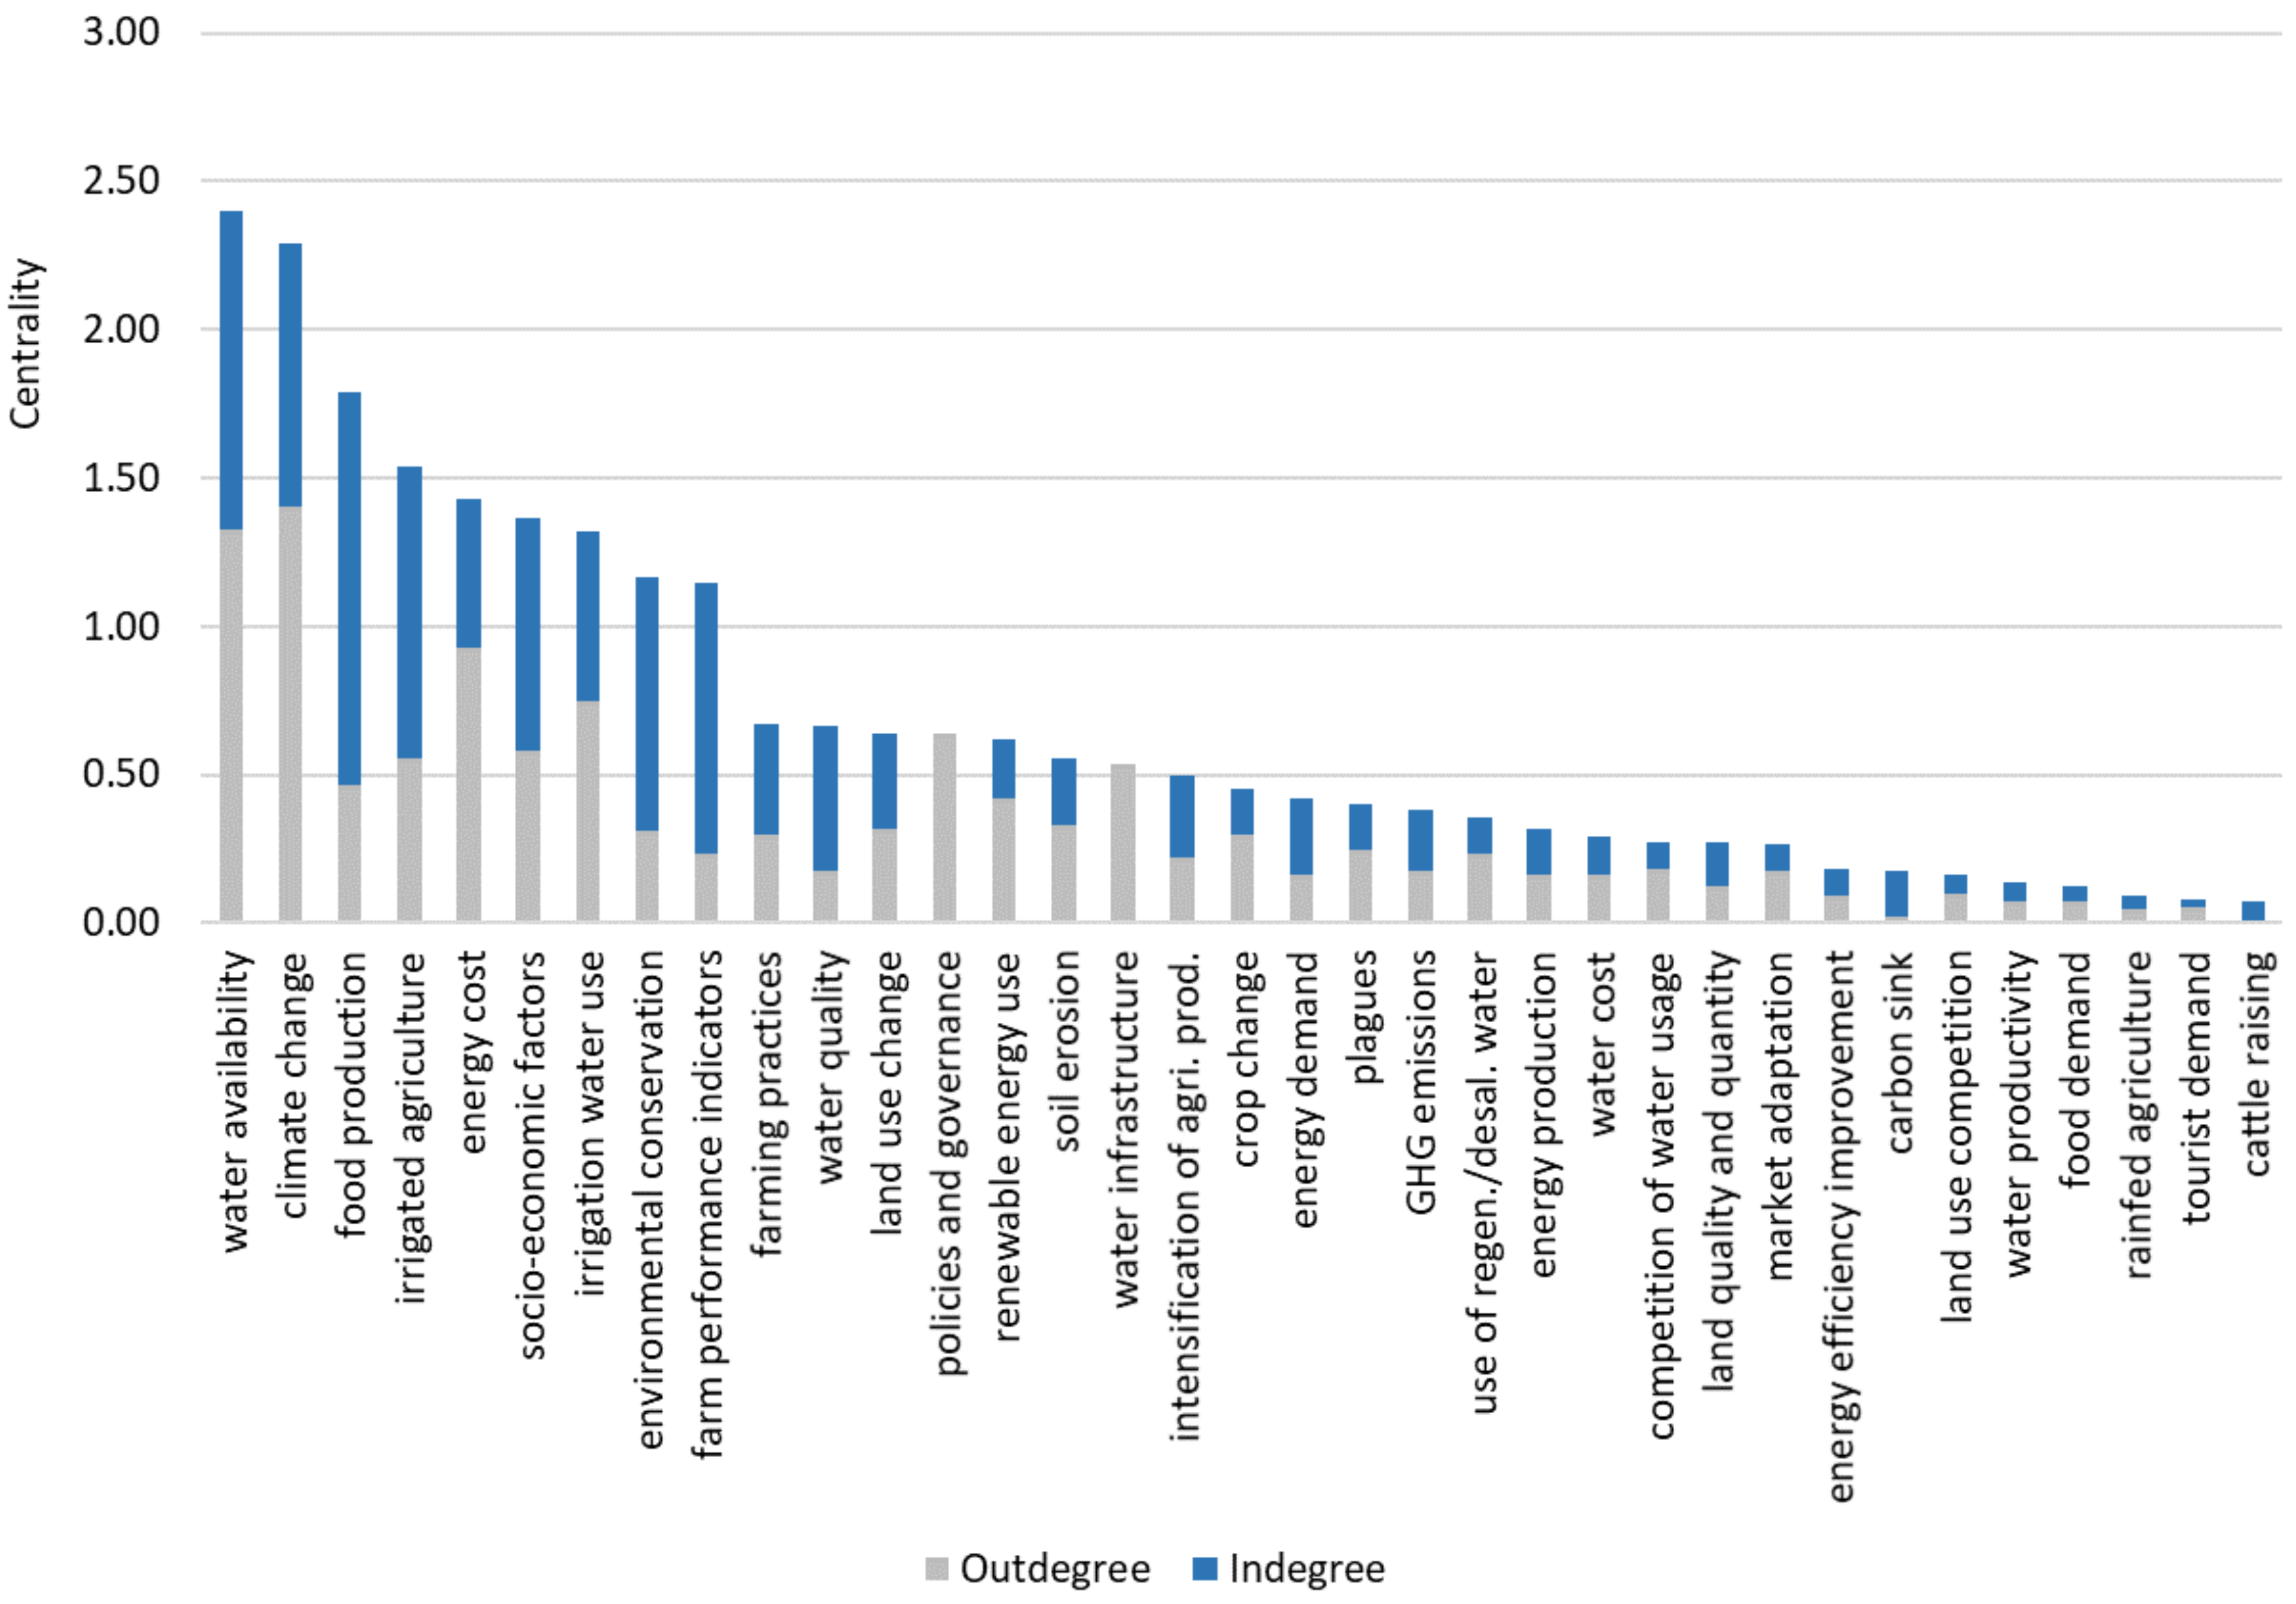
As highlighted in Figure 4, most of the variables were ordinary; only policies and governance and water infrastructures were exclusively transmitter variables, while cattle raising was an entirely receiver variable. Among the most important variables in the map, climate change, water availability and energy cost had the highest outdegree, meaning that those variables were highly influencing other variables. In contrast, variables with the highest indegree, and therefore significantly affected by other variables, were food production, socio-economic factors, irrigated agriculture, environmental conservation and farm performance indicators.
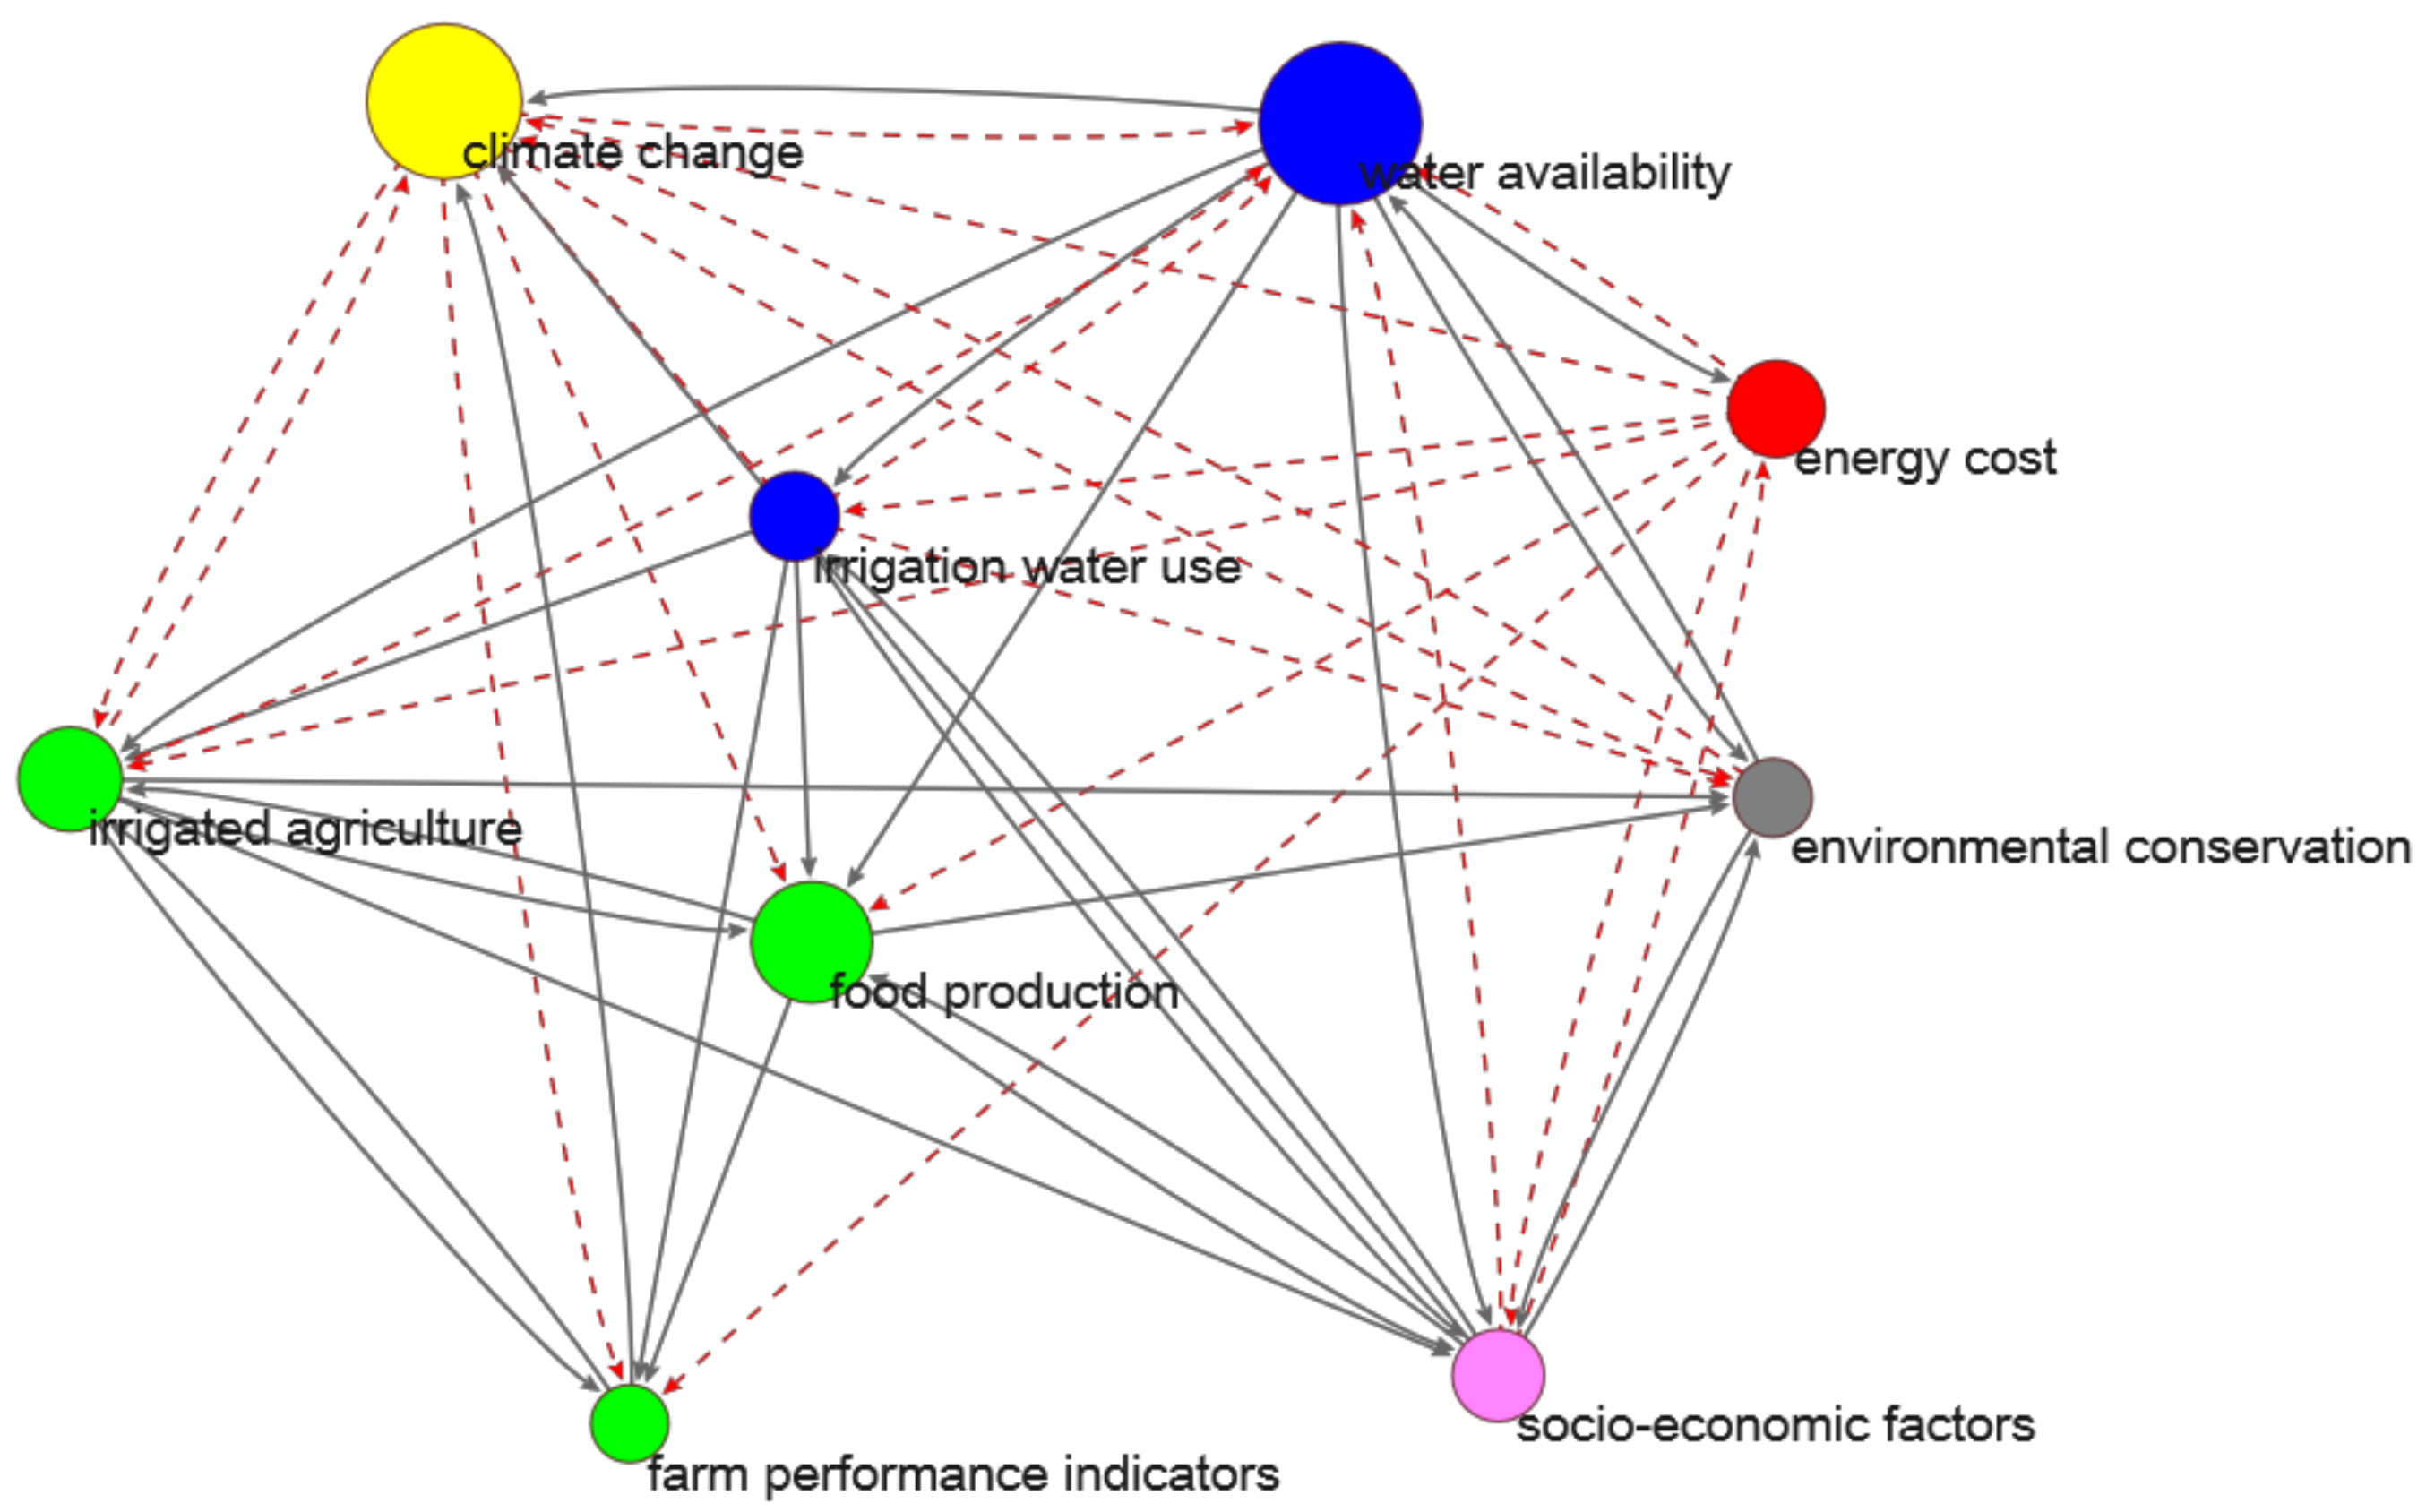
Figure 5 visualizes the interconnections among the most central variables in the group map. As observed, the variables climate change, water availability and food production are highly connected to other variables, while farm performance indicators and environmental conservation have fewer connections but bear greater weights. Food production can be distinguished by the height number of incoming connections, which determines its high indegree. Looking at the type of interrelationship, the importance of energy cost and climate change are highlighted by the number of negative outgoing connections.
3.2. Scenario Simulations
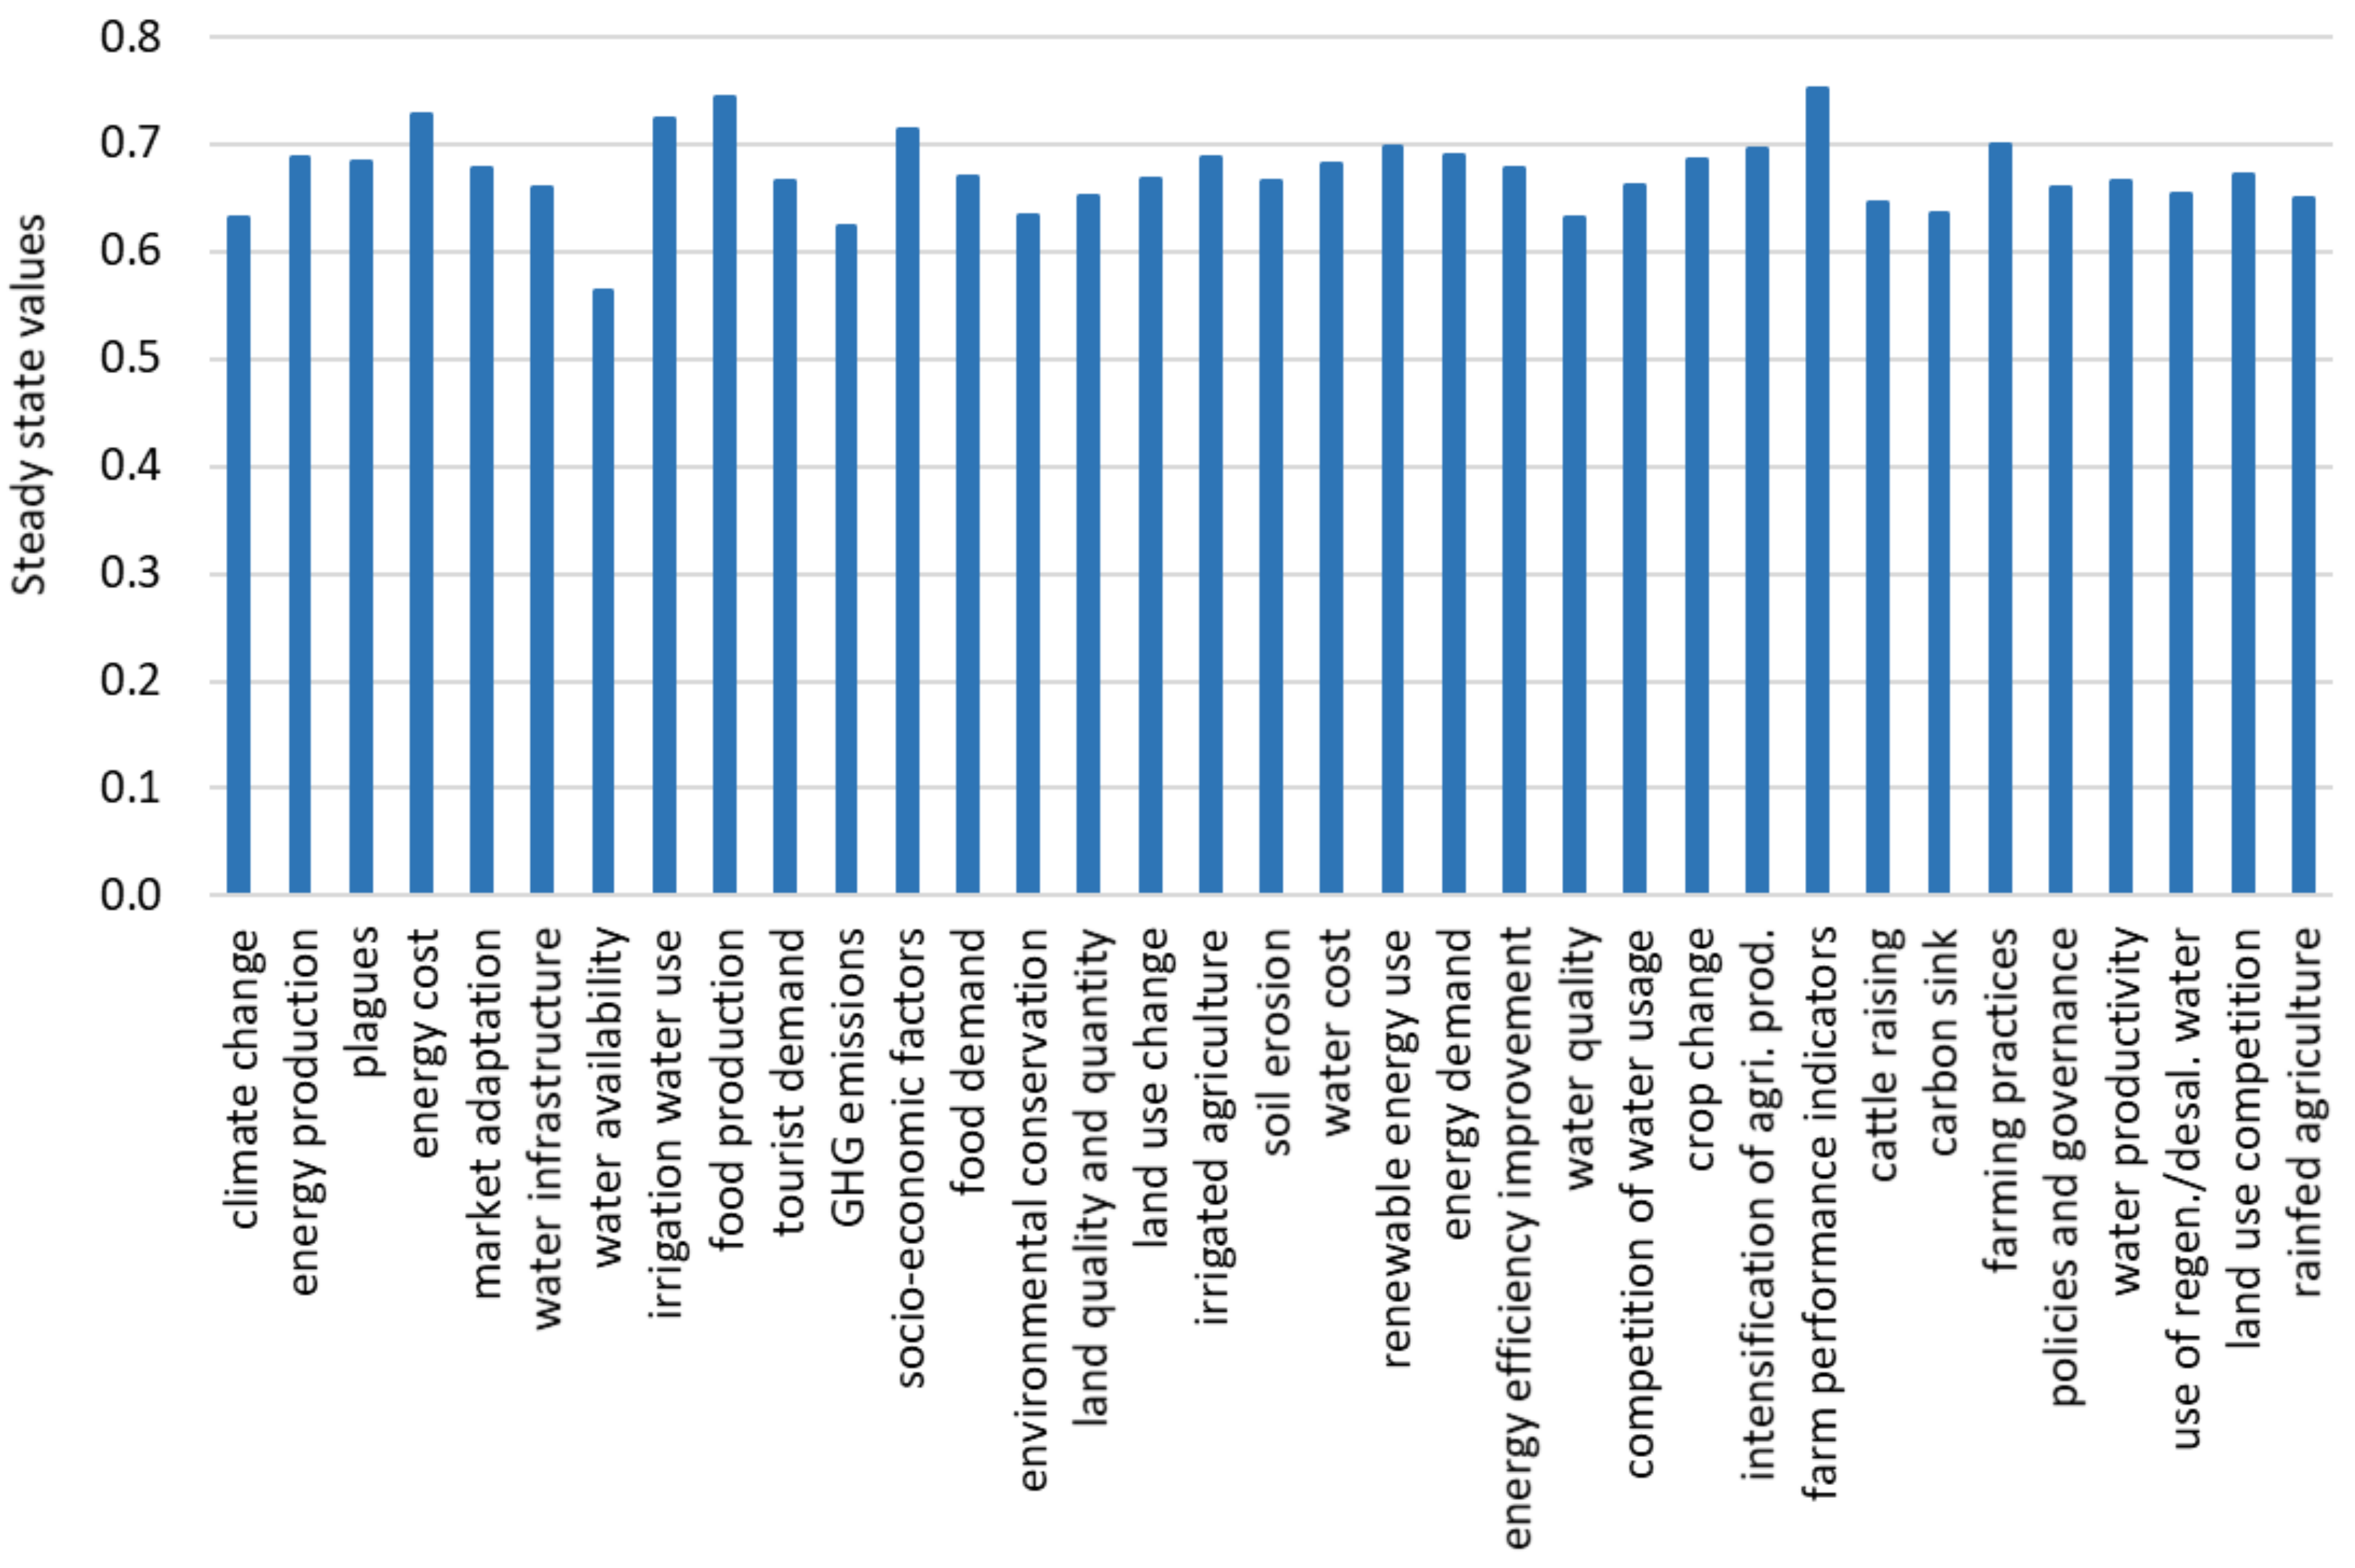
Figure 6 represents the results from the steady state calculation (obtained after 20 iterations) for all of the variables derived from the group FCM. The variables with the highest initial value were farm performance indicators, food production, irrigation water use and energy cost which suggest that these variables significantly influence the WEF nexus in the current situation. In contrast, the variable with the lowest initial value was water availability, which reflects the high pressure on water resources in Andalusia.
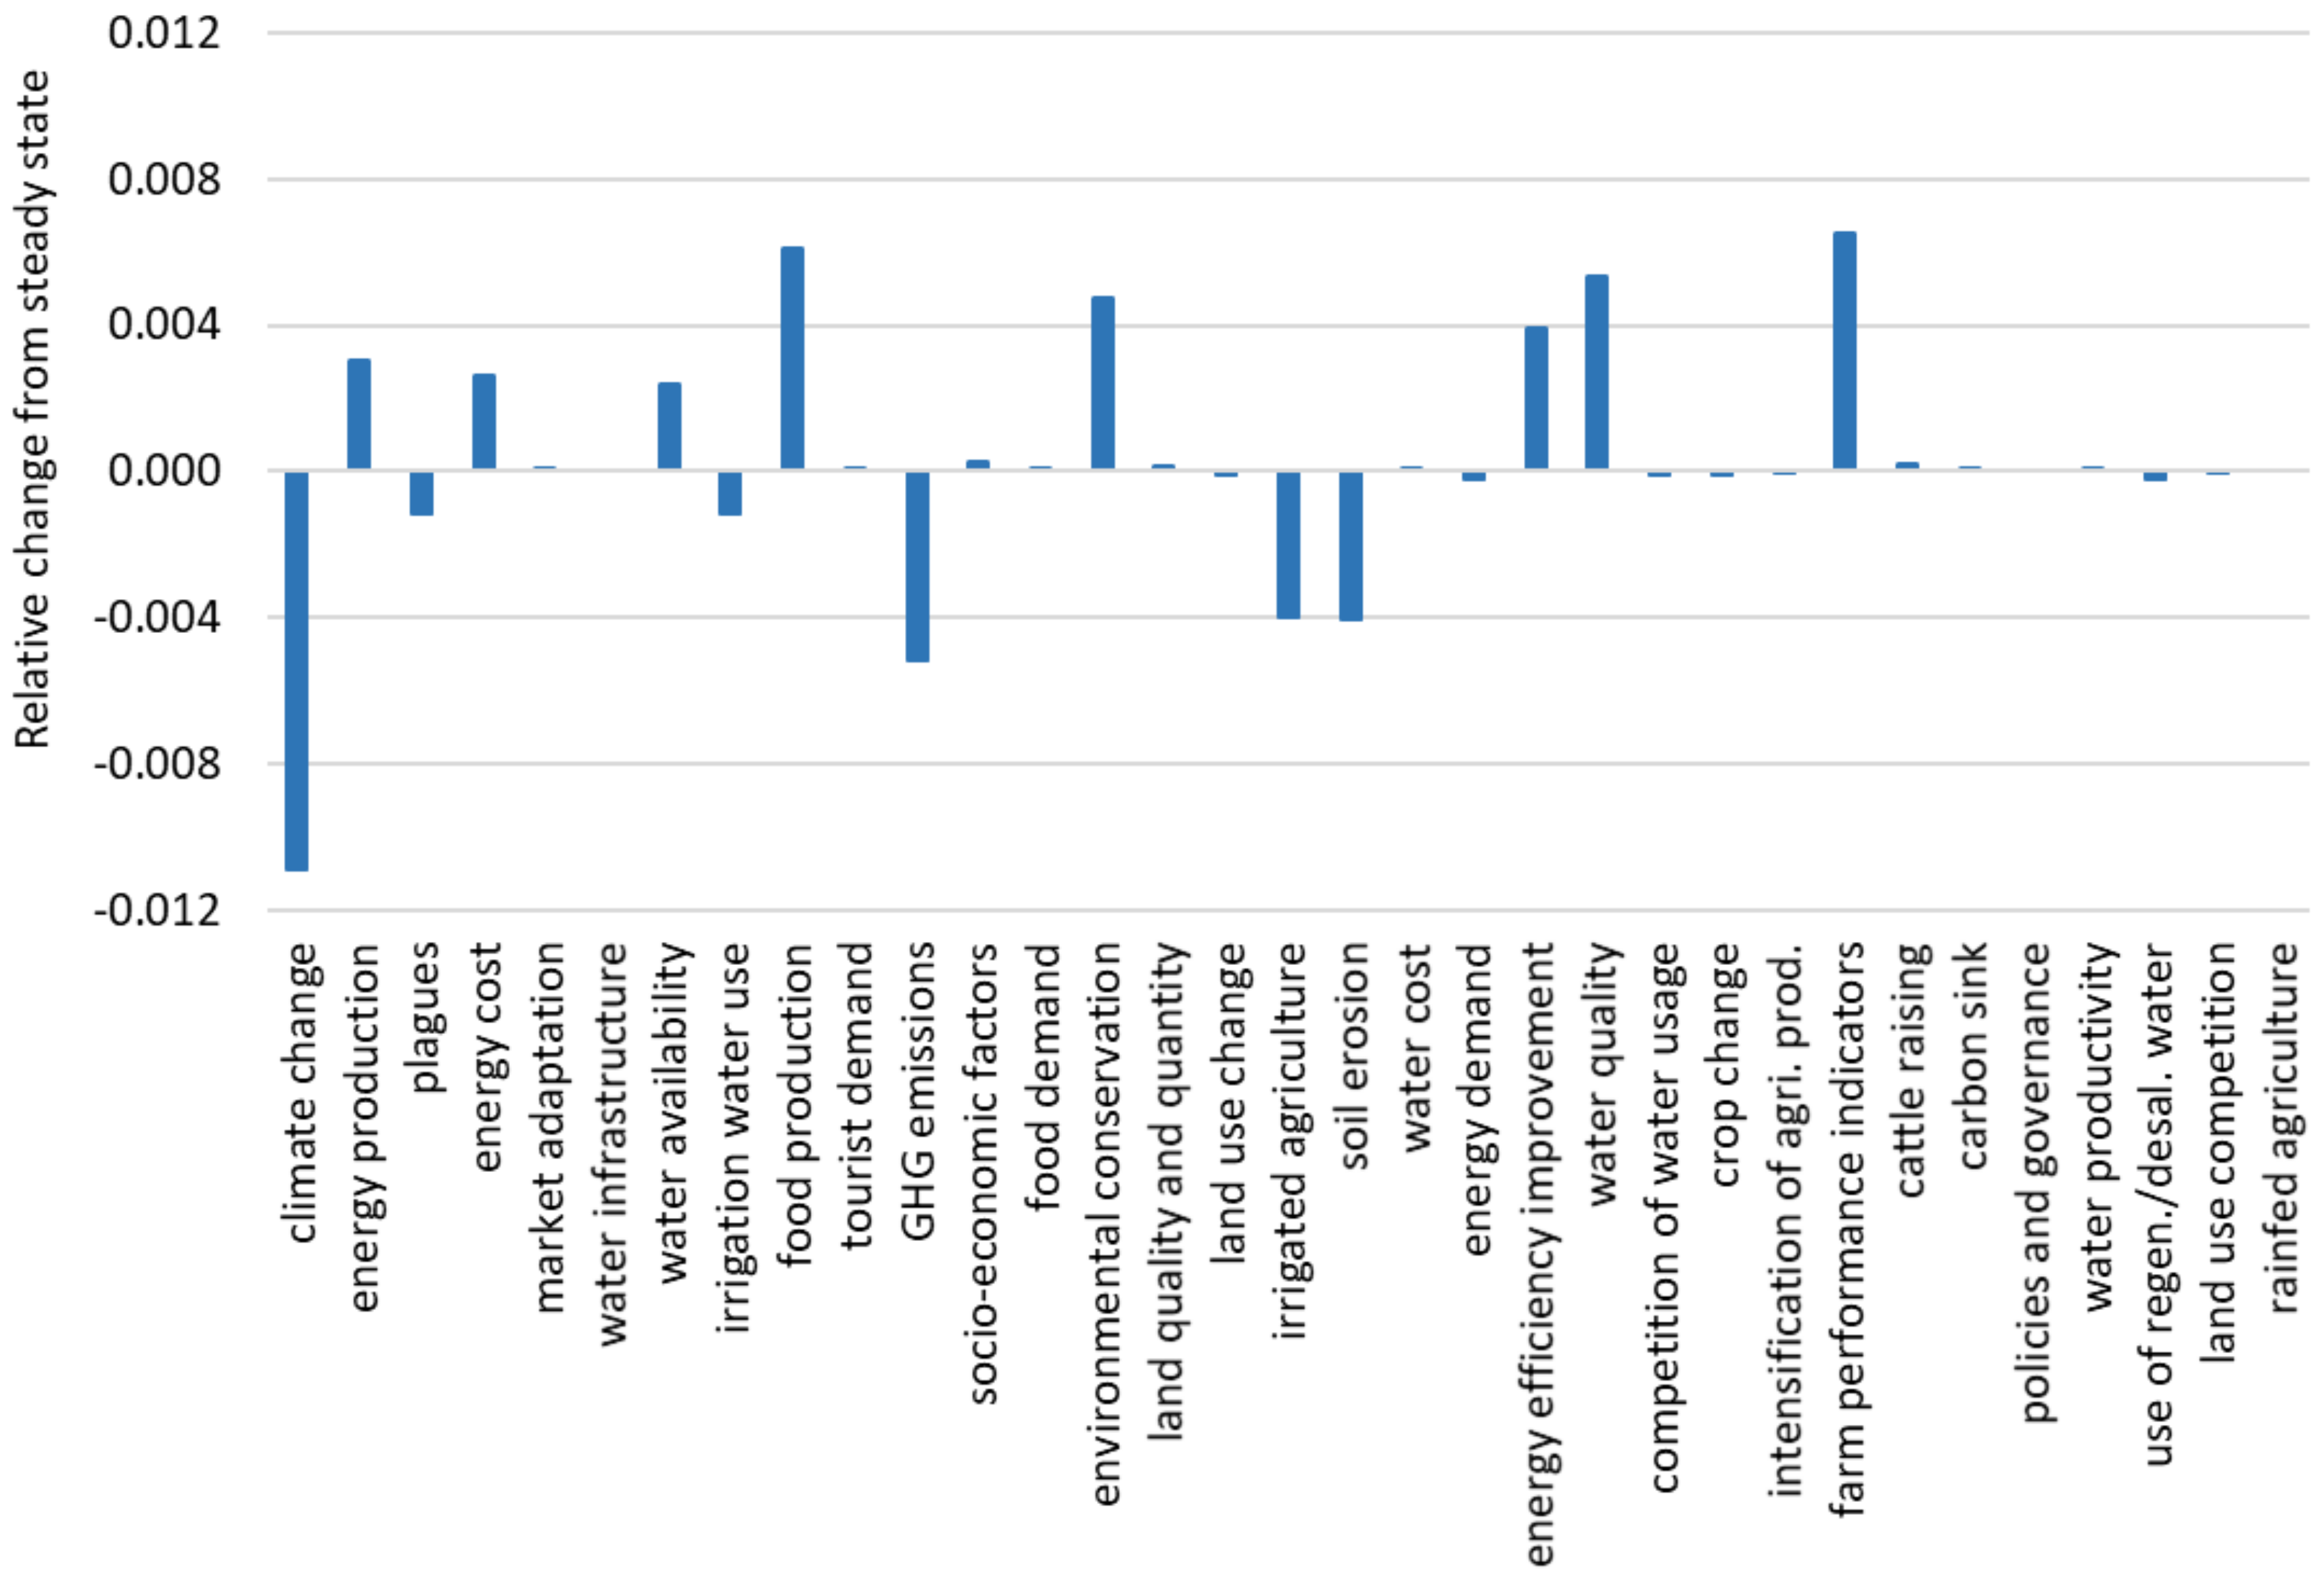
As shown in Figure 7, results from the climate change scenario (Scenario 1) highlight that an improvement in farming practices and the promotion of renewable energy use trigger a reduction in greenhouse gas (GHG) emissions and contribute to tackling climate change. Significant effects are also observed in the variables soil erosion and environmental conservation. Food production and farm performance indicators are also positively affected as a result of better farming practices. A negative relative change in one variable does not always imply a negative impact on the system, as can be observed for the variables climate change, GHG emissions, and soil erosion.
With regards to the sustainable water management scenario (Scenario 2), as observed in Figure 8, the improvement in water infrastructures and water quality would have a positive effect on water availability and, thus, on irrigated agriculture and food production. Consequently, farm performance indicators would be positively affected. Nevertheless, these measures would imply a rise in energy costs as well as further environmental deterioration.
4. Discussion
Matrix indices from individual maps highlighted that stakeholders perceived the nexus as a highly complex system, having more receiver than transmitter variables. These findings contrast with other FMC studies that, overall, show more transmitter variables than receivers [47]. Notwithstanding this, in the group map, the number of these types of variables was reduced because of the increase in the number of connections. The group map presented a higher density index but lower complexity [32]. Therefore, while individual maps provided valuable information on the diversity of opinions among stakeholders, the group or social map offers a more comprehensive vision of the nexus [39].
Stakeholders agreed that climate change and water availability are key factors in the WEF nexus, as all of the maps considered them. These variables had also the highest centrality in the aggregated map, influencing significantly the behaviour of the system as drivers (highest outdegree), but also as receiver variables (highest indegree). This implies that any change in these variables (e.g., policy measure) will have a significant impact throughout the system. Food production, irrigated agriculture, environmental conservation, and farm performance indicators are also central in the system due mainly to their high indegree, suggesting that these variables are very sensitive to any intervention in the system. Energy cost highlighted by its outdegree and high number of negative connections, which means that changes in energy policy would have relevant impacts on the water and food sectors. Other studies in Mediterranean areas find similar nexus interlinkages [16].
The simulation scenarios analysed in this study addressed the policy objectives proposed by stakeholders, which are climate change and water availability. The stakeholder priorities were consistent with the results derived from the group model, where these variables were highlighted as being the most central variables and the most important drivers in the WEF nexus.
The climate change scenario illustrates that the improvement of farming practices and the promotion of renewable energies effectively lead to a reduction of GHG emissions. Better farming practices also contribute to reducing soil erosion and improving water quality, which in turn positively influences environmental conservation. Boosting renewable energies increases energy production and energy efficiency but negatively affects irrigated agriculture. This is due to the competition for water use between irrigated agriculture and energy production, mainly hydropower. Despite the negative effect on irrigated agriculture, food production is positively affected owing to the improvement of agricultural practices and, correspondingly, farm performance indicators increase.
The sustainable water management scenario demonstrates that the improvement of water infrastructure management and the reduction of water pollution leads to an increase in water availability, which in turn causes an increase in irrigation water use [15]. A negative impact on environmental conservation is also observed in this scenario. This implies that the measures to improve sustainable water management have an opposite effect than the one intended and, therefore, do not represent an appropriate policy option to be implemented.
The combination of both scenarios reinforces the impacts derived from each one. This is because, in this case, the measures analysed are complementary. Farming practices from Scenario 1 also have a positive effect on water management, as stakeholders consider that good farming practices reduce water use in agriculture.
The application of the FCM approach presents numerous advantages but also a number of disadvantages. FCMs enable systems modelling with limited data, including both quantitative and qualitative variables, whilst considering feedback relationships between concepts [37]. Furthermore, this methodology encourages stakeholder discussion, facilitates their involvement in the modelling process and increases reliance on the model [30]. Nevertheless, the outcome from the FCM model needs to be interpreted in relative terms (no absolute changes in variables can be provided). Another important drawback is the absence of temporal dimension in the model [37].
Notwithstanding this, outcomes from the FCMs provide the foundations for developing a SDM at a later stage allowing quantitative impact assessment of detailed policy scenarios in the medium- and long term. In particular, the variables and interlinkages identified within the WEF nexus will serve to develop the structure of the SDM. Scenario simulations contribute to improve knowledge on the system behaviour and facilitate the definition of policy scenarios.
5. Conclusions
In this research, we performed a participatory approach to gain insights of the WEF nexus in Andalusia. Through the application of the FCM methodology, we involved decision-makers in the identification of the main nexus interlinkages, while promoting discussion and consensus building among stakeholders from different sectors. Furthermore, the exploitation of FCM model dynamics enabled the analysis of different scenarios to improve our knowledge on the system behaviour.
Stakeholders agreed that climate change and water availability are the main drivers in the WEF nexus. Other variables with significant roles in building interlinkages in the nexus were energy cost, food production, irrigated agriculture, socio-economic factors, irrigation water use, environmental conservation and farm performance indicators.
The scenario analysis demonstrates the interdependencies among nexus sectors and the existence of unanticipated effects when changing variables in the system. Although results from scenarios only show relative variable changes, they allow improved analysis of the stakeholders’ perceptions on the WEF nexus and contribute to improving understanding of the system’s dynamics.
The participatory approach performed in this research enabled the development of a conceptual model of the WEF nexus in Andalusia which is suitable for the stakeholders that will support the nexus assessment. Outcomes from this research are being used in the development of an SDM to quantitatively assess the impact of nexus-compliant policies in Andalusia in the medium and long term.
Author Contributions
P.M. and M.B. conceived and designed the research; P.M., M.B. and B.C.-C. performed the data collection; P.M. and B.C.-C. processed the data; P.M. analysed the data and wrote the paper; M.B. supervised the work; M.B. and B.C.-C. reviewed the final manuscript.
Funding
The work described in this paper has been conducted within the project SIM4NEXUS. This project has received funding from the European Union’s Horizon 2020 research and innovation programme under Grant Agreement NO 689150 SIM4NEXUS.
Acknowledgments
We would like to thank to all the stakeholders who participate in the interviews and the workshop for their invaluable contribution to the development of this research.
Conflicts of Interest
The authors declare no conflict of interest.
References
- Hoff, H. Understanding the Nexus: Background Paper for the Bonn 2011 Conference: The Water, Energy and Food Security Nexus; Stockholm Environment Institute: Stockholm, Sweden, 2011; Available online: https://www.sei-international.org/publications?pid=1977 (accessed on 5 March 2018).
- Food and Agriculture Organization (FAO). The Water-Energy-Food Nexus: A New Approach in Support of Food Security and Sustainable Agriculture; Food and Agriculture Organization of the United Nations: Rome, Italy, 2014; Available online: http://www.fao.org/3/a-bl496e.pdf (accessed on 5 March 2018).
- Organisation for Economic Co-operation and Development (OECD). The Land-Water-Energy Nexus: Biophysical and Economic Consequences; OECD: Paris, France, 2017. [Google Scholar] [CrossRef]
- Bhaduri, A.; Ringler, C.; Dombrowski, I.; Mohtar, R.; Scheumann, W. Sustainability in the water-energy-food nexus. Water Int. 2015, 40, 723–732. [Google Scholar] [CrossRef]
- Lindberg, C.; Leflaive, X. The water-energy-food-nexus: The imperative of policy coherence for sustainable development. In Coherence for Development-Better Policies for Better Lives-Organization for Economic Co-Operation and Development; OECD: Paris, France, 2015; Volume 6, p. 12. [Google Scholar]
- Rodriguez, D.J.; Delgado, A.; DeLaquil, P.; Sohns, A. Thirsty Energy; World Bank: Washington, DC, USA, 2013; Available online: http://documents.worldbank.org/curated/en/835051468168842442/Thirsty-energy (accessed on 6 March 2018).
- Smajgl, A.; Ward, J. The Water-Food-Energy Nexus in the Mekong Region; Springer: New York, NY, USA, 2013. [Google Scholar]
- Mayor, B.; Lopez-Gunn, E.; Villaroya, F.I.; Montero, E. Application of a water-energy-food nexus framework for the Duero river basin in Spain. Water Int. 2015, 40, 791–808. [Google Scholar] [CrossRef]
- De Strasser, L.; Lipponen, A.; Howells, M.; Stec, S.; Bréthaut, C. A methodology to assess the water energy food ecosystems nexus in transboundary river basins. Water 2016, 8, 59. [Google Scholar] [CrossRef]
- Sušnik, J.; Chew, C.; Domingo, X.; Mereu, S.; Trabucco, A.; Evans, B.; Vamkeridou-Lyroudia, L.; Savic, D.A.; Laspidou, C.; Brouwer, F. Multi-stakeholder development of a serious game to explore the water-energy-food-land-climate nexus: The SIM4NEXUS approach. Water 2018, 10, 139. [Google Scholar] [CrossRef]
- Lopez-Gunn, E.; Zorrilla, P.; Prieto, F.; Llamas, M.R. Lost in translation? Water efficiency in Spanish agriculture. Agric. Water Manag. 2012, 108, 83–95. [Google Scholar] [CrossRef]
- Sampedro, D.; Del Moral, L. Tres décadas de política de aguas en Andalucía. Cuad. Geogr. 2014, 53, 36–67. [Google Scholar]
- Salmoral, G.; Garrido, A. The Common Agricultural Policy as a driver of water quality changes: The case of the Guadalquivir River Basin (southern Spain). Bio-Based Appl. Econ. 2015, 4, 103. [Google Scholar] [CrossRef]
- Berbel, J.; Pedraza, V.; Giannoccaro, G. The trajectory towards basin closure of a European river: Guadalquivir. Int. J. River Basin Manag. 2013, 11, 111–119. [Google Scholar] [CrossRef]
- Corominas, J.; Cuevas, R. Análisis crítico de la modernización de regadíos. Pensando el futuro: ¿cómo será el nuevo paradigma? In Efectos de la Modernización de Regadío en España; Berbel, J., Gutiérrez-Martin, C., Eds.; Cajamar Caja Rural: Almería, Spain, 2017; pp. 273–308. ISBN 978-84-95531-83-4. (In Spanish) [Google Scholar]
- Hardy, L.; Garrido, A.; Juana, L. Evaluation of Spain’s water-energy nexus. Int. J. Water Resour. Dev. 2012, 28, 151–170. [Google Scholar] [CrossRef] [Green Version]
- De Stefano, L.; Llamas, M.R. (Eds.) Water, Agriculture and the Environment in Spain: Can We Square the Circle? CRC Press: Delft, The Netherlands, 2012; ISBN 978-0-415-63152-5. [Google Scholar]
- De Marchi, B.; Ravetz, J.R. Participatory Approaches to Environmental Policy; EVE-Concerted Action, Policy Research Brief Number 10; Cambridge Research for the Environment: Cambridge, UK, 2001. [Google Scholar]
- Voinov, A.; Bousquet, F. Modelling with stakeholders. Environ. Model. Softw. 2010, 25, 1268–1281. [Google Scholar] [CrossRef]
- Barton, D.N.; Kuikka, S.; Varis, O.; Uusitalo, L.; Henriksen, H.J.; Borsuk, M.; Linnell, J.D. Bayesian networks in environmental and resource management. Integr. Environ. Assess. Manag. 2012, 8, 418–429. [Google Scholar] [CrossRef] [PubMed]
- Bousquet, F.; Barreteau, O.; Le Page, C.; Mullon, C.; Weber, J. An environmental modelling approach: The use of multi-agent simulations. Adv. Environ. Ecol. Model. 1999, 113, 122. [Google Scholar]
- Kosko, K. Fuzzy cognitive maps. Int. J. Man-Mach. Stud. 1986, 24, 65–75. [Google Scholar] [CrossRef]
- Voinov, A.; Kolagani, N.; McCall, M.K.; Glynn, P.D.; Kragt, M.E.; Ostermann, F.O.; Pierce, S.A.; Ramu, P. Modelling with stakeholders–next generation. Environ. Model. Softw. 2016, 77, 196–220. [Google Scholar] [CrossRef]
- Argent, R.M.; Sojda, R.S.; Giupponi, C.; McIntosh, B.; Voinov, A.A.; Maier, H.R. Best practices for conceptual modelling in environmental planning and management. Environ. Model. Softw. 2016, 80, 113–121. [Google Scholar] [CrossRef]
- Basco-Carrera, L.; Warren, A.; van Beek, E.; Jonoski, A.; Giardino, A. Collaborative modelling or participatory modelling? A framework for water resources management. Environ. Model. Softw. 2017, 91, 95–110. [Google Scholar] [CrossRef]
- Gray, S.; Voinov, A.; Paolisso, M.; Jordan, R.; BenDor, T.; Bommel, P.; Glynn, P.; Hedelin, B.; Hubacek, K.; Introne, J.; et al. Purpose, processes, partnerships, and products: Four Ps to advance participatory socio-environmental modeling. Ecol. Appl. 2018, 28, 46–61. [Google Scholar] [CrossRef] [PubMed]
- Halbe, J.; Pahl-Wostl, C.; Adamowski, J. A methodological framework to support the initiation, design and institutionalization of participatory modeling processes in water resources management. J. Hydrol. 2018, 556, 701–716. [Google Scholar] [CrossRef]
- Gray, S.A.; Gray, S.; De Kok, J.L.; Helfgott, A.E.; O’Dwyer, B.; Jordan, R.; Nyaki, A. Using fuzzy cognitive mapping as a participatory approach to analyze change, preferred states, and perceived resilience of social-ecological systems. Ecol. Soc. 2015, 20. [Google Scholar] [CrossRef]
- Papageorgiou, E.; Salmeron, J.L. A review of fuzzy cognitive maps research during the last decade. IEEE Trans. Fuzzy Syst. 2013, 21, 66–79. [Google Scholar] [CrossRef]
- Hobbs, B.F.; Ludsin, S.A.; Knight, R.L.; Ryan, P.A.; Biberhofer, J.; Ciborowski, J.J. Fuzzy cognitive mapping as a tool to define management objectives for complex ecosystems. Ecol. Appl. 2002, 12, 1548–1565. [Google Scholar] [CrossRef]
- Kafetzis, A.; McRoberts, N.; Mouratiadou, I. Using fuzzy cognitive maps to support the analysis of stakeholders’ views of water resource use and water quality policy. In Fuzzy Cognitive Maps; Springer: Berlin/Heidelberg, Germany, 2010; pp. 383–402. [Google Scholar]
- Vasslides, J.M.; Jensen, O.P. Fuzzy cognitive mapping in support of integrated ecosystem assessments: Developing a shared conceptual model among stakeholders. J. Environ. Manag. 2016, 166, 348–356. [Google Scholar] [CrossRef] [PubMed]
- Solana-Gutiérrez, J.; Rincón, G.; Alonso, C.; García-de-Jalón, D. Using fuzzy cognitive maps for predicting river management responses: A case study of the Esla River basin, Spain. Ecol. Model. 2013, 360, 260–269. [Google Scholar] [CrossRef]
- Bosma, C.; Glenk, K.; Novo, P. How do individuals and groups perceive wetland functioning? Fuzzy cognitive mapping of wetland perceptions in Uganda. Land Use Policy 2017, 60, 181–196. [Google Scholar] [CrossRef]
- Wildenberg, M.; Bachhofer, M.; Adamescu, M.; De Blust, G.; Diaz-Delgadod, R.; Isak, K.G.Q.; Riku, V. Linking thoughts to flows-Fuzzy cognitive mapping as tool for integrated landscape modelling. In Proceedings of the 2010 International Conference on Integrative Landscape Modelling, Montpellier, France, 3–5 February 2010. [Google Scholar]
- Van der Sluis, T.; Arts, B.; Kok, K.; Bogers, M.; Busck, A.G.; Sepp, K.; Crouzat, E. Drivers of European landscape change: Stakeholders’ perspectives through Fuzzy Cognitive Mapping. Landsc. Res. 2018, 1–19. [Google Scholar] [CrossRef]
- Kok, K. The potential of Fuzzy Cognitive Maps for semi-quantitative scenario development, with an example from Brazil. Glob. Environ. Chang. 2009, 19, 122–133. [Google Scholar] [CrossRef]
- Vanwindekens, F.M.; Stilmant, D.; Baret, P.V. Development of a broadened cognitive mapping approach for analysing systems of practices in social–ecological systems. Ecol. Model. 2013, 250, 352–362. [Google Scholar] [CrossRef]
- Gray, S.; Chan, A.; Clark, D.; Jordan, R. Modeling the integration of stakeholder knowledge in social–ecological decision-making: Benefits and limitations to knowledge diversity. Ecol. Model. 2012, 229, 88–96. [Google Scholar] [CrossRef]
- Konti, A.; Damigos, D. Exploring strengths and weaknesses of bioethanol production from bio-waste in Greece using Fuzzy Cognitive Maps. Energy Policy 2018, 112, 4–11. [Google Scholar] [CrossRef]
- Misthos, L.M.; Messaris, G.; Damigos, D.; Menegaki, M. Exploring the perceived intrusion of mining into the landscape using the fuzzy cognitive mapping approach. Ecol. Eng. 2017, 101, 60–74. [Google Scholar] [CrossRef]
- Reckien, D. Weather extremes and street life in India—Implications of Fuzzy Cognitive Mapping as a new tool for semi-quantitative impact assessment and ranking of adaptation measures. Glob. Environ. Chang. 2014, 26, 1–13. [Google Scholar] [CrossRef]
- Olazabal, M.; Chiabai, A.; Foudi, S.; Neumann, M.B. Emergence of new knowledge for climate change adaptation. Environ. Sci. Policy 2018, 83, 46–53. [Google Scholar] [CrossRef]
- Ziv, G.; Watson, E.; Young, D.; Howard, D.C.; Larcom, S.T.; Tanentzap, A.J. The potential impact of Brexit on the energy, water and food nexus in the UK: A fuzzy cognitive mapping approach. Appl. Energy 2018, 210, 487–498. [Google Scholar] [CrossRef]
- Axelrod, R. Structure of Decision: The Cognitive Maps of Political Elites; Princeton University Press: Princeton, NJ, USA, 1976; ISBN 9780691616988. [Google Scholar]
- Papageorgiou, E.; Kontogianni, A. Using fuzzy cognitive mapping in environmental decision-making and management: A methodological primer and an application. In International Perspectives on Global Environmental Change; InTech: New York, NY, USA, 2012; ISBN 978-953-307-815-1. [Google Scholar]
- Özesmi, U.; Özesmi, S.L. Ecological models based on people’s knowledge: A multi-step fuzzy cognitive mapping approach. Ecol. Model. 2004, 176, 43–64. [Google Scholar] [CrossRef]
- Gray, S.A.; Zanre, E.; Gray, S.R.J. Fuzzy cognitive maps as representations of mental models and group beliefs. In Fuzzy Cognitive Maps for Applied Sciences and Engineering; Springer: Berlin/Heidelberg, Germany, 2014; pp. 29–48. [Google Scholar]
- Harary, F.; Norman, R.Z.; Cartwright, D. Structural Models: An Introduction to the Theory of Directed Graphs; John Wiley & Sons: New York, NY, USA, 1965. [Google Scholar]
- Junta de Andalucía. Informe Económico 2016; Consejería de Economía y Conocimiento, Junta de Andalucía: Seville, Spain, 2017; Available online: http://www.juntadeandalucia.es/export/drupaljda/publicacion/17/08/Informe_Economico_2016_0.pdf (accessed on 9March 2018). (In Spanish)
- MAPAMA. Encuesta de Superficies y Rendimientos de Cultivo; Ministerio de Agricultura, Alimentación y Medio Ambiente, Gobierno de España: Madrid, Spain, 2015. Available online: http://www.mapama.gob.es/es/estadistica/temas/estadisticas-agrarias/boletin2015_tcm30-122275.pdf (accessed on 12 February 2018). (In Spanish)
- European Parliament. Research for Agri-Comitee—Agriculture in Andalusia; Directorate General for Internal Policies: Brussels, Belgium, 2016; Available online: http://www.europarl.europa.eu/RegData/etudes/STUD/2016/573431/IPOL_STU(2016)573431_EN.pdf (accessed on 20 December 2017).
- MAPA. Plan Nacional de Regadíos Horizonte 2008; Ministerio de Agricultura, Pesca y Alimentación, Gobierno de España: Madrid, Spain, 2001. Available online: http://www.mapama.gob.es/es/desarrollo-rural/temas/gestion-sostenible-regadios/plan-nacional-regadios/texto-completo/ (accessed on 12 February 2018). (In Spanish)
- Junta de Andalucía. Agenda del Regadío Andaluz H-2015; Consejería de Agricultura, Pesca y Alimentación, Junta de Andalucía: Seville, Spain, 2011; Available online: http://www.juntadeandalucia.es/export/drupaljda/AGENDA_DEL_REGADIO_CONSEJO_DE_GOBIERNO_x7-4-11x.pdf (accessed on 9 March 2018). (In Spanish)
- Fernández García, I.; Rodrigeuz Díaz, J.; Camacho Poyato, E.; Montesinos, P.; Berbel, J. Effects of modernization and medium term perspectives on water and energy use in irrigation districts. Agric. Syst. 2014, 131, 56–63. [Google Scholar] [CrossRef]
- Corominas, J. Agua y energía en el riego en la época de la sostenibilidad. Ing. Agua 2010, 17, 219–233. (In Spanish) [Google Scholar] [CrossRef]
- Rodríguez-Díaz, J.A.; Pérez-Urrestarazu, L.; Camacho-Poyato, E.; Montesinos, P. The paradox of irrigation scheme modernization: More efficient water use linked to higher energy demand. Span. J. Agric. Res. 2011, 9, 1000–1008. [Google Scholar] [CrossRef]
- Rodríguez-Díaz, J.A.; Camacho-Poyato, E.; Blanco-Pérez, M. Evaluation of water and energy use in pressurized irrigation networks in Southern Spain. J. Irrig. Drain. Eng. 2011, 137, 644–650. [Google Scholar] [CrossRef]
- Noy, C. Sampling knowledge: The hermeneutics of snowball sampling in qualitative research. Int. J. Soc. Res. Methodol. 2008, 11, 327–344. [Google Scholar] [CrossRef]
- Bachofer, M.; Wildenberg, M. FCmapper Software. Available online: http://www.fcmappers.net/joomla/index.php (accessed on 10 January 2018).
Figure 1.
Location of Andalusia and main land uses. Source: Own elaboration.

Figure 2.
Example of an individual map drawn by stakeholders. Boxes represent the variables identified by the stakeholder. Arrows depict the cause–effect relationship between variables. Number values represent the strength of the causal relationship, where the sign depicts a positive (+) or negative (−) causal relationship and the value between 0 and 1 represents the magnitude.

Figure 3.
Visual representation of the group map. Circles represent the variables of the system, colours refer to the nexus sector (blue for water, red for energy, green for agriculture, yellow for climate, pink for socioeconomic aspects, brown for land, grey for environment and black for policies and governance) and size depicts centrality. Solid grey lines depict positive casual relationships while dotted red lines illustrate negative causal relationships. Source: Own elaboration.
Figure 4.
Importance of variables in the group fuzzy cognitive mapping (FCM) according to their centrality, represented as the sum of the outdegree and indegree. Source: Own elaboration.
Figure 4.
Importance of variables in the group fuzzy cognitive mapping (FCM) according to their centrality, represented as the sum of the outdegree and indegree. Source: Own elaboration.

Figure 5.
Visual representation of a subset of the group map. The nine variables with centrality higher than 1 are represented. Grey solid lines for positive and red dotted lines for negative connections. Source: Own elaboration.
Figure 5.
Visual representation of a subset of the group map. The nine variables with centrality higher than 1 are represented. Grey solid lines for positive and red dotted lines for negative connections. Source: Own elaboration.
Figure 6.
Steady state. Source: Own elaboration.

Figure 7.
Climate change mitigation scenario simulation (absolute change from steady state). Source: Own elaboration.
Figure 7.
Climate change mitigation scenario simulation (absolute change from steady state). Source: Own elaboration.

Figure 8.
Sustainable water management scenario simulation (absolute change from steady state). Source: Own elaboration.
Figure 8.
Sustainable water management scenario simulation (absolute change from steady state). Source: Own elaboration.


Table 1.
Individual and group map indices (mean and standard deviation).
| Index | Individual Maps | Group Map |
|---|---|---|
| Number of maps | 11 | 1 |
| Number of variables (N) | 14 ± 2.72 | 35 |
| Number of connections (C) | 25 ± 9.40 | 209 |
| C/N | 1.81 ± 0.59 | 5.97 |
| Density | 0.03 ± 0.02 | 0.17 |
| Number of transmitter variables (T) | 2.55 ± 2.21 | 2 |
| Number of receiver variables (R) | 2.64 ± 2.01 | 1 |
| Number of ordinary variables | 8.82 ± 2.93 | 32 |
| Complexity (R/T) | 1.27 ± 1.57 | 0.5 |
Source: Own elaboration.
© 2018 by the authors. Licensee MDPI, Basel, Switzerland. This article is an open access article distributed under the terms and conditions of the Creative Commons Attribution (CC BY) license (http://creativecommons.org/licenses/by/4.0/).
Share and Cite
MDPI and ACS Style
Martinez, P.; Blanco, M.; Castro-Campos, B. The Water–Energy–Food Nexus: A Fuzzy-Cognitive Mapping Approach to Support Nexus-Compliant Policies in Andalusia (Spain). Water 2018, 10, 664. https://doi.org/10.3390/w10050664
AMA Style
Martinez P, Blanco M, Castro-Campos B. The Water–Energy–Food Nexus: A Fuzzy-Cognitive Mapping Approach to Support Nexus-Compliant Policies in Andalusia (Spain). Water. 2018; 10(5):664. https://doi.org/10.3390/w10050664
Chicago/Turabian StyleMartinez, Pilar, Maria Blanco, and Bente Castro-Campos. 2018. "The Water–Energy–Food Nexus: A Fuzzy-Cognitive Mapping Approach to Support Nexus-Compliant Policies in Andalusia (Spain)" Water 10, no. 5: 664. https://doi.org/10.3390/w10050664
Note that from the first issue of 2016, this journal uses article numbers instead of page numbers. See further details here.