Financing Watershed Services in the Foothills of the Himalayas


1
South Asian Network for Development and Environmental Economics, International Centre for Integrated Mountain Development, Dhapakhel, Lalitpur 44700, Nepal
2
The Nature Conservancy, 4245 Fairfax Dr#100, Arlington, VA 22203, USA
3
International Centre for Integrated Mountain Development, Dhapakhel, Lalitpur 44700, Nepal
*
Author to whom correspondence should be addressed.
Water 2018, 10(7), 965; https://doi.org/10.3390/w10070965
Submission received: 25 June 2018
/
Revised: 16 July 2018
/
Accepted: 18 July 2018
/
Published: 23 July 2018
(This article belongs to the Section Water Resources Management, Policy and Governance)
Abstract
:Watershed management is critical for the sustainable supply of clean water to urban centers, particularly in areas of developing countries where large-scale infrastructure projects are costly to implement. In this paper, we discuss the potential for financing improvements in watershed services in the foothills of the Himalayas through Payments for Ecosystem Services. Through the use of a choice experiment to disentangle household preferences, we show that downstream water users are interested in improvements in water quality through source water protection. Households in Dharan municipality are willing to finance watershed management to the extent of USD 118,000 per year. These payments can be used to incentivize upstream households to decrease domestic livestock grazing, change agricultural practices and reduce open defecation to improve the drinking water quality and quantity in downstream areas. The estimated cost of these activities is less than $50,000 per year. Through discussions with local stakeholders, we propose a tri-partite institutional structure to facilitate transactions between downstream and upstream communities and to improve watershed services.
1. Introduction
Local watershed management can be critical for supplying clean water, particularly in regions of the world where large water and sanitation infrastructure is costly to develop and maintain. This is especially true in the foothills of the Himalayas where water availability is affected by upstream diversions for irrigation and hydroelectricity, and water quality is influenced by land erosion from road-building, human settlements, agricultural practices and forest cover loss [1,2,3]. Because water use is often unsupported by modern infrastructure and management, it is significantly influenced by upstream activities and the natural whims of monsoons, avalanches and floods [4]. In this context, it is useful to identify local markets and green infrastructure opportunities that can help with water resource management.
Over the last decade or so, Payments for Ecosystem Services (PES) has emerged as an innovative, market-based mechanism to motivate communities to better manage local natural resources [5], and to internalize environmental externalities [6]. This policy instrument requires consumers of ecosystem services, such as water users, to pay service providers (for example, upstream farmers) to carry out environmental friendly activities that maintain these services [7]. PES can enhance the welfare of transacting parties by creating win-win trades and also improving natural resource management [8,9]. It can also be a cheaper solution for providing drinking water compared to other alternatives [10]. In addition, monetization can compensate poor resource-dependent households [7], increase local political support for sustaining fragile ecosystems [11,12] and may be more effective because land-use changes in the developing world are mostly driven by markets rather than regulations [7]. Thus, in this paper, we explore the possibility of creating a community-based PES scheme to improve watershed services in Nepal.
Most existing ecosystem payment schemes target individuals or households who already participate in resource management. For instance, households who participate in forest protection and plantation in Vietnam [13], watershed management in Ecuador [14] or bird habitat and watershed protection in Bolivia [15] receive payments on a per hectare basis. However, in some countries, such as Nepal and Mexico, community-based resource management is a dominant conservation strategy. In such cases, it makes sense to make payments to communities [16,17]. Community-held property rights may also offer some scale-economies (similar to government-financed programs) and reduce transaction costs [7]. Whether payments are at the household or community level, it is important that property rights related to service provision are clear. Furthermore, PES schemes generally work better when trading is economically feasible and the transactions costs associated with coordinating and monitoring trades are low [18].
In Nepal, less than 50% of the populace has access to piped tap water within the home [19], and an estimated 30,000–40,000 people die every year from waterborne diseases and other causes related to water quality [20]. In this mountainous country, building and maintaining modern water infrastructure is expensive due to the rugged terrain and limited road access. Further, its history of civil strife and political instability makes it less likely that large-scale infrastructure will meet the needs of Nepal’s rural and semi-urban populations in the near future [21]. Yet, water quantity and quality remain urgent concerns [20,22], and dry season water stress is common [23]. In response, the Government of Nepal is advocating for the local management of water resources in some 2000 sub-watersheds [24]. Thus, we assessed the potential to link water users and upstream communities through a PES-type mechanism in one of these watersheds, the Sardukhola sub-watershed, in Eastern Nepal.
In the rest of the paper, we first describe our study area and review opportunities for improving welfare outcomes by strengthening ecosystem services. We then discuss a discrete choice experiment that was undertaken to better understand the demand for watershed services in downstream Dharan municipality, and the value that residents place on different attributes of water. We discuss the design of the choice experiment and surveys undertaken of upstream and downstream residents. Building on the results of the experiment, upstream costs and existing communitarian institutions, we propose a mechanism for coordinating community transactions to improve watershed services. This study was motivated by efforts made by the government and people of Dharan city in Eastern Nepal to protect their watershed to improve the drinking water supply.
2. Materials and Methods
2.1. Study Area
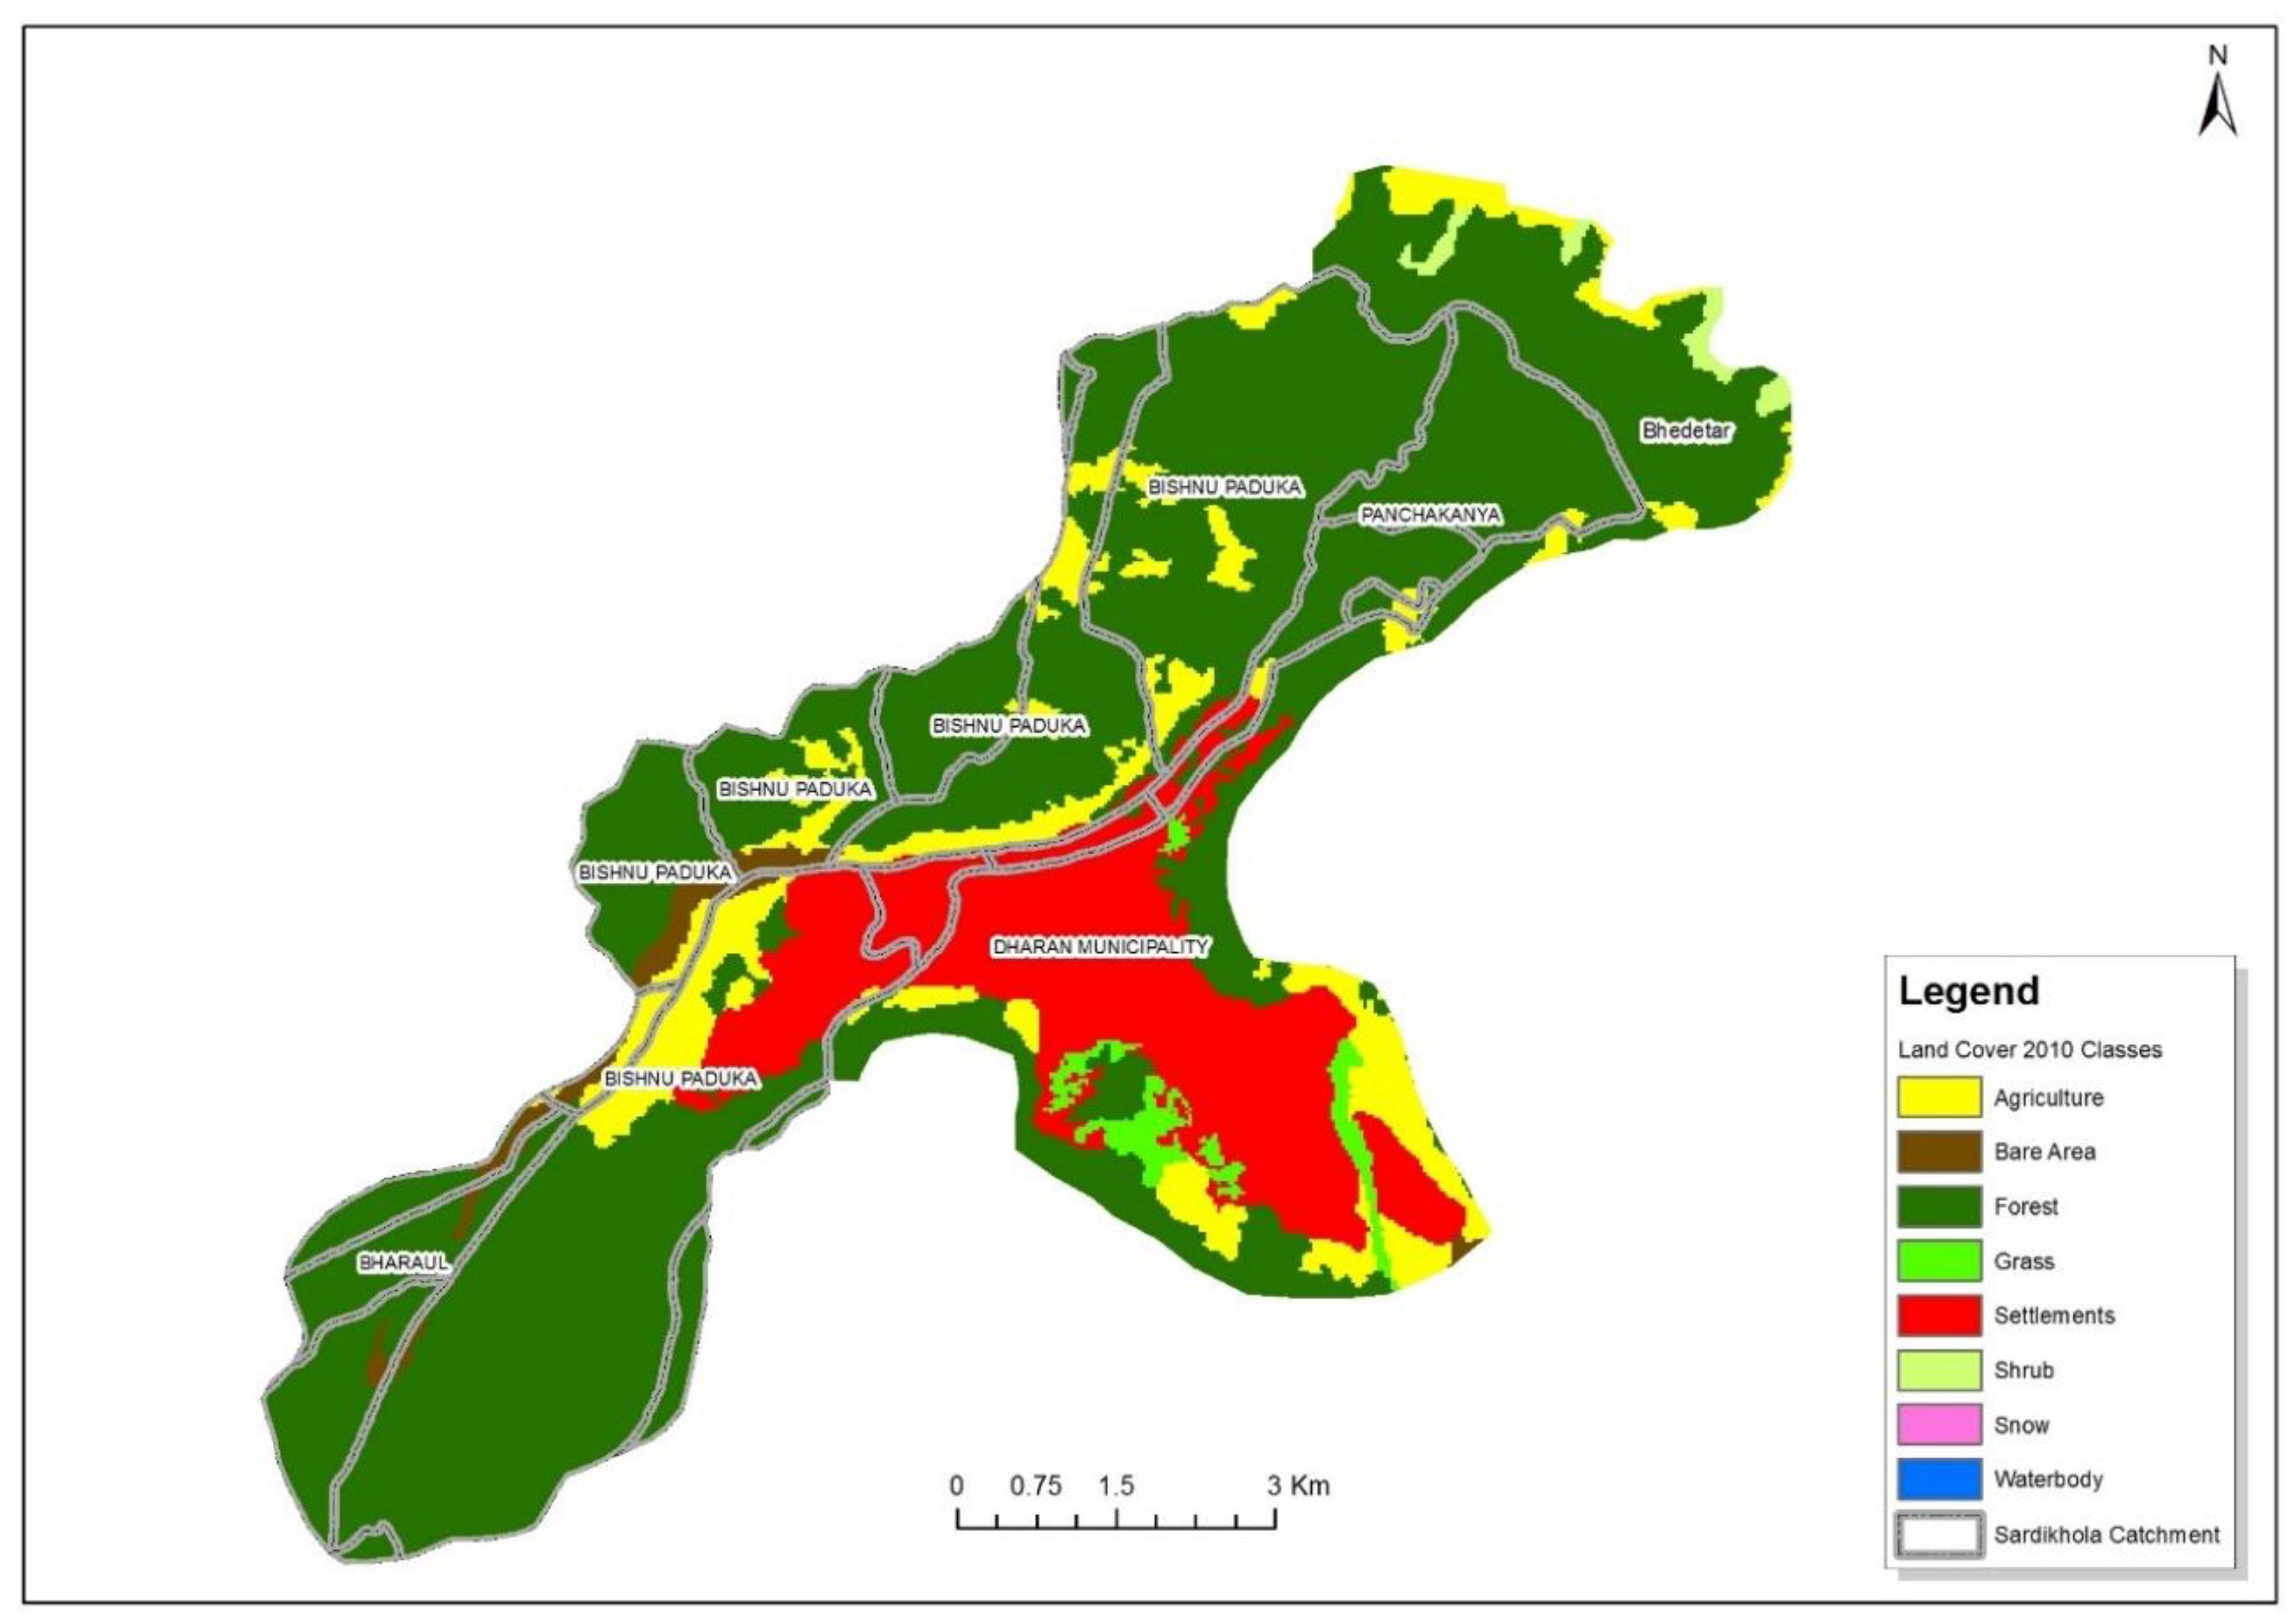
Our research examined the Sardukhola sub-watershed (see Figure 1), an area of 39.35 km2 in the fragile Siwalik hills of Eastern Nepal [25]. The Siwalik Hills, a mountainous range with an average elevation of 900 to 1200 m, are covered by vegetation, such as Quercus lantana, Macaranga indica, Treqia nudiflora and Adina cardifolia. Land cover in the Sardukhola watershed is dominated by forests (53%), followed by agriculture and settlements (22%) [25]. Crops grown include maize and millet and vegetables, such as radish, cabbage, Indian mustard and ginger. The watershed is populated by some 12,383 households. Some 10% of the population live in upstream areas, and the rest are residents of Dharan municipality [26].
The Sardu River is the mainwater source for Dharan, a growing city of approximately 150,000 people. The river drains into a reservoir, managed by the Nepal Water Supply Corporation (NWSC), which supplies about 60% of the city’s water demand during the rainy season and 25% of the demand during the rest of the year [25]. Since the reservoir fills only in the rainy season, NWSC also uses ground water to meet municipal needs. Residents obtain water from backyard tube wells and private tankers as well.
Water quality in the Nepalese middle hills is affected by sewage and agricultural run-off [27]. While changes in forest cover are more noticeably tied to increased precipitation and water availability at larger scales [28], they can also affect the local water supply. In the Siwaliks, big rain events and landslides contribute to erosion and siltation [29]. Grazing is another common driver of deforestation and soil erosion [30]. Soil erosion, in turn, can affect both water quality and quantity, damaging water treatment facilities and water storage tanks [31,32]. Currently, some 32 hectares of the Sardukhola watershed are affected by landslides, with erosion increasing during the rainy summers [25]. While most of Dharan’s residents have piped water connections, both ground and surface water tend to be polluted. Ground water is turbid in the wet season and suffers from bacterial contamination in the dry season [33]. Open defecation and lack of solid waste management also influence the water quality [25]. The municipality filters obvious contaminants, and households filter and boil water for drinking.
In 1976, recognizing these upstream–downstream linkages, the Government of Nepal initiated a watershed protection program around Sardukhola to protect drinking water sources and attempted to relocate local communities from upstream villages to the lowlands. However, the relocation program was unimplementable and settlements prevailed. Since then, while Dharan residents continue to dialogue with municipal authorities on water source protection, upstream households have largely been ignored.
There is currently no effective institutional architecture tying source water protection with municipal supply. NWSC, the agency that supplies municipal water to Dharan, does not have a decree to manage water sources [27]. It cannot generate funds locally or allocate them for water source conservation. This is a significant constraint to making any changes in the water supply. Partly in response to this, the Government created the Dharan Drinking Water Board in 2014, with representatives from public, private and community agencies and a mandate to handle municipal water distribution. The Board is also expected to address some of the challenges of water source management. In this context, the study team was invited to examine household preferences for watershed improvements in the region.
To better understand water demand and to identify prospects for improving ecosystem services, we undertook a series of investigations in the study region in 2013. We undertook focus group discussions in several communities to clarify ecosystem service ‘opportunities’, an important step in successfully designing economic instruments [34,35]. We also consulted with local officials from the District Forest Office, the District Soil Conservation Office, the Nepal Water Supply Corporation and Dharan municipality as well as local non-government organizations. We also conferred with scientists at the International Center for Integrated Mountain Development (ICIMOD) to allow us to understand the hydrology of the region. We then undertook a Discrete Choice Experiment in downstream Dharan municipality and a household survey in upstream areas to identify a strategy for better water management.
2.2. A Discrete Choice Experiment to Identify Downstream Preferences for Drinking Water Supply
To get a clear understanding of the demand for watershed services by water users and the different aspects of water supply that downstream users were willing to finance, we implemented a discrete choice experiment (DCE) in Dharan municipality. We chose this experimental approach because DCEs help to elicit preferences about policy or market changes when mechanisms that allow people to clearly reveal their demand for a good or service are absent [36,37].
In a DCE, people’s preferences are identified by asking them to choose among alternate choice scenarios that depict different levels of attributes of a public good or policy. Conceptually, household i obtains a utility () by choosing a policy alternative (j), based on the attributes of the good under consideration. We examine the determinants of this choice by first recognizing that utility can be decomposed into observable (V) and random (ε) components:
Thus, there is a probability (P) that any given household will choose alternative j among all possible policy alternatives (z), within a choice scenario (Ci). This probability function (P), which is influenced by attributes and household characteristics, is given by:
Vij, the indirect utility function, can be empirically estimated, allowing us to establish how much people are willing to pay for different attributes of a public good. In the Sardukhola DCE, the public good under consideration is drinking water, and two important attributes are the water quantity and quality. In addition, since the erosion of river banks and landslides are frequent problems, the extent of soil erosion is also an important consideration. A final attribute that influences water demand is the water tariff or the cost of water.
Running a DCE requires several steps. First, based on focus group discussions, preferences for different attributes and feasible changes need to be identified. The next step is the DCE design, based on attributes, sample size and an understanding of how households may respond to different scenarios. The third step is a household survey. Finally, the data are analyzed to examine determinants of choices and to estimate the demand for different attributes and willingness to pay for the public good—in this case, water.
2.3. DCE Implementation and Data Collection in Downstream and Upstream Areas
In all discrete choice experiments, focus groups are used to identify attributes of the policy under investigation. We carried out three focus group discussions amongst downstream water users (Dharan municipality) to identify preferences for different attributes of water, a range of levels for each attribute and interest in participating in a PES type scheme. A total of 53 people, almost equally divided between men and women, participated in the discussions. During these discussions, downstream water users identified upstream activities, such as open defecation, chemical fertilizer use, soil erosion from fragile topography and poor management of upstream areas, as contributors to water scarcity and poor quality.
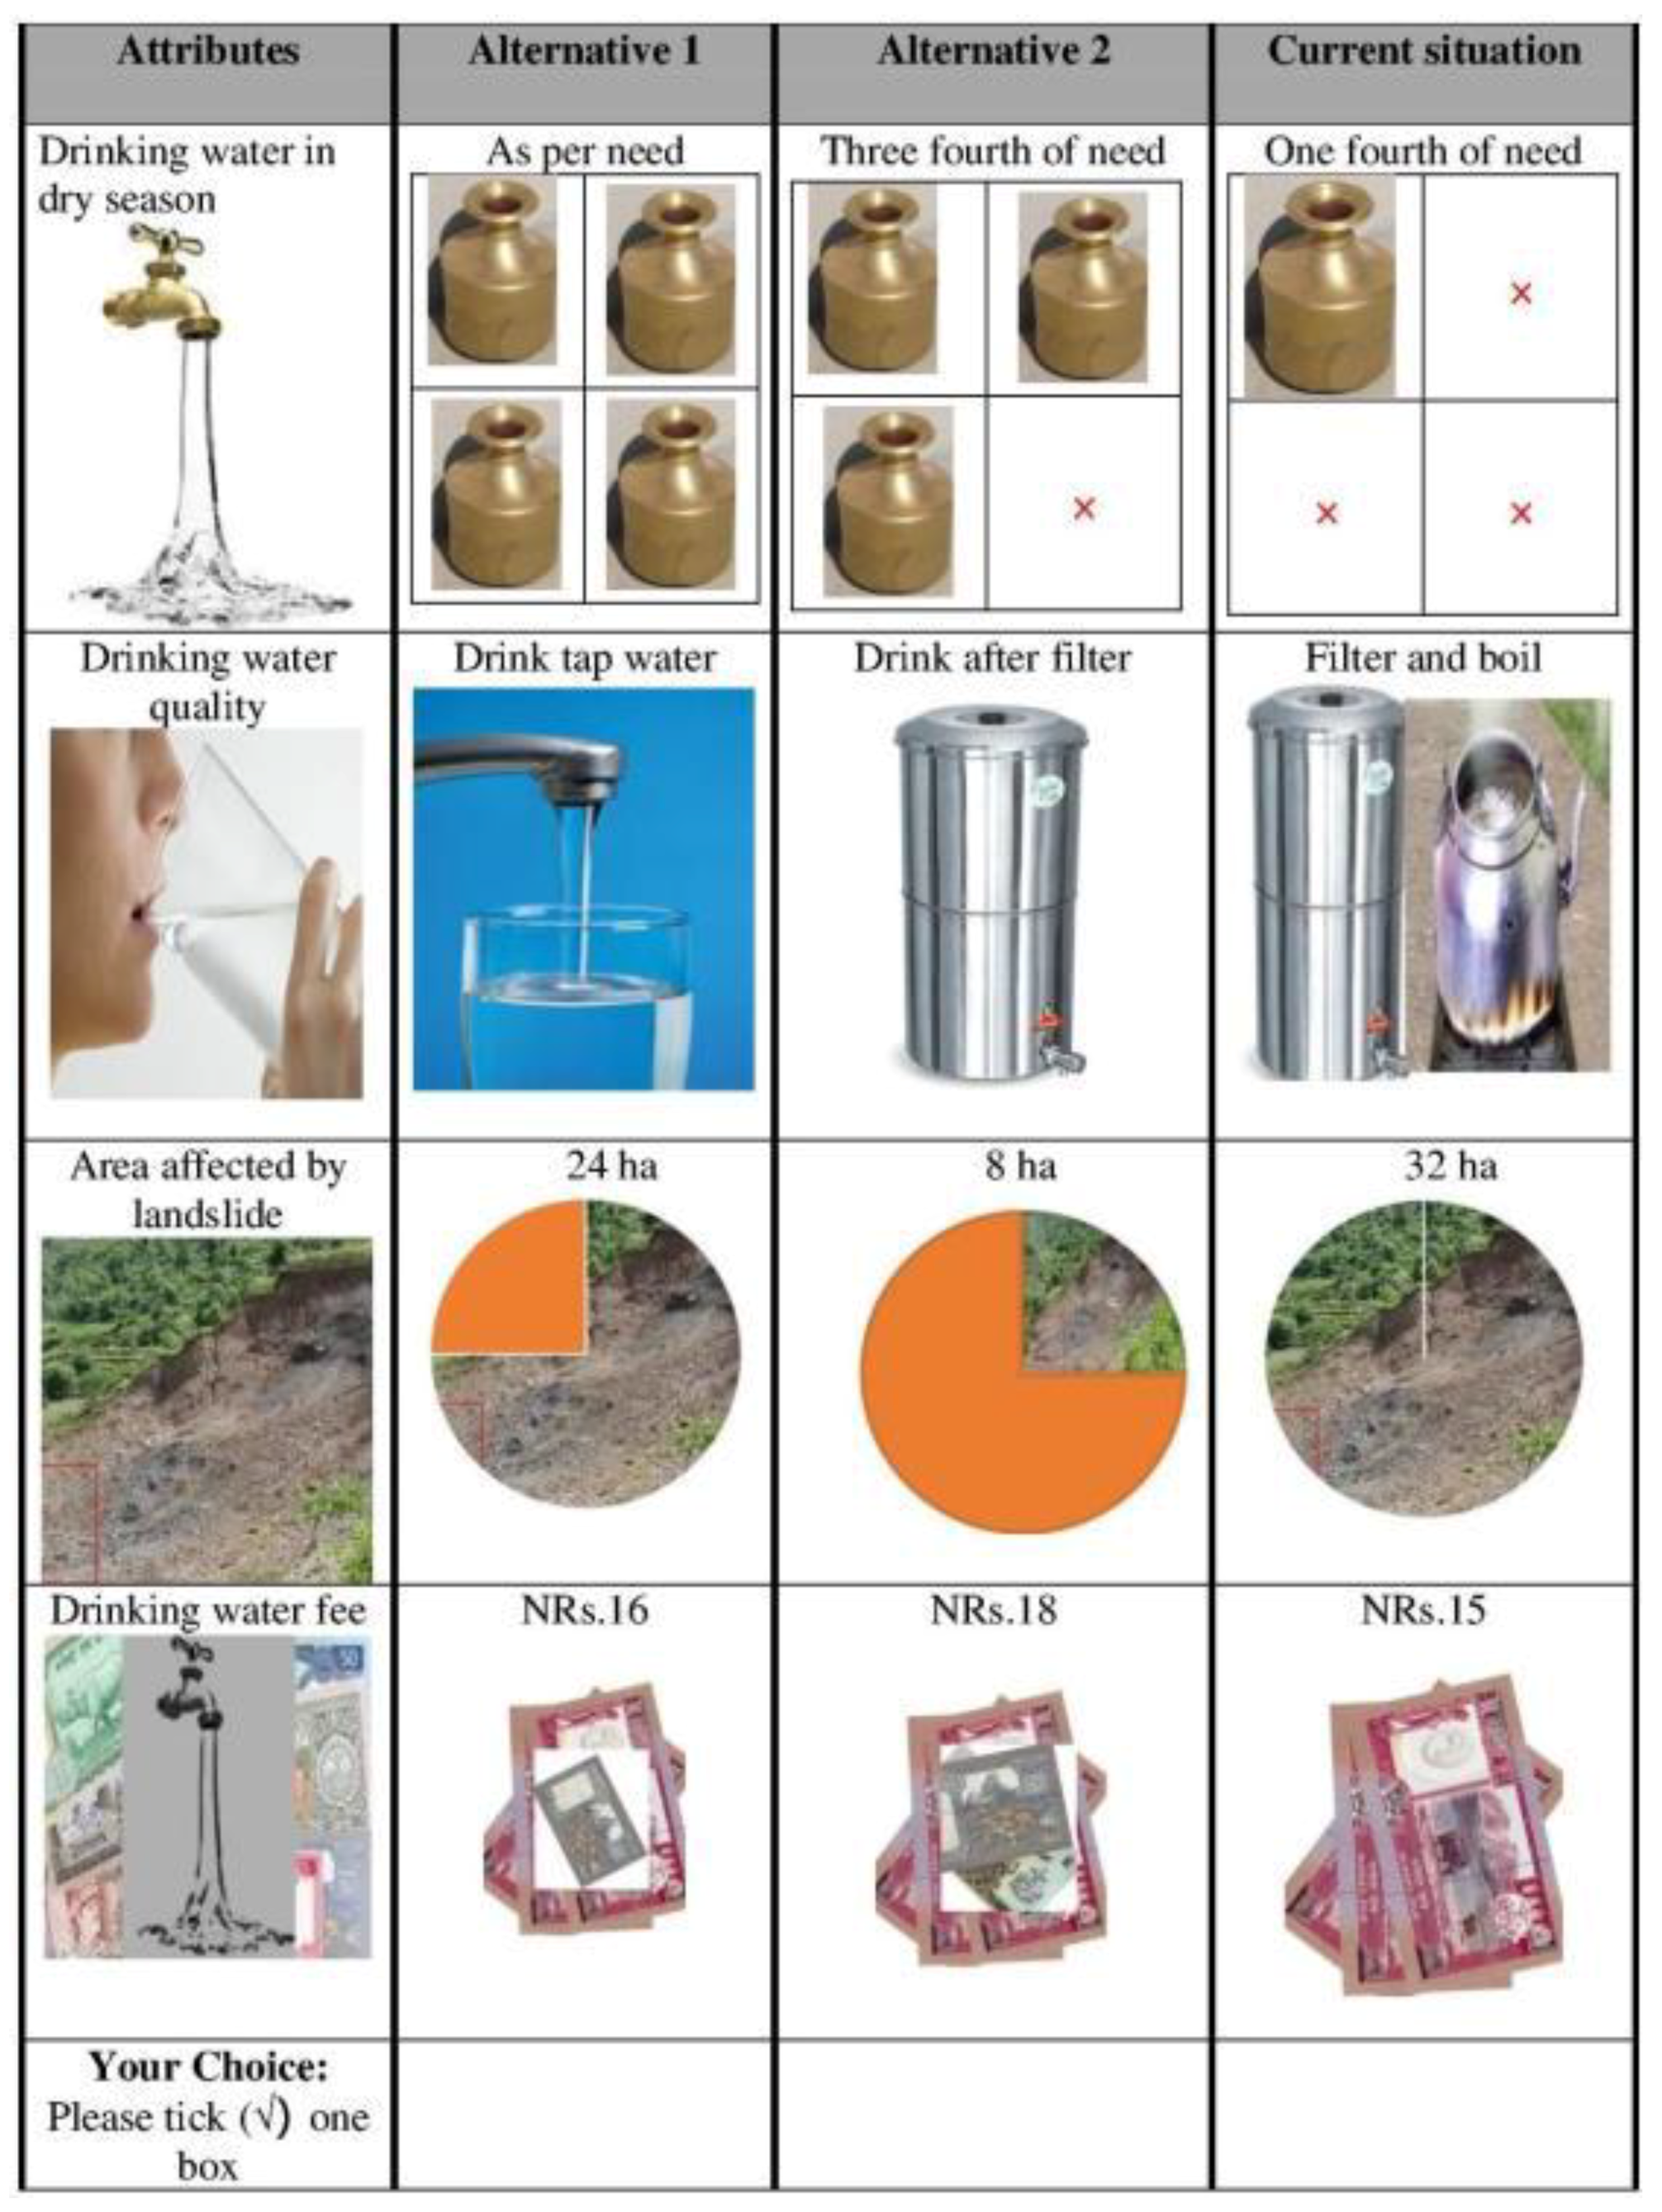
Based on the focus group discussions, four attributes of the watershed—water quantity, water quality, landslide protection and water tariff—were identified to be important for water supply. Table 1 shows each attribute and the levels of variation in the attributes identified through these discussions.
Following the identification of attributes, we used a D-efficient design, which produces significantly improved results while reducing the size of the experiment [38], to develop 20 choice scenarios for downstream water users. Each choice scenario presented the status quo and two policy alternatives, with each alternative offering a combination of different levels of the four attributes reported in Table 1. Since one policy alternative always reflected the status quo, users had a choice between the current situation and two other policy alternatives. Next, the 20 choice scenarios were divided into five versions of the survey questionnaire, with each version offering four choice scenairos (5 × 4 = 20). Each municipal respondent was presented with one version of the questionnaire.
To make the choice scenarios easy to understand, the DCE used pictorial choice cards (see Figure 2). Each respondent was presented with four choice scenarios in the form of four pictorial choice cards and asked to pick one policy alternative from each card. As shown in the pictorial choice card in Figure 2, each policy alternative included an offering of different levels of the four attributes. For instance, water quantity was depicted using traditional brass buckets, while water quality was depicted in terms of boiled, filtered or straight from the tap; land slides were represented in terms of areas affected by erosion, and water costs were presented at varying tariffs. Since respondents were presented with four pictorial cards, each respondent identified his or her preference by picking four policy alternatives in total.
To implement the DCE, we randomly selected five out of the nineteen wards in Dharan municipality and surveyed forty households in each ward. The first household was selected randomly and every 10th household was interviewed (ensuring locations on either side of the street were used) until 40 households had been surveyed in each ward. Given that there were five versions of the DCE questionnaire, every sixth interviewed household received the same questionnaire. In total, we surveyed 201 households in in Dharan municipality. Since, we presented four choice scenarios to each household, we obtained 804 observations from this survey. Respondents’ preferences were solicited after providing them with information about a ten-year watershed management plan that could be financed from the increased tariff. The management plan reflected ongoing discussions and proposals for the Sardukhola watershed.
In addition, we undertook two focus group discussions and a household survey in upstream areas. This information helped to cross-validate downstream residents’ ideas on upstream activities. During the focus group discussions, upstream households discussed three actions that could reduce their impact on water quality—reductions in ‘open defecation’, which would require toilets in each household, reduced use of chemical fertilizers and regularizing grazing. Households understood that they would be compensated if they undertook some of these actions. We followed the focus group discussions with a survey of 203 randomly selected households in upstream areas to further clarify these preferences. We asked a number of routine demographic and socio-economic questions in both surveys.
2.4. Empirical Strategy for Estimating Willingness to Pay
To establish city residents’ willingness to finance different attributes of watershed management, we empirically estimated Equation (3):
where Vij is the utility obtained by the ith household from the jth alternative, xi is a vector of attributes, β is a vector of coefficients that informs us how different attributes influence choices and η is a vector of individual deviations of random attributes. The attributes identified in this experiment were the water quantity, quality, erosion from landslides and cost of the water tariff. A vector of socio-economic variables (si), based on linkages with welfare changes and natural resource management [39,40], controlled for household heterogeneity. The socio-economic control variables included were household income, gender, age and drinking water use, and the coefficient (γ) reflected their effects. An alternative specific constant (ASC) is a dummy variable that captures the effects of unobservable components on the household choice of an alternative policy (1) relative to the status-quo (0). Socio-economic variables interact with the ASC to identify sources of heterogeneity in choice tasks.
We estimated Equation (3) as a Random Parameter Logit (RPL) and as a Conditional Logit (CL) model. The RPL model uses an iterative process to determine parameters that need to be estimated as random [41]. In our estimation, all the attributes were treated as non-random except for the cost variable, which was assumed to have a triangular distribution to guarantee finite moments [42,43] and to ensure that the implicit price estimates (Equation (4) below) were statistically defined.
The DCE allowed us to estimate the implicit price (IP) of each watershed attribute, k, (representing the water quality, water quantity and land erosion control). These implicit prices, which represent the value or residents’ willingness to pay for different attributes, were needed since we did not have markets to allow us to obtain explicit prices. We used the estimated coefficients from Equation (3) to calculate implicit prices, IP, as follows:
where, βk and βc are coefficients of attribute k and cost, respectively, σc is the estimated standard error of the cost attribute and ϕc is a draw from the triangular distribution [41]. Since both RPL and CL models provided similar results , and the CL requires more restrictive assumptions (Louviere et al., 2010), we used the RPL model results in Section 3.3 to estimate implicit prices.
The change in household welfare from implementing any planned watershed management policy alternative [44] is
where WTPhh is the household willingness to pay (WTP) for changes in the levels of attributes, ΔK, from the current situation to a new scenario.
Aggregating across all beneficiary households, the total financing that would be available if a watershed management plan was implemented is given by
where p is the proportion of respondents with a positive WTP.
3. Results
3.1. Descriptive Statistics
Table 2 presents survey results, underscoring the differences in land use activities between upstream and municipal areas of the Sardukhola watershed. Upstream areas are dominated by farmers—some 56% of surveyed upstream households indicated that agriculture is their main source of income, while only 3% of municipal households said as much. In both upstream and downstream areas, the average household has six members, and the household head has some four to five years of education. The percentage of women is higher than men, reflecting a broader social phenomenon of large-scale male out-migration in Nepal [45].
As expected, water is used differently by city residents relative to rural househods. Water quantity constraints become visible in the dry season. In the dry season, the majority (68%) of Dharan households uses tube wells to fulfill household water demand, a smaller proportion (9%) buys from private vendors and the rest adjust their consumption. In upstream areas, during the dry season, some 17% buy water from the market and the rest adjust their household activities. While most households in Dharan municipality have a toilet, over 40% of the households in upstream areas either do not have a toilet or use use a pit/ring toilet.
People in the region clearly understand the connections between source water protection and home water availability. A remarkable number of surveyed households (93%) view water as a service provided by forests. Some 69% of upstream and municipal respondents were aware that water sources need special management activities, and 88% of the sample households were confident that upstream activities influence water quality and quantity. Almost all upstream households (96%) stated that they would be interested in livelihood activities, such as agro-forestry, livestock management and organic farming, that would improve watershed services, if they received some form of support.
3.2. Demand for Watershed Services
Table 3 presents the estimation of Equation (3) using the CL and RPL models which offer similar results. As Table 3 shows, respondents prefer to see an increase in the drinking water supply during the dry season, as well as improvements in the drinking water quality, a decrease in the area affected by landslides and a lower fee for drinking water. The level of drinking water quality was treated as a dummy variable; hence, Table 3 presents three variables related to drinking water quality. The base dummy variable for water quality was the current water quality which requires water to be filtered and boiled before drinking. The results show that respondents do not have any significant interest in water quality that requires boiling water, relative to the status quo. They prefer to drink water that they can drink directly from a tap when compared to the current quality. Respondents also prefer water quality that that allows them to drink water after filtering using normal home water filters, relative to the status quo.
Table 3 indicates that men are more likely to select policy alternatives that improve watershed conditions relative to the status quo compared to their female counterparts. This may be because men are more cash rich than women in Nepal and are willing to pay more than women if asked to pay in cash [46] and because men often make financial decisions in a household [47]. Our results reinforce other watershed and forest related studies that have shown that older respondents tend to select policy alternatives less frequently than younger respondents [43,48]. This seems to indicate that younger people are more willing to seek change. As expected, household income is positively associated with watershed improving policy alternatives relative to the status quo [48]. Likewise, respondents who use more drinking water select policy alternatives more frequently relative to respondents using less drinking water.
3.3. Willingness-to-Pay for Different Services
Based on Equation (4) and the estimates from the RPL model in Table 3, the implicit prices of each attribute and their upper and lower bounds are identified in Table 4. Currently, households in Dharan pay NPR 15 per kiloliter of drinking water and generally filter and boil water for drinking. Households are willing to pay an additional 18 paisa (100 paisa equals one Nepalese rupee (NPR)) per kiloliter if there is a 10% increase in piped drinking water supply in the dry season (this assumes that households collect 432 L and 144 L water per day, on average, during the wet and dry seasons, respectively (IUCN 2011)). Thus, if piped drinking water met 35% of the dry season demand, instead of the current availability of 25% of demand, then households would be willing to pay NPR 15.18 per kiloliter. Similarly, the average WTP for the protection of one hectare of land from landslides is an additional 11 paisa per kiloliter. Currently, they do not pay anything directly for landslide prevention.
Table 4 shows that Dharan municipal households are willing to pay an additional NPR 2.19 and NPR. 2.75 per kiloliter for improvements in water quality to drinkable after filtering and drinkable without any treatment, respectively. This suggests that water quality is the most important issue to municipal households. Since the average monthly water consumption in Dharan is 10 kL per family, this suggests a willingness to spend an additional NPR 20–27 per month per household for improved water quality. This amounts to an approximate 11–15% increase in the payments that households currently make for water. We note for comparison that the estimated average monthly cost incurred in filtering water in Nepal’s capital city of Kathmandu is NPR 6 per household [49].
3.4. Financing a Management Plan
In 2011, IUCN Nepal worked with local stakeholders to create a management plan for the Sardukhola watershed to enable improved water quality and quantity [25]. Through the use of Equation (5), we estimated municipal households’ willingness to pay to operationalize two planned scenarios that incorporate suggestions from IUCN’s management plan and our focus group discussions.
The first management scenario (Scenario I) for Sardukhola involves a plan to double the water supply available to municipal households (to 144 L per day) during the dry season, protect eight hectares of land close to the reservoir from erosion and make tap water drinkable after filtering. The second scenario (Scenario II) requires improving drinking water quality to make water drinkable after filtering and does not include measures to protect against landslides or increase the quantity of water. Both scenarios would require upstream activities to improve water supply, such as regularization of grazing, a ban on open defecation, reducing the use of chemical fertilizer and pesticides in farming and solid waste management.
Using Equation (5) and implicit prices in Table 4, we estimated that municipal households are, on average, willing to make an annual payment of NPR 387 (USD 3.58) for Scenario I and NPR 270 (USD 2.50) for Scenario II. We note that the annual payments for Scenario I and II are 18% and 13% higher than the average annual water fees paid by households in our sample (NPR 2106 (USD 19.5) per household). These water payments amount to less than half a percent of per capita annual income (based on Nepal’s annual per capital income of NPR 88,268 (USD 817) in 2016/17 [50]. Aggregating over 27,750 municipal households in Dharan using Equation (6), the total financing available for Scenario I and Scenario II is NPR 11 million (USD 100,000) and NPR 8 million (USD 80,000) per year.
3.5. Upstream Management Costs and Institutional Design—The Supply Response
Upstream farmers have an array of priorities on which to spend any potential development funds received. However, upstream focus group participants unanimously stated that they would be willing to consider toilet construction, regularizing grazing and reducing the use of chemical fertilizer and pesticides in farmland close to water sources, if funding was available to support these changes.
3.5.1. The Costs of Upstream Management
In order to assess whether the financing available for watershed management is adequate to implement management plans, we calculated the costs that would be incurred for different upstream activities. Table 5 reports the costs of Sardukhola watershed management over the next 10 years.
Many of the costs in managing the watershed would be incurred as initial one-time costs, while some costs would be annual costs. To compare these different costs and to see if they match the annual financing that is available, investment costs were converted to an annualized cost using a 10 percent discount rate which is commonly used to finance development projects in Nepal.
To estimate the cost incurred in grazing management, we assumed that this cost is equivalent to the additional cost that a household incurs in practicing stall feeding of livestock. Using results from available literature, the additional cost of stall feeding was assumed to be USD 9 per livestock unit [51]. This number was multiplied by the average number of livestock units per upstream household to obtain the grazing management cost per household.
Sanitary practices and water quality could be improved if toilets were used in upstream areas. The cost of toilet construction is based on discussions with local communities on how much support they receive from non-government and other agencies to construct toilets. We provide estimates of the costs of building both proper toilets and pit latrines in Table 5.
The landslide protection cost is a per hectare engineering estimate based on the watershed management plan for Bhatkhola Watershed of Syangja district, Nepal [52]. We assumed that the cost estimates would be similar because of similarities in the landscape. The cost of riparian buffers to protect water resources from non-point pollution sources and water bank stabilization was also based on the Bhatkhola watershed management plan, and length information was from the Sardukhola watershed management plan [52,53].
Agricultural improvement costs refer to the cost of growing fruit crops (locally-grown oranges) in areas with high slopes [53]. In making this calculation, we considered the opportunity costs incurred by farmers during the first two years, since they can sell their fruit and obtain revenues only after year three. We obtained these cost figures from government estimates [54]. We were unable to identify the difference in profits between current crops and orange production. However, the orange crop is commonly grown in the region and is well suited for areas with steep slopes.
Table 5 indicates that the total annual cost of upstream management ranges fromUSD 46,632 to USD 49,369. This range of costs falls well within the USD 80,000–100,000 financing available through a PES scheme that charges downstream users for upstream management.
3.5.2. Developing a Plan for PES
Implementing a PES mechanism requires a credible institutional set-up, including some government support to facilitate trades and resolve conflicts [11,55]. In the context of Sardukhola, the state has a decisive role, since the Nepal Water Supply Corporation controls water distribution. However, as previously noted, the Corporation has no legal obligation to protect or manage drinking water sources even though water supply could be improved through watershed management [56]. This calls for the creation of new institutional arrangements.
We organized numerous discussions with stakeholders to talk about different PES-type schemes prevalent in Nepal and to understand their own local constraints. Through these discussions, an institutional architecture emerged with three local institutions—(i) the Dharan Drinking Water Board; (ii) the Sardu Watershed Protection Committee and (iii) the Sardu Upstream Committee—working together to implement a PES fund.
The existing Water Board in Sardukhola could act as a service buyer, collect payments and make agreements with the Sardu Upstream Committee, which would be the supplier of watershed services. The proposed Sardu Watershed Protection Committee, with representatives from the upstream community and water users as well as line agencies, would be responsible for watershed management, fund management and distribution to the Upstream Committee and monitoring. It would need to be legally registered as a new institution.
It would be feasible for the Watershed Protection Committee to monitor upstream input changes because the number of upstream farmers is relatively small, and actions such as open defecation and grazing are visible. Reductions in the use of fertilizers and pesticides, on the other hand, may be more difficult to implement even though upstream farmers have an incentive to produce organic goods because of a growing tourism industry. Rather, farmers could be encouraged or financed to develop structures (riparian buffers) to control run-off from fields so that agricultural pollutants do not enter streams and rivers.
The Water Board would need to monitor and regularly report on water quality in the reservoir. The Water Board could increase and collect tariff from water users if the water quality improves. However, setting up a monitoring and reporting mechanism may require funds and support from Non-Government Organizations.
Authorities in Dharan indicate that the proposed institutional set up will not run into bureaucratic hurdles, since the Local Self-Governance Act allows local governments to support such activities. This proposed institutional mechanism builds on a similar arrangement in Dhulikhel municipality, where local water management committees, involving upstream farmers and city residents, support water supply management [17]. PES schemes are also being tested in other areas in Nepal [10,57].
4. Discussion
Discussions with stakeholders and the findings of the DCE indicated that implementing a PES scheme is socially acceptable in the Sardukhola sub-watershed. The total annual estimated financing available, i.e., the amount that residents from Dharan municipality are willing to pay for watershed improvements, is NPR 8 million or USD 80,000 (Management Scenario II). This will require raising annual household water tariffs in Dharan Municipality by some 13%.
Based on variation in household willingness to pay for different attributes of water, watershed management activities should focus on improving the water quality. Interest in drinking water quality is to be expected since water borne diseases are a major problem in Nepal [58,59]. The results also seem reasonable because Dharan residents commonly use tap water for drinking and cooking, while they pump ground water for other uses.
Improving the downstream water supply will require erosion management and upstream changes in agriculture, grazing and sanitary practices. We estimate that the annual costs of upstream watershed management would range from USD 46,632 to USD 49,369. These costs would be covered by the estimated annual financing of USD 80,000 available from downstream residents.
An important consideration is whether the activities proposed (toilet construction, reduction in open grazing, changes in the use of pesticides and fertilizers and control of run-off into water streams) would be adequate to change the quantity or quality of drinking water. Our literature review, available watershed management plans and discussions with experts indicate that the proposed upstream changes would contribute to better ecosystem conditions and services. With latrine development, for instance, the Government of Nepal has an Open Defecation Free program, which organizes awareness activities along with providing latrines. Local governments are responsible for monitoring this program, which has been quite successful, especially in some rural areas [60]. While immediate changes may not occur, the proposed changes will influence land use and water quality in the medium term. In addition, some additional investments to control landslides and construct small ponds for irrigation may be required [25].
Another issue is whether upstream farmers will stick to any unbinding promises they make. Most payments in PES programs are either input or output based [13,15,61,62]. In the Sardukhola case, upstream communities were informed that they would be paid based on actions they undertook. During stakeholder consultations, downstream households also agreed to make upfront payments to initiate watershed management activities. So, the proposed scheme is designed to finance inputs or changes in upstream activities. This arrangement is likely to succeed in small watersheds where it is feasible to monitor people’s actions [57]. Sardhukhola is a sub-watershed where property rights are clearly established. Hence, monitoring and verification of upstream activities is unlikely to be difficult once payment contracts are made.
Fiscal arrangements and transaction costs need serious attention in PES implementation [7,11]. Since trades and transactions involve multiple parties, it is important that there is some participation of central and local governments, along with private and community-based organizations [63]. In Sardukhola, the plan is to use any surplus funds not spent on upstream management to fund the transaction costs of establishing and operating the PES program. Most certainly, there will be costs associated with awareness raising, coordinating and managing transactions. Some funds can also be set aside for longer-term forest improvement and land slide protection. Water quality monitoring would also need to be undertaken to ensure that water users receive the benefits they are paying for [64]. Given that fiscal transfers are involved, it is good that the local and sector agencies responsible for water have agreed to participate in the proposed institutional arrangement for setting up a PES scheme.
5. Conclusions
This paper discussed a local policy instrument to improve water supply in remote parts of the developing world. Developing a PES-type mechanism in the Sardukhola sub-watershed in Nepal seems both socially acceptable and financially feasible. Choice experiments allowed us to assess what households are willing to pay for water quality improvement. In this case, the average household in Dharan is willing to pay NPR 270 (USD 2.50), or 13% more than the current average annual tariff, to obtain water that is drinkable after filtering. A management plan for the watershed developed in 2011 indicates that this water quality is achievable by undertaking household waste management, grazing regularization and improving agricultural practices [25].
The limited mandate of existing water supply agencies can be a barrier for developing innovative mechanisms to improve water supply. Through discussions with stakeholders, we suggest that some barriers can be removed through better coordination among local institutions. These institutions would take on the role of (i) ecosystem service consumers; (ii) ecosystem service producers; and (iii) a monitoring agency represented by both consumers and producers. Any transaction costs could be further reduced through cross-agency interactions.
In the case of the Sardukhola PES scheme, the next step involves building trust between the Dharan Drinking Water Board and the Sardu Upstream Committee. The 2015 Constitution of Nepal (Schedule 8) legalizes and delegates a number of powers and activities under the jurisdiction of local governments. According to these new legal provisions, drinking water management, conservation of watersheds and wetlands and environment and biodiversity conservation fall within the authority of local municipalities. Based on this legal structure, Dharan municipality could register and regulate a PES institution.
Author Contributions
In this paper, data collection, analysis and initial draft development was undertaken by R.K.R. Paper design and re-writing was undertaken by P.S. Project administration and funding was through L.D.B., M.N. provided initial supervision and help with the design of the study.
Funding
This research received funding from donors who support the South Asian Network for Development and Environmental Economics (SANDEE) and ICIMOD. This study was a part of joint project between SANDEE and the Himalayan Climate Change Adaptation Programme (HICAP). HICAP is implemented jointly by ICIMOD, CICERO and Grid-Arendal in collaboration with local partners and is funded by the Ministry of Foreign Affairs, Norway and Swedish International Development Agency (Sida). The views and interpretations in this publication are those of the author(s).
Acknowledgments
We thank the donors who supported SANDEE and ICIMOD’s HICAP programme. We also acknowledge the support and cooperation we received from many community members and government officials in our data collection efforts.
Conflicts of Interest
The authors declare no conflict of interest.
References
- Gurung, P.; Sherpa, T.Y.C. Freshwater Scarcity and Sustainable Water Management in the Hindu Kush-Himalayan (HKH) Region. Hydro Nepal J. Water Energy Environ. 2014, 15, 42–47. [Google Scholar] [CrossRef]
- Achet, S.H.; Fleming, B. A watershed management framework for mountain areas: Lessons from 25 years of watershed conservationin Nepal. J. Environ. Plan. Manag. 2006, 49, 675–694. [Google Scholar] [CrossRef]
- Merz, J.; Nakarmi, G.; Shrestha, S.K.; Dahal, B.M.; Dangol, P.M.; Dhakal, M.P.; Dongol, B.S.; Sharma, S.; Shah, P.B.; Weingartner, R. Water: A Scarce Resource in Rural Watersheds of Nepal’s Middle Mountains. Mt. Res. Dev. 2003, 23, 41–49. [Google Scholar] [CrossRef]
- Thapa, G.B.; Paudel, G.S. Farmland degradation in the mountains of Nepal: A study of watersheds ‘with’ and ‘without’ external intervention. Land Degrad. Dev. 2002, 13, 479–493. [Google Scholar] [CrossRef]
- Kosoy, N.; Martinez-Tuna, M.; Muradian, R.; Martinez-Alier, J. Payments for environmental services in watersheds: Insights from a comparative study of three cases in Central America. Ecol. Econ. 2007, 61, 446–455. [Google Scholar] [CrossRef] [Green Version]
- Bellver-Domingo, A.; Hernández-Sancho, F.; Molinos-Senante, M. A review of Payment for Ecosystem Services for the economic internalization of environmental externalities: A water perspective. Geoforum 2016, 70, 115–118. [Google Scholar] [CrossRef]
- Alston, L.J.; Andersson, K.; Smith, S.M. Payment for environmental services: Hypotheses and evidence. Annu. Rev. Resour. Econ. 2013, 5, 139–159. [Google Scholar] [CrossRef] [PubMed]
- Choi, I.-C.; Shin, H.-J.; Nguyen, T.T.; Tenhunen, J. Water policy reforms in South Korea: A historical review and ongoing challenges for sustainable water governance and management. Water 2017, 9, 717. [Google Scholar] [CrossRef]
- Wunder, S. The efficiency of payments for environmental services in tropical conservation. Conserv. Biol. 2007, 21, 48–58. [Google Scholar] [CrossRef] [PubMed]
- Rai, R.K.; Nepal, M.; Bhatta, L.D.; Das, S.; Khadayat, M.S.; Somanathan, E.; Baral, K. Ensuring Water Availability to Water Users through Incentive Payment for Ecosystem Services Scheme: A Case Study in a Small Hilly Town of Nepal. Water Econ. Policy 2017, 1850002. [Google Scholar] [CrossRef]
- Fauzi, A.; Anna, Z. The complexity of the institution of payment for environmental services: A case study of two Indonesian PES schemes. Ecosyst. Serv. 2013, 6, 54–63. [Google Scholar] [CrossRef]
- Gómez-Baggethun, E.; de Groot, R.; Lomas, P.L.; Montes, C. The history of ecosystem services in economic theory and practice: From early notions to markets and payment schemes. Ecol. Econ. 2010, 69, 1209–1218. [Google Scholar] [CrossRef]
- To, P.X.; Dressler, W.H.; Mahanty, S.; Pham, T.T.; Zingerli, C. The prospects for payment for ecosystem services (PES) in Vietnam: A look at three payment schemes. Hum. Ecol. 2012, 40, 237–249. [Google Scholar] [CrossRef] [PubMed]
- Echavarria, M.; Vogel, J.; Alban, M.; Meneses, F. The Impacts of Payments for Watershed Services in Ecuador: Emerging Lessons from Pimampiro and Cuenca; IIED: Quito, Ecuador, 2004. [Google Scholar]
- Asquith, N.M.; Vargas, M.T.; Wunder, S. Selling two environmental services: In-kind payments for bird habitat and watershed protection in Los Negros, Bolivia. Ecol. Econ. 2007, 65, 675–684. [Google Scholar] [CrossRef]
- Alix-Garcia, J.M.; Shapiro, E.N.; Sims, K.R.E. Forest conservation and slippage: Evidence from Mexico’s national payments for ecosystem services program. Land Econ. 2012, 88, 613–638. [Google Scholar] [CrossRef]
- Bhatta, L.D.; van Oort, B.E.H.; Rucevska, I.; Baral, H. Payment for ecosystem services: Possible instrument for managing ecosystem services in Nepal. Int. J. Biodivers. Sci. Ecosyst. Serv. Manag. 2014, 10, 289–299. [Google Scholar] [CrossRef]
- Wunder, S. When payments for environmental services will work for conservation. Conserv. Lett. 2013, 6, 230–237. [Google Scholar] [CrossRef] [Green Version]
- CBS. National Population and Housing Census 2011 (National Report) Central Bureau of Statistics; CBS: Kathmadu, Nepal, 2012. [Google Scholar]
- Maharjan, R.; Lekhak, B.; Shrestha, C.D.; Shrestha, J. Detection of enteric bacterial pathogens (Vibrio cholerae and Escherichia coli O157) in childhood diarrhoeal cases. Sci. World 2007, 5, 23–26. [Google Scholar] [CrossRef]
- Domènech, L.; March, H.; Saurí, D. Contesting large-scale water supply projects at both ends of the pipe in Kathmandu and Melamchi Valleys, Nepal. Geoforum 2013, 47, 22–31. [Google Scholar] [CrossRef]
- Pokhrel, D.; Viraraghavan, T. Diarrhoeal diseases in Nepal vis-à-vis water supply and sanitation status. J. Water Health 2004, 2, 71–81. [Google Scholar] [CrossRef] [PubMed] [Green Version]
- Price, J.I.; Janmaat, J.; Sugden, F.; Bharati, L. Water storage systems and preference heterogeneity in water-scarce environments: A choice experiment in Nepal’s Koshi River Basin. Water Resour. Econ. 2016, 13, 6–18. [Google Scholar] [CrossRef]
- National Planning Commission. Three Year Interim Plan (2007/08–2009/10); National Planning Commission: Kathmandu, Nepal, 2007.
- IUCN Nepal. Integrated Watershed Conservation and Management Plan: Sardu Watershed, Dharan, Sunsari, Nepal; IUCN Nepal Country Office: Kathmandu, Nepal, 2011. [Google Scholar]
- Central Bureau of Statistics. National Populationa and Housing Census 2011: Caste/Ethnicity; Central Bureau of Statistics, Government of Nepal: Kathmandu, Nepal, 2013.
- Manfredi, E.C.; Flury, B.; Viviano, G.; Thakuri, S.; Khanal, S.N.; Jha, P.K.; Maskey, R.K.; Kayastha, R.B.; Kafle, K.R.; Bhochhibhoya, S. Solid waste and water quality management models for Sagarmatha National Park and Buffer Zone, Nepal: Implementation of a participatory modeling framework. Mt. Res. Dev. 2010, 30, 127–142. [Google Scholar] [CrossRef]
- Ellison, D.; Futter, M.N.; Bishop, K. On the forest cover–water yield debate: From demand-to supply-side thinking. Glob. Chang. Biol. 2012, 18, 806–820. [Google Scholar] [CrossRef]
- Ghimire, M. Landslide occurrence and its relation with terrain factors in the Siwalik Hills, Nepal: Case study of susceptibility assessment in three basins. Nat. Hazards 2011, 56, 299–320. [Google Scholar] [CrossRef]
- DFRS. Churia Forests of Nepal. Forest Resource Assessment (FRA) Nepal; DFRS: Kathmadu, Nepal, 2014.
- McBroom, M.; Thomas, T.; Zhang, Y. Soil erosion and surface water quality impacts of natural gas development in east Texas, USA. Water 2012, 4, 944–958. [Google Scholar] [CrossRef]
- Pimentel, D.; Harvey, C.; Resosudarmo, P.; Sinclair, K.; Kurz, D.; McNair, M.; Crist, S.; Shpritz, L.; Fitton, L.; Saffouri, R. Environmental and economic costs of soil erosion and conservation benefits. Science 1995, 267, 1117–1122. [Google Scholar] [CrossRef] [PubMed]
- Dongol, F.G.; Jehangir, M.; Joshi, B.K.; Ma, X.; Nakarmi, G.; Prajapati-Merz, B.; Salam, A.; Satyal, G.S.; Shrestha, S.; Verma, P.K. Water related key issues in meso-scale of the Hindu Kush Himalayas. In Renewable Natural Resources Management for Mountain Communities; International Centre for Integrated Mountain Development: Kathmandu, Nepal, 2005; Volume 115. [Google Scholar]
- Rode, J.; Gómez-Baggethun, E.; Krause, T. Motivation crowding by economic incentives in conservation policy: A review of the empirical evidence. Ecol. Econ. 2015, 117, 270–282. [Google Scholar] [CrossRef]
- Rawlins, M.; Westby, L. Community participation in payment for ecosystem services design and implementation: An example from Trinidad. Ecosyst. Serv. 2013, 6, 117–121. [Google Scholar] [CrossRef]
- Louviere, J.J.; Hensher, D.A.; Swait, J.D. Stated Choice Methods: Analysis and Application; Cambridge University Press: New York, NY, USA, 2000. [Google Scholar]
- Ben-Akiva, M.; Lerman, S. Discrete Choice Analysis: Theory and Application to Travel Demand; MIT Press: Cambridge, MA, USA, 1985. [Google Scholar]
- Rose, J.M.; Bliemer, M.C.J.; Hensher, D.A.; Collins, A.T. Designing efficient stated choice experiments in the presence of reference alternatives. Transp. Res. Part B Methodol. 2008, 42, 395–406. [Google Scholar] [CrossRef]
- Sangkapitux, C.; Neef, A.; Polkongkaew, W.; Pramoon, N.; Nonkiti, S.; Nanthasen, K. Willingness of upstream and downstream resource managers to engage in compensation schemes for environmental services. Int. J. Commons 2009, 3, 41–63. [Google Scholar] [CrossRef]
- Rai, R.K.; Scarborough, H. Economic value of mitigation of plant invaders in a subsistence economy: Incorporating labour as a mode of payment. Environ. Dev. Econ. 2013, 18, 225–244. [Google Scholar] [CrossRef]
- Hensher, D.A.; Rose, J.M.; Greene, W.H. Applied Choice Analysis: A Primer; Cambridge University Press: Cambridge, UK, 2005. [Google Scholar]
- Daly, A.; Hess, S.; Train, K. Assuring finite moments for willingness to pay in random coefficient models. Transportation 2012, 39, 19–31. [Google Scholar] [CrossRef]
- Rai, R.K.; Shyamsundar, P.; Nepal, M.; Bhatta, L.D. Differences in demand for watershed services: Understanding preferences through a choice experiment in the Koshi Basin of Nepal. Ecol. Econ. 2015, 119, 274–283. [Google Scholar] [CrossRef]
- Hanemann, M. Welfare evaluations in contingent valuation experiments with discrete responses. Am. J. Agric. Econ. 1984, 66, 332–341. [Google Scholar] [CrossRef]
- Rai, R.K.; Bhatta, L.D.; Acharya, U.; Bhatta, A.P. Assessing Climate-resilient Agriculture for Smallholders. Environ. Dev. 2018. [Google Scholar] [CrossRef]
- Rai, R.K.; Scarborough, H. Nonmarket valuation in developing countries: Incorporating labour contributions in environmental benefits estimates. Aust. J. Agric. 2015, 59, 479–498. [Google Scholar] [CrossRef]
- Schneebaum, A.; Mader, K. The Gendered Nature of Intra-Household Decision Making in and across Europe; WU Vienna University of Economics and Business: Vienna, Austria, 2013. [Google Scholar]
- Lehtoranta, V.; Sarvilinna, A.; Väisänen, S.; Aroviita, J.; Muotka, T. Public values and preference certainty for stream restoration in forested watersheds in Finland. Water Resour. Econ. 2017, 17, 56–66. [Google Scholar] [CrossRef]
- Pattanayak, S.K.; Yang, J.-C.J.; Whittington, D.; Kumar, K.C.B. Coping with unreliable public water supplies: Averting expenditures by households in Kathmandu, Nepal. Water Resour. Res. 2005, 41, 1–11. [Google Scholar] [CrossRef]
- Ministry of Finance. Economic Survey- Fiscal Year 2016/17; Ministry of Finance: Kathmadu, Nepal, 2017.
- Patil, M.; Kumar, P.; Teggelli, R.G.; Ubhale, P. A Study on Comparison of Stall Feeding System of Goat Rearing with Grazing System. APCBEE Procedia 2014, 8, 242–247. [Google Scholar] [CrossRef]
- DSCWM. Integrated Sub-Watershed Management Plan—Bhatkhola Subwatershed, Syangja; DSCWM: Kathmadu, Nepal, 2014.
- National Planning Commission. Tenth Plan (2002–2007); National Planning Commission: Kathmandu, Nepal, 2002.
- Department of Agriculture. Average Cost of Production and Gross Profit of Fruit Farming in Nepal 2071/07 (2014/15); Department of Agriculture: Kathmandu, Nepal, 2014.
- Shapiro-Garza, E. Contesting the market-based nature of Mexico’s national payments for ecosystem services programs: Four sites of articulation and hybridization. Geoforum 2013, 46, 5–15. [Google Scholar] [CrossRef]
- Government of Nepal. Third Amendment of the Nepal Water Supply Corporation Act 2007; Government of Nepal: Kathmadu, Nepal, 2007.
- Bhatta, L.D.; Khadgi, A.; Rai, R.K.; Tamang, B.; Timalsina, K.; Wahid, S. Designing community-based payment scheme for ecosystem services: A case from Koshi Hills, Nepal. Environ. Dev. Sustain. 2018, 20, 1831–1848. [Google Scholar] [CrossRef]
- Bhatta, D.; Bangtrakulnonth, A.; Tishyadhigama, P.; Saroj, S.D.; Bandekar, J.R.; Hendriksen, R.S.; Kapadnis, B.P. Serotyping, PCR, phage-typing and antibiotic sensitivity testing of Salmonella serovars isolated from urban drinking water supply systems of Nepal. Lett. Appl. Microbiol. 2007, 44, 588–594. [Google Scholar] [CrossRef] [PubMed] [Green Version]
- Shrestha, S.P.; Hennig, A.; Parija, S.C. Prevalence of rhinosporidiosis of the eye and its adnexa in Nepal. Am. J. Trop. Med. Hyg. 1998, 59, 231–234. [Google Scholar] [CrossRef] [PubMed]
- Dahal, K.R.; Adhikari, B.; Tamang, J. Sanitation coverage and impact of open defecation free (ODF) zone with special reference to Nepal: A review. Int. J. Eng. Res. Appl. 2014, 4, 1–11. [Google Scholar]
- Asquith, N.M.; Vargas Ríos, M.T.; Smith, J. Can Forest-protection carbon projects improve rural livelihoods? Analysis of the Noel Kempff Mercado climate action project, Bolivia. Mitig. Adapt. Strateg. Glob. Chang. 2002, 7, 323–337. [Google Scholar] [CrossRef]
- Wunder, S.; Albán, M. Decentralized payments for environmental services: The cases of Pimampiro and PROFAFOR in Ecuador. Ecol. Econ. 2008, 65, 685–698. [Google Scholar] [CrossRef]
- Vatn, A. An institutional analysis of payments for environmental services. Ecol. Econ. 2010, 69, 1245–1252. [Google Scholar] [CrossRef]
- Jack, B.; Kousky, C.; Sims, K. Designing payments for ecosystem services: Lessons from previous experience with incentive-based mechanisms. Proc. Natl. Acad. Sci. USA 2008, 105, 9465–9470. [Google Scholar] [CrossRef] [PubMed] [Green Version]
Figure 1.
Sardukhola Watershed.

Figure 2.
An example of a pictorial choice card presented to downstream households as part of the Discrete Choice Experiment.
Figure 2.
An example of a pictorial choice card presented to downstream households as part of the Discrete Choice Experiment.


Table 1.
Selected attributes of watershed management and their levels identified for assessing downstream (Dharan municipality) demand for water.
Table 1.
Selected attributes of watershed management and their levels identified for assessing downstream (Dharan municipality) demand for water.
| Attributes | Description | Levels |
|---|---|---|
| Drinking Water Quality | Quality of drinking water supplied to downstream households. This is measured by the type of treatment required before drinking. Currently, water requires filtering (using normal home water filter) first and then boiling to make it drinkable. |
|
| Drinking Water Quantity | Quantity of water available for household use during the dry season (February–May). This is measured by the percentage of water supplied during the dry season. Currently, on average, each household gets approximately 25% of its ‘required’ dry season quantity. |
|
| Soil Erosion and Landslides | Mass wasting of river banks and soil erosion in midstream and upstream areas. This is measured by the area of land vulnerable to landslides and soil erosion. Currently, about one percent of the watershed area (32 ha) is covered by landslides. |
|
| Water fee | This is the price per kilo liter (1000 L) of water supplied by the Nepal Water Supply Corporation. The current price is NPR 1. 15.00 per kilo liter. |
|
* Levels used in the current situation. 1 NPR is the Nepali currency. 1 USD ~ NPR 108 in 2013.
Table 2.
Socio-economic characteristics of sample households (standard deviations in parentheses).
| Variables | Upstream | Dharan Municipality |
|---|---|---|
| Household size | 5.40 (2.10) | 5.52 (2.19) |
| Age (years) | 39.16 (14.18) | 42.98 (14.66) |
| Education (years) | 3.59 (1.93) | 4.52 (2.13) |
| Female | 64% | 62% |
| Agriculture as the main source of income | 56% | 3% |
| Irrigated land (ha) | 0.07 (0.19) | 0.14 (0.66) |
| Unirrigated land (ha) | 0.19 (0.23) | 0.02 (0.08) |
| Drinking water demand (L/day) | 219 (465) | 589 (247) |
| Water purchased in the dry season (% of households) | 17 | 9 |
| Tube well water used in the dry season (% of households) | 0 | 68 |
| Water demand reduced in dry season (% of households) | 83 | 23 |
Table 3.
Results of regression models (downstream /Dharan municipality).
| Variables | Conditional Logit (CL) | Random Parameter Logit (RPL) |
|---|---|---|
| Attributes | ||
| Drinking water quantity | 1.92 × 10⁻² (7.64 × 10⁻³) ** | 1.90 × 10⁻² (7.77 × 10⁻³) ** |
| Erosion | −0.115 (1.27 × 10⁻²) *** | −0.115(1.28 × 10⁻²) *** |
| Drink after boiling | 0.977 (1.03) | 1.09 (1.06) |
| Drink after filtering | 2.13 (1.02) ** | 2.26 (1.05) ** |
| Drink directly from tap | 2.69 (1.05) ** | 2.83 (1.08) *** |
| Drinking water fee | −1.066 (0.94 × 10⁻²) *** | −1.08 (0.102) *** |
| Characteristics | ||
| Household income | 0.772 (0.271) *** | 0.779 (0.274) *** |
| Male | 0.857 (0.507) * | 0.881 (0.515) * |
| Drinking water demand | 1.573 × 10⁻³ (6.97 × 10⁻⁴) ** | 1.59 × 10⁻³ (7.03 × 10⁻⁴) ** |
| Age | −5.63 × 10⁻² (1.48 × 10⁻²) *** | −5.80 × 10⁻² (1.51 × 10⁻²) *** |
| ASC | −2.22 × 10⁻² (0.103) | −2.05 × 10⁻² (0.104) |
| Standard deviations of random parameters | ||
| Drinking water fee (T) | 0.542 (5.13 × 10⁻²) *** | |
*, ** and *** denote significant at 10%, 5% and 1% respectively. Standard error in parentheses.
Table 4.
Implicit prices and their confidence intervals of attributes.
| Attributes | Implicit Prices (NPR) |
|---|---|
| Drinking water quantity increase by 10% (per kilo liter) | 0.18 (0.14–0.22) |
| Erosion (Reduction of erosion per ha) | 0.11 (0.09–0.13) |
| Drinking water quality—drink after filtering (per kilo liter) | 2.19 (1.70–2.68) |
| Drinking water quality—drink directly from tap (per kilo liter) | 2.75 (2.15–3.35) |
Table 5.
Costs of interventions in upstream areas.
| Activities | No. of Households (HH) or Hectare (Ha) to Be Covered | Unit Cost (NPR) per HH or Ha | Total Cost (NPR) | Total Cost (USD) | Annualized Cost (10% Discount Rate and 10 Year Life Span) in USD | |
|---|---|---|---|---|---|---|
| Grazing Regularization (HH) | 299 | 3500 | 1,046,500 | 9690 | 9690 | 9690 |
| Pit toilet (HH) | 121 | 25,000 | 3,025,000 | 28,009 | 4563 | 0 |
| Proper toilet (HH) | 121 | 40,000 | 4,840,000 | 44,815 | 0 | 7300 |
| Landslide protection (Ha) | 32 | 100,000 | 3,200,000 | 29,630 | 4826 | 4826 |
| Agriculture improvement (Ha) | 81 | 204,559 | 16,569,279 | 153,419 | 24,991 | 24,991 |
| Riparian buffers (km) | 17 | 100,000 | 1,700,000 | 15,741 | 2562 | 2562 |
| Total Costs for Upstream Watershed Management (USD) | 46,632 | 49,369 | ||||
© 2018 by the authors. Licensee MDPI, Basel, Switzerland. This article is an open access article distributed under the terms and conditions of the Creative Commons Attribution (CC BY) license (http://creativecommons.org/licenses/by/4.0/).
Share and Cite
MDPI and ACS Style
Rai, R.K.; Shyamsundar, P.; Nepal, M.; Bhatta, L.D. Financing Watershed Services in the Foothills of the Himalayas. Water 2018, 10, 965. https://doi.org/10.3390/w10070965
AMA Style
Rai RK, Shyamsundar P, Nepal M, Bhatta LD. Financing Watershed Services in the Foothills of the Himalayas. Water. 2018; 10(7):965. https://doi.org/10.3390/w10070965
Chicago/Turabian StyleRai, Rajesh Kumar, Priya Shyamsundar, Mani Nepal, and Laxmi Dutt Bhatta. 2018. "Financing Watershed Services in the Foothills of the Himalayas" Water 10, no. 7: 965. https://doi.org/10.3390/w10070965
Note that from the first issue of 2016, this journal uses article numbers instead of page numbers. See further details here.