Article

Radar Data Analyses for a Single Rainfall Event and Their Application for Flow Simulation in an Urban Catchment Using the SWMM Model

by
Mariusz Paweł Barszcz
Department of Hydraulic Engineering, Warsaw University of Life Sciences—SGGW, Warsaw 02-776, Poland
Water 2018, 10(8), 1007; https://doi.org/10.3390/w10081007
Submission received: 31 May 2018 / Revised: 20 July 2018 / Accepted: 30 July 2018 / Published: 30 July 2018
(This article belongs to the Special Issue Applications of Remote Sensing and GIS in Hydrology)

Abstract

:
The disadvantage of radar measurements is that the obtained rainfall data is imprecise. Therefore, the use of radar data in hydrological applications usually requires correction. The main aim of the study was to verify and optimize various methods of estimating the rainfall depths for single events based on radar data, as well as determining their influence on the values of peak flow and outflow volume of hydrographs simulated using the SWMM (Storm Water Management Model) hydrodynamic model. Regression analyses were used to find a relationship between the rain gauge rainfall rate R and radar reflectivity Z for the urban catchment of the Służewiecki Stream in Warsaw, Poland. Five methods for determining calculational values of radar reflectivity in reference to specific rainfall cells with 1 km resolution within an event duration were applied. Moreover, the correction coefficient for data from the SRI (Surface Rainfall Intensity) product was established. The Z-R relationships determined in this study offer much better rainfall rate estimation as compared to Marshall-Palmer’s relationship. Different scenarios were applied to investigate the stream response to changes in rainfall depths estimated on the basis of radar data, in which the data both for 2 existing, as well as 64 virtual, rain gauges assigned to appropriate rainfall cells in the catchment were included. Relatively good agreement was achieved between the measured parameters of the hydrograph of flows and those simulated in response to rainfall depths which had been calculated for single events using the correction coefficient and the determined Z-R relationships. Radar estimates of rainfall depths based on the tested methods can be used as input data to the SWMM model for the purpose of simulating flows in the investigated urban catchment.

1. Introduction

Monitoring and prediction of rainfall events and their consequences are of primary importance to hydrology [1,2,3]. In many small urban catchments, there is a problem with obtaining the rainfall data necessary for hydrological applications. In the case of taking measurements using rain gauges, there is often a problem resulting from their low density in the catchment, or as a result of them temporarily turning off due to failure. Applying data registered at rainfall stations as input data for hydrological models requires, in the majority of cases, the spatial interpolation of rainfall data [4]. One of the means of measuring rainfall depth is to make use of weather radar technology. Information obtained on the basis of weather data provides the most detailed information in regard to the spatial and temporal distribution of rainfall [5]. These features potentially improve the simulation and forecasting of stream flows [6,7,8,9,10].
The demand for a better understanding of hydrological processes at different spatial scales requires the application of more integrated and advanced techniques of rainfall detection and estimation, rather than only applying data from conventional networks of ground-based rain gauges [11]. Due to their ability to capture the spatial characteristics of rainfall fields well and their evolution in time, radar rainfall estimates are playing an increasingly important role in urban hydrological applications [12,13,14,15,16]. The use of more detailed and distributed models has increased the demand for good-quality, high-resolution inputs, which promotes the use of radar rainfall data in urban hydrology [17].
The use of radar data in hydrological applications requires expanding on knowledge of the topic of the uncertainty of radar data [18]. The main flaw of radar observations is the imprecision of the obtained rainfall data [19,20,21], which results from the fact that it is an indirect measurement. Weather radars do not measure rainfall directly but rather the back-scattered energy from precipitation particles from elevated volumes, and thus an algorithm should be developed and calibrated against the rain gauge network [22]. As pointed out in paper [23], in order to quantify the uncertainty on accumulated rainfall, the authors usually perform either a comparison of different radar products or compare ground measurements and precipitation estimates on radar pixels where rain gauges are located [24,25]. Different Z-R relationships used in hydrometeorology imply different properties of resulting radar rainfall products [26].
Radar users are required to modify, on their own, the radar data by means of rain gauges located within the target catchment in order to remove the bias [24,27,28]. Relatively few tests of gauge-based adjustment methods have been conducted on small urban scales and all of them have concluded that, on these scales, more dynamic and localized adjustments are required [12,29]. In studies carried out in Northern France for a long, heavy rainfall event that resulted in flooding and heavy damage, strong underestimation of the estimated rainfall total based on radar data was observed, despite considerable improvement in radar technology and algorithms [30]. In an analysis carried out in Malaysia using hourly rainfall data, more than 80% of data obtained from the radar were overestimated when compared to rain gauge observations [31]. As described in the work [23], when comparing the C-band and X-band rainfall totals to those resulting from tipping bucket rain gauges, one may note that the X-band radar tends to underestimate, while C-band radar generally overestimates them. In spite of the greatly improved quality of the operational C-band radar estimates, the average differences between the radar estimates (without calibration with gauges) and ground observations vary between 28% and 54%, increasing with distance [32].
The relationship between radar reflectivity and rain rate (Z-R relationship) is not the same everywhere and has high variability [33,34]. The results of the analysis carried out by [22] shows that it is possible for different Z-R relationships to be calibrated into the radar system which could improve the rainfall estimations. The Z-R relationship can be calibrated in different ways. One such approach is to determine the relationship directly by matching the measured radar reflectivity and rainfall [35]. This approach is associated with errors due to the difficulty in exactly selecting a volume in the atmosphere corresponding to ground measurements and also differences in temporal resolution between the techniques [33].
The Z-R relationship derived by Marshall and Palmer, used especially for the summer period dominated by rain-type precipitation, does not correlate well with radar-derived precipitation measurements of temporal readings of nearby gauges [36]. As also described in this paper, referring to the results of a study carried out in Warsaw by other authors [37], the existence of only statistical agreement between gauge-readings and radar-estimates at sub-hourly time scales reduced the potential usability of radar in hydrology, especially in urban hydrology. The calibration using local gauges should increase accuracy of estimating radar rainfall relative to the theoretical Marshall and Palmer relationship [38].
For a small urban catchment, large differences are observed in the peak flows simulated by radar and rain gauges due to the inherent uncertainties from both rainfall estimates [14]. For some events, radar data input resulted in better flow simulations whereas for other events, the rain gauge data input resulted in better flow simulations [39]. As described in the paper [40], it appears that the uncertainty on the simulated peak flow in reaction to rainfall depth estimated using radar data is significant, reaching for some conduits in the small urban catchment of Cranbrook (London), 25% and 40% respectively for frontal and convective events. The quality of radar-derived precipitation data without gauge-adjustment is insufficient for use in flood risk management [41]. Adjusting radar data son that it more closely resembles the observations of rain gauges will consequently improve the results obtained with distributed simulation models [42]. Moreover, numerous studies showed a strong influence of rainfall spatiotemporal variability on model response, especially in urban areas, where response times are shorter due to high levels of imperviousness and smaller catchments [23,43,44,45,46].
Keeping the above in mind, one of the aims of the studies undertaken in this work was to establish the correction coefficient for radar data obtained from the SRI (Surface Rainfall Intensity) product made available in Poland by the Institute of Meteorology and Water Management—National Research Institute. Next, an attempt was made to establish a new Z-R relationship which offers better rainfall rate estimation in the investigated catchment as compared to that of Marshall-Palmer. In this analysis, in order to establish the calculational values of radar reflectivity at individual time intervals of rainfall duration for each of the analyzed events in relation to the points in the catchment corresponding to the locations of the 2 rainfall stations, five different methods were applied. The aim of this analysis was to determine whether the accuracy of estimating rainfall depth for individual events is significantly dependent on the applied method for establishing representative values of reflectivity.
The another aim of the studies in the Służewiecki Stream catchment was obtaining information on whether the methods applied to calculate rainfall depth for the analyzed events, making it possible to obtain simulation errors for parameters of the hydrograph of flows lower than the assumed limit value of the relative error equal to 25%. In this analysis, carried out using the hydrodynamic SWMM (Storm Water Management Model) model, an important question pertained to whether relatively high or low values of the error of estimating rainfalls determine adequate values of the error of estimating peak flow and outflow volume. The next aim of the study was obtaining information on the influence that applying rainfall depths estimated on the basis of radar data from just 2 existing rain gauges (the rainfall inputs were assumed to be uniformly distributed over the two areas) and from 66 rain gauges in the catchment (cells with 1 km resolution) has on the values of simulation errors of hydrograph parameters.
In the analyzed urban catchment, even small rainfall events may cause local flooding. As a result of this, technical works aimed at reducing the risk of flooding are undertaken within it. Developing a hydrodynamic model for this catchment that incorporates radar rainfall data ought to lead to increasing the precision of simulating hydrograph parameters, which could be used in engineering practice.

2. Materials and Methods

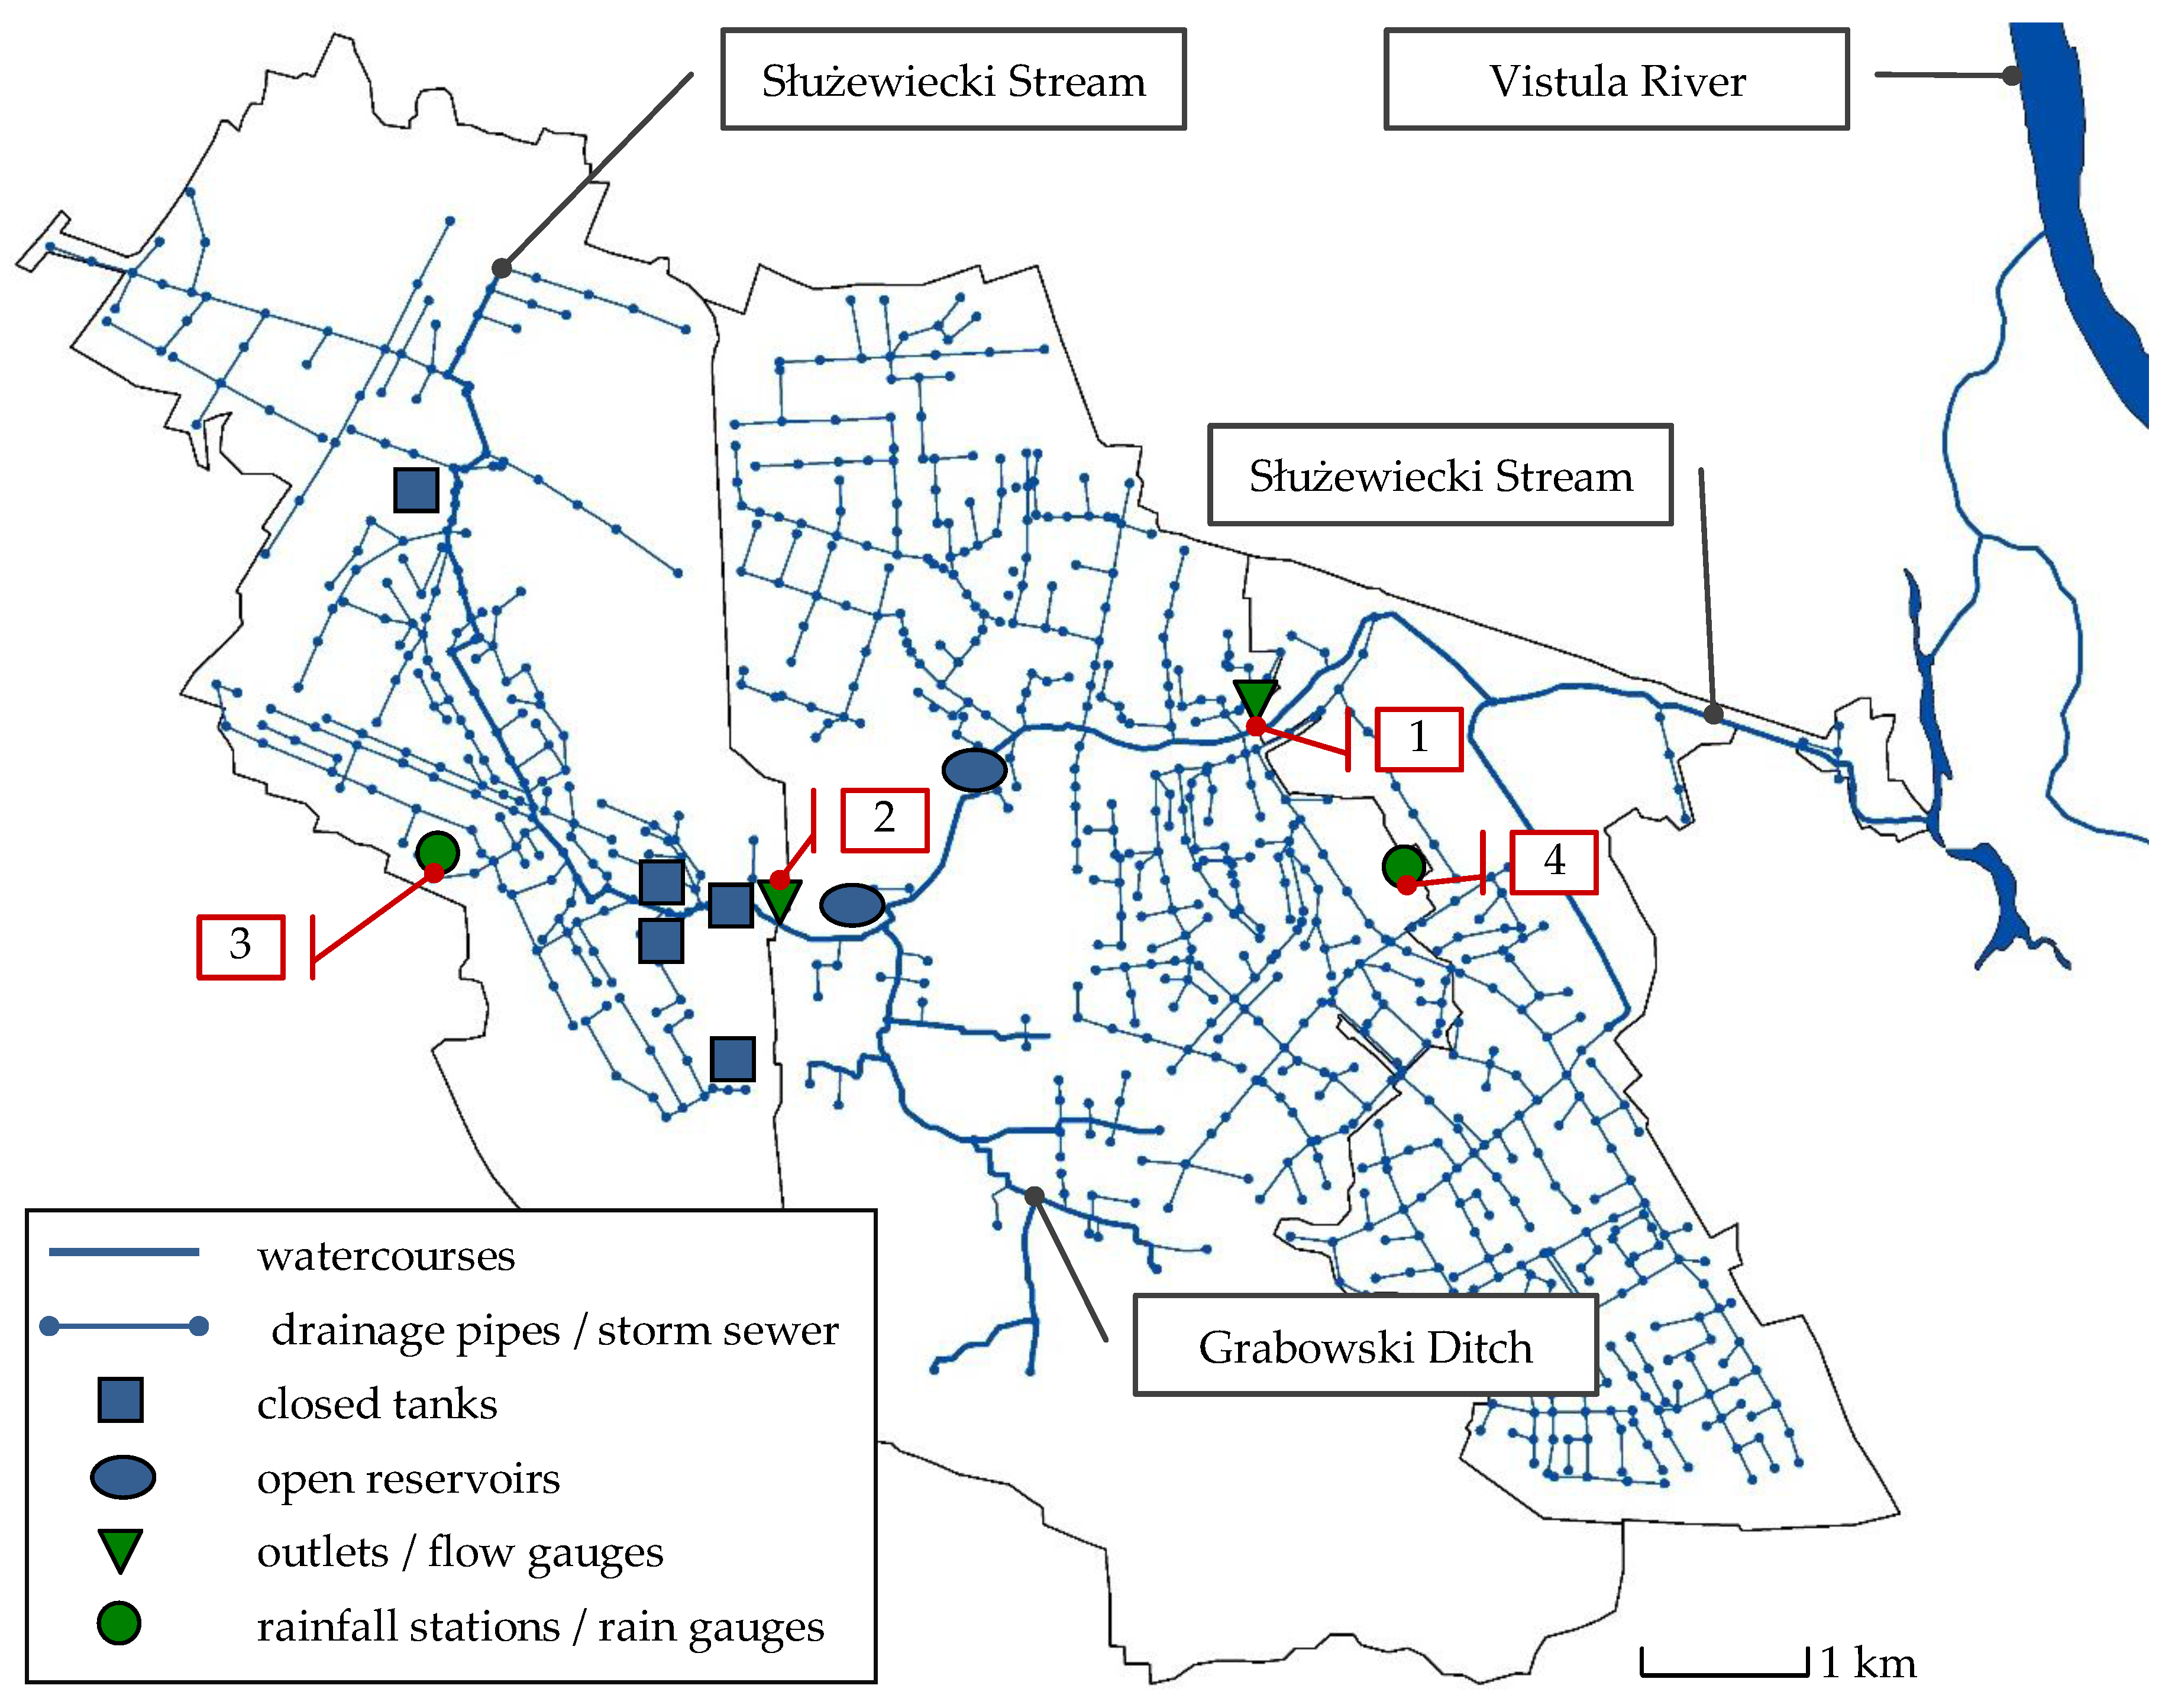
2.1. Description of the Studied Area

In quantitative rainfall analysis, data registered at the Okęcie and Ursynów rainfall stations, located in the area of the analyzed Służewiecki Stream catchment in Warsaw, were applied. In the quantitative analysis regarding the flows, hydrographs measured in the Kłobucka and Rosoła cross-sections were used (see Figure 1).
The area of the subcatchment for the Kłobucka cross-section is 16.5 km2, with a share of effective impermeable surfaces (hydraulically connected with storm sewers) equal to approx. 23%. Warsaw Chopin Airport, from which rainwaters are directed to the Służewiecki Stream by a storm water drainage system, occupies the vast majority of the area of this catchment. The Służewiecki Stream, in the segment from its source to the Kłobucka cross-section (6.5 km in length), is closed along almost the entire length. In the area of the airport, retention tanks with a total capacity of 42,490 m3 are found, which have a large influence on the transformation of flows in the watercourse.
The area of the subcatchment to the Rosoła cross-section is 43.0 km2. The share of effective impermeable surfaces is approx. 26.0%. A part of this catchment, which is drained by the Grabowski Drainage Ditch, is mainly agricultural and forest-type land. The remaining part of the catchment, drained by a drainage system, is used for industrial, commercial, transportation and multi-family residential development purposes. It is characterized by a large share of impermeable surfaces. The average slope of the Służewiecki Stream is approx. 1.5‰, and slopes of the areas in the catchment are usually less than 1%.
Rainfall depths at the Okęcie and Ursynów rainfall stations were registered in an ongoing manner using SEBA electronic tipping bucket rain gauges. The first of them is controlled by the Institute of Meteorology and Water Management—National Research Institute (Polish: IMGW—PIB), while the second—by the Division of River Engineering in Warsaw University of Life Sciences—SGGW. Water levels on the basis of which flows were calculated were registered using a hydrostatic sensor of the “Diver” type.

2.2. The SWMM Model for the Studied Area

To stimulate flow in the analyzed catchment in response to single rainfall events, version 5.0.022 of the SWMM (Storm Water Management Model) was applied. The SWMM is a fully dynamic rainfall-runoff model, as well as being a fully distributed deterministic model, intended for simulating water and contaminant runoff in response to single or continuous (long-term) rainfalls mainly in urbanized catchments. The model, designed by the U.S. Environmental Protection Agency (EPA), is characterized by a large number of parameters, which are mainly physically measurable characteristics of the catchment and hydrometeorological conditions. Two calculation procedures of processes taking place in the hydrological and hydraulic system of the catchment can be distinguished in the structure of the described model. SWMM can be used to model several different hydrological processes, such as: time-varying precipitation, rainfall interception from depression storage (initial abstraction), infiltration of rainfall into unsaturated soil layers, or nonlinear reservoir routing of overland flow. The processes occurring within the hydraulic system of SWMM include, among others: external inflow of surface runoff, unsteady, non-uniform flow routing through different objects of the hydraulic system, various flow regimes (such as backwater, surcharging, reverse flow and surface ponding), and flow regulations via pumps, weirs and orifices.
The hydrological calculation procedure of the model is based on the set of subcatchments with given attributes and parameters (which usually constitute homogeneous areas with various types of land use, chosen from the catchment in order to account for the spatial variation of the modelled hydrological processes), in which the rainfall being the input to the model is transformed into surface runoff. The user assigns a rain gauge created in the model to each of the subcatchments, in which the rainfall depth is given in the form of a time series. SWMM uses a nonlinear reservoir model to estimate surface runoff produced by effective rainfall over a subcatchment, which is a part of the total rainfall remaining after the deduction of infiltration, initial abstraction, and evaporation (the last of these mentioned processes is negligibly small in relation to single events). Runoff from the subcatchment area occurs when the water depth exceeds the maximum possible retention. The infiltration rate for pervious areas is determined using several methods included in the SWMM: Horton formula, the Green-Ampt, and the Curve Number method. The effective rainfall rate for impervious areas is calculated as the difference between the total rainfall depth and the initial losses depth (depression storage depth). The SCS (Soil Conservation Service)—CN (Curve Number) method was used to calculate infiltration rate for pervious areas. The CN is the parameter which takes values in the range from 0 to 100 and mainly depends on the soil type that is assigned to one of four hydrologic soil groups, type of land use, and the antecedent moisture condition. The value of this parameter as well as depression storage depth have been chosen according to values tabulated in the manual [47]. The produced runoff in a given subcatchment is then carried over to a neighboring area or to a hydraulic system of catchments, which consists of a network of storm sewer pipes connected using junctions (nodes), as well as a natural watercourses and man-made trenches (channels), retention tanks, etc. Surface runoff is calculated in the SWMM model from Manning’s equation. The course of transformation of the hydrographs of flows in the hydraulic system of the catchment is described in the SWMM model by equations of conservation of mass and momentum (the user of the model can choose one of three options: “steady flow”, “kinematic wave” and “dynamic wave”). The dynamic wave model (uses the Saint-Venant equation) was used in order to calculate the transformation of flows in the investigated catchment. An extensive description of the SWMM model can be found in the manual [47]. Numerous examples of its application for simulating flow in urbanized catchments can be found in the scientific publications of various authors [48,49,50,51,52].
The adaptation of the SWMM model for the analyzed catchment relied on creating objects in the model which represent the physical elements of the actual hydrological and hydraulic system of the catchment, and next—on determining the values of their parameters and calibration of the model on the basis of rainfall-runoff events measured in the analyzed catchment. In order to assess and identify the parameters of the objects in the model, the authors used characteristics of real objects measured in field and identified based on the available studies, as well as values of parameters recommended in the tables of the manual [47]. The calibration process relied on determining such model parameters to minimize the differences between measured values of peak flow and outflow volume of a hydrograph and simulated values at the assumed level of accuracy. The second stage of model adaptation for the Służewiecki Stream catchment was its verification. In model calibration and verification, a value of 25% was assumed as the limit of permissible deviation from “perfection”. In these procedures, the hydrographs of flows were simulated in the Rosoła and Kłobucka cross-sections of the Służewiecki Stream catchment.
In order to calibrate the model for the subcatchment to the Kłobucka cross-section, the two hydrographs of flows measured in this cross-section for which rainfalls recorded at the Okęcie rainfall station were available, as well as water levels in storm sewer pipes located before/behind valves (used to regulate flow) working together with the retention tanks in the area of the Warsaw Chopin Airport and water levels in one of the closed tanks were used. Three rainfall-runoff events for which corresponding rainfall data recorded at two rainfall stations in the investigated catchment were available were used to calibrate the model for the subcatchment to the Rosoła cross-section.
The values of one of the most important parameters in hydrological analyses, i.e., the percentage of impervious areas, were determined for each of the 22 types of land use which had been distinguished in the investigated catchment on the basis of an orthophotomap (aerial map), using ArcGIS tools. The values of the width of the overland flow path (ranging from 12 to 200 m, most often 100–150 m) were determined for individual objects in the model following the recommendation given in the manual [47], namely by dividing the area of the subcatchment by the average maximum length of the overland flow path for sheet flow runoff in the same subcatchment. The average surface slopes (ranging from 0.75 to 2.5%) were determined based on data obtained from a numerical terrain model. Manning’s roughness coefficient for conduits was assumed to be 0.011 s·m−1/3.
Values of the model parameters which were determined based on the calibration:
  • The values of Manning’s coefficient for impervious and pervious surfaces (N-Imperv and N-Perv) were found to be, in most cases, equal to 0.012 and 0.13 s·m−1/3, respectively (in relation to areas used as forest and arable land, they were 0.25 and 0.15, respectively);
  • The values of the depression storage depth for impervious and pervious areas (Dstore-Imperv and Dstore-Perv) were equal to 1.5 and 2.5 mm (only for forest areas and arable land was the surface retention depth 5.0 mm).
  • For the parameter of %Zero Imperv (percent of impervious area with no depression storage), we chose the value of zero.
  • The dimensionless parameter CN associated with the maximum potential retention of the catchment was equal to 77 for forest areas, while for other types of land use, it was characterized by CN = 87.
The values of relative error (RE) that were calculated in the calibration procedure for the hydrographs of flows in the Kłobucka cross-sections ranged from −6.3 to 7.8% and −8.8 to 10.5%, respectively, in relation to peak flows and outflow volumes. The RE values obtained in this procedure for events analyzed in the Rosoła cross-section ranged from −4.4 to 0.3% and −13.4 to 1.3%, respectively, for the above-mentioned parameters. The values of relative error calculated for the hydrographs in the Kłobucka cross-sections in the verification procedure (based on six independent rainfall-runoff data) ranged from −13.9 to 20.5% and −13.2 to 24.3%, whereas the RE values calculated for the events analyzed in the Rosoła cross-section ranged from −23.7 to 5.2% and −19.9 to 14.9%, respectively, in relation to peak flows and outflow volumes. The obtained degree of agreement between the results from the model and measurements was satisfactory and qualified the model for conducting simulations using radar rainfall data.
The following objects were accounted for in the SWMM model that had been adapted for the analyzed catchment (see Figure 2):
  • the existing rain gauges at the Okęcie and Ursynów rainfall station (assigned to two rainfall cells with an area of 1 km2, which correspond to appropriate pixels on the map in the SRI radar product);
  • virtual rain gauges, in which the rainfall depths were estimated on the basis of radar data (assigned to 64 rainfall cells covering the area of the catchment);
  • subcatchments, which had been distinguished in the catchment in order to account for the spatial diversity of land use in the catchment and the share of impermeable surfaces connected with this (4565 objects);
  • open channels, watercourses and drainage pipes (2271 objects);
  • road culverts and bridges;
  • retention tanks, pumps and valves used to regulate flow, working together with the tanks.

2.3. Methods of Radar Data Analysis

Upon processing values of radar reflectivity registered by the radar, we obtain different meteorological and hydrological products. One of these products is SRI (Surface Rainfall Intensity), which presents a picture of rainfall intensity R in a layer characterized by a constant height above the surface of the ground [53]. The Institute of Meteorology and Water Management—National Research Institute, which carries out measurements in Poland using radars and makes SRI products available, when calculating precipitation (rainfall) rate R on the basis of registered radar reflectivity Z, makes use of Equation (1), presented in inverse order, i.e., expressing Z by R, based on a and b coefficients determined by Marshall and Palmer [54], which are equal to 200 and 1.60, respectively [31].
Z = a R b
where Z is radar reflectivity (mm6·m−3), R is the rainfall rate (mm·h−1), a and b are constants.
The work used the SRI product obtained as a result of processing reflectivity data derived from the C-Band Doppler radar located approx. 30 km north of the Okęcie and Ursynów rainfall stations (in the town of Legionowo). The applied SRI product presents values of rainfall intensity in the area covered by the radar in a layer located at a height of 1 km above the surface of the ground, with 1-km resolution and 10-min intervals.
A specialized program—RAPOK (developed at the IMGM—PIB)—was used to analyze the values of rainfall intensity on the basis of the SRI product, making it possible to generate radar data in the form of a file compatible with the Microsoft Excel format for the area covering the analyzed catchment (fields in a shape close to a square, containing 156 pixels with 1 km resolution). From data for 156 pixels, values of rainfall intensity for 66 pixels located in the Służewiecki Stream catchment were selected and used for analyses in accordance with the scope of the present work. Figure 3 shows a sample SRI product map in the RAPOK program, corresponding to one of the analyzed rainfall events, which occurred on 2 July 2007 at 21:40. On the basis of rainfall intensity values R derived from the SRI product for 66 pixels, the corresponding values of radar reflectivity Z were calculated for each of the analyzed events (at individual time intervals of rainfall duration). The calculations were carried out on the basis of Equation (1) and based on a and b coefficients determined by Marshall and Palmer amounting to 200 and 1.6, respectively.
Next, regression analyses were applied in an effort to establish the values of parameters a and b in the Z-R relationship (Equation (1)) for the investigated catchment area of the Służewiecki Stream in Warsaw. The analysis was carried out on the basis of values of rainfall intensity measured at the Okęcie and Ursynów rainfall stations for 18 events and corresponding values of radar reflectivity. A regression line in a logarithmized variable logZ and logR set was obtained. In this analysis, in order to establish the calculational values of radar reflectivity for each of the events in relation to the points in the catchment corresponding to the locations of the Okęcie and Ursynów rainfall stations, five different methods were applied. They differed in terms of the number of data (ranging from 1 to 4 values of radar reflectivity, corresponding to nodes in pixels in which rainfall stations are located) on the basis of which the calculational values of radar reflectivity were established at individual time intervals of rainfall duration. To establish these, the following were considered: (1) one value of radar reflectivity obtained in two pixels for the node located nearest with regard to the point where the given rainfall station is located; (2) the lowest value of reflectivity for nodes in a given pixel; (3) the highest value of reflectivity; (4) the average value of reflectivity calculated on the basis of data for four nodes; (5) the value of the median for data from four nodes in corresponding pixels. The influence of each of these methods on the values of parameters a and b in Equation (1) was analyzed, and thus, the compatibility of the estimated rainfall totals for the analyzed events with the corresponding data measured at rainfall stations. The application of various methods to establish the calculational values of radar reflectivity resulted from the fact that, due to the different location of the pixel nodes and point at which the given rainfall station is found on maps, it cannot be clearly indicated which value of radar reflectivity in one of the four nodes will be accounted for in the regression analysis. Another reason for applying various methods in this analysis was the fact that values of reflectivity differed significantly in each node of the pixel in reference to individual time frames of rainfall duration.
Rainfall depths measured using rain gauges, as well as those obtained on the basis of the SRI product for 18 rainfall events, were used to establish the ratio of these data in individual time intervals of rainfall duration (10 min), and next, their values of the average (correction coefficient) for all data. The established value of the correction coefficient, which amounted to 3.6, was used to calculate rainfall depths for the analyzed events on the basis of data from the SRI product, which were compared with data measured using rain gauges.

3. Results and Discussion

3.1. Radar Reflectivity-Rainfall Rate Relationships

The Z-R relationship (Equation (1)), with coefficients derived by Marshall and Palmer, is commonly used for radar rainfall estimation. In a further part of the work, it was indicated that rainfall totals calculated for the analyzed events using this relationship were much lower than those measured using rain gauges. As a result of this, an attempt was made to establish Z-R relationships which offer better rainfall rate estimation in the investigated catchment area as compared to that of Marshall-Palmer. Eighteen rainfall events, which were measured simultaneously at the Okęcie and Ursynów rainfall stations (6 and 12 events respectively), as well as using a weather radar, were accepted for this analysis. The events were characterized by different rainfall totals, ranging from 8.6 to 52.6, and 6.2 to 43.6 (see Table 1), registered respectively at the Okęcie and Ursynów rainfall stations. Five various methods of establishing calculational values of radar reflectivity for each of the events in reference to the points in the catchment corresponding to the location of the Okęcie and Ursynów rainfall stations which had been described in the previous chapter were used. Five Z-R relationships (differing in terms of the values of a and b coefficients) were obtained in reference to each of the rainfall stations. On the basis of these relationships and calculational values of radar reflectivity, the rainfall depths (totals) for the analyzed events were estimated and compared with corresponding data measured at the rainfall stations. The application of Equations (2) and (3), established using only 12 events measured at the Ursynów rainfall station was found to result in the highest compatibility of these data in reference to all analyzed events. The relationships were characterized by correlation coefficients amounting to 0.84 and 0.83 respectively. The significance test of regression coefficient confirmed that the relationship between variables in Equations (2) and (3) is statistically significant. The values of the F ratio of explained variance to unexplained variance amounted to 156.90 and 143.90 respectively, with the critical value of F = 4.00 at the level of significance of 0.05 and degrees of freedom equal to 1 and 63. These relationships were assumed for calculating rainfall depth on the basis of radar data corresponding to the Okęcie and Ursynów rainfall stations.
Z = 64 R 1.23
Z = 66 R 1.23
Symbols designated as in Equation (1).
Equations (2) and (3) were obtained using two methods in which the calculational values of radar reflectivity were established respectively on the basis of one value of reflectivity (determined for the node located nearest in terms of the point where the Ursynów rainfall station is located), as well as the value of the median for data from four nodes of the pixel in which the Ursynów rainfall station is located. Z-R relationships, which were established applying three remaining methods (in reference to events measured at the Ursynów rainfall station), were characterized by correlation coefficients in the range of 0.80 to 0.85. Values of a and b parameters in these relationships, which were established on the basis of the lowest value of reflectivity for nodes at a given pixel, the highest value of reflectivity and the average value of radar data for four nodes in the pixel, were a = 42 and b = 1.17, a = 86 and b = 1.32, a = 65 and b = 1.25 respectively. The significance test of the regression coefficient confirmed that these relationships are statistically significant (the values of F amounted to 114.12, 163.62 and 153.12 respectively, with the critical value of F = 4.00).
In the literature, there is high variability of the Z-R relationship (Equation (1)) coefficients. The value of coefficients a and b, established in many analyses in different regions of the world, fall within ranges from 16.6–730 and 1.16–2.87, respectively [53]. The values of parameter a can change from a few dozen to a few hundred, whereas values of parameter b are usually limited to the range of 1 ≤ b ≤ 3 [55,56,57]. According to other data [22,58], values of a and b fall within the respective ranges of 31–500 and 1.1–1.9. The values of coefficients established in this study are within the ranges obtained by other authors.

3.2. Comparison of Radar Estimates with Rain Gauge Measurements

Rainfall totals for 18 events which were obtained directly from the SRI product (in which the values of rainfall rate were calculated based on parameters a and b determined by Marshall and Palmer), as well as being calculated by applying correction coefficient for data from the SRI product (equal to 3.6) and estimated on the basis of Z-R relationships (2) and (3) established in this work, compared with corresponding data measured using rain gauges at the Okęcie and Ursynów rainfall stations (see Table 1 and Table 2).
Compatibility assessment of the rainfall totals for the analyzed events obtained on the basis of radar data and measured using rain gauges was carried out with the use of values of relative error (Equation (4)). A value of 25% was assumed as limiting for acceptance. The results were further assessed using the Nash-Sutcliffe Efficiency coefficient—NSE [50,51,59]. Model performance can be evaluated as satisfactory if NSE > 0.50, good if NSE > 0.65 and very good if NSE > 0.75 (with NSE = 1 being the optimal value) [60].
R E = x x 0 x 0 · 100 %
where RE is the relative error, x is the calculated value, x0 is the measured value.
A total of 18 rainfall events were accepted for the analysis, for which both data measured using rain gauges at 2 rainfall stations in the analyzed Służewiecki Stream catchment and weather radar, registered in the period 2006–2009, were available. The main characteristics of the events measured using rain gauges have been compiled in Table 1. The rainfall totals, as well as the values of average intensity for these events varied significantly, both in regards to the 2 rainfall stations as well as individual events. The rainfall totals registered at the Okęcie station ranged from 8.6 to 52.6 mm, whereas in at the Ursynów rainfall station, the values varied from 6.2 to 43.6 mm. The values of the median calculated on their basis were 12.1 and 14.0 mm respectively. Values of average rainfall intensity for events measured at the Okęcie and Ursynów stations were between 5.7 and 18.8 mm·h−1 (value of median = 9.3 mm·h−1), as well as 3.9 and 26.2 mm·h−1 (median = 12.5 mm·h−1), respectively.
Rainfall totals for the analyzed events which were determined directly from the SRI radar product (for the pixel node closest to the points at which the rainfall stations are located) were much lower than corresponding data measured using rain gauges (see Table 1). In respect to the 18 events at the Okęcie and Ursynów rainfall stations, the values of the median of relative error were −73.8 and −76.6%, respectively. The estimation accuracies of rainfall totals using SRI radar product, as assessed by the NSE values, were −0.19 and −0.89, respectively, for data at the Okęcie and Ursynów rainfall stations. These values indicate an unacceptable level of performance. The results of this analysis indicate that a calibration step that compares radar predicted rainfall to “true rainfall” is still needed.
Values of the median of relative error determined on the basis of the sum of rainfall measured using rain gauges and calculated using Z-R relationship (Equation (2)) for the analyzed events at the Okęcie and Ursynów rainfall stations amounted to 18.7 and 26.1% (calculated for absolute values of relative error), respectively (see Table 2). The estimation accuracies of rainfall totals using this equation, as assessed by the NSE values, were, in both cases, 0.85. This value indicates a very good level of performance. The values of the median of the relative error, established in the analysis using Z-R relationship (Equation (3)) for events at the Okęcie and Ursynów rainfall stations, were 22.7 and 20.8% respectively. The NSE coefficients were 0.82 and 0.78. For this statistic, model performance can be evaluated as very good. The established Equations (2) and (3), the application of which requires the identification of calculational values of radar reflectivity on the basis of data for one and four nodes in a given pixel, offer better rainfall rate estimation in the investigated area compared to Marshall-Palmer’s relationship. Using three other Z-R relationships, which were established on the basis of the lowest value of reflectivity for data in nodes in a given pixel, the greatest value of reflectivity and the average value for data in four nodes of a pixel (described in greater detail in the previous chapters), the values of the median of relative error for events at Okęcie and Ursynów rainfall stations of 27.6 and 27.9%, 28.0 and 26.6% and 23.8 and 23.4% were obtained. The values of the median of relative error established using the correction coefficient for data from the SRI product (SRI 3.6) were 19.9 and 19.7%, respectively, for the Okęcie and Ursynów rainfall stations. The obtained values of NSE, i.e., 0.90 and 0.80, indicate a very good level of performance. In this study, carried out using various methods, both underestimation and overestimation of the estimated rainfall total based on radar data was observed. The highest agreement between the rainfall totals estimated for the analyzed events based on radar data and by using rain gauges was noted when the correction coefficient for data from the SRI product was used and upon applying Z-R relationships (Equations (2) and (3)).

3.3. Simulation of Flow Using Different Rainfall Data

Rainfall depths measured at rain gauges and estimated from weather radar data for two selected events were applied to simulate hydrographs in two cross-sections of the Służewiecki Stream using the SWMM model. Rainfall events occurring on 2 July 2007 and 15 August 2008 were used for these analyses. One of the reasons behind their selection was the fact that they were registered at both analyzed rainfall stations and, at the same time, the rainfall totals for these events varied significantly. The rainfall event from 15 August 2008 was characterized by the highest total of those measured at the Ursynów station. The events chosen for this analysis were characterized by different values of relative error, which were established on the basis of rainfall totals measured using rain gauges and estimated on the basis of radar data using various methods. This fact was used in the analysis, the aim of which was determining whether the errors of estimating rainfall totals determine adequate errors of simulating the parameters of a hydrograph.
Values of peak flow and outflow volume of direct hydrographs measured for two selected events in the Kłobucka and Rosoła cross-sections (see Figure 1) are given in Table 3. The table also contains values of hydrograph parameters obtained as a result of simulations using the SWMM model in reaction to rainfalls measured for these events at the rainfall stations and relative errors calculated on the basis of measured and simulated data. Compiled in Table 4 are the results of simulations of hydrograph parameters obtained using rainfall totals estimated for the analyzed events according to various methods on the basis of radar data and the relative values calculated for them.
Assessment of the agreement between measured (observed) and simulated values of parameters of the hydrograph was carried out using relative error (Equation (4)), recommended by ASCE (American Society of Civil Engineers) [61] for single events. A value of 25% was assumed as the cut-off level for model acceptance [62].
The values of relative error (RE) calculated for the analyzed events in two cross-sections of the Służewiecki Stream in response to rainfall depths measured at two rain gauges (uniformly distributed over two adequate areas in the catchment) ranged from −18.3 to 9.2% and −5.5 to 14.5% (see Table 3), respectively, in relation to peak flows and outflow volumes. The simulated values of parameters of the hydrograph obtained from the SWMM model were lower than the assumed level of model acceptance (25%).
Different scenarios were applied to investigate the stream response to changes in rainfall depths estimated from radar data for the analyzed events. Six scenarios in which rainfall depths for two single events (in individual time intervals of the rainfall duration) were established according to the following methods:
  • Scenario 1: directly on the basis of data from the SRI radar product (values of the intensity of rainfall in a given node of a pixel which had been calculated based on the a and b coefficients determined by Marshall and Palmer) for 66 rain gauges, which correspond to the pixels on SRI product maps (including for 64 virtual and 2 existing rain gauges at the Okęcie and Ursynów rainfall stations, located in cells with a surface area of 1 km2 covering the area of the analyzed catchment);
  • Scenario 2: upon applying Z-R relationship (Equation (2)) and calculational values of radar reflectivity for 66 rain gauges (obtained for one specified node in 66 pixels, the location of which in each pixel corresponded to that established in two pixels for nodes located closest in terms of the points at which the Okęcie and Ursynów rainfall stations are located);
  • Scenario 3: on the basis of data from the SRI product for 66 rain gauges and correction coefficient amounting to 3.6;
  • Scenario 4: upon applying Z-R relationship (Equation (3)) and calculational values of radar reflectivity for 66 rain gauges (values of the median established in 66 pixels on the basis of data for four nodes in each pixel);
  • Scenario 5: upon applying Z-R relationship (Equation (2)) and calculational values of radar reflectivity (established in two pixels for the node located nearest to the points at which the existing rainfall stations are located) for rain gauges in Okęcie and Urysnów rainfall stations (the point rainfall depths established for these rain gauges were uniformly distributed over two adequate areas in the catchment);
  • Scenario 6: on the basis of data from the SRI radar product for 2 rain gauges at existing rainfall stations and a correction coefficient amounting to 3.6 (the rainfall inputs were assumed to be uniformly distributed over two areas).
Values of peak flow and outflow volume in the Rosoła and Kłobucka cross-sections obtained using the SWMM model in simulations carried out on the basis of data from the SRI radar product (Scenario 1) were much lower than the respective values measured in these cross-sections. In response to the above-mentioned hygrogram parameters, the values of relative error were from −88.5 to −40.2% and from −88.9 to −75.7%, respectively (see Table 4). The results of flow simulations for the five above-mentioned scenarios in which the Z-R relationships established in this work, along with the correction coefficient, were applied are described in a subsequent part of the work.
Upon applying rainfall depths estimated on the basis of Z-R relationship (Equation (2)) and calculational values of radar reflectivity (established on the basis of radar data for a single given node in each pixel), peak and total flow values obtained from the SWMM model were, in most cases, similar to the measured values. The values of relative error calculated in scenario 2 ranged from −3.8 to 26.4% and from −0.9 to 29.9%, respectively. For two out of eight cases, the errors were higher than the value of 25%, which had been assumed as the limiting value for acceptance. Good agreement between measured and simulated values of parameters was also obtained in reference to Scenario 3, in which the values of rainfall were calculated on the basis of data from the SRI product for 66 rain gauges, accounting for the correction coefficient. The relative error was higher than 25% in only one case. In the analysis for Scenario 4, carried out applying rainfall depths estimated on the basis of the Z-R relationship (3) and calculational values of radar reflectivity (established on the basis of radar data for four nodes in each pixel), a lower agreement between the measured and simulated values of the parameters of the hydrograph were obtained than for Scenario 2 (in which the calculational values of reflectivity were established only on the basis of data from one node in each pixel). The values of relative error ranged from −14.1 to 40.8% and 19.6 to 36.5%, respectively, in regard to peak flows and outflow volumes. In four cases, the errors were higher than 25%.
In the analysis carried out for Scenario 5, in which the Z-R relationship (2) and calculational values of radar reflectivity established for pixels in which the Okęcie and Ursynów rainfall stations were located (calculated point rainfalls were uniformly distributed over two adequate areas) were applied to calculate rainfall depths, high agreement between simulated and measured peak flow and outflow volumes was obtained. The values of relative error were found to be from −19.4 to 20.8% and from −25.9 to 3.0%, respectively. Only in one case was the relative error slightly higher than 25%. In a respective analysis carried out for Scenario 2, in which the calculational values of radar reflectivity were determined for 66 pixels (applied to calculate the amount of rainfall for 66 rain gauges), similar results of the simulation were obtained—the relative errors were higher than the level of acceptance in two cases. Good agreement between the analyzed parameters of the hydrograph was also obtained in regard to Scenario 6, for which the rainfall depths were calculated on the basis of data from the SRI product for 2 rain gauges and the correction coefficient. Only in one case was the relative error higher than the value marking the level of acceptance. The obtained relative errors (compiled in Table 4) indicate that the results of this analysis are comparable to those obtained for corresponding Scenario 3, in which radar data for a much higher number of rain gauges in the analyzed catchment were used to carry out the simulation.

4. Conclusions

Different methods were applied to estimate rainfall depths (totals) from radar data for 18 analyzed single events. Calculated rainfall totals were compared with corresponding data measured using rain gauges at two rainfall stations located in the analyzed urban catchment. The hydrodynamic SWMM model was used to simulate peak flow and outflow volume of hydrograph in two cross-sections of the Służewiecki Stream in response to radar rainfall depths estimated for two selected events using six methods.
The conducted analyses enable the following conclusions to be drawn:
  • Rainfall totals for the analyzed events obtained directly from the SRI radar product (in which the values of rainfall rate are calculated based on parameters a and b determined by Marshall and Palmer) were much lower than the rainfall totals measured for these events at rainfall stations. The values of the relative error ranged from −89.6 to −56.9%. The results of this analysis indicate that a calibration step that compares radar estimated rainfall and rain gauge rainfall is necessary. Respective values of relative error, ranging from −88.9 to −40.2%, were calculated for parameters of the hydrograph simulated in response to rainfall depths obtained from the SRI product.
  • Based on rainfall depths measured at rainfall stations and obtained from the SRI radar product for the analyzed events (in individual time intervals of rainfall duration), an average value of the ratio between these data amounting to 3.6 was determined. Rainfall totals calculated for individual events applying this correction coefficient and data from the SRI product were characterized by an absolute value of the relative error median of 20%. The obtained values of the NSE coefficient indicate a very good level of performance.
  • The Z-R relationships (2) and (3) determined in this study, the application of which require the identification of calculational values of radar reflectivity on the basis of data in one and four nodes of a given radar map pixel, offer better rainfall rate estimation in the investigated area as compared to Marshall-Palmer’s relationship (the values of coefficients a and b determined by Marshall and Palmer differ significantly from those established in this work). The values of the median of relative error, determined in the analysis using these relationships for events in two rainfall stations, were between 11.6% and 18.1%, respectively. The calculated rainfall totals were both underestimated and overestimated.
  • Relative errors, which were obtained in a similar analysis using three other Z-R relationships (established on the basis of the lowest and highest values of radar reflectivity as well as the average value for data in four nodes of a given pixel), were significantly higher than those calculated in the analysis applying Z-R relationship (Equations (2) and (3)). The absolute values of the median of the relative error calculated on the basis of rainfall totals for events analyzed at individual rainfall stations ranged from 23.4 to 28.0%. As the values of relative error indicate, the method applied to determine the calculational values of radar reflectivity was important.
  • In simulations carried out using the SWMM model in reaction to rainfall depths calculated for the analyzed events using the correction coefficient for data from the SRI product and estimated on the basis of the determined Z-R (Equation (2)) relationship, relatively good agreement was achieved between the measured and simulated peak flow and outflow volume values. The values of the relative error were, in most cases, lower than the assumed cut-off level of model acceptance (25%). In this analysis, about 56% of peak flow and outflow volume values obtained from simulations were overpredicted when compared to flow gauge observations. For some events, radar data input resulted in better flow simulations than using rain gauge data input.
  • The estimation errors of hydrograph parameters in some cases were not in agreement with values of errors which had been calculated for respective rainfall totals, e.g., when rainfall total error was relatively large and negative, the respective peak flow error was small and positive.
  • Using rainfall depths estimated from radar data for only 2 existing rain gauges (cells with 1 km resolution) as well as 66 (including 64 virtual) rain gauges in the catchment, a similar range of relative error values for simulated peak flows and outflow volumes was found, but different values of errors in individual corresponding cases were obtained.

Funding

This research was partial supported by the National Science Centre in Poland (COST/210/2006).

Acknowledgments

Information regarding radar data: The source of data is the Institute of Meteorology and Water Management—National Research Institute. Data from the Institute of Meteorology and Water Management—National Research Institute were processed.

Conflicts of Interest

The authors declare no conflict of interest.

References

  1. He, X.; Sonnenborg, T.O.; Refsgaard, J.C.; Vejen, F.; Jensen, K.H. Evaluation of the value of radar QPE data and rain gauge data for hydrological modeling. Water Resour. Res. 2013, 49, 5989–6005. [Google Scholar] [CrossRef] [Green Version]
  2. Li, Z.; Yang, D.; Hong, Y.; Qi, Y.; Cao, Q. Evaluation of radar-based precipitation estimates for flash flood forecasting in the Three Gorges Region. In Proceedings of the 3rd Remote Sensing and Hydrology Symposium (RSHS’14) and 3rd International Conference of GIS/RS in Hydrology, Water Resources and Environment (ICGRHWE’14), Guangzhou, China, 24–27 August 2014; pp. 89–95. [Google Scholar]
  3. Bouilloud, L.; Delrieu, G.; Boudevillain, B.; Kirstetter, P.-E. Radar rainfall estimation in the context of post-event analysis of flash-flood events. J. Hydrol. 2010, 394, 17–27. [Google Scholar] [CrossRef]
  4. Jatho, N.; Pluntke, T.; Kurbjuhn, C.; Bernhofer, C. An approach to combine radar and gauge based rainfall data under consideration of their qualities in low mountain ranges of Saxony. Nat. Hazards Earth Syst. Sci. 2010, 10, 429–446. [Google Scholar] [CrossRef] [Green Version]
  5. Mittermaier, M.P. Introducing uncertainty of radar-rainfall estimates to the verification of mesoscale model precipitation forecasts. Nat. Hazards Earth Syst. Sci. 2008, 8, 445–460. [Google Scholar] [CrossRef] [Green Version]
  6. Abon, C.C.; Kneis, D.; Crisologo, I.; Bronstert, A.; David, C.P.C.; Heistermann, M. Evaluation the potential of radar-based rainfall estimates for streamflow and flood simulations in the Philippines. Geomat. Nat. Hazards Risk 2015, 7, 1390–1405. [Google Scholar] [CrossRef]
  7. Atencia, A.; Mediero, L.; Llasat, M.C.; Garrote, L. Effect of radar rainfall time resolution on the predictive capability of distributed hydrologic model. Hydrol. Earth Syst. Sci. 2011, 15, 3809–3827. [Google Scholar] [CrossRef]
  8. Berne, A.; Krajewski, W.F. Radar for hydrology: Unfulfilled promise or unrecognized potential? Adv. Water Resour. 2013, 51, 357–366. [Google Scholar] [CrossRef]
  9. Borga, M. Accuracy of radar rainfall estimates for streamflow simulation. J. Hydrol. 2002, 267, 26–39. [Google Scholar] [CrossRef]
  10. Yang, D.; Koike, T.; Tanizawa, H. Application of distributed hydrological model and feather radar observations for flood management in the upper Tone River of Japan. Hydrol. Process. 2000, 18, 3119–3132. [Google Scholar] [CrossRef]
  11. Somorowska, U. Annual and seasonal precipitation patterns across lowland catchment derived from rain gauge and weather radar data. J. Water Land Dev. 2012, 17, 3–10. [Google Scholar] [CrossRef]
  12. Wang, L.-P.; Ochoa-Rodríguez, S.; Van Assel, J.; Pina, R.D.; Pessemier, M.; Kroll, S.; Willems, P.; Onof, C. Enhancement of radar rainfall estimates for urban hydrology through optical flow temporal interpolation and Bayesian gauge-based adjustment. J. Hydrol. 2015, 531, 408–426. [Google Scholar] [CrossRef] [Green Version]
  13. Wang, L.N.; Simões, M.A.; Rico-Ramirez, S.; Ochoa, J.; Leitão, J.; Maksimović, Č. Radar-based pluvial flood forecasting over urban areas: Redbridge case study. In Proceedings of the 8th International Symposium on Weather Radar and Hydrology (WRaH 2011), Exeter, UK, 18–21 April 2011. [Google Scholar]
  14. Schellart, A.N.A.; Shepherd, W.J.; Saul, A.J. Influence of rainfall estimation error and spatial variability on sewer flow prediction at a small urban scale. Adv. Water Resour. 2012, 45, 65–75. [Google Scholar] [CrossRef]
  15. Rafieeinasab, A.; Norouzi, A.; Kim, S.; Habibi, H.; Nazari, B.; Seo, D.-J.; Lee, H.; Cosgrove, B.; Cui, Z. Toward high-resolution flash flood prediction in large urban areas—Analysis of sensitivity to spatiotemporal resolution of rainfall input and hydrologic modeling. J. Hydrol. 2015, 531, 370–388. [Google Scholar] [CrossRef]
  16. Villarini, G.; Smith, J.A.; Baeck, M.L.; Sturdevant-Rees, P.; Krajewski, W.F. Radar analyses of extreme rainfall and flooding in urban drainage basins. J. Hydrol. 2010, 381, 266–286. [Google Scholar] [CrossRef]
  17. Thorndahl, S.; Einfalt, T.; Willems, P.; Nielsen, J.E.; Veldhuis, M.-C.; Arnbjerg-Nielsce, K.; Rasmussen, M.R.; Molnar, P. Weather radar rainfall data in urban hydrology. Hydrol. Earth Syst. Sci. 2017, 21, 1359–1380. [Google Scholar] [CrossRef] [Green Version]
  18. Peleg, N.; Ben-Asher, M.; Morin, E. Radar subpixel-scale rainfall variability and uncertainty: Lessons learned from observations of a dense rain-gauge network. Hydrol. Earth Syst. Sci. 2013, 17, 2195–2208. [Google Scholar] [CrossRef]
  19. Krajewski, W.F.; Villarini, G.; Smith, J.A. Radar-rainfall uncertainties: Where are we after thirty years of effort? Bull. Am. Meteorol. Soc. 2010, 91, 87–94. [Google Scholar] [CrossRef]
  20. Kirstetter, P.E.; Delrieu, G.; Boudevillain, B.; Obled, C. Towards an error model for radar quantitative precipitation estimation in the Cévennes-Vivarais region, France. J. Hydrol. 2010, 394, 28–41. [Google Scholar] [CrossRef]
  21. Delrieu, G.; Bonnifait, L.; Kirstetter, P.-E.; Boudevillain, B. Dependence of radar quantitative precipitation estimation error on the rain intensity in the Cévennes region, France. Hydrol. Sci. J. 2014, 59, 1308–1319. [Google Scholar] [CrossRef] [Green Version]
  22. Dhiram, K.; Wang, Z.H. Evaluation on radar reflectivity-rainfall rate (Z-R) relationships for Guyana. Atmos. Clim. Sci. 2016, 6, 489–499. [Google Scholar] [CrossRef]
  23. Paz, I.; Willinger, B.; Gires, A.; Ichiba, A.; Monier, L.; Zobrist, C.; Tisserand, B.; Tchiguirinskaia, I.; Schertzer, D. Multifractal comparison on reflectivity and polarimetric rainfall data from C- and X-Band radars and respective hydrological responses of a complex catchment model. Water 2018, 10, 269. [Google Scholar] [CrossRef]
  24. Emmanuel, I.; Andrieu, H.; Tabary, P. Evaluation of the new French operational weather radar product for the field of urban hydrology. Atmos. Res. 2012, 103, 20–32. [Google Scholar] [CrossRef]
  25. Villarini, G.; Krajewski, W.F. Review of the Different Sources of Uncertainty in Single Polarization Radar-Based Estimates of Rainfall. Surv. Geophys. 2010, 31, 107–129. [Google Scholar] [CrossRef]
  26. Ciach, G.J.; Krajewski, W.F. Radar-rain gauge comparisons under observational uncertainties. J. Appl. Meteorol. 1999, 38, 1519–1525. [Google Scholar] [CrossRef]
  27. Gires, A.; Tchiguirinskaia, I.; Schertzer, D.; Schellart, A.; Berne, A.; Lovejoy, S. Influence of small scale rainfall variability on standard comparison tools between radar and rain gauge data. Atmos. Res. 2014, 138, 125–138. [Google Scholar] [CrossRef] [Green Version]
  28. Libertino, A.; Allamano, P.; Claps, P.; Cremonini, R.; Laio, F. Radar estimation of intense rainfall rates through adaptive calibration of the Z-R relation. Atmosphere 2015, 6, 1559–1577. [Google Scholar] [CrossRef]
  29. Borup, M.; Grum, M.; Linde, J.J.; Mikkelsen, P.S. Dynamic gauge adjustment of high-resolution X-band radar data for convective rain storms: Model-based evaluation against measured combined sewer overflow. J. Hydrol. 2016, 539, 687–699. [Google Scholar] [CrossRef] [Green Version]
  30. Pauthier, B.; Bois, B.; Castel, T.; Thévenin, D.; Smith, C.C.; Richard, Y. Mesoscale and local scale evaluations of quantitative precipitation estimates by weather radar products during a heavy rainfall event. Adv. Meteorol. 2016, 2016, 1–9. [Google Scholar] [CrossRef]
  31. Ramli, S.; Tahir, W. Radar hydrology: New Z/R relationship for quantitative precipitation estimation in Klang River basin, Malaysia. Int. J. Environ. Sci. Dev. 2011, 2, 223. [Google Scholar] [CrossRef]
  32. Tabary, P.; Boumahmoud, A.-A.; Andrieu, H.; Thompson, R.J.; Illingworth, A.J.; Le Bouar, E.; Testud, J. Evaluation of two “integrated” polarimetric Quantitative Precipitation Estimation (QPE) algorithms at C-band. J. Hydrol. 2011, 405, 248–260. [Google Scholar] [CrossRef]
  33. Alfieri, L.; Claps, P.; Laio, F. Time-dependent Z-R relationship for estimating rainfall fields from radar measurements. Nat. Hazards Earth Syst. Sci. 2010, 10, 149–158. [Google Scholar] [CrossRef]
  34. Villarini, G.; Krajewski, W.F. Empirically based model ling of radar-rainfall uncertainties for a C-band radar at different time-scales. Q. J. R. Meteorol. Soc. 2009, 135, 1424–1438. [Google Scholar] [CrossRef]
  35. Biggs, E.M.; Atkinson, P.M. A comparison of gauge and radar precipitation data for simulating an extreme hydrological event in the Severn Uplands, UK. Hydrol. Process. 2011, 25, 795–810. [Google Scholar] [CrossRef]
  36. Licznar, P.; Krajewski, W.F. Precipitation type specific radar reflectivity-rain rate relationships for Warsaw, Poland. Acta Geophys. 2016, 64, 1840–1857. [Google Scholar] [CrossRef]
  37. Jakubiak, B.; Licznar, P.; Malinowski, S.P. Rainfall estimates from radar vs. raingauge measurements. Warsaw case study. Environ. Prot. Eng. 2014, 40, 159–170. [Google Scholar] [CrossRef]
  38. Mapiam, P.P.; Nutchanart, S. Climatological Z-R relationship for radar rainfall estimation in the upper Ping river basin. ScienceAsia 2008, 34, 215–222. [Google Scholar] [CrossRef]
  39. Schellart, A.; Liguori, S.; Krämer, S.; Saul, A.; Rico-Ramirez, M.A. Comparing quantitative precipitation forecast methods for prediction of sewer flows in a small urban area. Hydrol. Sci. J. 2014, 59, 1418–1436. [Google Scholar] [CrossRef] [Green Version]
  40. Gires, A.; Onof, C.; Maksimović, Č.; Schertzer, D.; Tchiguirinskaia, I.; Simoes, N. Quantifying the impact of small scale unmeasured rainfall variability on urban runoff through multifractal downscaling: A case study. J. Hydrol. 2012, 442–443, 117–128. [Google Scholar] [CrossRef]
  41. Winterrath, T.; Rosenow, W.; Weigl, E. On the DWD quantitative precipitation analysis and nowcasting system for real-time application in German flood risk management. In Proceedings of the 8th International Symposium on Weather Radar and Hydrology (WRaH 2011), Exeter, UK, 18–21 April 2011. [Google Scholar]
  42. Löwe, R.; Thorndahl, S.; Mikkelsen, P.S.; Rasmussen, M.R.; Madsen, H. Probabilistic online runoff forecasting for urban catchments using inputs from rain gauges as well as statically and dynamically adjusted weather radar. J. Hydrol. 2014, 512, 397–407. [Google Scholar] [CrossRef]
  43. Aronica, G.; Cannarozzo, M. Studying the hydrological response of urban catchments using a semi-distributed linear non-linear model. J. Hydrol. 2000, 238, 35–43. [Google Scholar] [CrossRef]
  44. Segond, M.L.; Neokleous, N.; Makropoulos, C.; Onof, C.; Maksimovic, C. Simulation and spatio-temporal disaggregation of multi-site rainfall data for urban drainage applications. Hydrol. Sci. J. 2007, 52, 917–935. [Google Scholar] [CrossRef] [Green Version]
  45. Berne, A.; Delrieu, G.; Creutin, J.-D.; Obled, C. Temporal and spatial resolution of rainfall measurements required for urban hydrology. J. Hydrol. 2004, 299, 166–179. [Google Scholar] [CrossRef]
  46. Ochoa-Rodriguez, S.; Wang, L.-P.; Gires, A.; Pina, R.D.; Reinoso-Rondinel, R.; Bruni, G.; Ichiba, A.; Gaitan, S.; Cristiano, E.; van Assel, J.; et al. Impact of spatial and temporal resolution of rainfall inputs on urban hydrodynamic modeling outputs: A multi-catchment investigation. J. Hydrol. 2015, 531, 389–407. [Google Scholar] [CrossRef]
  47. Rossman, L.A. Storm Water Management Model User’s Manual Version 5.0; National Risk Management Research Laboratory, U.S. Environmental Protection Agency: Cincinnati, OH, USA, 2010.
  48. Hsu, M.H.; Chen, S.H.; Chang, T.J. Inundation simulation for urban drainage basin with storm sewer system. J. Hydrol. 2000, 234, 21–37. [Google Scholar] [CrossRef] [Green Version]
  49. Barszcz, M. Influence of applying infiltration and retention objects on the runoff of rainwater on a plot and catchment scale—Case study of the Służewiecki Stream subcatchment in Warsaw. Pol. J. Environ. Stud. 2015, 24, 57–65. [Google Scholar] [CrossRef]
  50. Li, C.; Liu, M.; Hu, Y.; Gong, J.; Xu, Y. Modeling the quality and quantity of runoff in highly urbanized catchment using storm water management model. Pol. J. Environ. Stud. 2016, 25, 1573–1581. [Google Scholar] [CrossRef]
  51. Wu, J.Y.; Thompson, J.R.; Kolka, R.K.; Franz, K.J.; Stewart, T.W. Using the storm water management model to predict urban headwater stream hydrological response to climate and cover change. Hydrol. Earth Syst. Sci. 2013, 17, 4743–4758. [Google Scholar] [CrossRef]
  52. Krebs, G.; Kokkonen, T.; Valtanen, M.; Koivusalo, H.; Setala, H. A high resolution application of a stormwater management model (SWMM) using genetic parameter optimization. Urban Water J. 2013, 10, 394–410. [Google Scholar] [CrossRef]
  53. Moszkowicz, S.; Tuszyńska, I. Meteorologia Radarowa. Podręcznik Użytkownika Informacji Radarowej IMGW (Radar Meteorology. IMGW Radar Information User’s Manual); Instytut Meteorologii i Gospodarki Wodnej: Warszawa, Poland, 2006. (In Polish) [Google Scholar]
  54. Marshall, J.S.; Palmer, W.M.K. The distribution of raindrops with size. J. Meteorol. 1948, 5, 165–166. [Google Scholar] [CrossRef]
  55. Morin, E.; Krajewski, W.F.; Goodrich, D.C.; Gao, X.; Sorooshian, S. Estimating rainfall intensities from weather radar data: The scale-dependency problem. J. Hydrometeorol. 2003, 4, 782–797. [Google Scholar] [CrossRef]
  56. Battan, L.J. Radar Observations of the Atmosphere; The University of Chicago Press: Chicago, IL, USA, 1973; ISBN 0226039196. [Google Scholar]
  57. Smith, J.A.; Krajewski, W.F. A modeling study of rainfall rate-reflectivity relationships. Water Resour. Res. 1993, 29, 2505–2514. [Google Scholar] [CrossRef]
  58. Chumchean, S. Improved Estimation of Radar Rainfall for Use in Hydrological Modelling. Ph.D. Thesis, University of New South Wales, Sydney, Australia, 2004. [Google Scholar]
  59. Nash, J.E.; Sutcliffe, J.V. River flow forecasting through conceptual models. Part I—A discussion of principles. J. Hydrol. 1970, 10, 282–290. [Google Scholar] [CrossRef]
  60. Moriasi, D.N.; Arnold, J.G.; Van Liew, M.W.; Bingner, R.L.; Harmel, R.D.; Veith, T.L. Model evaluation guidelines for systematic quantification of accuracy in watershed simulations. Trans. ASABE 2007, 50, 885–900. [Google Scholar] [CrossRef]
  61. American Society of Civil Engineers (ASCE). Task Committee on Definition of Criteria for Evaluation of Watershed Models of the Watershed Management Committee, Irrigation and Drainage Division. Criteria for evaluation of watershed models. J. Irrig. Drain. Eng. 1993, 119, 429–442. [Google Scholar] [CrossRef]
  62. Ozga-Zielińska, M.; Brzeziński, J. Hydrologia Stosowana (Applied Hydrology); Wydawnictwo Naukowe PWN: Warszawa, Poland, 1997; ISBN 83-01-12194-7. (In Polish) [Google Scholar]
Figure 1. Drainage and measuring system of the Służewiecki Stream catchment in Warsaw; cross-sections (outlet-profiles) and rainfall stations: (1) Rosoła, (2) Kłobucka, (3) Okęcie, (4) Ursynów.
Water 10 01007 g001
Figure 2. The storm drainage system, subcatchments and rain gauges (two existing and 64 virtual objects) in the SWMM (Storm Water Management Model) model for the studied area.
Water 10 01007 g002
Figure 3. SRI (Surface Rainfall Intensity) product (map of rainfall intensity) and area covering the analyzed catchment (156 pixels).
Water 10 01007 g003
Table 1. Rainfall totals using rain gauges and SRI product data.
Date of the EventAverage Intensity (mm·h−1)Rainfall Totals (mm)Relative Error (%)
Rain GaugesRain GaugesSRI Product
O 1U 2OUOUOU
1 October 200617.814.014.87.03.31.6−77.7−77.7
6 August 20066.6-52.6-17.6-−66.5-
2 July 20075.76.68.611.01.93.6−77.8−67.6
22 July 200718.821.89.414.53.63.1−62.2−78.4
2 August 20088.85.38.86.22.11.5−76.6−76.3
15 August 20089.811.922.843.66.610.1−71.0−76.9
16 August 2008-13.0-15.2-2.5-−83.6
30 May 2009-9.0-13.5-5.0-−62.7
16 June 2009-4.5-10.5-2.6-−75.0
23 June 2009-3.9-7.8-3.4-−56.9
25 June 2009-14.6-41.4-10.1-−75.6
5 July 2009 11 a.m.-26.2-21.8-2.3-−89.6
5 July 2009 1 p.m.-13.4-33.6-7.8-−76.9
Median value9.312.512.114.03.43.2−73.8−76.6
Note: 1,2: Rain gauges: O—Okęcie, U—Ursynów.
Table 2. Rainfall totals using rain gauges and SRI product data.
Date of the EventRainfall Totals (mm)Relative Error (%)
Equation (2)Equation (3)SRI 3.6Equation (2)Equation (3)SRI 3.6
O 1U 2OUOUOUOUOU
1 October 200615.85.016.54.411.94.26.7−29.011.6−36.7−19.7−40.6
6 August 200661.6-62.1-63.5-17.1-18.1-20.6-
2 July 20075.612.66.311.76.912.8−35.214.2−27.36.2−20.116.5
22 July 200720.114.919.615.512.811.31143.01096.836.1−22.3
2 August 20087.04.27.45.77.45.3−20.2−32.9−15.5−7.7−15.7−14.7
15 August 200824.737.230.235.623.836.28.1−14.632.5−18.34.4−17.0
16 August 2008-10.7-12.0-9.0-−29.4-−20.9-−41.1
30 May 2009-20.7-21.0-18.2-53.0-55.3-34.5
16 June 2009-8.1-8.3-9.5-−23.2-−20.8-−9.8
23 June 2009-10.5-10.8-12.1-34.0-38.5-54.9
25 June 2009-46.1-53.7-36.3-11.3-29.7-−12.3
5 July 2009 a-10.1-12.5-8.2-−53.7-−42.6-−62.6
5 July 2009 b-31.2-27.1-27.9-−7.1-−19.4-−16.8
Median value18.011.618.112.312.311.718.726.122.720.819.919.7
Note: 1,2: Rain gauges: O—Okęcie, U—Ursynów.
Table 3. Results using rainfall depths measured at rain gauges.
Date of the EventMeasured ValuesSimulated ValuesRelative Error (%)
Peak Flow (m3·s−1)Volume (m3·103)Peak Flow (m3·s−1)Volume (m3·103)Peak Flow Volume
R 1K 2RKRKRKRKRK
2 July 20076.060.7646.014.74.950.8044.816.8−18.35.3−2.514.5
15 August 200821.511.31369.269.520.841.44342.674.5−3.29.7−7.27.2
Note: 1,2: Cross-sections (outlet-profiles): R—Rosoła, K—Kłobucka.
Table 4. Results using rainfall depths estimated from radar data.
Date of the EventSimulated ValuesRelative Error (%)
Peak Flow (m3·s−1)Volume (m3·103)Peak Flow Volume
R 1K 2RKRKRK
Scenario 1
2 July 20070.820.106.01.6−86.5−87.5−87.0−88.9
15 August 20082.480.7847.416.9−88.5−40.2−87.1−75.7
Scenario 2
2 July 20075.830.8252.414.5−3.88.414.0−0.9
15 August 200822.031.66394.290.32.426.46.829.9
Scenario 3
2 July 20075.350.7750.215.5−11.71.79.15.7
15 August 200819.681.64331.882.2−8.525.3−10.118.3
Scenario 4
2 July 20075.211.0056.019.1−14.131.721.830.4
15 August 200822.951.85441.394.86.740.819.636.5
Scenario 5
2 July 20075.550.7046.312.6−8.5−7.50.7−14.3
15 August 200817.351.58273.571.6−19.420.8−25.93.0
Scenario 6
2 July 20075.400.7846.614.9−10.93.41.31.6
15 August 200816.901.55261.069.3−21.418.2−29.3−0.2
Note: 1,2: Cross-sections (outlet-profiles): R—Rosoła, K—Kłobucka.

