Abstract
An unexpected and massive redistribution of fine sediment in a large Alpine reservoir was triggered by a further lowering of the water level to conduct maintenance work. This caused the need of a total redesign of the existing head race intake for a high head power plant in the Austrian Alps. Two main geometry options for the trash rack support structure are compared with numerical simulations (ANSYS-CFX) as well as with a scale model test (scale 1:20). The laboratory experiment substantially benefited from the preliminary numerical investigation in respect of the location and implementation of the model boundaries. In return was the confidence in the numerics strengthened by the successful validation of the local head loss and the velocity distribution for the main operation cases. This allowed that the main inputs for the structural design and the further optimisation is conducted only with the 3D-numerical tool. The paper presents the interlaced concept as well as the main finding of the investigation, which lead to a successful adaptation of the intake structure.
1. Introduction
1.1. General
Water is extracted out of natural water body for different purposes, such as drinking, cooling, irrigation and hydro power. The wide diversity of structures can be subdivided due to the source of the water, namely rivers or reservoirs. In case of energy production in a run-of-river power plant with a comparable small usable energy head, the inlet head losses and the velocity distribution in front of the turbine are key concerns in the design process [1,2,3]. Furthermore, the entrance of air and swirl can reduce the durability and the energy production of the turbine [4,5,6,7,8,9]. The entrance of animals or objects [10,11,12,13,14] has to be prevented for all hydro power plants (HPP) independently of the usable head. The installed storage capacity of high head power plants is in the most cases far bigger due to an upper reservoir. This allows to provide renewable energy to the grid, when it is needed and in case of a pumped storage power plant also to balance consumption and producers. The bigger distance of the intake to the turbines and the free water surface is a big advantage in the design process in comparison to run-of-river power plants.
Independently of the usable energy height, the additional acceptable amount of sediment in the water is limited. Consequently, the management of the suspended sediment in the water is a general challenge [15]. Especially for reservoirs the continuous loss of possible storage volume is an extremely important question in connection with the sustainability of the HPP [16] and in extreme cases intake structures can be endangered, which would obviously hamper the function of water intakes such as head reace or bottom intake structures. Chamoun et al. [17] summarised possible strategies to manage the inflowing sediments. Different aspects of this transport process in reservoirs are investigated experimentally [18,19,20,21] as well as numerically [22,23,24,25]. Both modelling approaches can benefit from nature measurements in reservoirs [26,27,28] and can help to optimise the arrangements to handle the sediment.
In general, sedimentation is a continuous process which adds up but allows to react and guide the process in some way. An exceptional case triggered by a single rearrangement of accumulated sediment in the back of the reservoir led to the adaptation of an intake structure (Section 1.2). The paper summarises the concept and the major findings of a hydraulic investigation of an existing intake structure, which was affected by this short but massive increase of the sediment level.
Two different concepts for the adaptation of the existing intake structure with a new trash rack are up for discussion. Both variations are compared based on results gained by numerical simulation and scale model tests. Hager and Boes [29] highlighted the strong connection between both approaches and the need of a wide validation. Based on such an independent comparison, the confidence in the 3D-numerics can be strengthened, which allows to deliver forces and velocities [3,30,31] as an input for the structural design process.
1.2. Project-Related Background
The reservoir Gepatsch (Kaunertal, Tyrol, Austria) has a capacity of 139 million [32]. It provides an annual storage reservoir for the hydro power plant (HPP) Kaunertal with a gross head between 793 and 895 m, which indicates the high variance in the water level in the reservoir. It was continuously used since the construction in the 1960s. End of 2015, an exceptional reduction of the water level was scheduled to inspect the head race tunnel as well as to renew the two intake structures. In addition to the lower intake structure shown in Figure 1, a second intake is situated approximately 35 m higher, which is 72 m lower than the top water level of the reservoir at 1767 m above sea level. Both are connected to the same head race tunnel and in case of a higher water level the total discharge is split between those intakes. Consequently, the velocities in normal operations are reduced in comparison to lower water level.
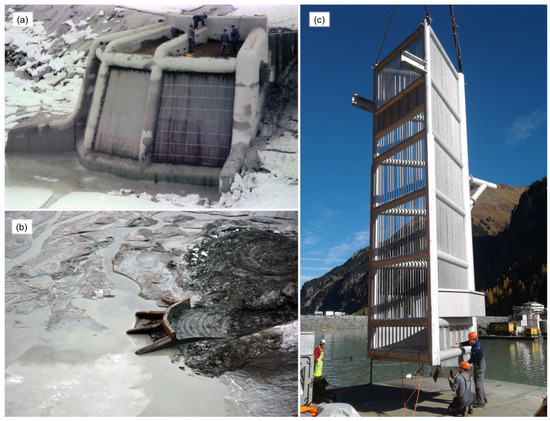
Figure 1.
Archive picture of the lower intake structure (a)—situation end of 2015 with the increase sediment level (b)—final works on one trash rack structure (intake tower) near the installation location (c)—(TIWAG).
Part of the planned work was the replacement of all trash rack screens with new ones made of stainless steel. This adaptation should allow a future expansion of the existing HPP and the addition of a planned new HPP (pump storage power plant), which will use the reservoir Gepatsch as a lower one. During the design process different three-dimensional(3D)-numerical simulations were conducted with a focus on the velocities at the screens. The investigation contained simulations with ANSYS-CFX and also FLOW-3D. The comparison of these two commercial codes showed a good agreement.
The lowering of the water level led to an unpredictable and quite dramatic mobilisation of fine sediment from the rear part of the reservoir. This amount was well documented and has been accumulated over the lifetime of the reservoir. It is assumed that it was stabilised by a narrowing in the middle of the reservoir. This restrained the sediment over the decades comparable to an obstacle for the turbidity current [25,33]. The reduction of the water pressure triggered the sudden movement of the fine sediment in the direction of the dam and the intake structure. The process of the lowering of the water level had to be interrupted and the natural inflow started to fill up the reservoir again. Subsequent measurements of the ground after this incident showed that the fine sediment covered the whole reservoir nearly levelled. Only the upper three trash rack sections were not covered. The trash rack in the now mostly submerged lower sections could endure the pressure and the entrance of sediment in the structure itself is comparable small (Figure 1).
Excavations of the sediment with airlift [17] were conducted as soon as possible but are generally restrained because of the limited accessibility due the alpine circumstances. The capacity of sediment extraction method in combination with a comparable high water level allows only a very small progress. Consequently, an alternative solution had to be found with the following main boundary conditions:
- further stabilisation and protection of the vertical trash racks
- new trash racks using only the upper three field of the intake
- no limitation in the operation of the HPP (as far as it is possible)
- all works have to be done under water (saturation diving)
The last mentioned point is caused by the decision that in future the reservoir should not be lowered under the normal operation level. This should prevent a comparable mobilisation of the fine sediment and an aggradation of the sediment close to the intake. This restriction is essential and had a big influence on the decision, which variation of trash rack construction was chosen. Section 2.2 and Figure 2 present the two main options for the new trash rack construction.
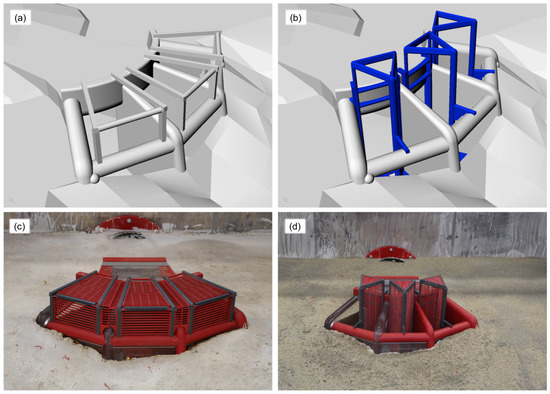
Figure 2.
Digital model (a,b) and dry scale model (c,d) of the two trash rack options—build-on variation (left) and triangle structure (right).
The conducted hydraulic investigations permanently provided input for the design process of the new structure. The application of numerical simulations allowed a very tight time schedule for the preparation of the adaptation at the intake under the new boundary conditions. Main findings could be assured by validation experiments and strengthened the numerical investigation. In the paper, the interaction between the two different modelling approaches are summarised as well as the individual advantages. The drawn conclusions based on the presented investigation enabled successful renewal of the intake with three identical intake towers (Figure 1c) in autumn of 2017. An overview of the conducted works including in the project are given by [34].
2. Materials and Methods
2.1. Overview
The presented hydraulic investigation involved ongoing numerical simulations, which delivered additional input for the design team, as well as a scale model test (scale 1:20). The laboratory model allowed to validate the main numerical results and was also a support for the diver, who had to conduct the work at the intake. The project schedule includes three different phases:
- Preliminary numerical simulation to test first assumptions and prepare the scale model test (Section 2.4).
- Validation with the scale model test and comparison of the two main geometry variations for the new trash rack structure (Section 2.2 and Section 3.2)
- Further optimisation including refinement in the structure and additional load cases (Section 3.3)
The first goal in phase (1) was to adapt the previously gained knowledge of the flow field to the updated sedimentation height. It could be shown that a limitation to the upper nearly horizontal trash racks is possible and consequently a full restoration of the intake can be reached despite the massive increase of the sediment level (Section 1.2).
The decision, which of the variations presented in Section 2.2 should be refined, marked the end of phase (2). Based on the very good results of the comparison of the two modelling approaches, all further optimisation in phase (3) was conducted with numerical simulations.
All the investigation uses a fixed bed independently of the modelling method. Phase (1) started with a simplified geometry model with a horizontally filled ground and as soon as the new measurement was available, this simplification was discarded. It is assumed that with a constant operation of the HPP the sediment in front of the structure will get reduced and more water will enter the intake. Consequently, the investigation deals with conservative boundaries.
The trash rack had to be simplified as a homogeneous body in the numerics, which allows to introduce direction depending local head losses for the flow. A discretization of the individual bar would be to costly and the numerics focuses on the main supply structure. In the scale model test a trash rack with the same obstruction rate is included (bars are joined together). For the comparison all experimental results are converted into nature scale.
2.2. Trash Rack Options
Based on the boundary conditions explained in Section 1.2, a preliminary numerical simulation showed that it is sufficient to use only the top three intake sections. A renewal and strengthening of the existing screens was no option because it is to close to the new sediment level and would not allow a possible expansion of the structure with a further increasing sediment level. Consequently, the nearly horizontal existing trash rack at the top of the intake structure has to be removed and replaced by a completely new concept. Furthermore, the three big existing screens (vertical screens in Figure 1) have to be secured and stabilised so that they can stay in place.
Two main construction options were identified: (a) a built-on structure over each of the three screens (variation ) or alternatively (b) triangle shaped constructions . Figure 2 shows the two geometry variations as a CAD-drawing and the dry scale model geometry.
Option has the main advantage that the plains with the new trash rack bars are outside the existing structure. The stabilisation of the existing front trash rack is done by a new screen, which is inserted inside the structure. Critical points are the connection of the new with the existing structures as well as the intersection of the individual fields, which is further complicated by the streamlined shape of the walls. This variation needs a lot of adaptation and tasks at the intake, which all have to be executed by the divers and add further risks.
Consequently, the main motivation of alternative option is to reduce the installation work by the divers to the absolute minimum, the time they have to spend inside the structure and the guaranty of correct positioning of the structures. Option provides for each of the three openings of the structure a triangle trash rack structure (intake tower), which is higher than the intake. The two fronts of the structure include bars as well as the top and the rear section outside the structure (see also Figure 1c and Section 3.3, which presents the final option ). Each of the three structures is assembled outside the water, floated into position and lowered down into the existing intake. The inserted part hinges itself on the top wall of the intake and uses the transom as a supporting point. A flexible sealing is placed at each connection and allows an easy adaptation onto the existing topology. After the alignment, underwater concrete is fed through the hollow construction and fills the space outside the new triangle trash rack to the old vertical one. This allows to support the existing structure and fasten the new one. This process is repeated for all three fields.
2.3. Numerics
Based on the previous experiences with the numerical simulation of the project area (Section 1.2), ANSYS-CFX (Version 17.2) was chosen as a main numerical tool. This commercial software package is well validated and has a wide area of application. Examples of successful usage of this 3D-numerical code are the optimisation of turbine [35,36,37], intake structures [38,39], spillways [40], water-jet turbines [41], surge tank throttles [42], swirl generating devices [43] and also heat flux in photovoltaic system [44]. Key reasons for this decision are the adaptable post-processing as well as the very flexible meshing, which allows to include all needed details of the geometry in the spatial discretization.
All simulations are conducted with the steady state solver with double precision to prevent round-off errors. The buoyancy model is activated and the buoyant reference temperature is set to 5 C, which is also the fluid temperature for the isothermal calculation. The standard Shear Stress Transport (SST) turbulence mode [45,46] solves the additional Reynolds stress term of the Reynolds-averaged Navier-Stokes (RANS)-equations. The high resolution option is chosen for the advection scheme as well as the turbulence numerics. Initially, the numerical timestep is set to automatic (Conservative length scale option with a time factor of 0.1) for the first run and fixated in a second step. The domain is initialised with hydrostatic pressure and all velocities are set to 0 m/s. A good convergence behaviour could be observed for the simulations. The global loss between inlet and outlet is monitored, while the computation. This process is manually stopped and analysed in the Post-Processing. The main numerical investigations are conducted in nature scale except specific simulations in phase (1) (Section 2.1).
A key finding of the preliminary numerical simulations is that the higher velocities of the flow are concentrated around the structure and very quickly decrease in the reservoir. This could also for example be observed by measurements presented in [28] for a pumped-storage intake/outlet. Consequently, the model extent can be considerably reduced for the numerical simulations as well as the scale model test. Figure 3c,d shows the two approaches.
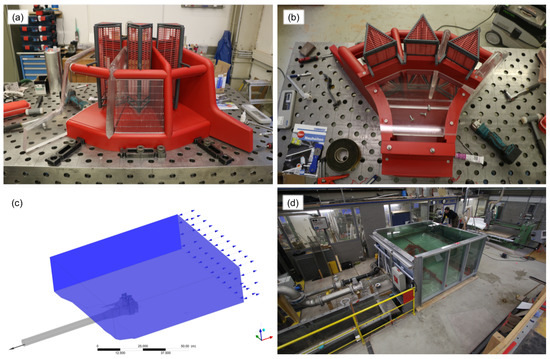
Figure 3.
Triangular trash rack (option ) and intake structure on the modelling bench (a,b) and boundary conditions of the numerical model (c) compared to the filled scale model test (d).
Water flows out of the structure in case of the surge tank oscillation or after the planned expansion project is build. In such a case, a in homogeneous loading on the three similar parts of the intake structure can be observed. The outflowing water forms a jet, which has also an effect on a wider region of the reservoir in front of the intake structure. Those load cases are only investigated with the 3D-numerics covering the complete width of the reservoir on a length of about 300 m.
It could be further proven that the height of the free surface in the reservoir down to the minimum used level has only an negligible effect of the flow field. This allows to eliminate the water level as a degree of freedom for the investigation. Consequently, the numerical simulations are limited to one fluid only, which is water with a constant density and temperature. Consequently, the compressibility of water is neglected.
The free surface is simplified as a free slip wall boundary conditions as well as the walls representing the rest of the reservoir. Only the side ahead of the structure is used as an inflow area, which is defined as an opening with a fixed pressure definition (Figure 3c). At the end of the reduced head race tunnel the normal speed homogeneous over the whole section is fixated. This boundary condition defines the quantity as well as the direction of the flow. All other surfaces are simplified as a smooth wall.
The fluid domain includes a reservoir part with an approximation dimension of 60 m in x-direction (main flow direction), a width of 80 m (y-direction; symmetrical split along the symmetry axis of the intake structure) and a height of 23 m (water depth over the new sediment level). The boundary layer near all walls are refined with 15 layers starting with a first thickness of mm and a growth rate of 1.1 (–). A global maximum cell size of 1 m is applied and near the intake structure this value is reduced to 10 cm respectively 5 cm in the main investigation area. Critical surfaces are further split and locally refined to get an acceptable mesh quality. For the final geometry (Section 3.3) the mesh included nearly 18.5 million elements (5.9 million nodes).
2.4. Scale Model Test
For the laboratory experiment the complete geometry of the intake structure is downscaled according to Froude similarity. Heller [47] suggests a typical scale factor (1:) between 1:50 to 1:100 for intakes. Comparable investigations can be found with a -value of 40 [48], 33.77 [30], 30 [49] respectively 18 [4]. Consequently, the chosen 1:20 scale is in the range of literature values and a good compromise between required setting-up time for the model and accuracy of the laboratory experiment. It also allows to reuse the model as an illustrative material for the diver to practice and plan the challenging underwater work.
Figure 3a,b shows the scaled structure. For both trash rake options presented in Section 2.2 a structure has to be added to the original intake. The transparent sides are included to give the divers a better insight into the model, when they were preparing their work. For the hydraulic tests, the model is nearly fully covered in the fixed bed representing the new sediment level (Figure 2c,d). One side of the model reservoir is transparent, so that the flow and the velocity measurement could be observed (Figure 3d).
The outflow through the structure is measured with an electro magnetic flow meter and controlled by a valve. Two sides of the reservoir (orthogonal to the transparent side) are fully used as weirs with a very long crest. Based on this design, the model can be permanently overloaded by the inflow, so that the weir is constantly overflowed. On the one hand, this helps to stabilise the water level independently of the current discharge fluctuation taken out at the intake structure. On the other hand, it reduces the needed effort to also control the inflowing discharge. In the operation phase of the model this was an enormous advantage and allowed to deliver reliable results after a very short time of verification measurements.
Different inflow concepts were tested numerically in the first phase of the project (Section 2.1). The best results could be found with an inlet through a pipe with adjustable holes integrated in the ground near the opposite wall of the intake structure. The openings are covered with a grid to further homogenise the flow.
The quality of the boundary conditions are proven with an extensive velocity measurement campaign covering the hole model reservoir. The 3D-vectrino is also used to measure the velocity vector near the intake (Section 3.2.2). Therefore, it has to be fully submerged. With an additional numerical simulation in model scale, it was proven that this has only a insignificant influence on the velocities. The second used measurement system are differential pressure transmitter, which are chosen according to the approach presented by Gabl et al. [50]. Based on those measurements the local head loss of the different variations is evaluated. The comparison is presented in Section 3.2.1. All model assumption and the combination with the 3D-numerical simulation are further discussed in Section 4.
3. Results
3.1. Overview
The specific needs of the planning process influenced the hydraulic investigation in real time and required to test alternative approaches and detailed geometry adaptation as quickly as possible. The test series covered different geometry and boundary variations as well as detailed analysis based on the specific questions raised by the design team. In the presented paper two specific aspects are discussed, which are interesting for a wider audience: model validation (Section 3.2) and final geometry of the adaptation of the intake structure (Section 3.3).
The first part includes results based on the numerical model and the scale model test and the conducted comparison bases on two values: (a) local head loss of the complete intake structure (Section 3.2.1) and (b) velocity distribution, which is represented by the velocity vectors at certain points close to the intake in the reservoir (Section 3.2.2). The results are presented for both geometry options and (Section 2.2 and Figure 2) and two discharges Q of 50 and 60 . The investigated lower discharge is a normal load for constant operation at a lower water level. If the water level reaches the higher second intake the total discharge is split between the intakes. As a maximum case based on the transient behaviour (surge tank oscillation), the second discharge with 60 is defined (Table 1). Both discharges are investigated under steady conditions. For all comparison, the laboratory results are converted into nature scale. Based on this, the decision was made, which of the trash rack options was chosen for the further optimisation (Section 2.2).

Table 1.
Comparison of the local head loss (m) of the scale model test (SMT) with a modified trash rack and the numerical simulation (N) with no additional loss caused by the trash rack for two different discharges Q and two different variations of trash racks—all dimensions in nature scale.
Strengthened by the comparison of these two independent modelling approaches, the final optimisation is limited to 3D-numerical simulations. In addition to further geometry variation, advanced load cases were investigated to cover conditions of water flowing out of the structure and also a part blockage of the trash rack. The key findings, which led to the final geometry, are presented in Section 3.3. A discussion on both modelling approaches is complemented in Section 4.
3.2. Comparison Scale Model Test and Numerics—Validation
3.2.1. Local Head Loss
A key value for the future operation is the local head loss of the complete new adapted intake. It is used as the first parameter for the comparison of the two modelling approaches. The calculation of is based on the Bernoulli equation in comparing the energy height at two different cross sections of the stream line [51]. It is assumed that the flow condition as well as the density of the fluid (water) are constant. At both cross sections the elevation z (relative to a reference plane), pressure p and velocity v (average value of the complete cross section) are evaluated. The local head loss is defined by
In general, the two cross sections are numbered in the flow direction and for the following part the indexes base on the main case of water flows into the structure. For the reservoir it can be assumed that the velocity is very small and consequently that the velocity head can be neglected.
One option for the definition of the boundaries for the Bernoulli equation is to use the water level in the reservoir as reference level ( = 0 m) and consequently the pressure bar respectively equal to the reference pressure . The disadvantage is that in this case the relative pressure in the pipe (downward the intake structure) has to be simultaneously measured with the relative height distance (measurement of the water level in relation to the centre of the pipe). Instead of this, a differential pressure transmitter directly compares the pressure from ground points in the laboratory reservoir with the second cross section in the pipe connected to the intake structure. Therewith, the measurement can be simplified to one continuous recording and the overall accuracy can be increased with the correct choice of the instrument [50].
In Equation (1), the gravity acceleration g as well as the fluid density are assumed to be constant. The kinetic energy correction coefficient compensates an inhomogeneity in the velocity distribution [3]. Therefore, the kinetic energy of the actual velocity profile is compared to the theoretical one based on a constant velocity distribution with a mean velocity over the complete cross section with an area A [3,42,51,52]:
In the presented case, the -value can only be calculated for the numerical results. This value is used to define the location of the second cross section in the laboratory model [42] as part of the preliminary phase of the project (Section 2.1). A typical -value for a turbulent velocity distribution in a pipe is in the range of 1 (uniform constant velocity distribution) and 2 for laminar condition (parabolic distribution) [3,52].
Three different types of local head losses are presented in Table 1 as results. The value bases on the measurements of the scale model test, respectively on the numerics. For both analysis the value is assumed to be 1 (–), which is a common simplification if the full velocity distribution is not available. The third value includes the numeric values for , which varies in this particular case between 1.01 and 1.02 (–). If the correct value is included, the velocity head in the second cross section is increased. This leads to a smaller local head loss in the range of 1 to 2 cm.
The different approach of the trash racks has to be considered by comparing the local head loss values in Table 1. The scale model test includes a modelled trash rack with the an equal obstruction rate as a down scaled version (Figure 2c,d).
In the numerical simulation, a comparably full discretization of the individual bars of the trash rack and the therewith caused turbulence structures would consume a multitude of the mesh cells. Consequently also the used RANS approach should be exchanged by a large eddy simulation to capture the transient changes behind the bars [53]. This would increase the calculation time in a substantial amount. In stead of a such a fully implementation, it is assumed that the influence of the bar on the velocity distribution is limited to a close-up range at the structure and that the effects homogenise very quickly. Hence, the main influence of the implementation is seen in the pressure loss along the flow path, which can also be simplified modelled with a homogeneous subdomain instead of the trash rack bars. The therefore needed loss coefficient can be either based on literature values [51,54,55,56] or be determined as part of a calibration process.
ANSYS-CFX allows to specify individual loss coefficients depending on the direction, which is useful to include the orientation of the bars. Exemplary, such an adaptation of different loss combinations in the subdomain representing the trash rack was done for the the trash rack variation with an intake of 60 . The comparison of the numerical results with and without the quadratic resistance coefficient showed—as expected—a correction of the velocities in its orientation. The velocity component in the direction with the higher loss is reduced, but only in close range after the trash rack. Only a pressure difference could be observed further downstream, which lead to the additional local head loss of the intake structure. Further the comparison showed that the differences of the velocity distribution in front of the screen are negligible small. The therewith needed calibration effort delivers only a limited additional benefit for the investigation. Consequently, no additional loss is applied in the numerical model.
The key findings of the investigation are that the local head loss of both trash rack options is in an acceptable range. The comparison of the values presented in Table 1 and Figure 4 show the desired consistency. A higher discharge introduces higher velocities, which must lead to a bigger local head loss. Based on the inclusion of a trash rack approach, the scale model values are higher than the numerical results. Furthermore, the difference between the two approaches is higher for option , in which the trash rack is in a flow region with a higher velocity.
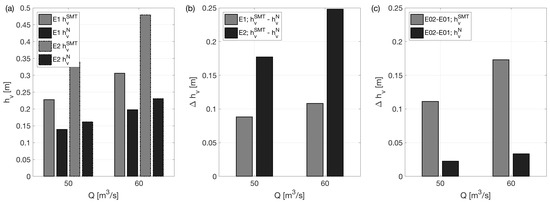
Figure 4.
Visualisation of the results in Table 1—(a) Comparison of the local head loss (m) of the scale model test (SMT) with a modified trash rack and the numerical simulation (N)—(b) differences between SMT and N—(c) differences between the two options.
Based on the inlet loss of the complete structure, the trash rack option would be the preferable solution. In this case, the new trash rack construction is situated in a region with lower velocities, which is further investigated in Section 3.2.2. The losses are higher for the triangle structure , but not substantially.
3.2.2. Velocity Distribution
The second value for the comparison of the numerics with the scale model test is the velocity distribution. The preliminary numerical investigation showed that the velocity decreases substantially in the reservoir with the distance to the intake structure. This is consistent with the continuity equation and allowed to limit the extent of the model reservoir in the scale model test. In a first step, this principal finding has to be confirmed in the scale model test as part of the verification process.
The measurement campaign is conducted with the 3D-vectrino mounted on an automated traversing unit, which has an accuracy of 0.1 mm. This allows to capture the full velocity vector for a small sampling value with a very high repeatability. For the main investigation, the measurements in the scale model test are conducted in the symmetry plane of the intake structure and in the centre plane of the left intake field. Further points are added in the front of the trash rack section. Each measurement point was observed for 120 s and statistically analysed. The quality check of the measurement shows that very close to the structure the reflections increase and those points had to be sorted out. Farer away from the intake, the velocity measurement variation (standard deviation) is comparably high in relation to the actual very small value. This indicates that the random part of the velocity is dominant, as it was predicted by the numerical simulation. Consequently, only a small amount of observed points could be finally used, to directly compare numerical and scale model test results.
As a preliminary check of the velocity distribution around the intake structure, the measurements with a velocity magnitude higher 0.3 (in nature scale) are filtered for all investigated discharges and variations of the geometry. The location is imported into ANSYS Post-Processing and visualised as a yellow ball, which are shown in Figure 5a,b. In the lower row of this Figure 5, the mesh cells with a bigger or equal velocity magnitude based on the numerical investigation are filled. All dots are covered by or very close to this volume, which indicates a very good agreement. Further checks with different boundaries support this findings and confirm the numerical results in principle.
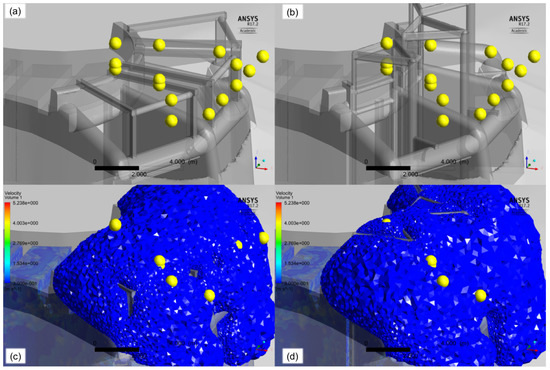
Figure 5.
Comparison of the velocities at the measurement points with a velocity ≥ 0.3 without (a,b) and with (c,d) volume analysis—build-on model (left column) and options (right column)—intake discharge Q = 60 .
In a second step, the numerical results are exported for the observed point and compared to the measurements for each individual velocity component. The most relevant differences between the two modelling approaches are caused by the fact, that near the structure sometimes only one velocity direction can be disturbed by the reflection and is missing in the measurement. An example of the visualisation of this comparison is shown in Figure 6. This figure summarises for the discharge of Q = 60 the numerical (red arrows) and measured results (black arrow) in the symmetry plane of the intake structure for both trash rack variation. Similar to the analysis of the velocity magnitude (Figure 5) a very good agreement could be found in the detail analysis.
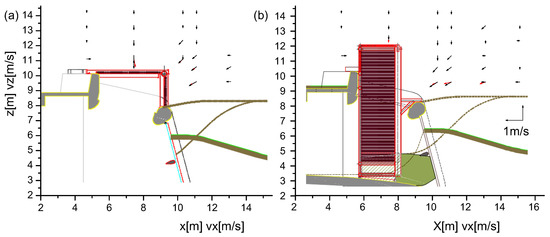
Figure 6.
Comparison of the measurement (black arrows) and numerical simulations (red arrows) with a velocity ≥0.3 in the symmetry plane of the intake structure—build-on model (a) and triangle option (b)—intake discharge Q = 60 .
In the first two phases of the project (Section 2.1), both options of the trash rack adaptation (Section 2.2 and Figure 2) are investigated and compared. From a purely hydraulic point of view, the option with the build-on construction allows to lift the trash rack section into a region with lower velocities. This would consequently lead to lower losses and a smaller loading on the complete structure (Table 1). In case of the triangle structure , the velocities in front of the trash rack are substantially higher, hence it reaches into the section with the acceleration of the flow in the intake structure. The investigation showed, that all values are in a range, which can be handled by the structure and that the additional local head loss is economically feasible.
Based on a the big picture, the found hydraulic weakness of the option is counterbalanced by the fact that the construction process is far less complex. This variation further allows to reduce the needed task and connected risks for the diver. Consequently, the decision was made to focus on the triangle construction and optimise this option further. The very good agreement of the numerical and experimental results allows to limit the further process to 3D-numerical investigation. Section 3.3 summarises this process and presents the final geometry, which is implemented.
3.3. Final Geometry
A very useful visualisation in the design process is the volume representation of the velocities above or below a certain level, which is also applied in the validation process (Section 3.2.2). Changing the boundary value allows to specify clearly the regions with the highest loading. Figure 7 shows two examples of such an analysis limiting on the main velocity u respectively on the vertical component w. The positive coordinate axis are defined in the opposite direction and hence the values are negative in case of an inflow into the structure. A direct comparison of both volumes as well as the specific contour plots of the trash rack sections (Figure 8) indicate that the vertical component in the trash rack sections is dominant.
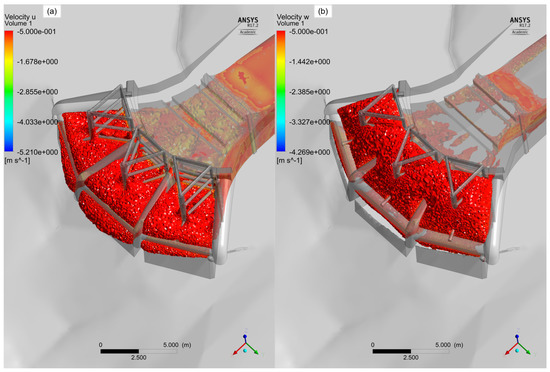
Figure 7.
Example analysis of the final trash rack option —volume analysis for (a) and (b)—intake discharge Q = 60 .
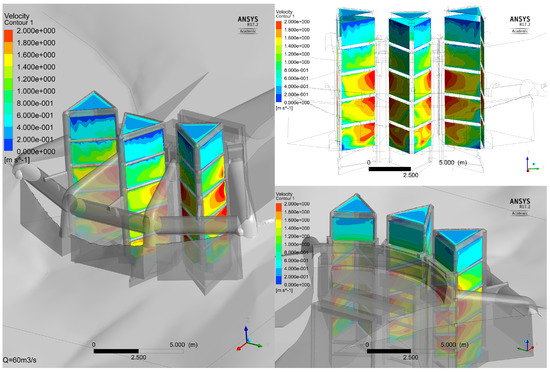
Figure 8.
Example analysis of the final trash rack option —contour value of the velocity on the outside of the trash rack with a color bar between 0 and 2 —intake discharge Q = 60 .
As shown in Figure 2c,d and Figure 6, the initial design is based on horizontal bars to reduce the length of the individual element. This leads to higher blockage in the vertical direction as well as a higher loss coefficient for this direction. A new evaluation coefficient is introduced to further investigate this effect. It is defined by:
The vertical velocity component w is normalised by the absolute value of the horizontal one. The orientation of the w component in relation to the positive definition of z-axis is preserved. If this -value is bigger than 1 or smaller than , the vertical velocity component in the evaluation section is dominant. The -value is added as a variable in the ANSYS Post-Processing and therewith can be similar to the velocities applied as a contour surface on the trash rack sections. Therewith a very obvious evaluation of the ideal orientation of the bars can be conducted.
This analysis for the geometry indicates that for nearly all investigated cases a majority of the trash rack section is outside the ±1 (–) boundary for . Consequently, the design of the initial bars is optimised with two arrangements: (a) the bars are made of round instead of flat steel to reduce the influence of the orientation of the flow perpendicular to the bar and (b) the orientation of the bars is changed to vertically. In consequence of the latter, additional subdivisions of the support structure are needed, so that the length of the individual bar could be reduced. This adaptation is analysed as geometry variation and presented in Figure 7 and Figure 8.
The velocities in the final version of the trash rack screen are comparable high. The water flows into the structure from the top and shortly after the trash rack the main velocity has to be changed in the direction of the conduit as well as a reduction of the available flow area. Figure 7 indicates that at the passage of the raised sediment level and the original trash rack velocities over 0.5 occur. For the investigation this ground level is assumed to be fixed. In reality, the sediment near the structure is mobilised by the flow under normal operation as well as outflowing water caused be the surge tank oscillation. A manual adaptation of the ground level in front of the structure was conducted to investigate a potential reduction of this coverage. This adaptation lead to a higher portion of discharge flowing through the frontal parts of the intake structure, which results in lower velocities at the trash rack as well as a reduction of the overall loss of the complete structure. Nevertheless, the final construction is designed to survive also a further increase of the sediment level as well as a complete clogging of the space in front of the trash rack up to the top of the transom.
The investigation also included the potential expansion with an additional HPP, which would use the reservoir Gepatsch as a lower storage reservoir. A reduction of the sediment level in the front of the intake structure is for this case in all likelihood. Hence, the fixed bed in the model is manually adapted similar to the previous mentioned investigation for the sensitivity of the inflow. It could be observed, that the outflowing water has a tendency to form a jet and affect a wide range of the reservoir. It could be shown that the loading of the outflow is fully covered by the previous scenarios. Consequently, the adaptation of the intake structure with the final variation (Figure 1c) is not a limiting factor for a future expansion of the HPP system.
4. Discussion
A key feature of the presented investigation is the alliance of two modelling approaches, namely the scale model test and the 3D-numerics. In an early state of the project, the design of the laboratory experiment could benefit of specific numerical investigations, which covered the following aspects:
- limitation to an essentially needed reservoir size for the intake
- exclusion of the full water height as a needed degree of freedom for the investigation (simplification of the water height regulation to a very long fixed overflow)
- vital input for the design of the inflow condition
- localisation of the measurement cross section for the local head loss measurement
- proof of the negligibly of the submerged measurement instrument on the results
On the other hand, the results based on the experimental investigation show that the numerically determined local head loss is appropriate as well as the velocity distribution (Section 3.2). Consequently, all further adaptation of the geometry (bed or structure), clogging cases and scenarios with outflowing water could be solely investigated with the help of the numerics. With this concept, the advantages of both approaches could be combined, which allows to deliver secured inputs for the design decision and optimisation.
The use of the differential pressure transmitter made by SIEMENS (SITRANS P DS III) turned out to be a very good choice. Especially, in this particular case, where the values are comparable small. The actual measurement of the pressure difference is in the range of 5 to 8 mbar and consequently the adjustable measurement boundaries allow to keep the measurement errors in an acceptable range.
In addition to the local head loss , the comparison of the velocity field is an important part of the validation process. These measurements are conducted with a 3D-vectrino manufactured by NORTEK. This instrument captures all three velocity components simultaneously for a small control volume. The traversing unit allows a fast and precise change of the location. Nevertheless, such a measurement can be very time consuming and the most interesting areas with higher velocities are not reachable, because of the narrow geometry. The simplified trash rack prohibits measurements behind it and unwanted reflections disturb a clear signal near the complex structure.
An application with less boundary effects would be desirable, as for example presented by [57]. Such a flow field would be caused by the load cases, where water flows out of the structure. A comparison would therefore be easier, but those scenarios are either extreme cases (surge tank oscillation) or part of a future expansion with an additional HPP. If water flows out of the structure, a substantial bigger part of the reservoir has to be considered to minimise the influence of the chosen boundaries. This was no option for the current project due to time constraints, higher costs and very limited space conditions in the hydraulic laboratory.
A potential solution for those challenges near the structure could be an optical measurement system, but those system are limited in respect of simultaneous capturing of the velocity components. Based on the discussion in the run-up to the construction, the additional effort to allow a better accessibility of the model was crucial, so that the actual limitations are accepted. The chosen approach is a compromise between academic interest and project specific requirements.
The intake structure includes no moving gate [58] and the discharge is regulated at the power station and overlain by the mass oscillation between the reservoir and the surge tank. Both models are conducted under steady state conditions. A previous investigation of another comparable intake showed that the transient behaviour could very well be approximated with the characteristic stationary flows. For the modelling the results of the local loss can be interpolated and therewith included in a global simulation.
A temperature distribution depending on the water depth is well documented [26] and small deviation of the temperature can trigger a change of the fluid density. Such a coupling can be numerically applied and is especially advisable for inflows with a bigger temperature differences. Different observations at the intake showed that in reality the visibility is extremely limited and makes the individual tasks for the diver very challenging. For both aspects additional in situ measurements would be needed and the overall influence on the velocities near the trash rack is assumed to be very small. Consequently, the properties of the fluid water are treated as constants and the suspended sediment is neglected.
Observations of the project area show that the loss of available storage volume is a long term problem, which also affects a majority of reservoirs [16]. As mentioned in Section 1.2, the lowering of the water level for the maintenance work triggered the mobilisation of the fine sediment. This single incident increased the sediment level around the intake structure dramatically. Measurements show that the excavated region in front of the intake is stable and consequently the last observation is used as an input for the investigation. The reservoir is assumed to be fixed for the numerical and experimental model, which allows to exclude this complex degree of freedom for the investigation. This leads to a better comparability between the different geometry options (Figure 2) as well as the two modelling approaches.
The excavation was only conducted in a safe distance so that the existing trash rack is not damaged by this work. Consequently, there is a local high point of the sediment in front of the intake structure. The results for the velocities in this region indicates that in case of a normal operation the opening to the nearly vertical trash rack sections will be expanded (Figure 1). Example numerical investigation with a manually adapted ground demonstrated, that this will lead to a reduction of the loads on the structure. Consequently, the chosen fixation of the ground is a conservative assumption.
Two different modelling approaches are used for the inclusion of the local head loss of the individual bars of the trash rack. A grid with an equal obstruction rate is added to the structure in the scale model test (Figure 2). This is a common solution if the downscaled bars are not manageable to be build.
The full discretization of the bars and the nearby caused flow changes is an obvious challenge, especially in combination with a comparable large part of the reservoir. For the presented project a modelling approach with a homogeneous trash rack is applied to limit the overall calculation cost. Only the main structure is considered in the numerical simulation, which supports the bar racks. Each inner part is defined as a subdomain with fluid-fluid-interfaces and the same volume as the trash rack. This allows to introduce directional loss coefficients, which cause the pressure loss depending on the local velocity vector. The implemented head loss coefficient can be based on literature values [11,12,13,51,54,55,56] or calibrated with the scale model test (Section 3.2.1). A detailed investigation of different combinations of local head loss coefficients in the vertical and horizontal direction draw the conclusion that the effects on the velocity distribution in front of the trash racks are negligible. The reduction of the cross section behind the trash rack leads to an acceleration of the flow velocity. Such an increase in the velocity homogenises the flow [3]. Consequently, the main influence of the chosen values for the local loss is in the pressure distribution after the trash rack respectively in the local head loss of the complete intake. The main result of the investigation is the velocity distribution in front of the trash rack (Figure 8), which is needed for the design of the structure.
5. Conclusions
The presented investigation includes numerical simulation (ANSYS-CFX) as well as a scale model test (1: = 1:20) to find a solution for an intake structure, which is facing a massive sudden increase of the sediment level. The combination of these two independent models allows to validate the key findings and therewith ensure the safety of drawn conclusions. The 3D-numerics allowed the investigation and optimisation of the complex geometry in detail and delivered the input needed for the design of the new trash rack. After the hydraulic investigations in the laboratory the scaled intake structure could be further used as an illustrative model for the diver to plan the challenging underwater work.
A main part the project is the comparison of two different concepts, which allows to handle the challenging new boundary conditions at the existing intakes. Option would elevate the new trash rack screens outside of the higher velocities around the intake structure. As an alternative a triangle structure in front of each of the three sections of the intake is investigated as . The comparison of the two options showed that the is the preferred option based on the hydraulic point of view, but the higher velocities at the trash racks in can be tolerated by the structure. Both options cause local losses at the intake in an acceptable range.
The additional advantage of the triangle variation (intake towers) led to the choice of this option. The further optimisation process strongly relights on the numerical simulations of this exceptional solution. A new evaluation criterion is introduced, which allows to compare the vertical and horizontal velocity component. This analysis indicated that vertical bars are beneficial. The final structure included an additional subdivision to reduce the length of the individual bar made of round steel, which allows a high independence of the losses from the inflow direction. At the end of 2017, the adaptations of the intake structure including further works [34] could be finished. Since then the HPP is fully functional. The added intake towers had no measurable effect on the net head of the power plant, which is a confirmation of the findings based on the presented hydraulic investigation. A detailed inspection with divers in April 2018 could also confirm an excellent condition of the new structure.
The investigation showed the potential of the numerical simulation considering speed and level of detail to handle complex structures. Nevertheless, the scale model test allows a validation of the findings, which is ensuring for comparable tests. The final chosen geometry should encourage future research dealing with in-homogeneous velocity distributions in front of trash racks and also high velocities.
Author Contributions
R.G., B.H., B.G. and M.A. are responsible the conceptualisation of the hydraulic investigation. F.B. and B.G. designed and measured the data in the scale model test. B.H. is responsible for the design of the trash rack option. R.G. analysed the data, conducted the numerical simulations and wrote the paper.
Funding
This work was supported by the Austrian Science Fund (FWF) under Grant J3918.
Conflicts of Interest
The authors declare no conflict of interest. The hydraulic investigation was conducted on behalf of the TIWAG-Tiroler Wasserkraft AG (Austria) at the University of Innsbruck, Unit of Hydraulic Engineering.
Notation
| A | = area (m) |
| = kinetic energy (Joule) | |
| F | = Froude number (–) |
| g | = gravity acceleration (m · s) |
| h | = head (m) |
| = head loss (m) | |
| Q | = discharge (m · s) |
| u | = velocity in x-direction (m · s) |
| v | = velocity in y-direction (m · s) |
| w | = velocity in z-direction (m · s) |
| z | = elevation (m) |
| = kinetic energy correction factor (–) | |
| = evaluation factor of the angle in the velocity vector (–) | |
| = scale factor (–) | |
| = mass density of water ≈ 997 (kg m) |
References
- Johnson, P.L. Hydro-Power Intake Design Considerations. J. Hydraul. Eng. 1988, 114, 651–661. [Google Scholar] [CrossRef]
- Khan, L.A.; Wicklein, E.A.; Rashid, M.; Ebner, L.L.; Richards, N.A. Computational fluid dynamics modeling of turbine intake hydraulics at a hydropower plant. J. Hydraul. Res. 2004, 42, 61–69. [Google Scholar] [CrossRef]
- Gabl, R.; Innerhofer, D.; Achleitner, S.; Righetti, M.; Aufleger, M. Evaluation criteria for velocity distributions in front of bulb hydro turbines. Renew. Energy 2018, 121, 745–756. [Google Scholar] [CrossRef]
- Huber, B.; Kampel, I. Air entraining vortices in hydraulic model test and CFD-simulation valued at two case studies. WasserWirtschaft 2017, 107, 33–38. [Google Scholar] [CrossRef]
- Mulligan, S.; De Cesare, G.; Casserly, J.; Sherlock, R. Understanding turbulent free-surface vortex flows using a Taylor-Couette flow analogy. Sci. Rep. 2018, 8. [Google Scholar] [CrossRef] [PubMed]
- Park, I.; Kim, H.-J.; Seong, H.; Rhee, D.S. Experimental Studies on Surface Vortex Mitigation Using the Floating Anti-Vortex Device in Sump Pumps. Water 2018, 10, 441. [Google Scholar] [CrossRef]
- Sarkardeh, S.; Reza Zarrati, A.; Jabbari, E.; Marosi, M. Numerical simulation and analysis of flow in a reservoir in the presence of vortex. Eng. Appl. Comp. Fluid 2014, 8, 598–608. [Google Scholar] [CrossRef]
- Taştan, K.; Yildirim, N. Effects of Intake Geometry on the Occurrence of a Free-Surface Vortex. J. Hydraul. Eng. 2018, 144, 04018009. [Google Scholar] [CrossRef]
- Yang, J.; Liu, T.; Bottacin-Busolin, A.; Lin, C. Effects of intake-entrance profiles on free-surface vortices. J. Hydraul. Res. 2014, 52, 523–531. [Google Scholar] [CrossRef]
- Egusquiza, E.; Valero, C.; Estévez, A.; Guardo, A.; Coussirat, M. Failures due to ingested bodies in hydraulic turbines. Eng. Fail. Anal. 2011, 18, 464–473. [Google Scholar] [CrossRef]
- Böttcher, H.; Unfer, G.; Zeiringer, B.; Schmutz, S.; Aufleger, M. Fischschutz und Fischabstieg–Kenntnisstand und aktuelle Forschungsprojekte in Österreich [Fish protection and downstream migration: Current state of knowledge and research projects in Austria]. Österreichische Wasser- und Abfallwirtschaft 2015, 67, 299–306. [Google Scholar] [CrossRef]
- Raynal, S.; Courret, D.; Chatellier, L.; Larinier, M.; David, L. An experimental study on fish-friendly trashracks—Part 1. Inclined trashracks. J. Hydraul. Res. 2013, 51, 56–66. [Google Scholar] [CrossRef]
- Raynal, S.; Chatellier, L.; Courret, D.; Larinier, M.; David, L. An experimental study on fish-friendly trashracks—Part 2. Angled trashracks. J. Hydraul. Res. 2013, 51, 67–75. [Google Scholar] [CrossRef]
- Wang, Y.; Politano, M.; Ho, H.C.; Muste, M.; Michell, F.; Stallings, J. Assessment of ice plugging of a cooling water intake by a numerical model. J. Hydraul. Res. 2014, 52, 81–92. [Google Scholar] [CrossRef]
- Kondolf, G.M.; Farahani, A. Sustainably Managing Reservoir Storage: Ancient Roots of a Modern Challenge. Water 2018, 10, 117. [Google Scholar] [CrossRef]
- Schleiss, A.J.; Franca, M.J.; Juez, C.; De Cesare, G. Reservoir sedimentation. J. Hydraul. Res. 2016, 54, 595–614. [Google Scholar] [CrossRef]
- Chamoun, S.; De Cesare, G.; Schleiss, A.J. Managing reservoir sedimentation by venting turbidity currents: A review. Int. J. Sediment Res. 2016, 31, 195–204. [Google Scholar] [CrossRef]
- Huang, C.-C.; Lai, J.-S.; Lee, F.-Z.; Tan, Y.-C. Physical Model-Based Investigation of Reservoir Sedimentation Processes. Water 2018, 10, 352. [Google Scholar] [CrossRef]
- Jenzer Althaus, J.M.I.; Cesare, G.D.; Schleiss, A.J. Sediment Evacuation from Reservoirs through Intakes by Jet-Induced Flow. J. Hydraul. Eng. 2015, 141, 04014078. [Google Scholar] [CrossRef]
- Müller, M.; De Cesare, G.; Schleiss, A.J. Experiments on the effect of inflow and outflow sequences on suspended sediment exchange rates. Int. J. Sediment Res. 2017, 32, 155–170. [Google Scholar] [CrossRef]
- Nomura, S.; Hitomi, J.; De Cesare, G.; Takeda, Y.; Yamamoto, Y.; Sakaguchi, H. Sediment mass movement of a particle-laden turbidity current based on ultrasound velocity profiling and the distribution of sediment concentration. Geol. Soc. Lond. Spec. Publ. 2018, 477. [Google Scholar] [CrossRef]
- De Cesare, G.; Schleiss, A.; Hermann, F. Impact of turbidity currents on reservoir sedimentation. J. Hydraul. Eng. 2001, 127, 6–16. [Google Scholar] [CrossRef]
- Epely-Chauvin, G.; De Cesare, G.; Schwindt, S. Numerical modelling of plunge pool scour evolution in non-cohesive sediments. Eng. Appl. Comp. Fluid 2014, 8, 477–487. [Google Scholar] [CrossRef][Green Version]
- Haun, S.; Kjærås, H.; Løvfall, S.; Olsen, N.R.B. Three-dimensional measurements and numerical modelling of suspended sediments in a hydropower reservoir. J. Hydrol. 2013, 479, 180–188. [Google Scholar] [CrossRef]
- Oehy, C.D.; Schleiss, A.J. Control of Turbidity Currents in Reservoirs by Solid and Permeable Obstacles. J. Hydraul. Eng. 2007, 133, 637–648. [Google Scholar] [CrossRef]
- Bonalumi, M.; Anselmetti, F.S.; Kaegi, R.; Wüest, A. Particle dynamics in high-Alpine proglacial reservoirs modified by pumped-storage operation. Water Resour. Res. 2011, 47, W09523. [Google Scholar] [CrossRef]
- Müller, M.; De Cesare, G.; Schleiss, A.J. Continuous Long-Term Observation of Suspended Sediment Transport between Two Pumped-Storage Reservoirs. J. Hydraul. Eng. 2014, 140, 05014003. [Google Scholar] [CrossRef]
- Müller, M.; De Cesare, G.; Schleiss, A.J. Flow field in a reservoir subject to pumped-storage operation—In situ measurement and numerical modeling. J. Appl. Water Eng. Res. 2016. [Google Scholar] [CrossRef]
- Hager, W.H.; Boes, R.M. Hydraulic structures: A positive outlook into the future. J. Hydraul. Res. 2014, 52, 299–310. [Google Scholar] [CrossRef]
- Gao, X.; Zhang, H.; Liu, J.; Sun, B.; Tian, Y. Numerical investigation of flow in a vertical pipe inlet/outlet with a horizontal anti-vortex plate: Effect of diversion orifices height and divergence angle. Eng. Appl. Comp. Fluid 2018, 12, 182–194. [Google Scholar] [CrossRef]
- Gems, B.; Mazzorana, B.; Hofer, T.; Sturm, M.; Gabl, R.; Aufleger, M. 3-D hydrodynamic modelling of flood impacts on a building and indoor flooding processes. Nat. Hazards Earth Syst. Sci. 2016, 16, 1351–1368. [Google Scholar] [CrossRef]
- Lauffer, H. Das Kaunertalkraftwerk. Österreichische Wasserwirtschaft; Springer: New York, NY, USA, 1968. [Google Scholar]
- Oehy, C.D.; De Cesare, G.; Schleiss, A.J. Effect of inclined jet screen on turbidity current. J. Hydraul. Res. 2010, 48, 81–90. [Google Scholar] [CrossRef]
- Obendorfer, R.; Hofer, B.; Bol, A. Underwater maintenance works in the Gepatsch reservoir. Hydropower Dams 2018, 25, 64–73. [Google Scholar]
- Nan, D.; Shigemitsu, T.; Zhao, S. Investigation and Analysis of Attack Angle and Rear Flow Condition of Contra-Rotating Small Hydro-Turbine. Energies 2018, 11, 1806. [Google Scholar] [CrossRef]
- Li, D.; Wang, H.; Li, Z.; Nielsen, T.K.; Goyal, R.; Wei, X.; Qin, D. Transient characteristics during the closure of guide vanes in a pump-turbine in pump mode. Renew. Energy 2018, 118, 973–983. [Google Scholar] [CrossRef]
- Yang, J.; Pavesi, G.; Liu, X.; Xie, T.; Liu, J. Unsteady flow characteristics regarding hump instability in the first stage of a multistage pump-turbine in pump mode. Renew. Energy 2018, 127, 377–385. [Google Scholar] [CrossRef]
- Castillo, L.; García, J.; Carrillo, J. Influence of Rack Slope and Approaching Conditions in Bottom Intake Systems. Water 2017, 9, 65. [Google Scholar] [CrossRef]
- Carrillo, J.; García, J.; Castillo, L. Experimental and numerical modelling of bottom intake racks with circular bars. Water 2018, 10, 605. [Google Scholar] [CrossRef]
- Andersson, A.G.; Andreasson, P.; Lundström, T.S. CFD-modelling and validation of free surface flow during spilling of reservoir in down-scale model. Eng. Appl. Comp. Fluid 2013, 7, 159–167. [Google Scholar] [CrossRef]
- Cao, P.; Wang, Y.; Kang, C.; Li, G.; Zhang, X. Investigation of the role of non-uniform suction flow in the performance of water-jet pump. Ocean Eng. 2017, 140, 258–269. [Google Scholar] [CrossRef]
- Gabl, R.; Righetti, M. Design criteria for a type of asymmetric orifice in a surge tank using CFD. Eng. Appl. Comp. Fluid 2018, 12, 397–410. [Google Scholar] [CrossRef]
- Putra, R.A.; Schäfer, T.; Neumann, M.; Lucas, D. CFD studies on the gas-liquid flow in the swirl generating device. Nucl. Eng. Des. 2018, 332, 213–225. [Google Scholar] [CrossRef]
- Renno, C.; Petito, F.; Accarino, M.L. Thermal Model in ANSYS for a Comparison Between two Configurations of a Concentrating Photovoltaic System. Heat Transf. Eng. 2018. [Google Scholar] [CrossRef]
- Menter, F.R. Two-equation eddy-viscosity turbulence models for engineering applications. AIAA J. 1994, 32, 1598–1605. [Google Scholar] [CrossRef]
- Menter, F.R.; Kuntz, M.; Langtry, R. Ten years of industrial experience with the SST turbulence model. In Proceedings of the Fourth International Symposium on Turbulence, Heat and Mass Transfer, Antalya, Turkey, 12–17 October 2003. [Google Scholar]
- Heller, V. Scale effects in physical hydraulic engineering models. J. Hydraul. Res. 2011, 49, 293–306. [Google Scholar] [CrossRef]
- Bermúdez, M.; Cea, L.; Puertas, J.; Conde, A.; Martín, A.; Baztán, J. Hydraulic model study of the intake-outlet of a pumped-storage hydropower plant. Eng. Appl. Comp. Fluid 2012, 11, 483–495. [Google Scholar] [CrossRef]
- Yang, J.; Andreasson, P.; Högström, C.-M.; Teng, P. The Tale of an Intake Vortex and Its Mitigation Countermeasure: A Case Study from Akkats Hydropower Station. Water 2018, 10, 881. [Google Scholar] [CrossRef]
- Gabl, R.; Achleitner, S.; Neuner, J.; Aufleger, M. Accuracy analysis of a physical scale model using the example of an asymmetric orifice. Flow Meas. Instrum. 2014, 36, 36–46. [Google Scholar] [CrossRef]
- Idelchik, I.E. Handbook of Hydraulic Resistance Coefficients of Local Resistance and of Friction; U.S. Department of Commerce National Technical Information service (NTIS): Springfield, VA, USA, 1960.
- Ward-Smith, A.J. Internal Fluid Flow—The Fluid Dynamics of Flow in Pipes and Ducts; Clarendon Press: Oxford, UK, 1980. [Google Scholar]
- Gou, J.; Su, X.; Yuan, X. Adaptive mesh refinement method-based large eddy simulation for the flow over circular cylinder at ReD = 3900. Int. J. Computat. Fluid Dyn. 2018. [Google Scholar] [CrossRef]
- Albayrak, I.; Kriewitz, C.R.; Hager, W.H.; Boes, R.M. An experimental investigation on louvres and angled bar racks. J. Hydraul. Res. 2018, 46, 59–75. [Google Scholar] [CrossRef]
- Böttcher, H.; Gabl, R.; Ritsch, S.; Aufleger, M. Experimental study of head loss through an angled fish protection system. In Proceedings of the 4th IAHR Europe Congress, Liege, Belgium, 27–29 July 2016; Dewals, B., Ed.; CRC Press: Liege, Belgium, 2016; pp. 637–642. [Google Scholar]
- Meusburger, H. Energy Loss at Trashracks in Hydroelectric Power Stations [Energieverluste an Einlaufrechen von Flusskraftwerken]. Mitteilungen der Versuchsanstalt fur Wasserbau, Hydrologie und Glaziologie an der Eidgenossischen Technischen Hochschule Zurich. 2002. Available online: https://www.researchgate.net/publication/292544074_Energy_loss_at_trashracks_in_hydroelectric_power_stations (accessed on 10 August 2018).
- Gao, F.; Zhao, L.; Boufadel, M.C.; King, T.; Robinson, B.; Conmy, R.; Miller, R. Hydrodynamics of oil jets without and with dispersant: Experimental and numerical characterization. Appl. Ocean Res. 2017, 68, 77–90. [Google Scholar] [CrossRef]
- Dargahi, B. Flow characteristics of bottom outlets with moving gates. J. Hydraul. Res. 2010, 48, 476–482. [Google Scholar] [CrossRef]
© 2018 by the authors. Licensee MDPI, Basel, Switzerland. This article is an open access article distributed under the terms and conditions of the Creative Commons Attribution (CC BY) license (http://creativecommons.org/licenses/by/4.0/).