Uncertainty in Estimated Trends Using Gridded Rainfall Data: A Case Study of Bangladesh


1
Construction and Building Engineering Department, College of Engineering and Technology, Arab Academy for Science, Technology and Maritime Transport (AASTMT), 2033 Elhorria, Cairo, Egypt
2
Department of Hydraulics and Hydrology, School of Civil Engineering, Faculty of Engineering, Universiti Teknologi Malaysia (UTM), 81310 Skudia, Johor, Malaysia
3
State Key Laboratory of Hydrology-Water Resources and Hydraulic Engineering, Nanjing Hydraulic Research Institute, 210029 Nanjing, China
4
Research Center for Climate Change, Ministry of Water Resources, Nanjing 210029, China
*
Author to whom correspondence should be addressed.
Water 2019, 11(2), 349; https://doi.org/10.3390/w11020349
Submission received: 14 December 2018
/
Revised: 2 February 2019
/
Accepted: 2 February 2019
/
Published: 19 February 2019
(This article belongs to the Special Issue Water Resources Assessment, Development and Management in Coupled Human-Natural Systems)
Abstract
:This study assessed the uncertainty in the spatial pattern of rainfall trends in six widely used monthly gridded rainfall datasets for 1979–2010. Bangladesh is considered as the case study area where changes in rainfall are the highest concern due to global warming-induced climate change. The evaluation was based on the ability of the gridded data to estimate the spatial patterns of the magnitude and significance of annual and seasonal rainfall trends estimated using Mann–Kendall (MK) and modified MK (mMK) tests at 34 gauges. A set of statistical indices including Kling–Gupta efficiency, modified index of agreement (md), skill score (SS), and Jaccard similarity index (JSI) were used. The results showed a large variation in the spatial patterns of rainfall trends obtained using different gridded datasets. Global Precipitation Climatology Centre (GPCC) data was found to be the most suitable rainfall data for the assessment of annual and seasonal rainfall trends in Bangladesh which showed a JSI, md, and SS of 22%, 0.61, and 0.73, respectively, when compared with the observed annual trend. Assessment of long-term trend in rainfall (1901–2017) using mMK test revealed no change in annual rainfall and changes in seasonal rainfall only at a few grid points in Bangladesh over the last century.
1. Introduction
Trend analysis provides important information required for planning adaptation and mitigation to climate changes [1]. Therefore, a large volume of literature is available on trend analysis of various climatic variables using different methods [2,3]. One of the major impediments to the analysis of climatic trends is the availability of long-term quality climate data. Reliable analysis of climatic trends requires high-quality data for at least 30 years [4], which is often difficult to obtain for many regions of the world. Gridded climate data are suggested for such study in regions where long-term high-quality climate data are not available. With the pace of development, the reliability of gridded climate data in replicating actual properties of regional climate has been improved, and therefore such data has been widely used for climatic trend analysis across the world.
Though reliability in trends obtained using gridded data has been reported in many studies [3,5,6,7,8], uncertainty in results is still a major issue. Gridded climate data can be broadly classified as gauge-based, remote-sensing based, reanalysis, or a hybrid of those methods [9]. The uncertainty in different types of gridded data arises mainly due to the techniques used for the preparation of gridded data, such as interpolation of observed data, remote-sensing data used, or the model used for the generation of reanalysis data. Besides, the number of stations used for the development of gauge-based gridded data or the validation of remote-sensing data or reanalysis models plays a major role in the reliability of the data product. Furthermore, the quality of the observed data and the quality control procedure used in the selection of observed data can have a significant impact on the uncertainty of gridded climate data. Therefore, it is often suggested to select the suitable gridded data for the area of study and the climatic phenomenon should be analyzed [10].
Bangladesh is one of the most susceptible countries to global climate change, where reliable assessment of the spatiotemporal changes in climate is very important [11,12,13]. Many studies have assessed the trends of different climate variables in Bangladesh using observed data. A brief review of the climatic trend analysis in Bangladesh is presented in Table 1. Contradictory results, particularly in trends of rainfall, have been reported in different studies, even when the same method is used. This is mainly due to the different periods used for trend analysis, the use of data without necessary quality control, and the methods used for filling the missing data. Table 1 shows that different results were obtained when different periods were used for trend analysis. The table also shows that proper quality control of data was not conducted before trend analysis in most of the studies. Besides, different approaches were used to handle missing data in trend analysis. It was attempted to fill the missing data before trend analysis in some of the studies. Some other cases those were ignored following different rules; for example, a record of the whole month was discarded if rainfall for consecutive days was found to be missing. These techniques for filling missing data and the rule adopted for the consideration of missing data in discarding monthly, seasonal, and annual rainfall records also resulted in different estimated climate trends.
To overcome the problem of unavailability of long-term quality-assured climate data, gridded rainfall and temperature datasets are suggested for hydrological and climatology studies [9]. However, studies revealed that results obtained using different gridded data products are often contradictory and inconsistent with those obtained using observed data [1,2]. This emphasizes the need for the assessment of the capability of different gridded data product in reproducing the spatiotemporal pattern in the trends of rainfall.
The major objective of the present study is to evaluate the performance of six widely used gridded rainfall data in replicating spatiotemporal patterns of the trends in annual and seasonal rainfall in Bangladesh. The present study adopted the Sen’s slope as an estimator of the magnitude of change and the Mann–Kendall (MK) and modified Mann–Kendall (mMK) tests to assess the significance of change at a 95% level of confidence. The mMK method has been found robust in the estimation of trends in the presence of short- and long-term autocorrelations in rainfall data [3,6,8,14]. Therefore, it can provide a unidirectional trend in time series by removing the natural variability of climate. Therefore, the mMK test is used along with the MK test for the assessment of trend. It is presumed that the presented approach can be useful for unbiased estimation of rainfall trends.
2. Climate of Bangladesh
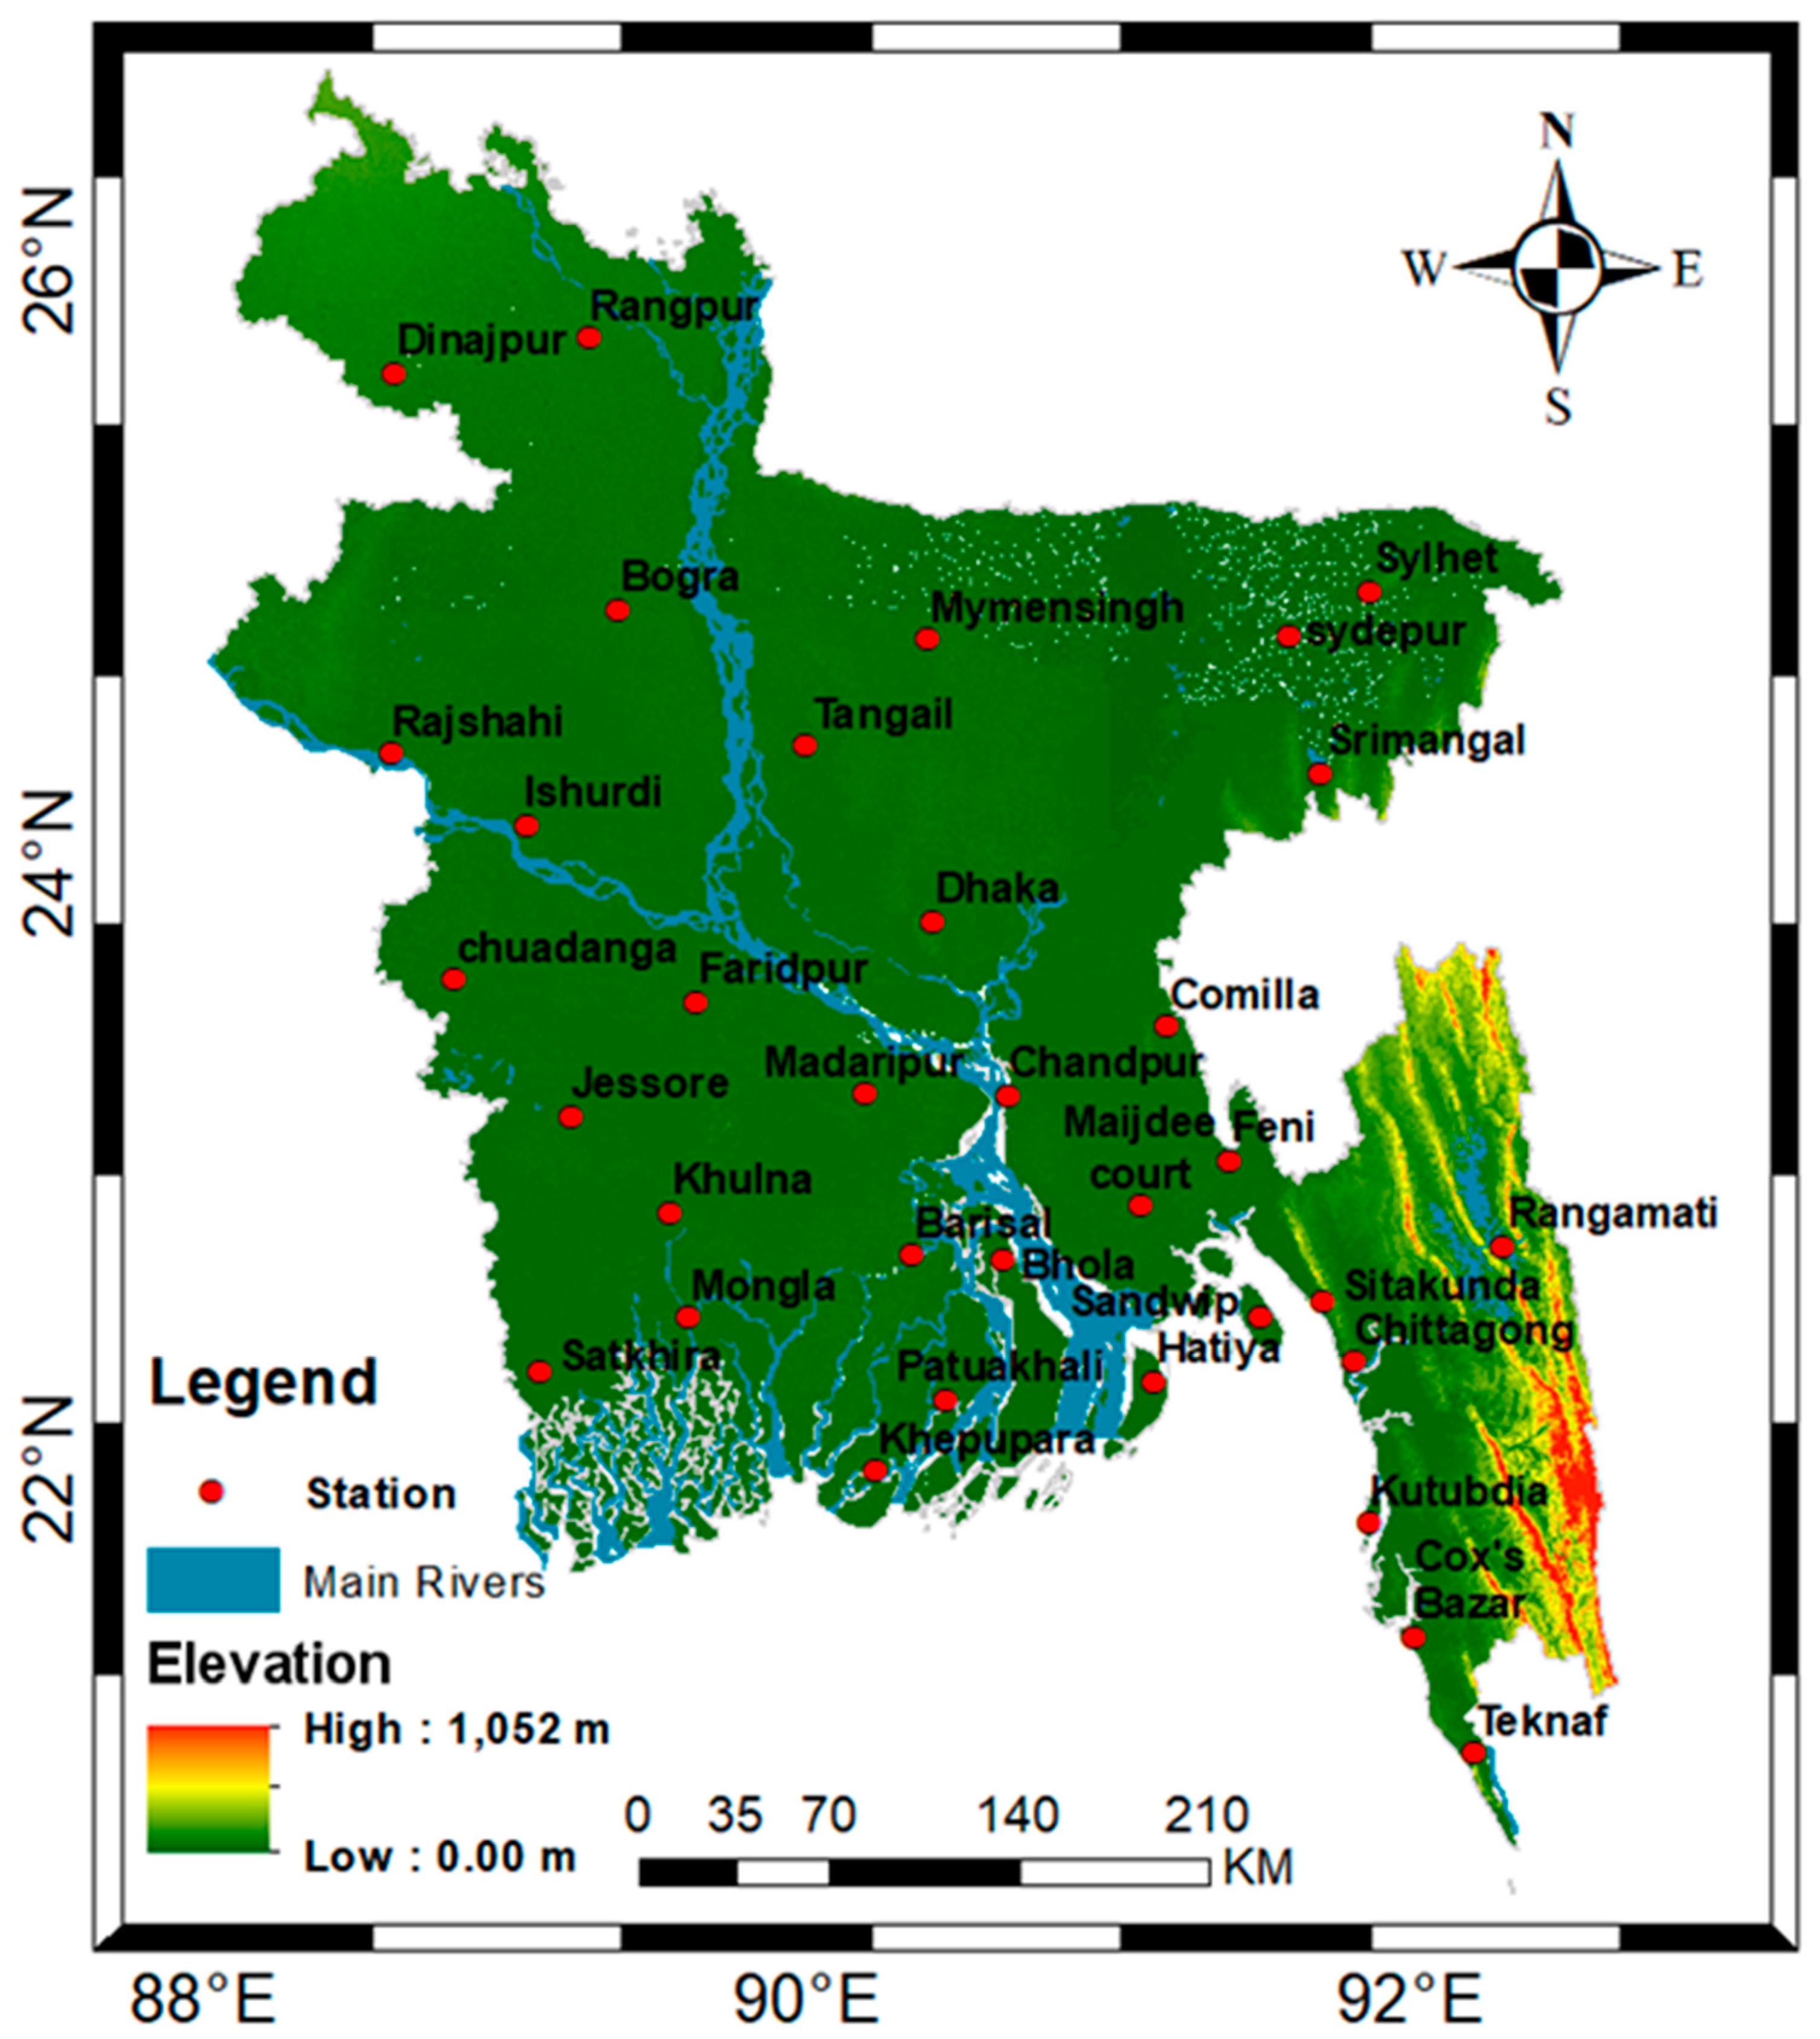
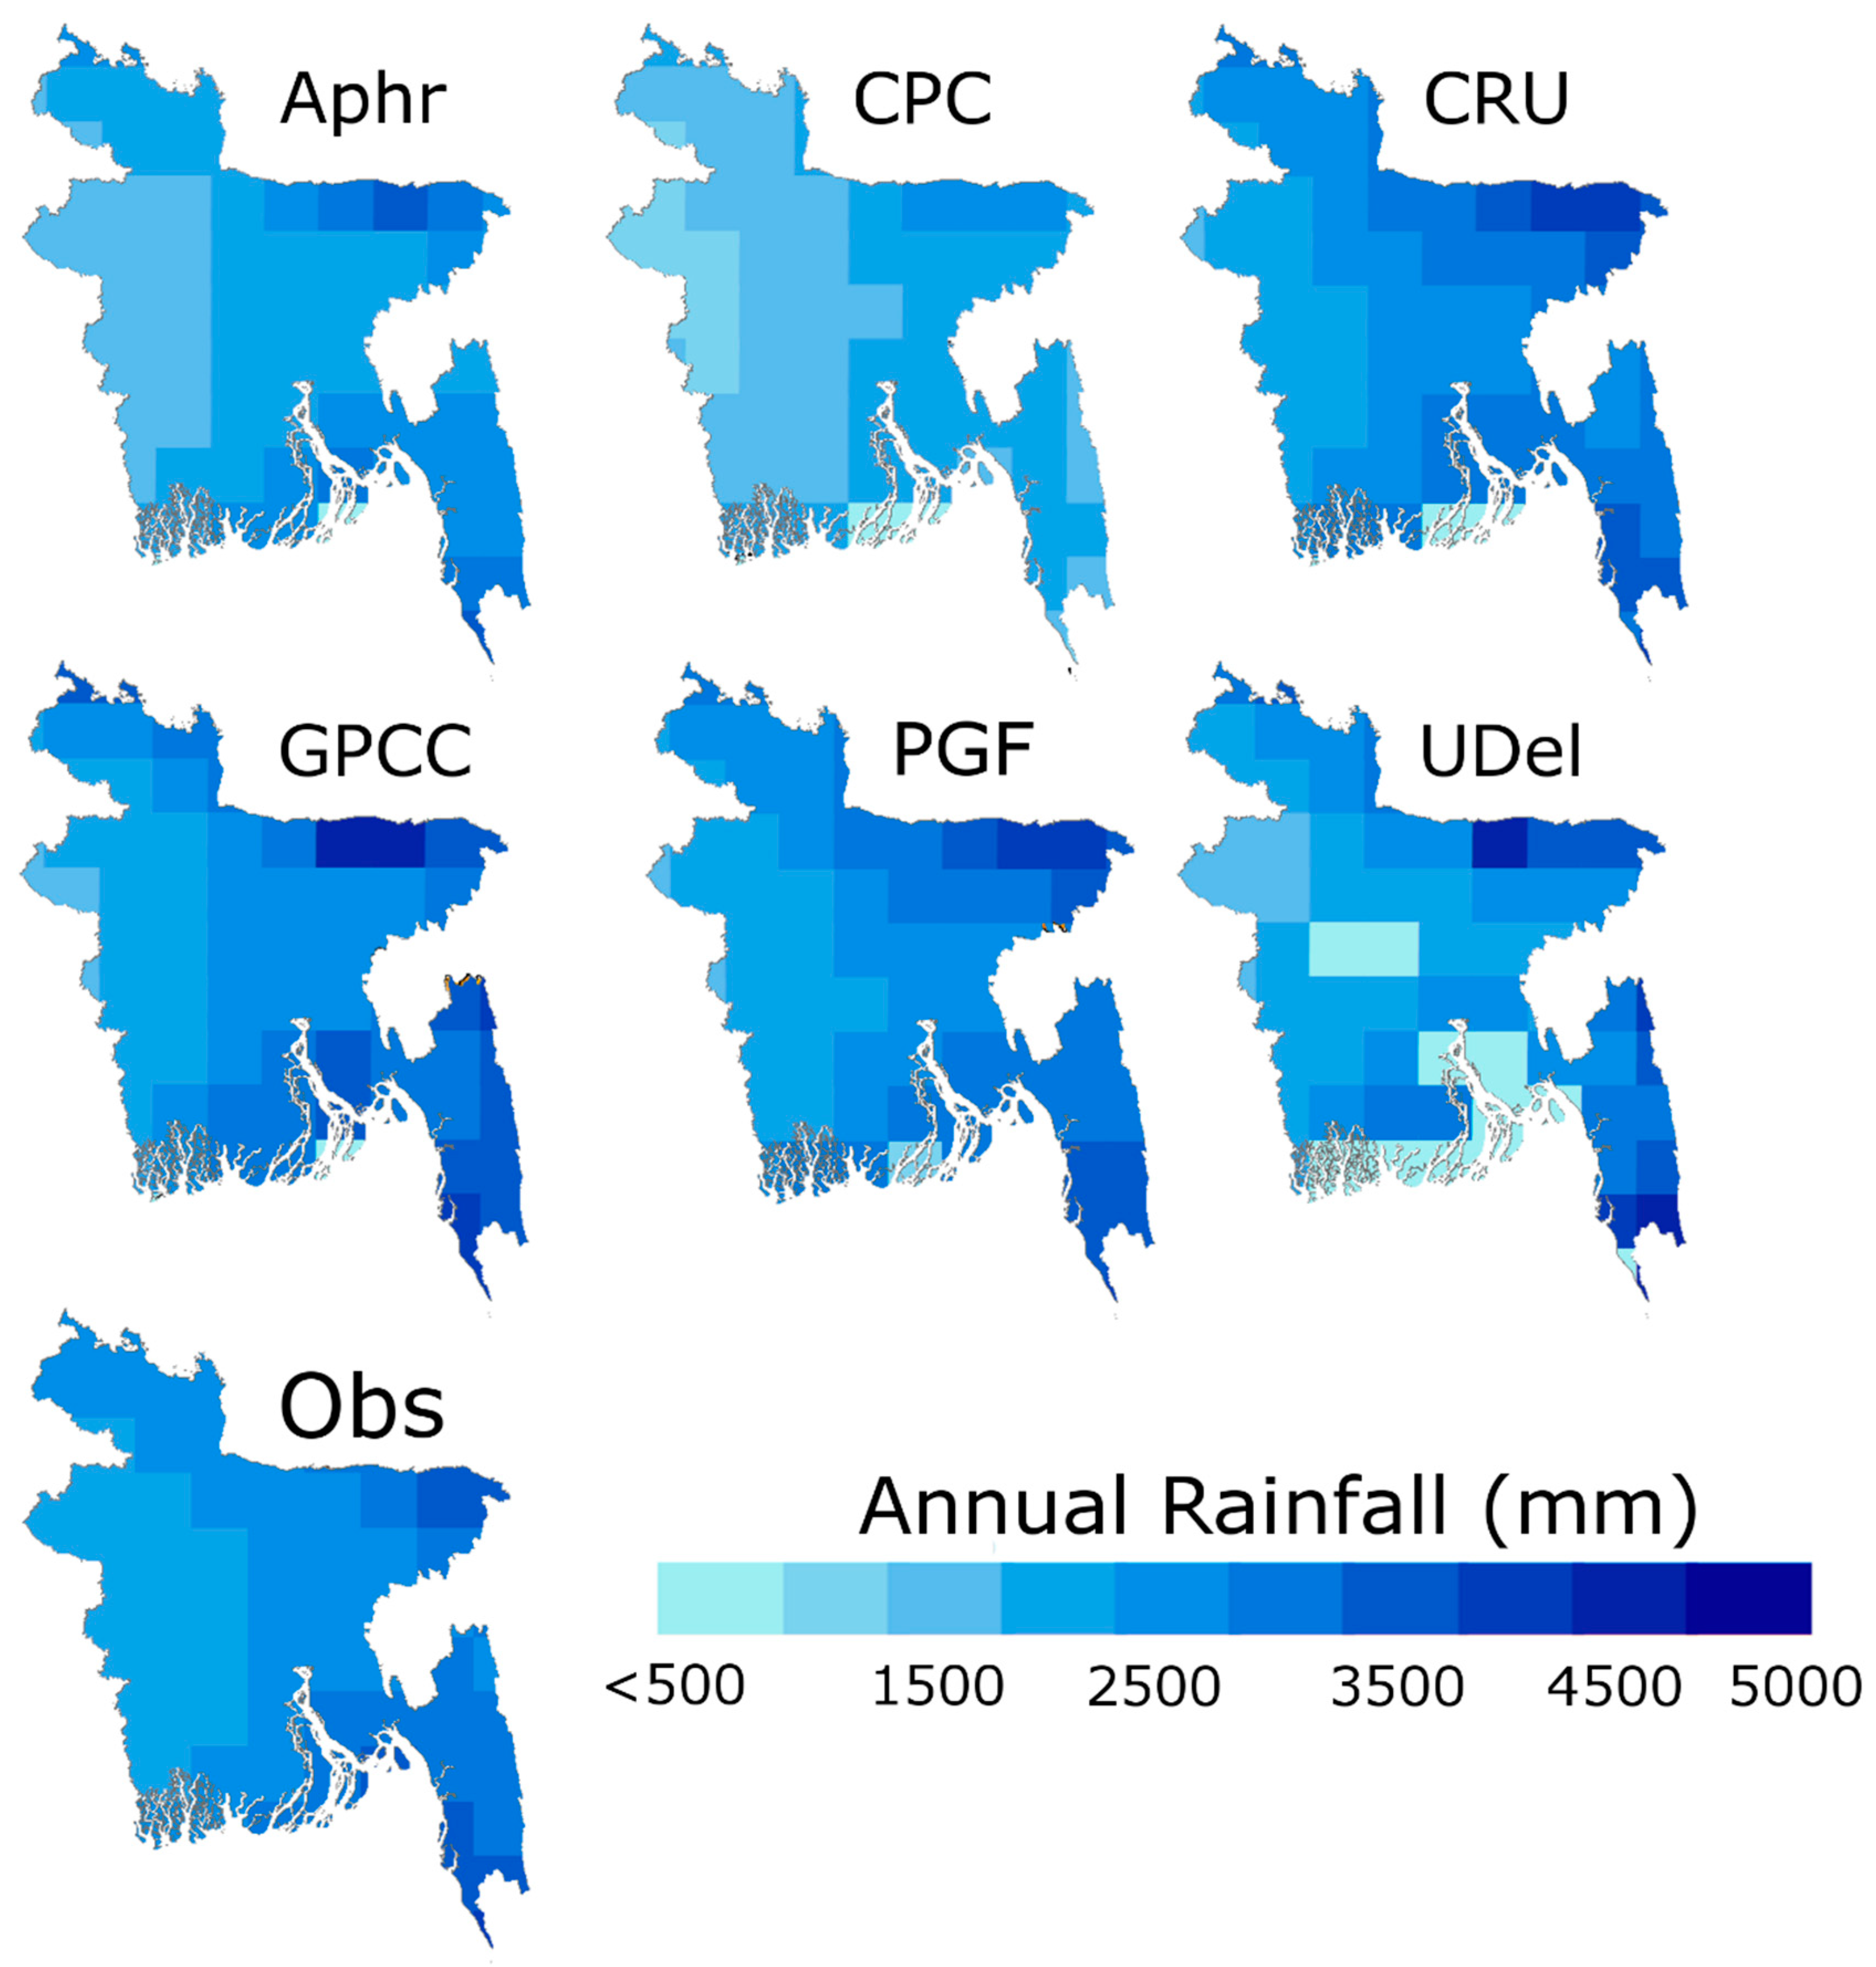
Bangladesh, located in the deltas of large powerful rivers, has an extremely flat topography, except for some uplifted lands and hills in the northeast and the southeast (Figure 1). According to the Köppen classification, Bangladesh has monsoon (Am), tropical savanna (Aw), and humid subtropical climates (Cwa). The country has four seasons, namely hot summer pre-monsoon (MAM), rainy monsoon (JJAS), autumn post-monsoon (ON), and dry winter (DJF). The rainfall of Bangladesh varies spatially, from 1500 mm in the northwest to about 4400 mm in the northeast [11] (Figure 2). Monsoon rainfall accounts for the majority of the total annual rainfall of Bangladesh [11,28,29].
3. Data and Sources
3.1. Observed Data
Daily observed rainfall data of 34 stations distributed over Bangladesh (Figure 1) for 1979–2010 were collected from the Bangladesh Meteorological Department. Long-term rainfall records are available for many locations in Bangladesh. However, data before 1979 contain a large number of missing records, while missing data after 1979 is very uncommon. Complete daily rainfall data after 1979 was available at 10 stations. Missing data at other stations was less than 1%. The missing data was mostly random. Continuous missing data for two to three months a year were found at four stations. Data for the whole year was discarded when it was found that data was missing continuously for a month. Randomly missing data were filled up using an artificial neural network (ANN) model developed by Shahid [30]. The ANN model was used to estimate the missing value at the station of interest from the rainfall of six neighbouring stations.
The complete daily rainfall data generated for the period 1979–2010 (after filling the missing data) was used in this study. The double mass curve method [31] was used to detect the non-homogeneity in the annual rainfall time-series where an almost straight line without any breakpoints was observed at all the stations. Besides, a Student’s t-test [32] was used, which revealed that the variations between different sub-samples of rainfall data were statistically insignificant at a 95% level of confidence.
3.2. Gridded Datasets
Six gridded rainfall datasets were used in this study: (1) Asian Precipitation—Highly Resolved Observational Data Integration Toward Evaluation, APHRODITE v.2; (2) National Oceanic and Atmospheric Administration (NOAA) Climate Prediction Center (CPC) global dataset; (3) The University of East Anglia Climatic Research Unit Time Series, CRU TS v4.01; (4) Global Precipitation Climatology Centre (GPCC) v.7; (5) Center for Climatic Research, University of Delaware (UDel) V.4.01; and (6) Princeton University Global Meteorological Forcing dataset (PGF) for land surface modeling v.1. Table 2 presents a summary of datasets used. An elaborate review of the datasets is presented in the following sections. The spatial distributions of average annual rainfall obtained using each dataset are given in Figure 2. Although APHRODITE and PGF are available at a resolution of 0.25° × 0.25°, these were aggregated to 0.5° × 0.5° resolution for uniform presentation and comparison.
4. Methodology
4.1. Evaluation of Gridded Datasets
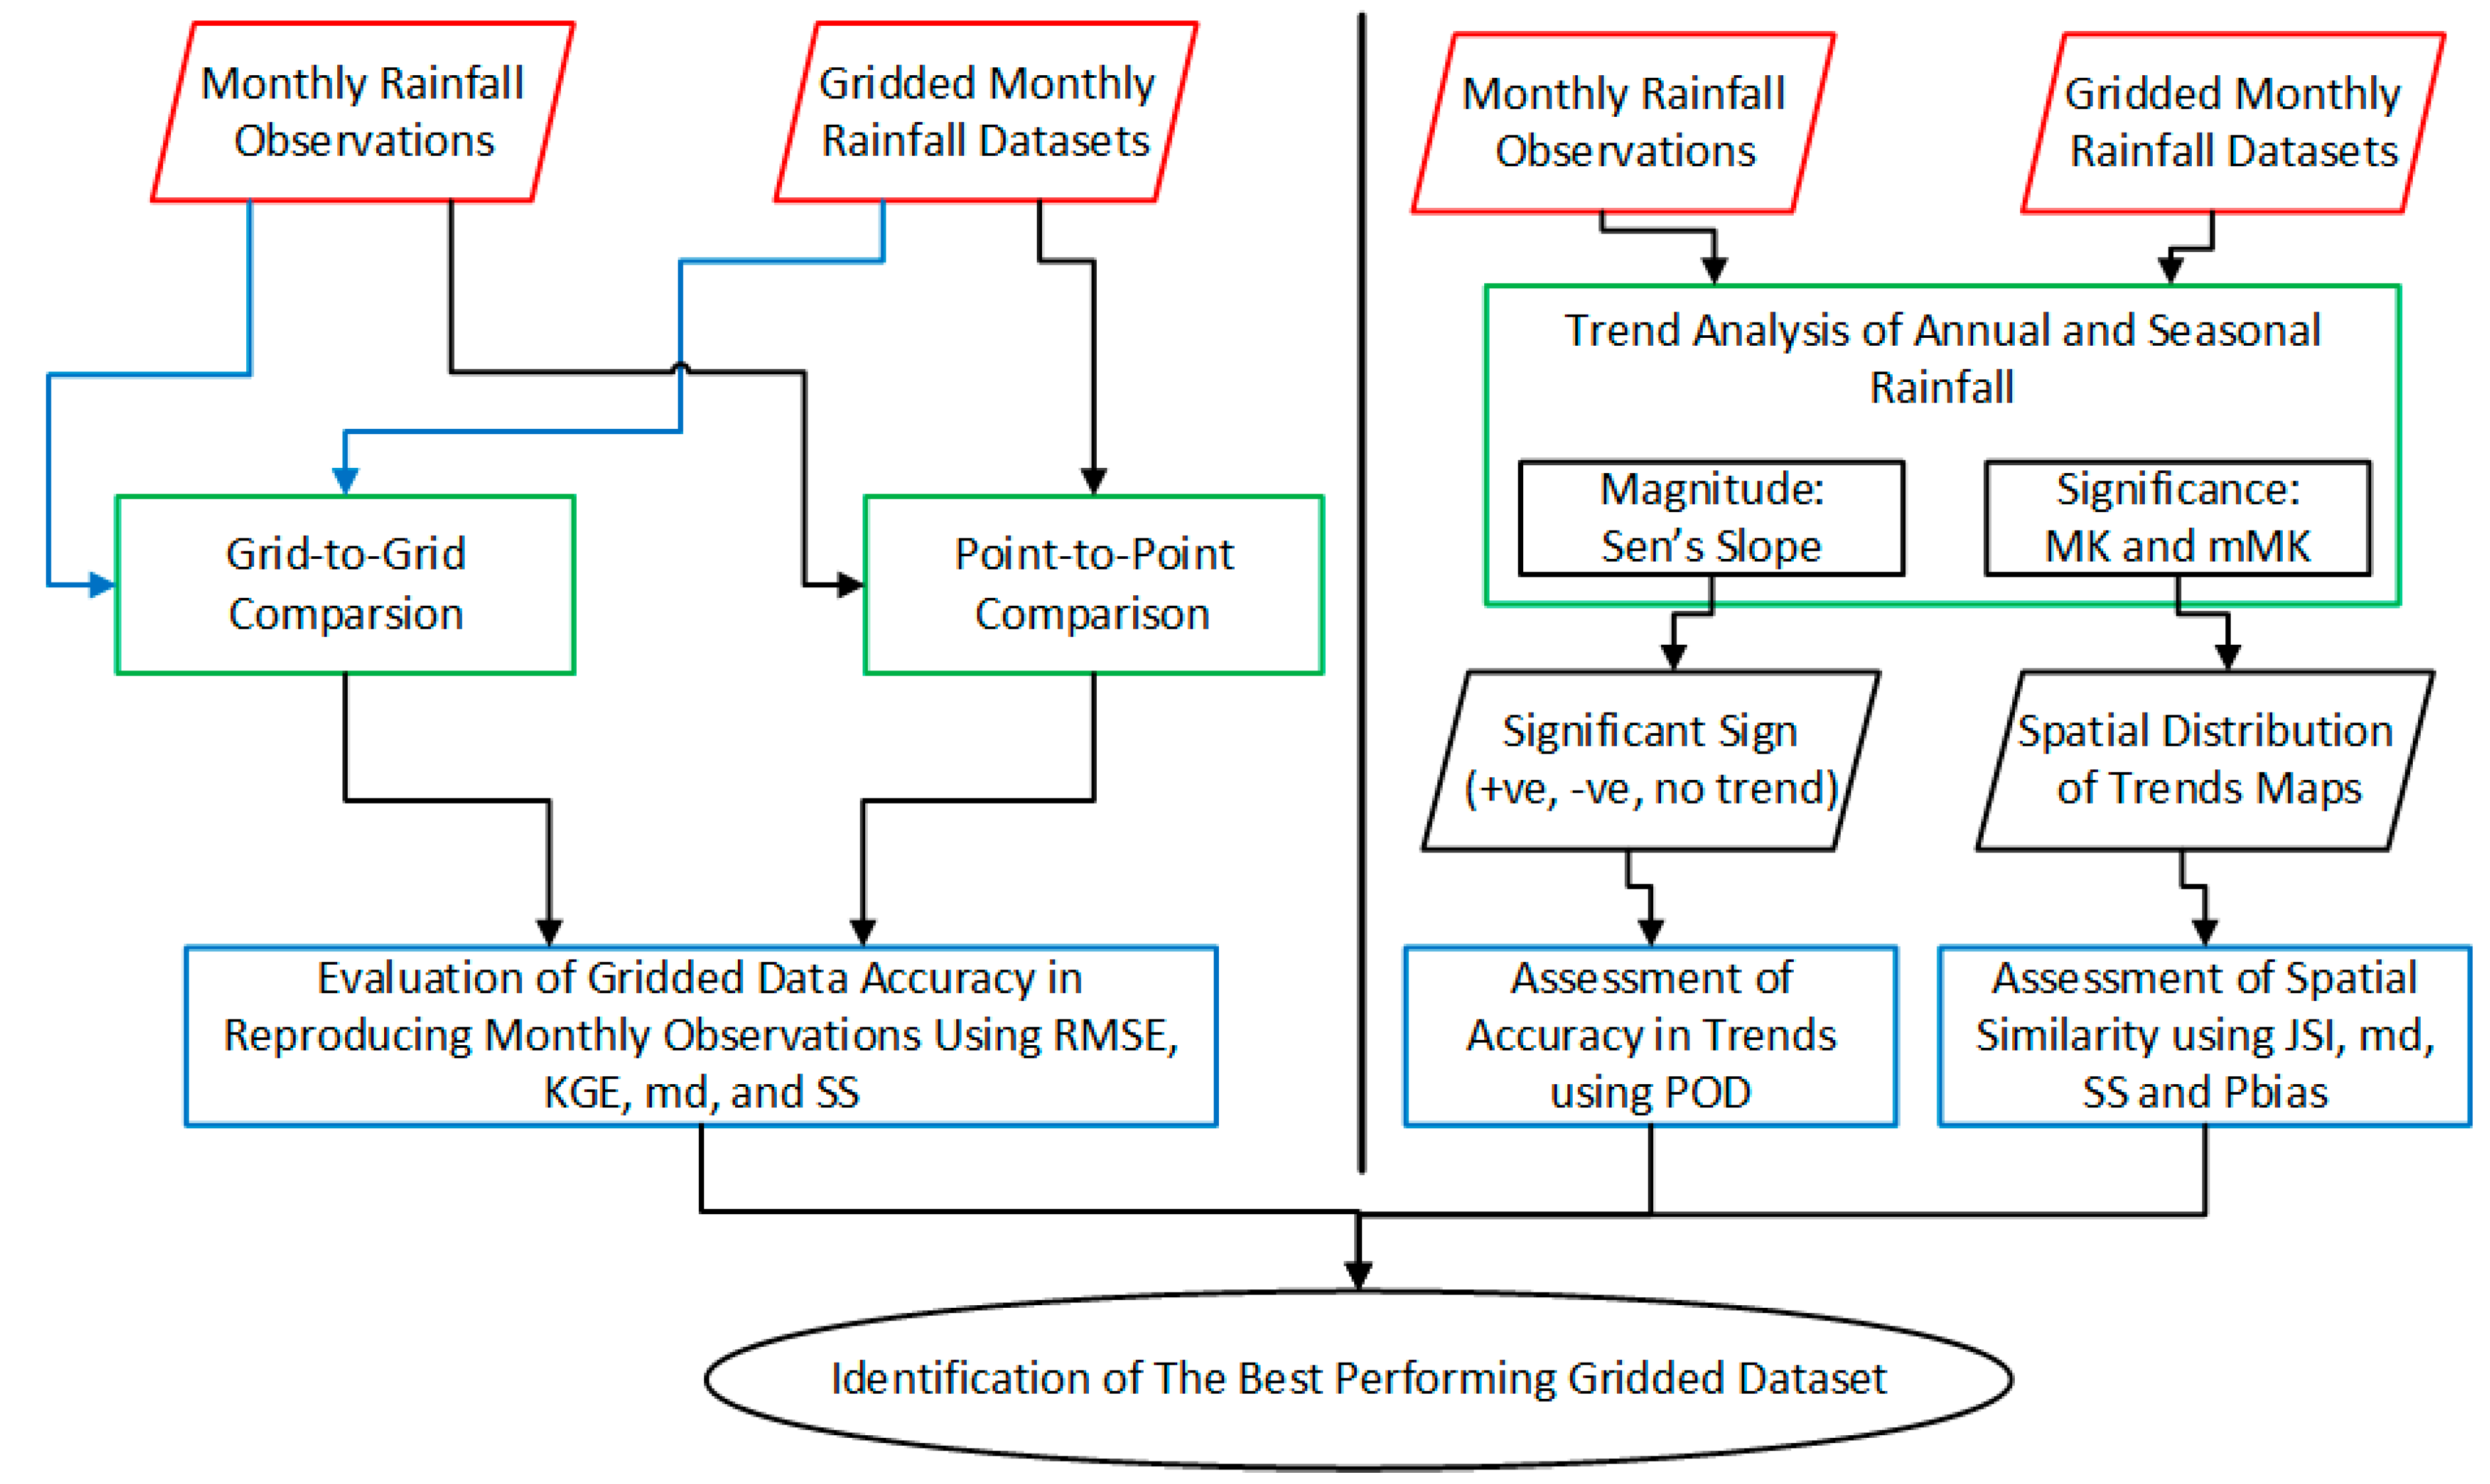
The performance of six gridded rainfall datasets was evaluated based on their ability to replicate: (a) the monthly observed rainfall at 34 stations; and (b) the spatial pattern in the magnitude and significance of annual and seasonal rainfall trends in Bangladesh. Prior to evaluation, APHRODITE, CPC, and PGF daily rainfall were converted into monthly rainfall. A flowchart showing an overview of the methodology used in this study is presented in Figure 3. There are two general ways to compare gridded data with station observation: (i) areal average precipitation for each grid box is computed from available station data and then a grid-to-grid comparison is conducted; (ii) gridded data is interpolated to station location and then compared with observed data [1,10,33]. Both the methods were used in this study for the comparison of the performance of gridded data. For the assessment of the gridded rainfall using the second approach, the monthly rainfall series of the four nearest grid points surrounding a station were interpolated at the station location using the inverse distance weighting method [10]. These interpolated series were compared with the observed gauge series. Four established statistical indices were adopted to evaluate the performance of gridded data in simulating the monthly observed rainfall: these are the Root-Mean-Square Error (RMSE), Kling–Gupta Efficiency (KGE) index, modified index of agreement (md), and Skill Score (SS). These statistical indices are widely used in the evaluation of gridded data [7,10,34]. RMSE represents the standard deviation of error in simulation. Developed by Gupta et al. [35], KGE (Equation (1)) is an integrated index that represents the correlation and bias, and similarity in variability between observed and gridded data. The md calculates the additive and proportional differences between the mean and variance of observed and gridded data [36], as in Equation (2). The SS (Equation (3)) measures the overlap between the observed and simulated probability distribution functions [37]. The optimal value of RMSE is zero. Therefore, values of KGE, md, and SS near to 1 indicate a better match between observed and gridded data.
where is person’s correlation; and represent mean and standard deviation, respectively, of simulated (sim) and observed (obs) data; n referrers to the number of grid points; is the observed time-series of station i; is the interpolated time-series from the gridded data at station i; is the mean of ; j is an arbitrary positive power; and and are the probability distribution of gridded and observed data, respectively.
4.2. Trend Analysis
Sen’s slope [38] was used to calculate the magnitude of change in observed and gridded monthly rainfall data, while MK [39,40] and mMK [41,42] tests were used to assess the significance in change. The non-parametric MK method is widely used for trend tests since it needs only the assumption of data independence as serial autocorrelation in data can increase the chance of significance in trend [18,43]. However, recent studies have shown that the significant trends over time were also sensitive to the assumptions of whether the underlying data have short-term or long-term autocorrelation. Koutsoyiannis and Montanari [44] stated that MK trend test statistic is heavily affected by long-term autocorrelation due to multi-decadal variability of climate. Thus, the MK test overestimates the significance of trend due to long-term fluctuation in time series caused by natural variability in climate. Hamed [42] proposed an mMK trend test that takes scaling of the data into account to discriminate the multi-scale variability from unidirectional trends. Several recent studies in different regions have concluded that significant trends in hydro-climatic data obtained using the MK test resulted from ignoring the natural variability of climate [3,6,20,45,46]. Therefore, the mMK test was used in this study to confirm the trend detected using the MK test. In the mMK test, the significant trend found in time series was first removed. The equivalent normal variants of the rank of the de-trended series were then obtained to derive the Hurst coefficient and its significance. If the Hurst coefficient was found to be significant, the significance of the mMK trend was estimated using a function proposed by Hamed [42]. The full description of the Sen’s slope, MK, and mMK methodologies can be found in [3,39,40,41].
4.3. Assessment of Spatial Similarity
Four indices were used to assess the spatial similarity between the rainfall change maps prepared using observed data and different gridded data: (a) Jaccard similarity index (JSI); (b) md; (c) SS; and (d) the percentage of bias (Pbias). The md and SS are described in Section 4.1. Those four indices were used to compare the Sen’s slope obtained at each 0.5° grid point against the interpolated Sen’s slope estimated using observed data at a resolution of 0.5°.
The Jaccard similarity index (JSI) [47,48] is a statistical measurement of the similarity between two sets of data using the concept of intersection over union. It can be mathematically calculated as:
where is the JSI between X and Y datasets based on a similarity threshold value.
The JSI computes the number of data shared between two sets and represents it as a percentage of the total number of data in both sets. Thus, it can have a value between 0 and 100%, where a higher percentage represents more similarity between the datasets. Yin and Yasuda [49] compared the JSI with 19 other well-known similarity assessment indices and found JSI was the best for providing stable and discriminable results.
Pbias measures the difference between the Sen’s slopes obtained using gridded data and interpolated observed data as below:
4.4. Assessment of Accuracy in Trends
The results of the MK and mMK tests were used to estimate the positive or negative trend at each grid point. As this result is categorical, the Probability of Detection (POD) index was used to assess the reliability of gridded datasets in detecting the spatial pattern of trends. POD (Equation (6)) measures how many significant trend signs obtained using observed data were correctly estimated by gridded data. For example, if the sign of an observed trend is found to be the same as the sign of the trend in the corresponding grid point, the POD counts it as a correct detection. The sign means either positive, negative, or no trend. This means that if no significant trend at an observed location is also detected at the corresponding grid point, the POD counts it as a correct detection. The optimal value of POD is 1. The POD was calculated for both the MK and mMK tests at all the gauge locations.
5. Results
5.1. Evaluation of Gridded Datasets
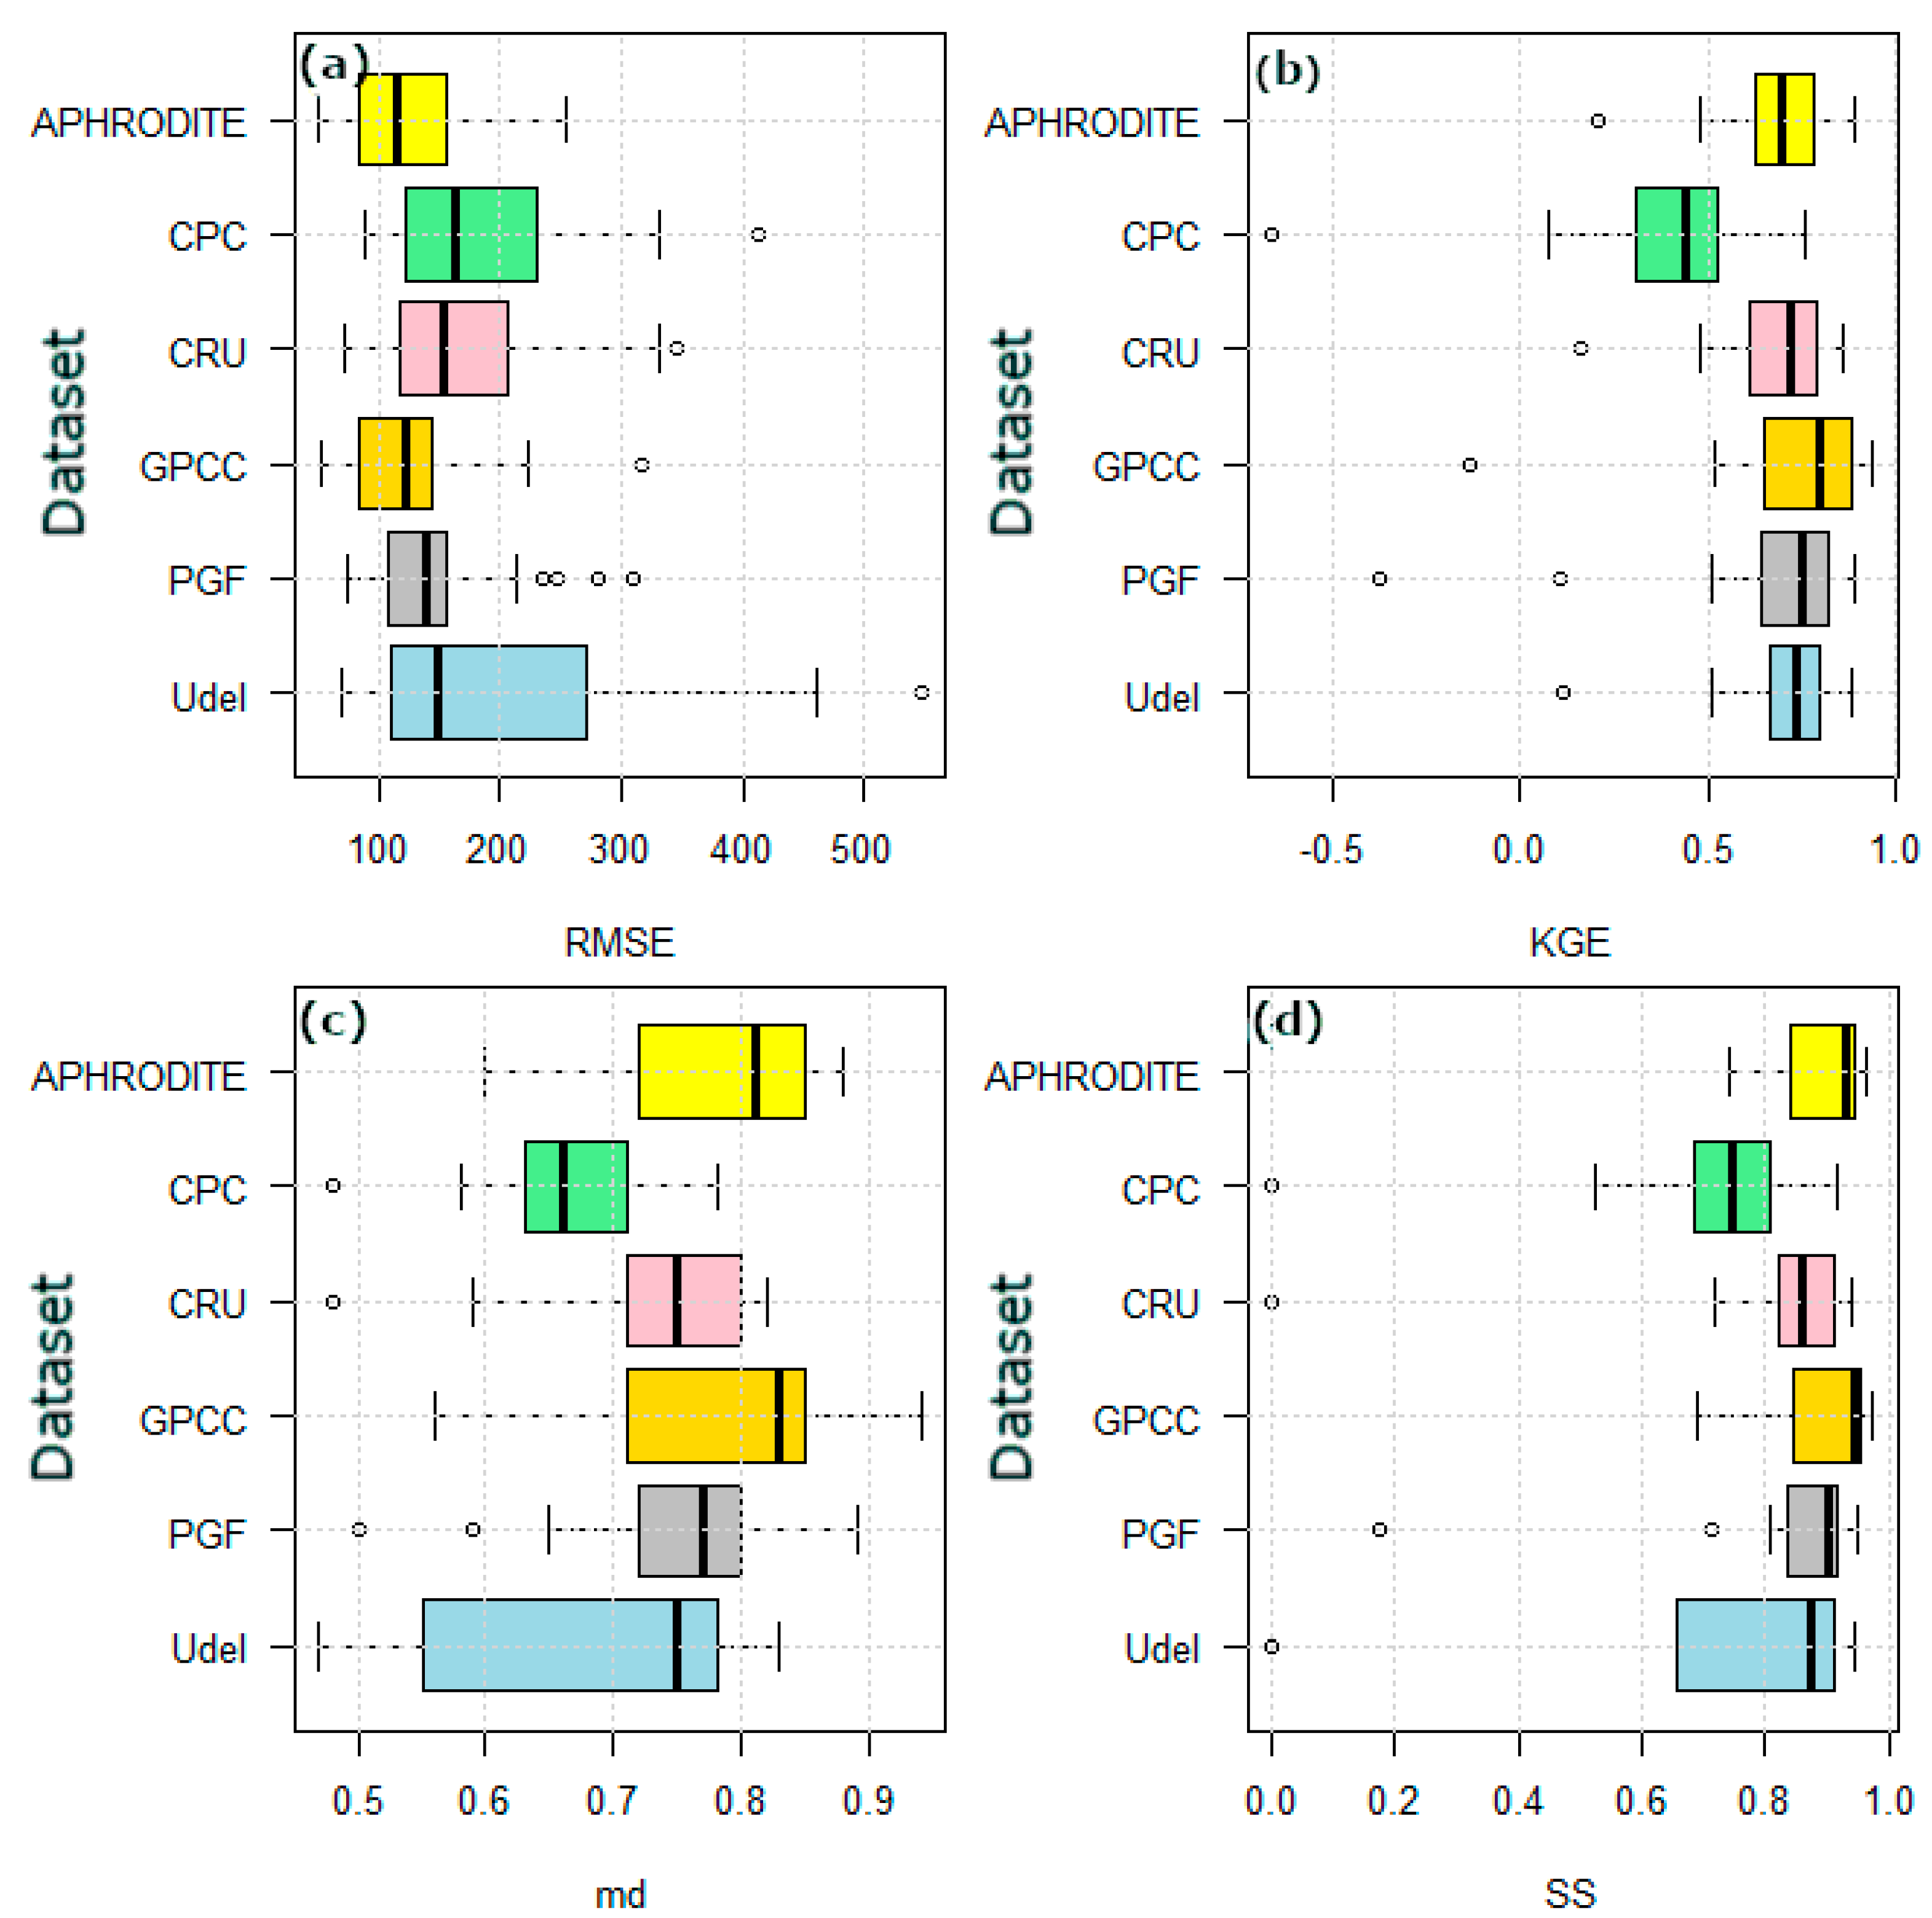
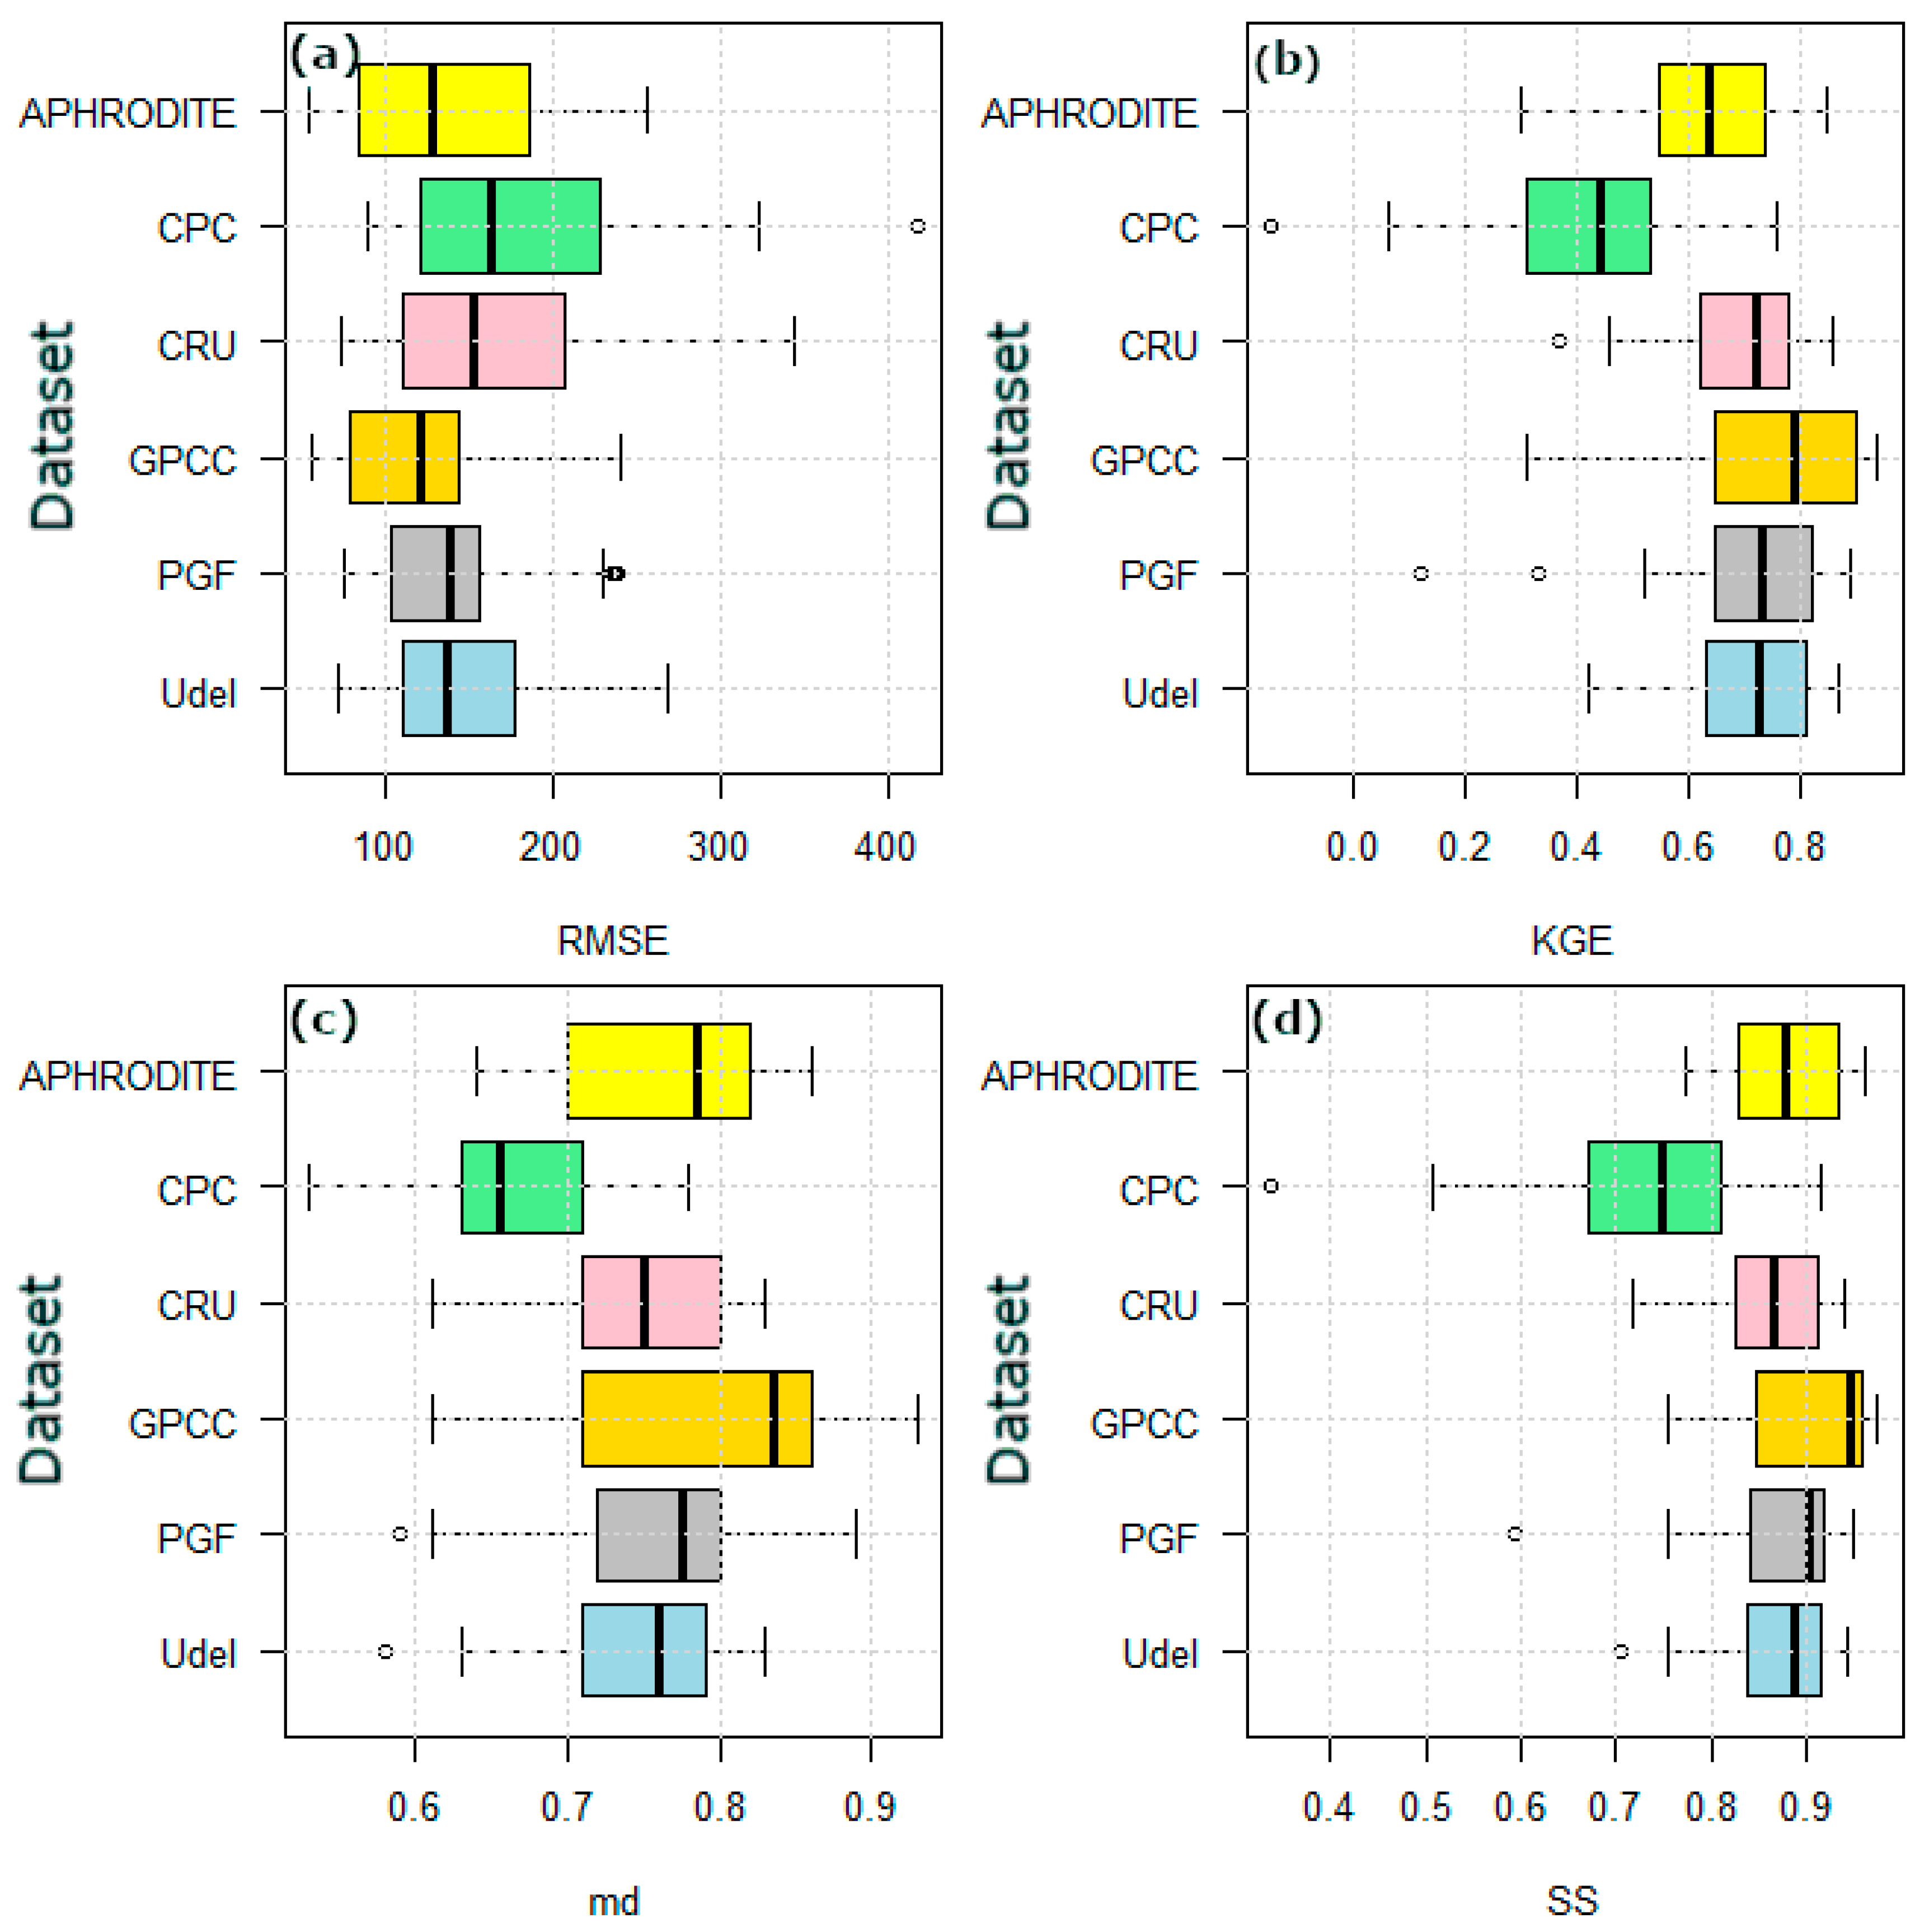
Two methods as mentioned in methodology section were used to assess the performance of six gridded rainfall data for the period 1979–2010 using four statistical indices. Figure 4 presents box plots of the statistical metrics results obtained using the grid-to-grid comparison method, while Figure 5 presents the results obtained using the point-to-point comparison method. Consistency in results was obtained using both the methods. Both the methods revealed the superiority of GPCC in replicating the observed monthly rainfall of Bangladesh. Although both the GPCC and APHRODITE showed the lowest RMSE median (121 mm), the range of RMSE for GPCC was lower than that obtained for APHRODITE. The KGE median scores for GPCC were found to be much nearer to the optimal value compared to other datasets. This indicates that the correlation of GPCC with observed data is higher, bias is lower, and variability is smaller. The md for GPCC was found to be higher than others in term of median and 3rd quantiles. APHRODITE ranked as the second best in terms of md, while CPC ranked as the worst. GPCC data was also found to generate Probability Distribution Functions (PDFs) that overlapped the observed rainfall PDFs at different grid points. Therefore, the mean SS of GPCC was higher (0.95 and 0.91 for grid-to-grid and point-to-point comparison methods, respectively) than that obtained for other gridded datasets.
5.2. Comparison of Trends
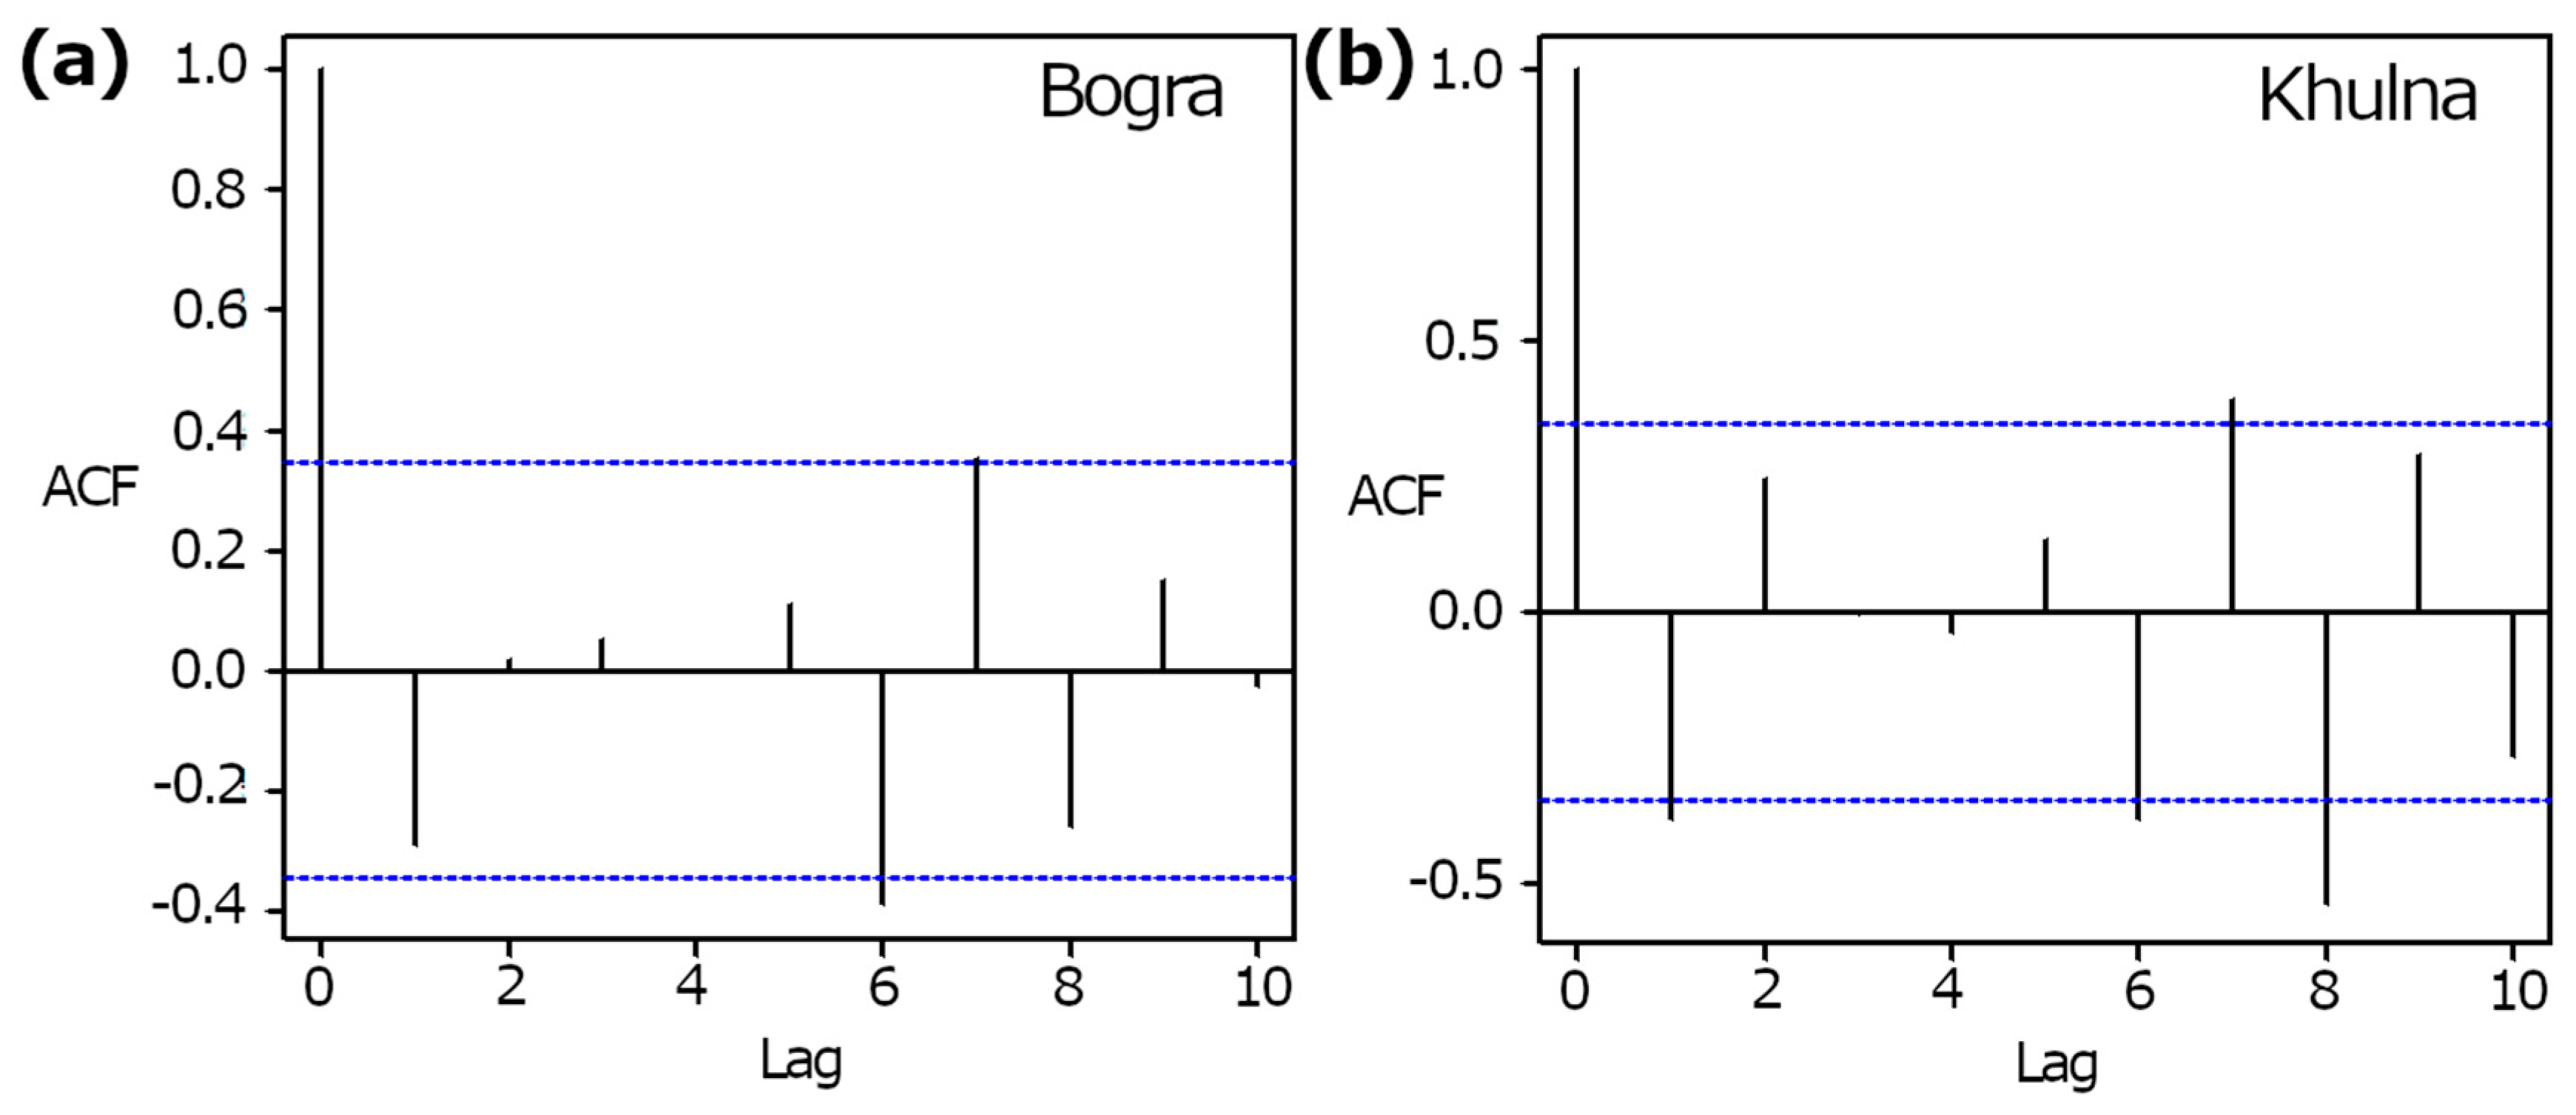
The characteristics of rainfall data were analyzed before trend analysis to reveal the presence of autocorrelations and multi-decadal variability in time series. The autocorrelation function (AFC) was used in this study to find a significant correlation for various time lags, while the presence of decadal and multi-decadal variability in the time series of climate indices were assessed through wavelet decomposition of time series data [50]. The AFC plot of annual rainfall data at two locations is shown in Figure 6. The vertical lines in the plot that exceed the blue confidence band (horizontal lines) indicate significant correlation. The figure clearly shows positive autocorrelation up to 7-lag years in the time series.
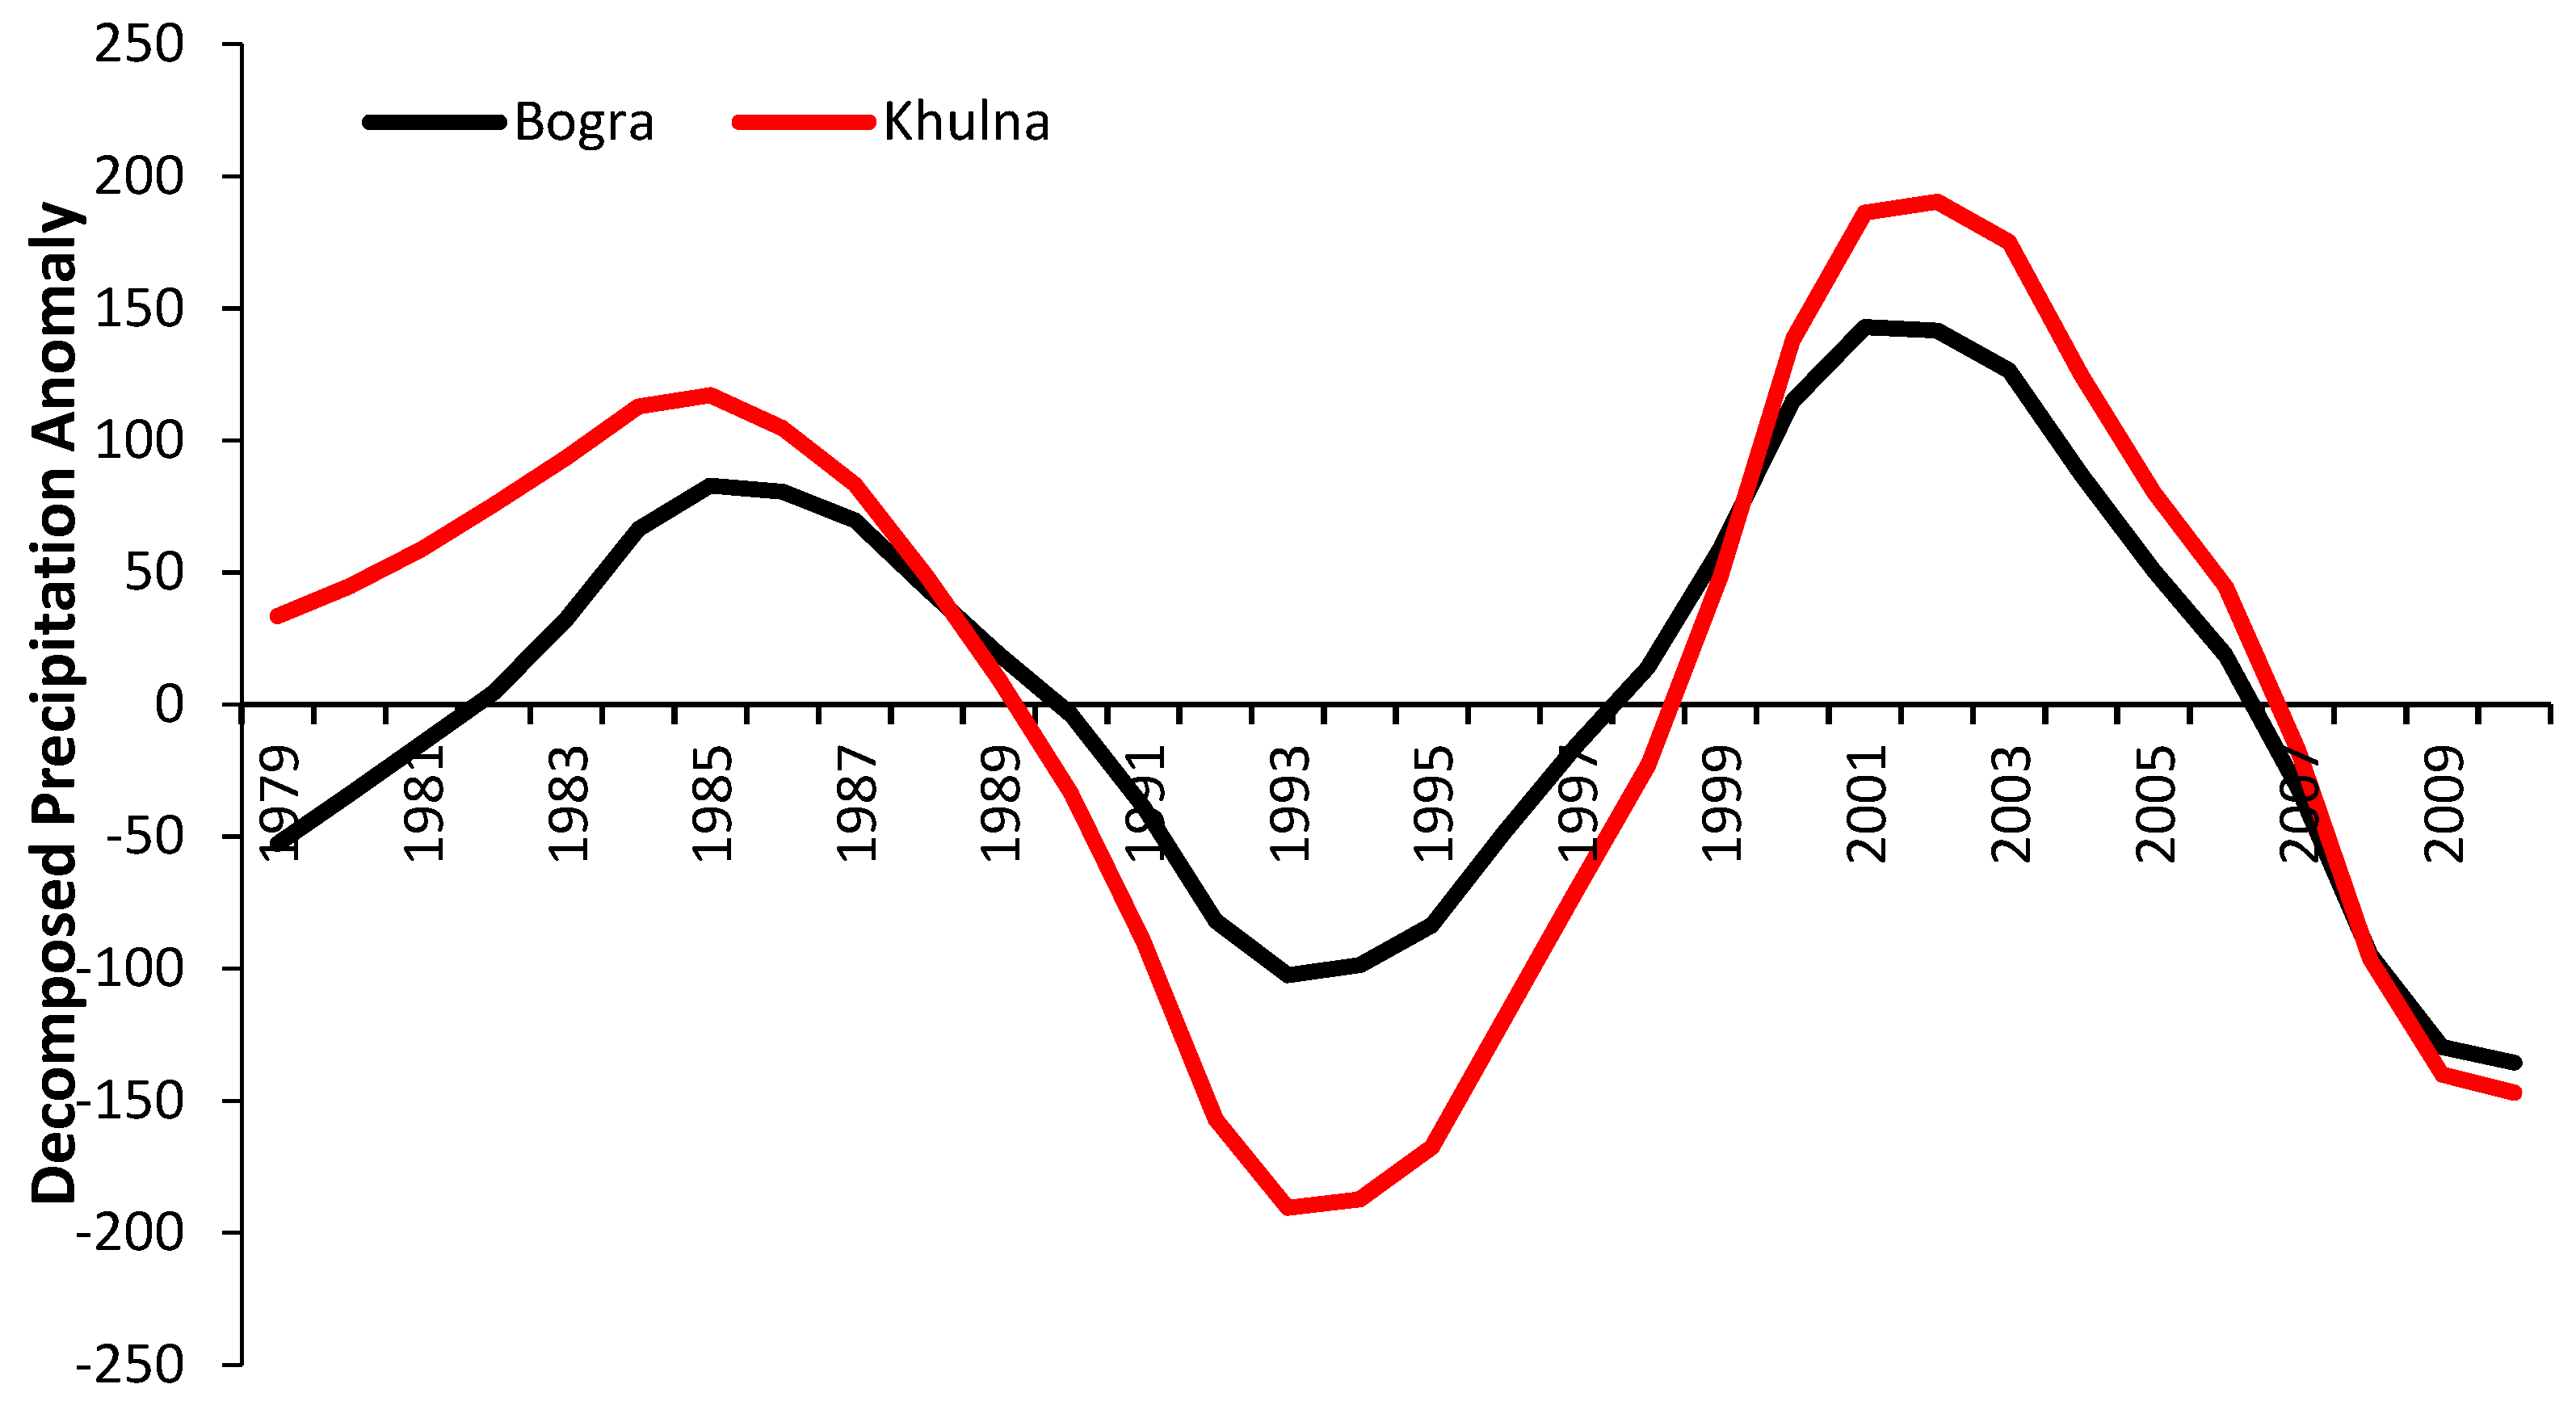
Different levels of decompositions reveal the presence of different cycles in the time series. The obtained results for annual rainfall at two stations are shown in Figure 7. The fourth-level decomposition of data revealed the presence of a cycle of nearly 20 years in both stations. The x-axis of the graph shows the number of years and the y-axis shows the decomposed precipitation anomaly. Similar results were obtained at other stations. The results indicate the presence of short- and long-term autocorrelations in the annual rainfall of Bangladesh. The presence of such multi-decadal variations in annual rainfall time series can significantly affect the trend in rainfall if it is not taken into consideration during trend analysis. Therefore, the mMK test along with the MK test was also used in the present study.
Changes in annual and seasonal rainfall in Bangladesh were assessed using six gridded and observed rainfall data for the period 1979–2010. The monthly rainfall data were converted to annual and seasonal total rainfall to assess the trends. The obtained results were used to prepare maps to show the spatial pattern of the change (Sen’s slope) in the annual and seasonal rainfall at 0.5° × 0.5° grid. For the comparison of slopes in observed and gridded data, observed data were gridded to the resolution of gridded data (0.5° × 0.5°) and the areal average rainfall for each grid box was computed. The grid-to-grid comparison of slopes was conducted by comparing the Sen’s slope estimated for the areal average of observed rainfall at each grid box with the Sen’s slope estimated for gridded data.
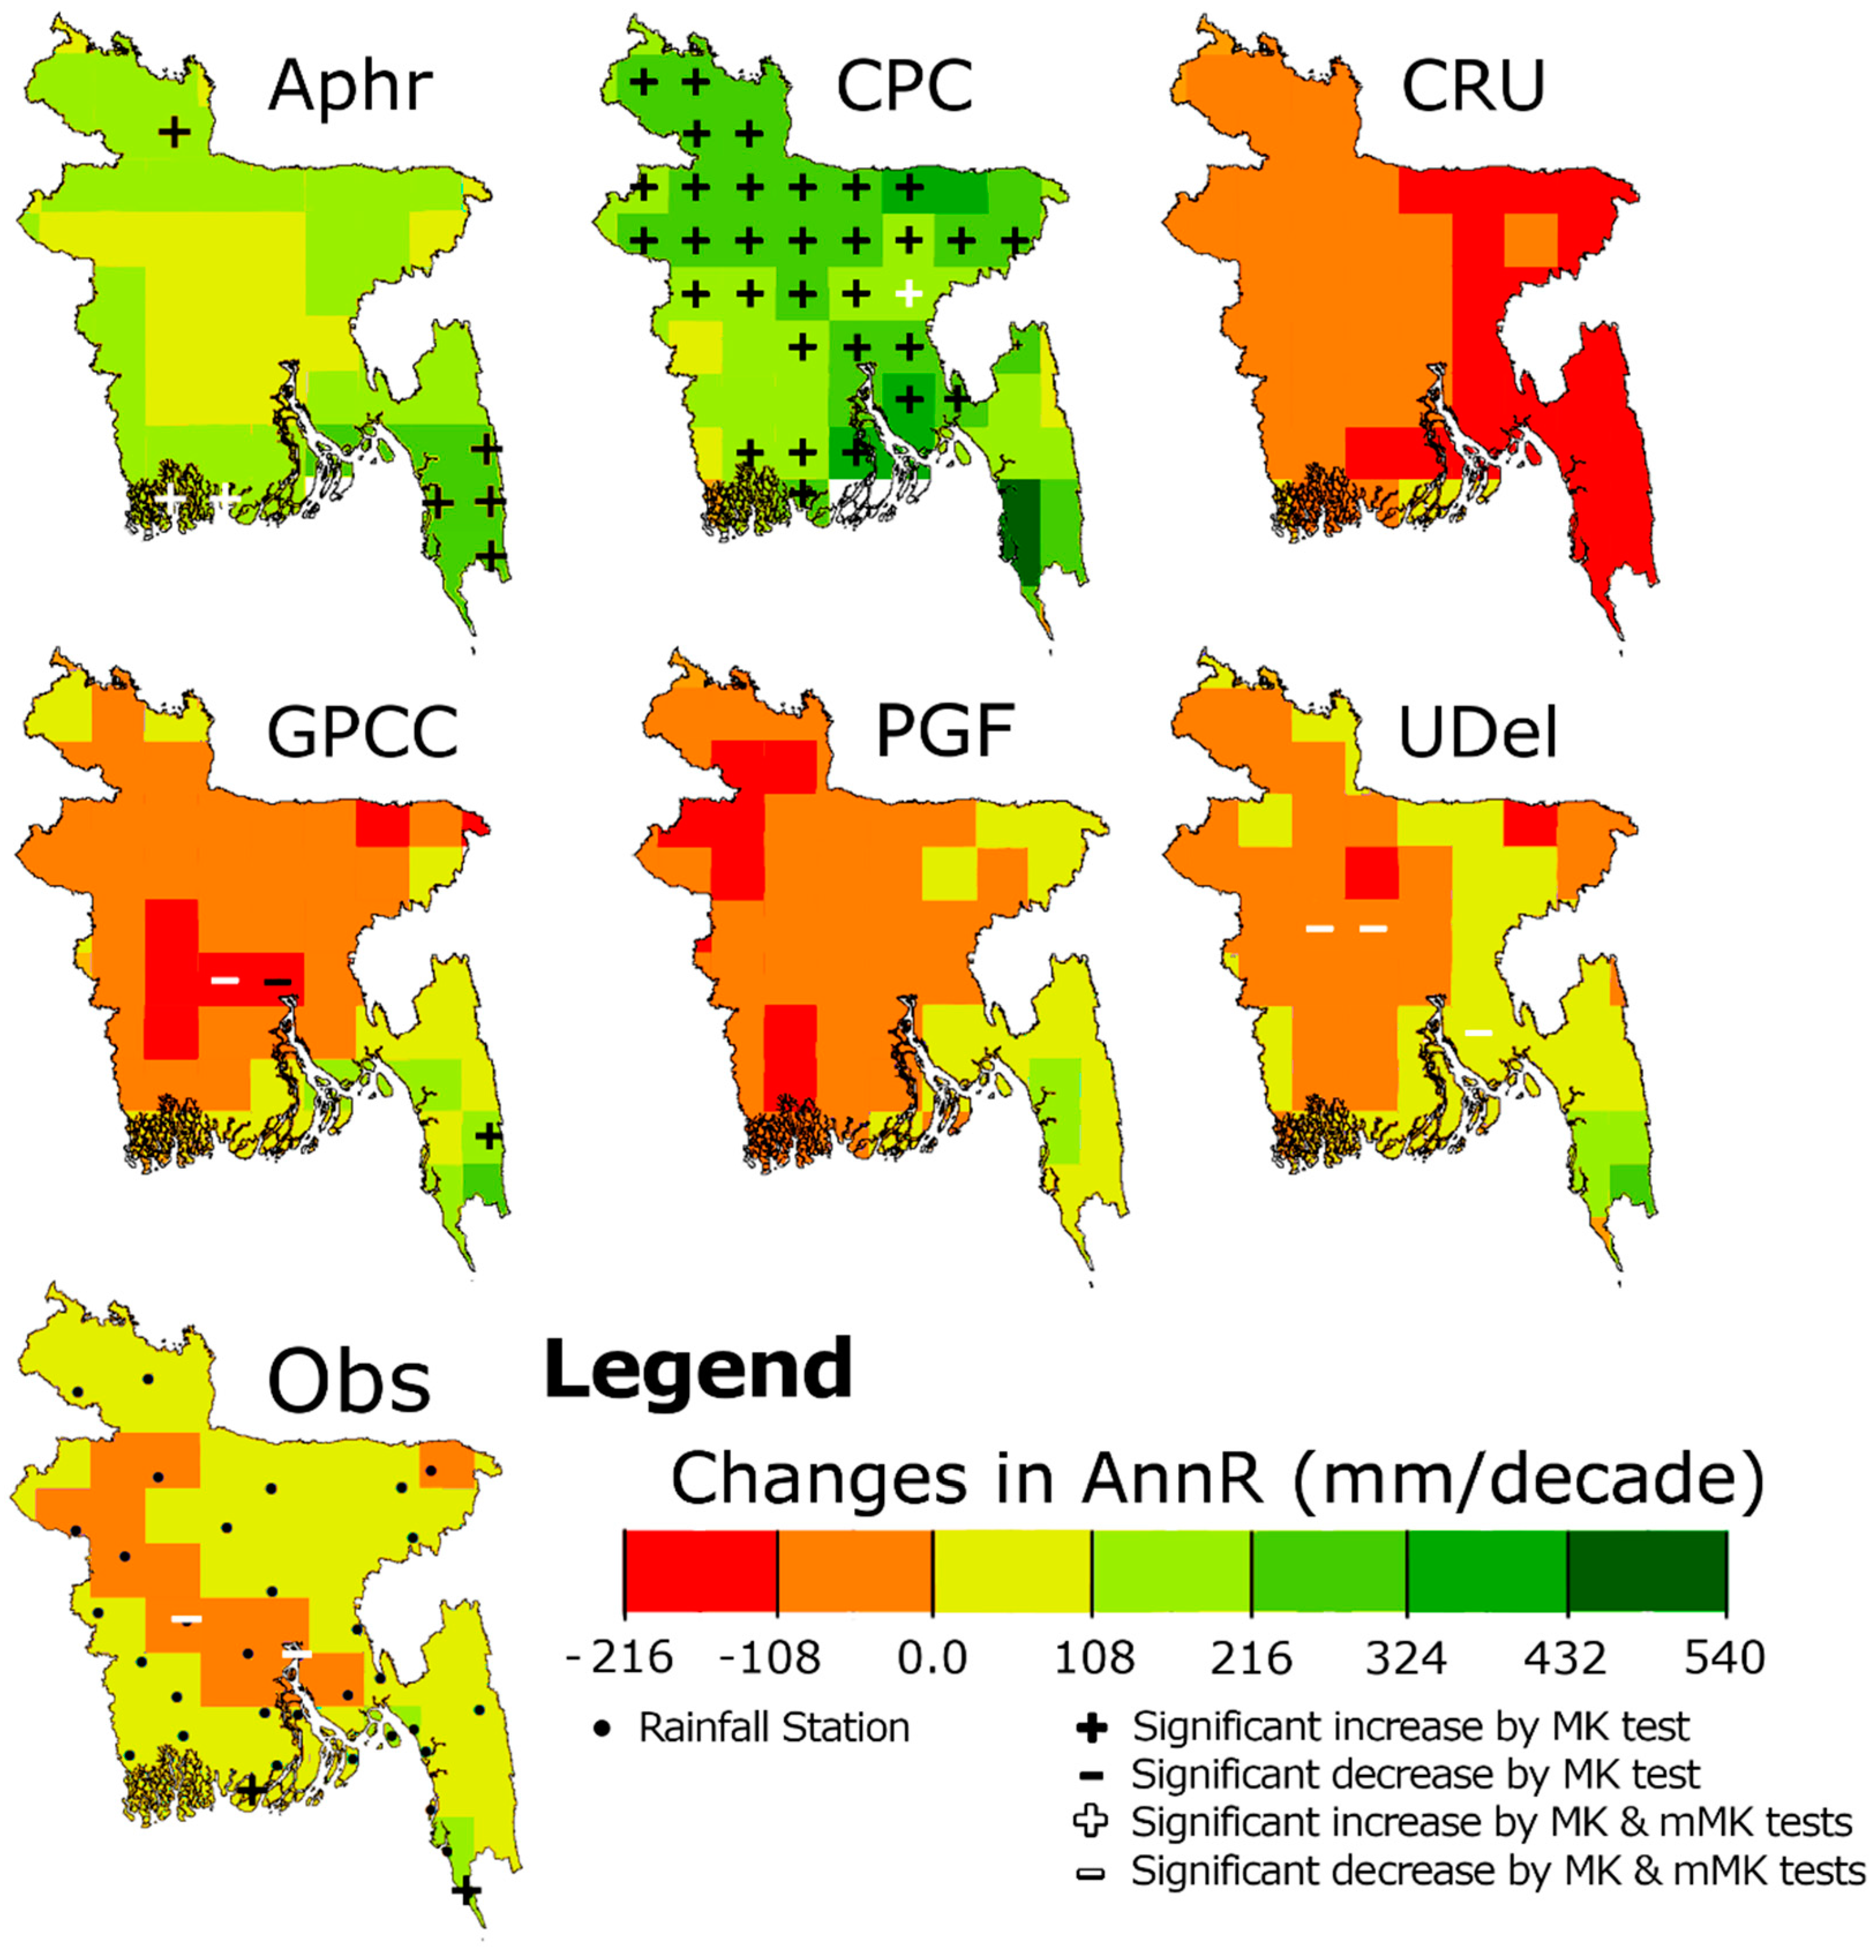
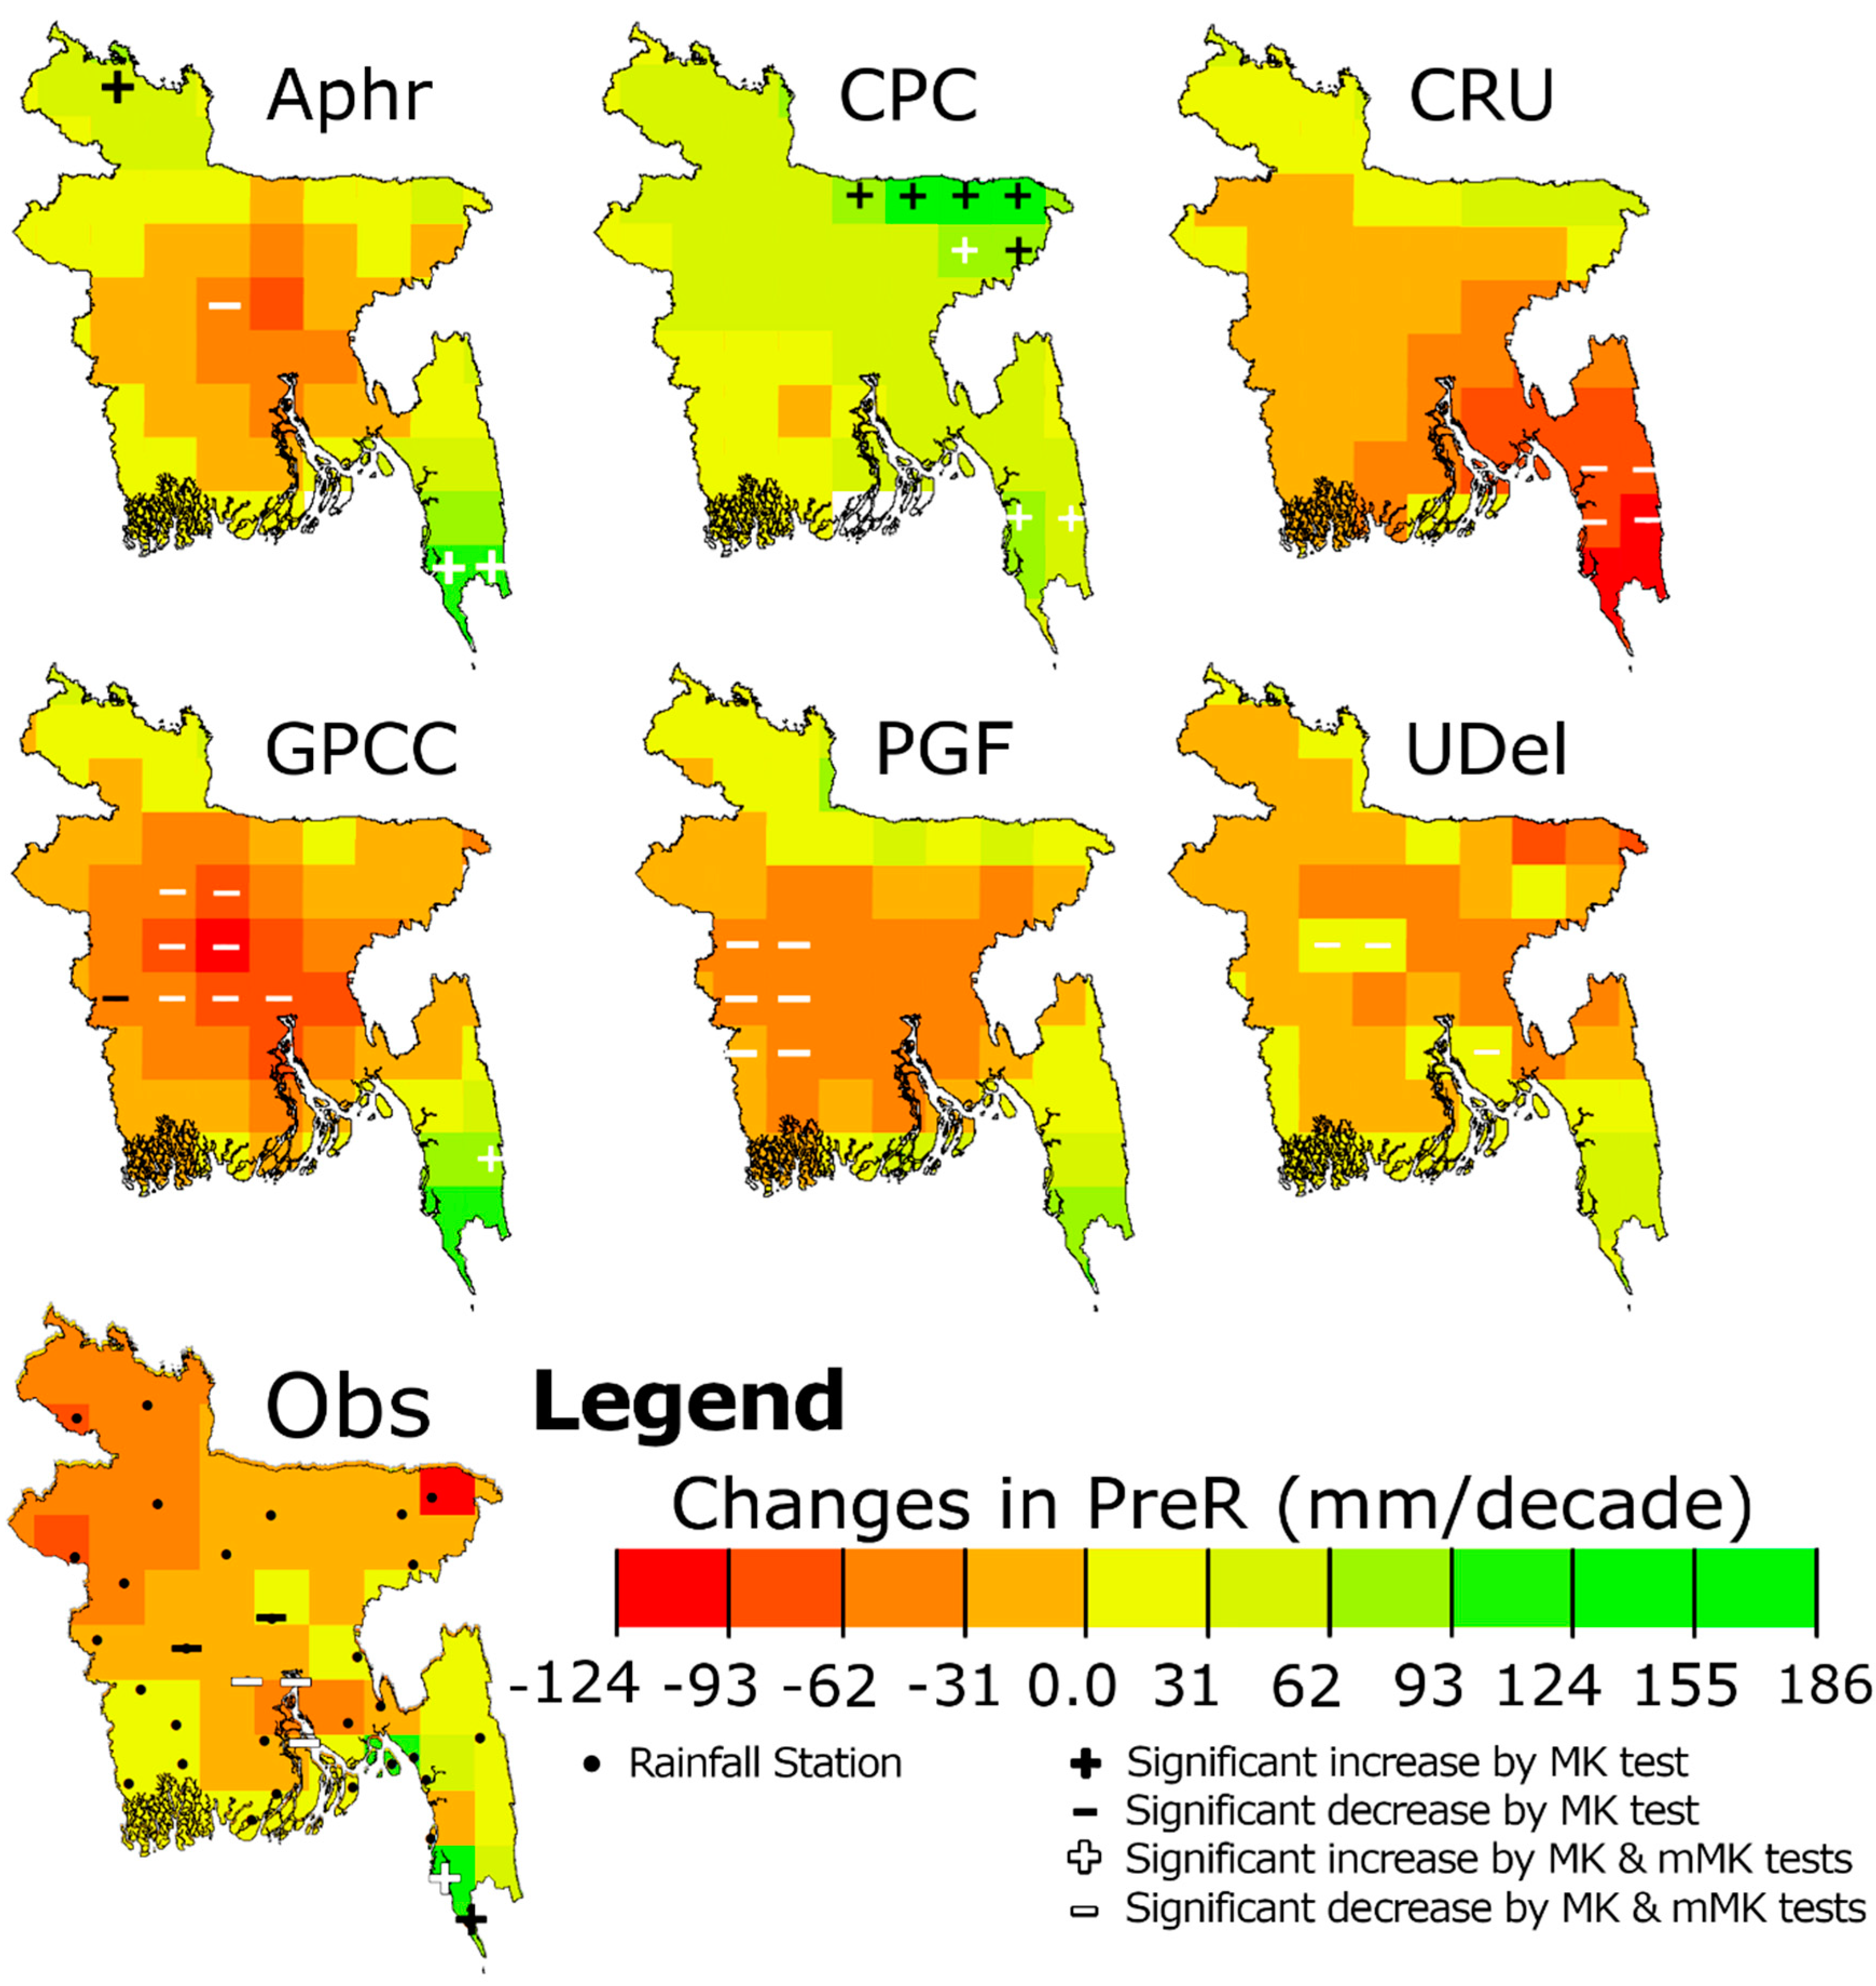
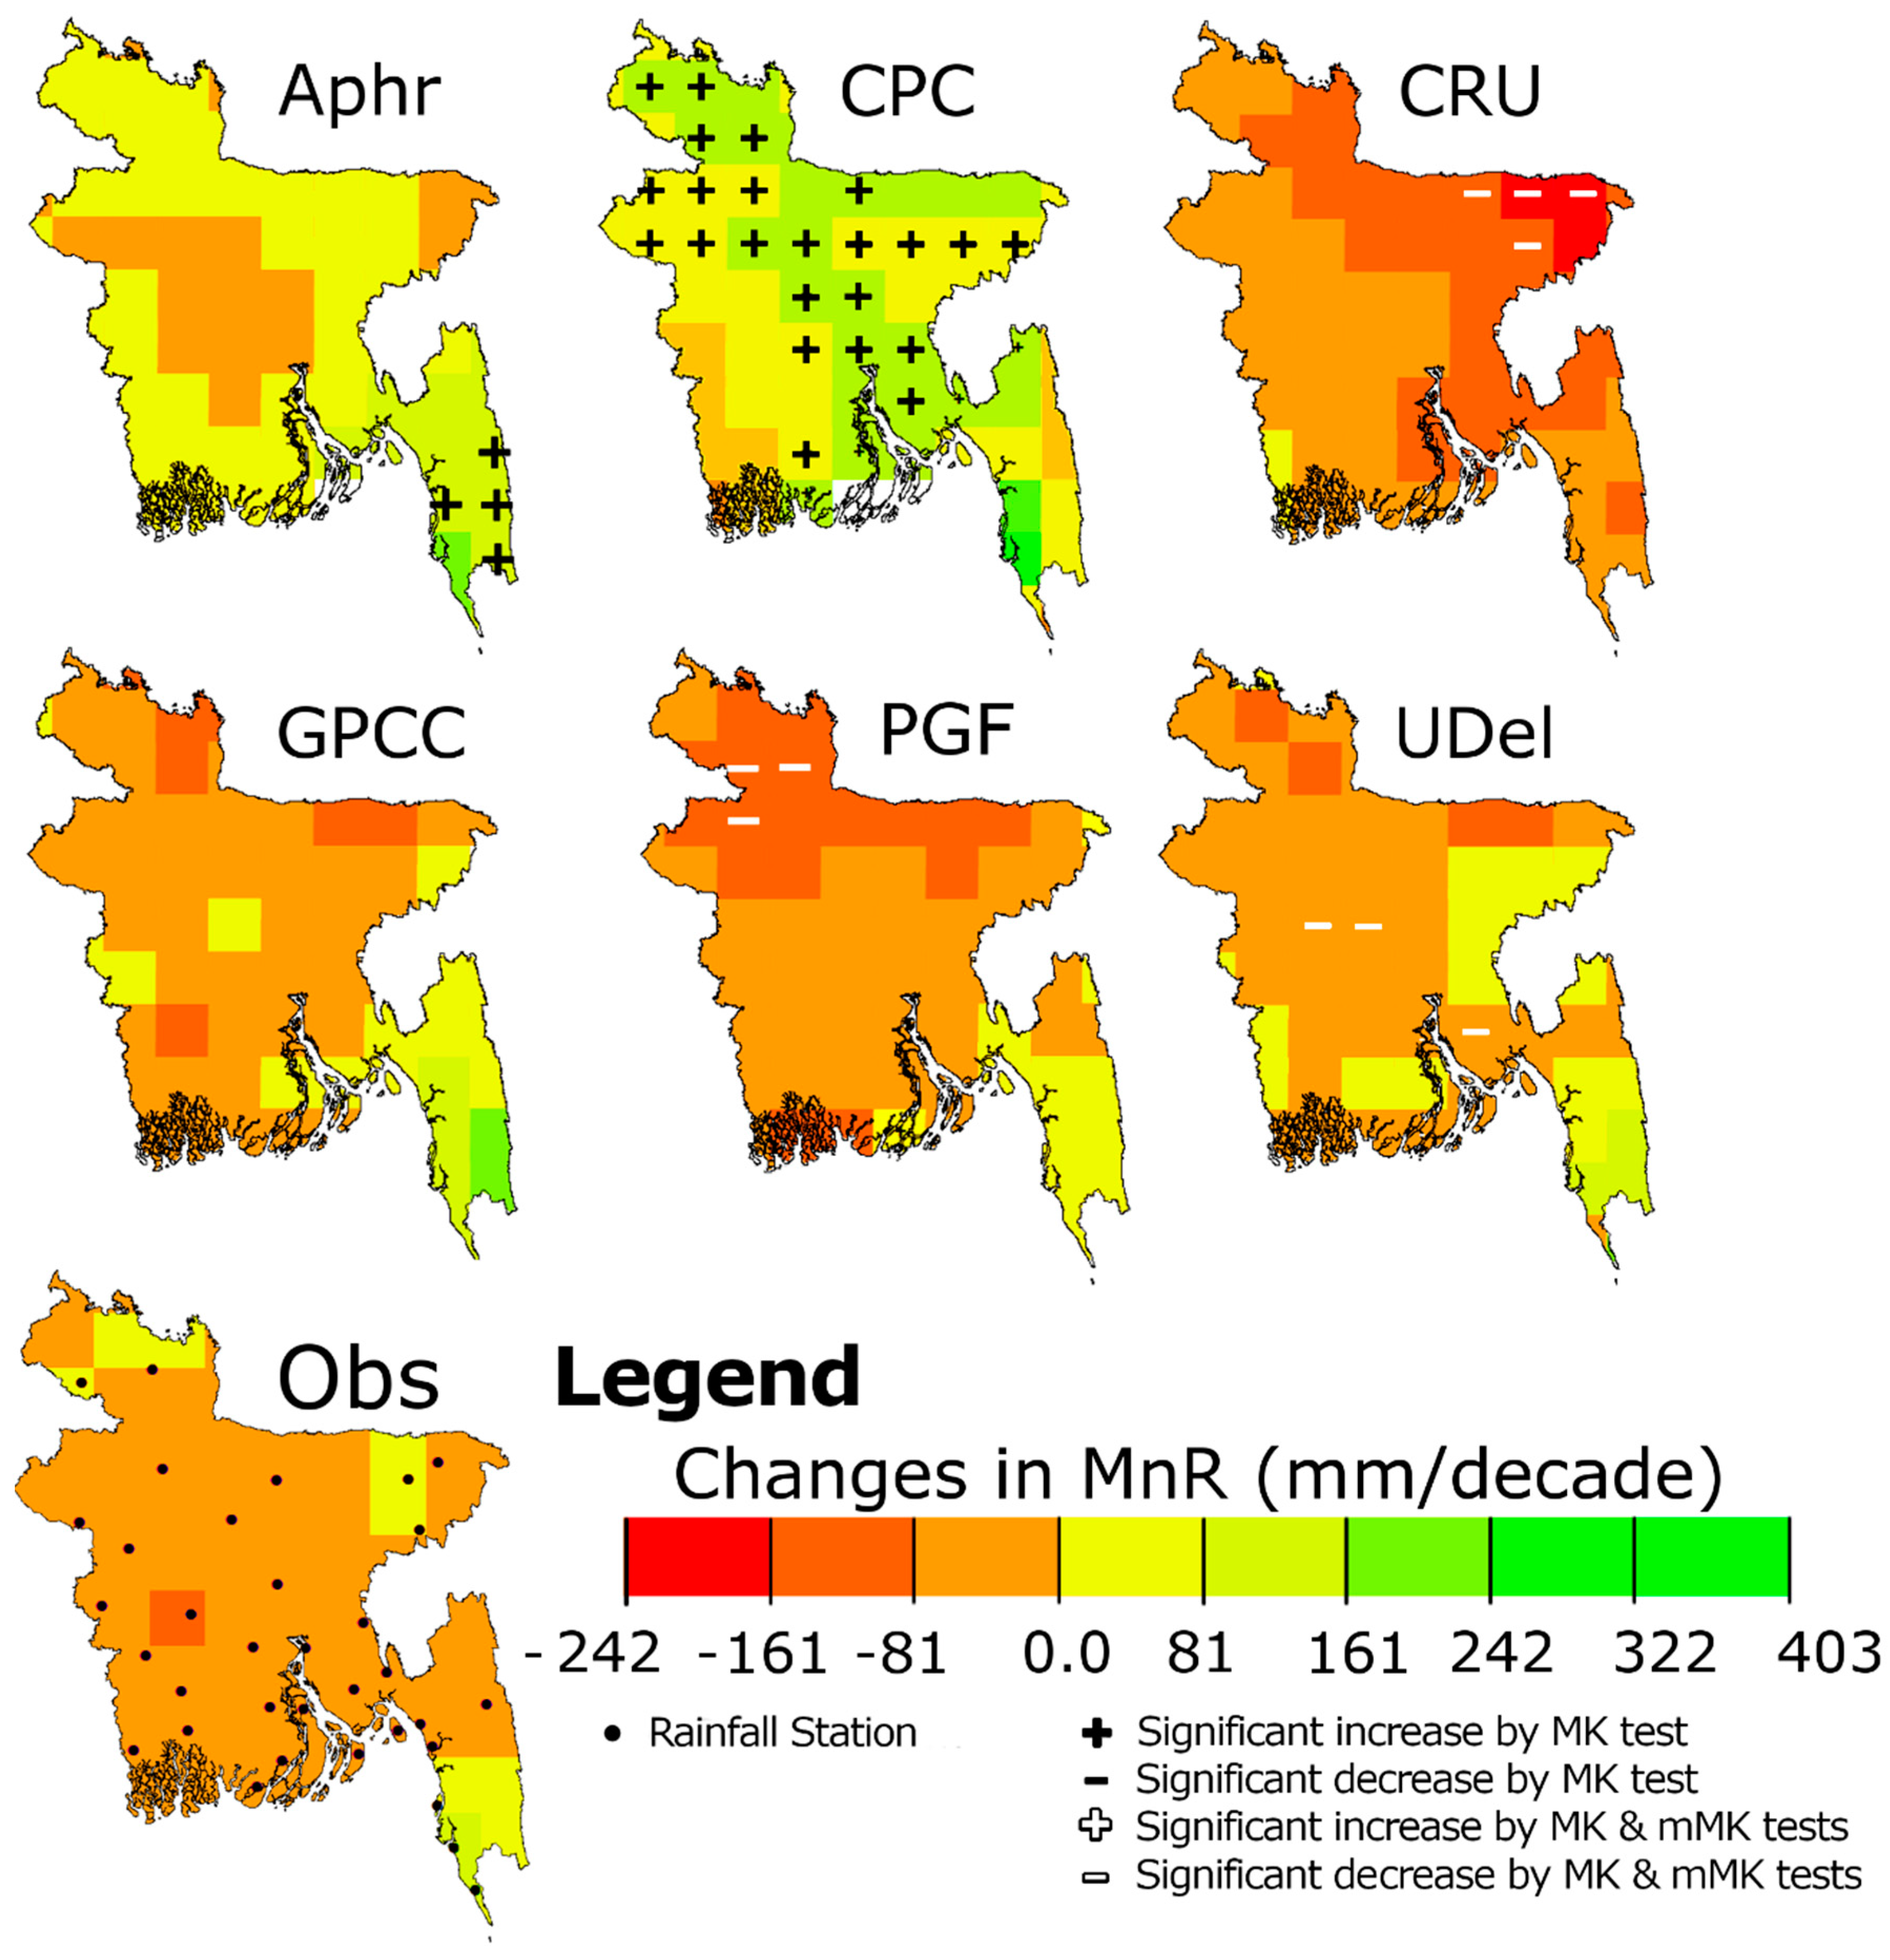
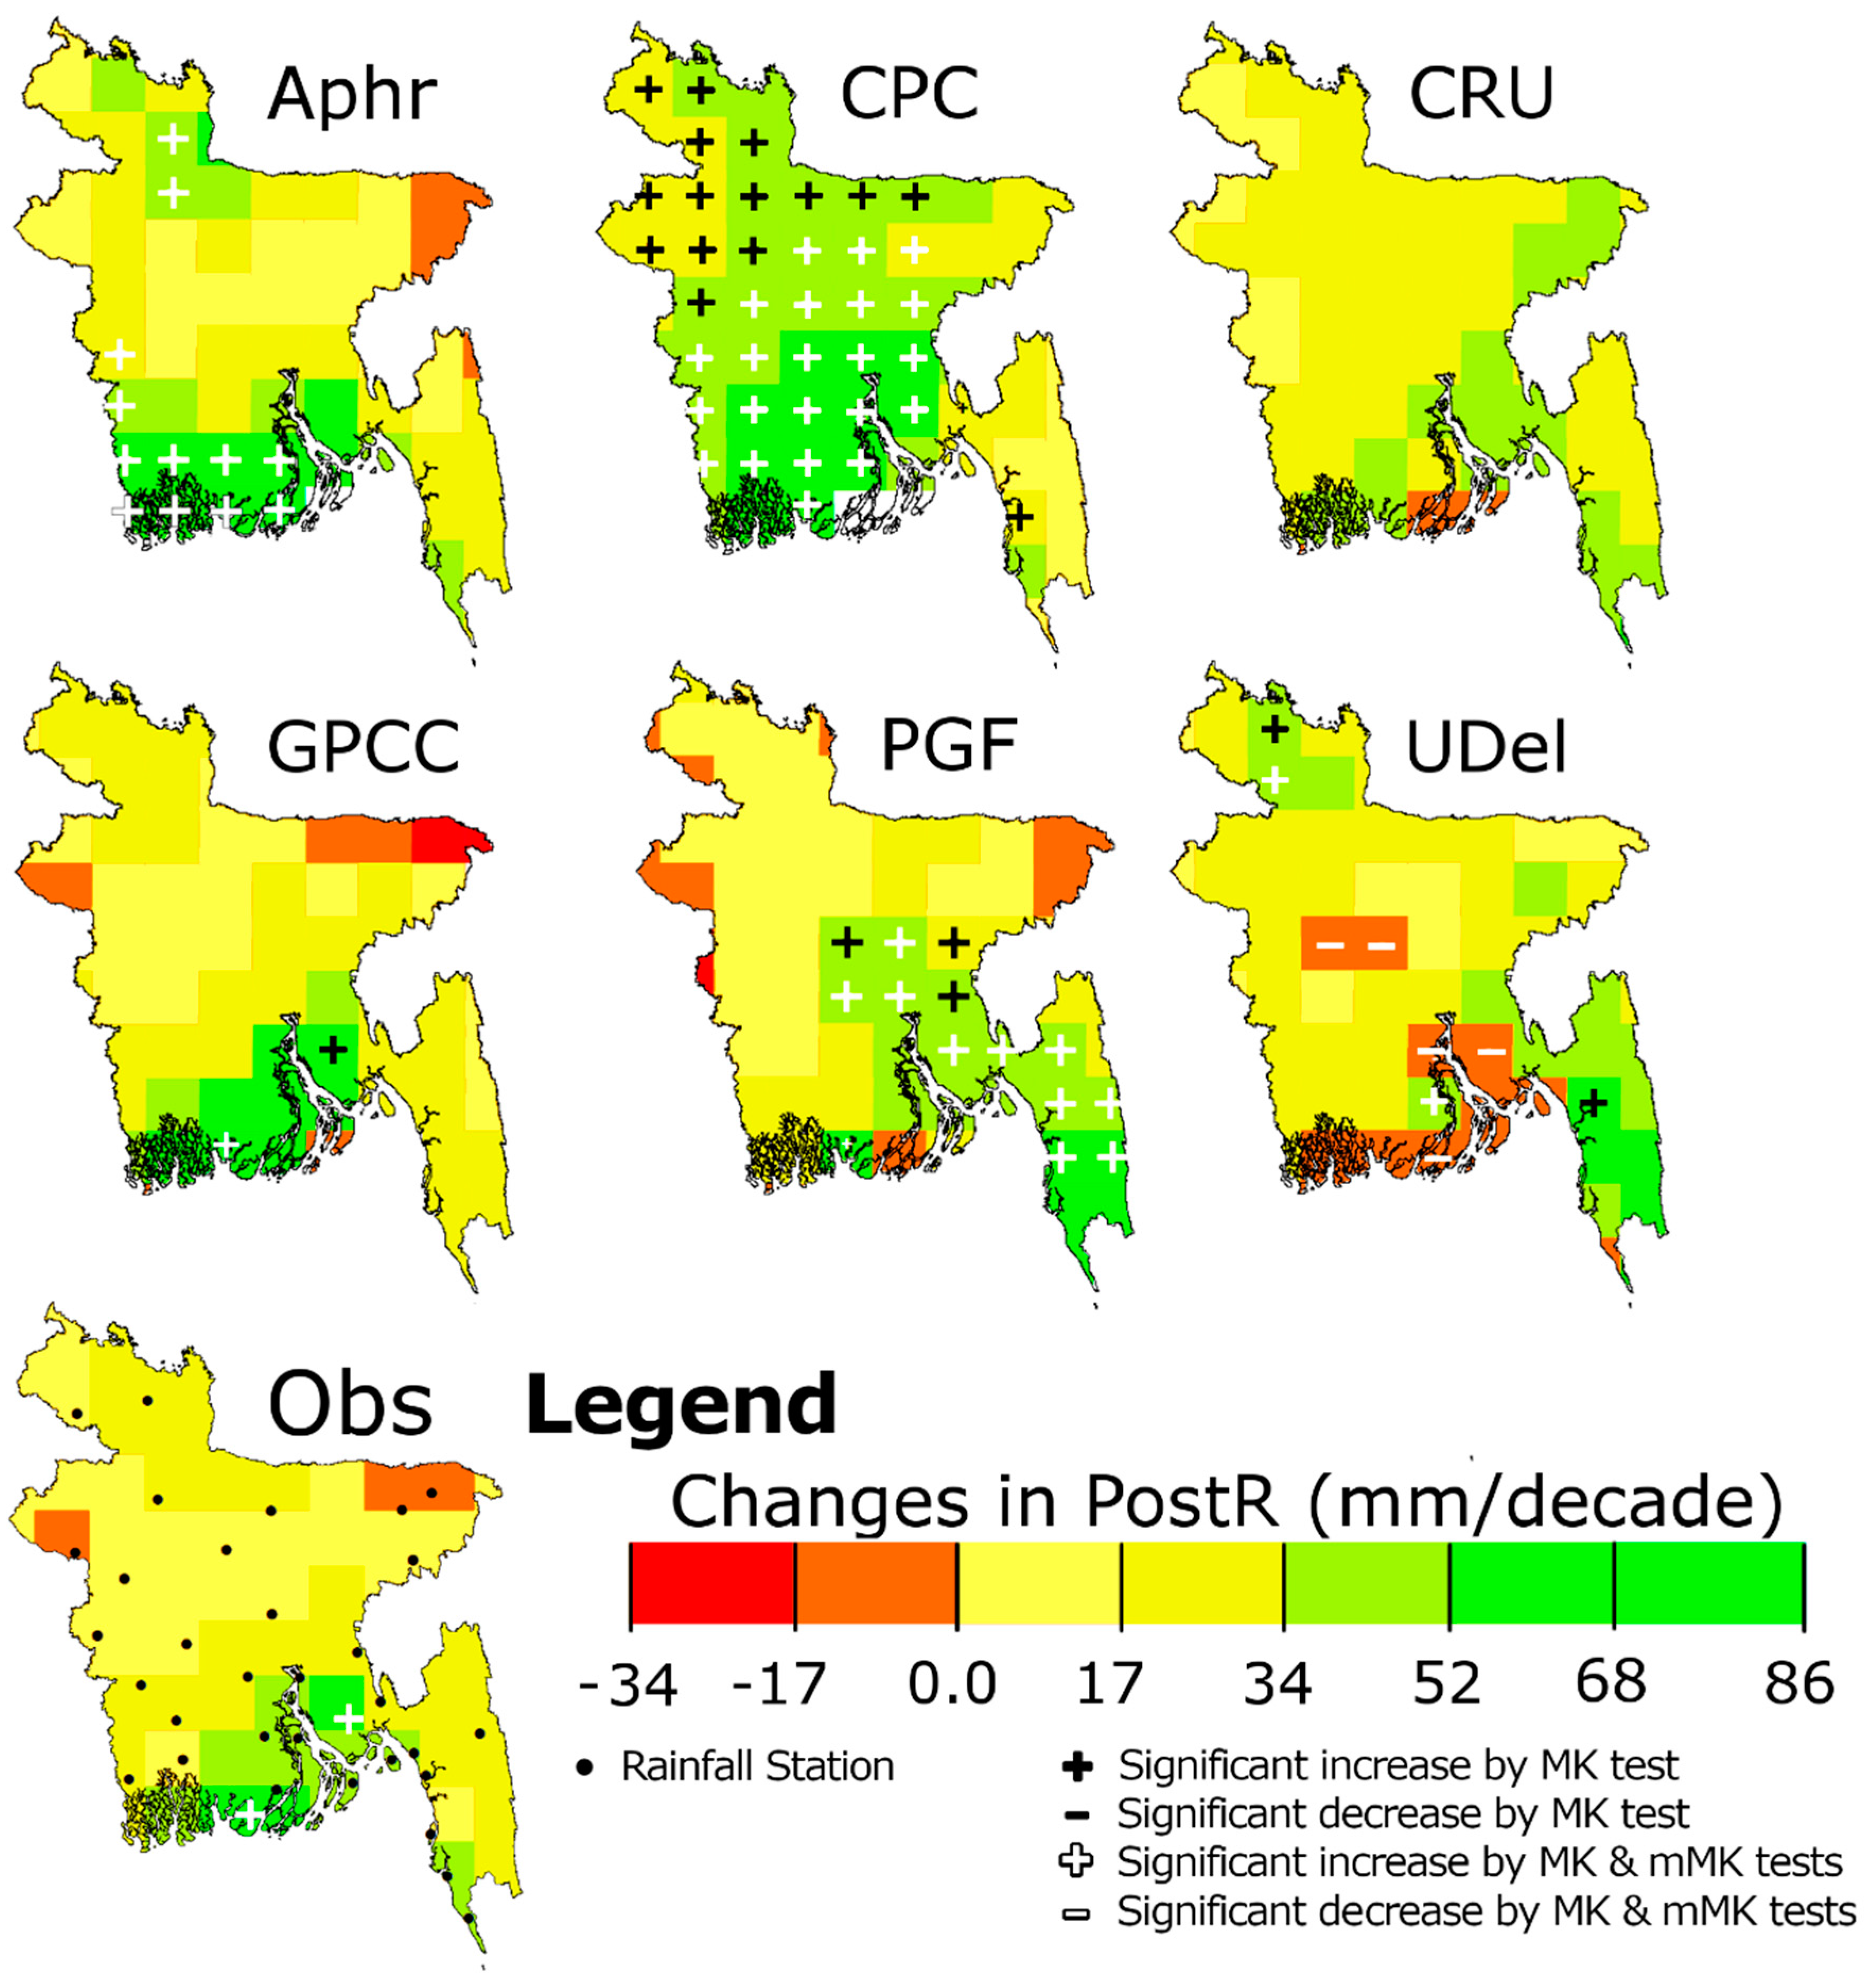
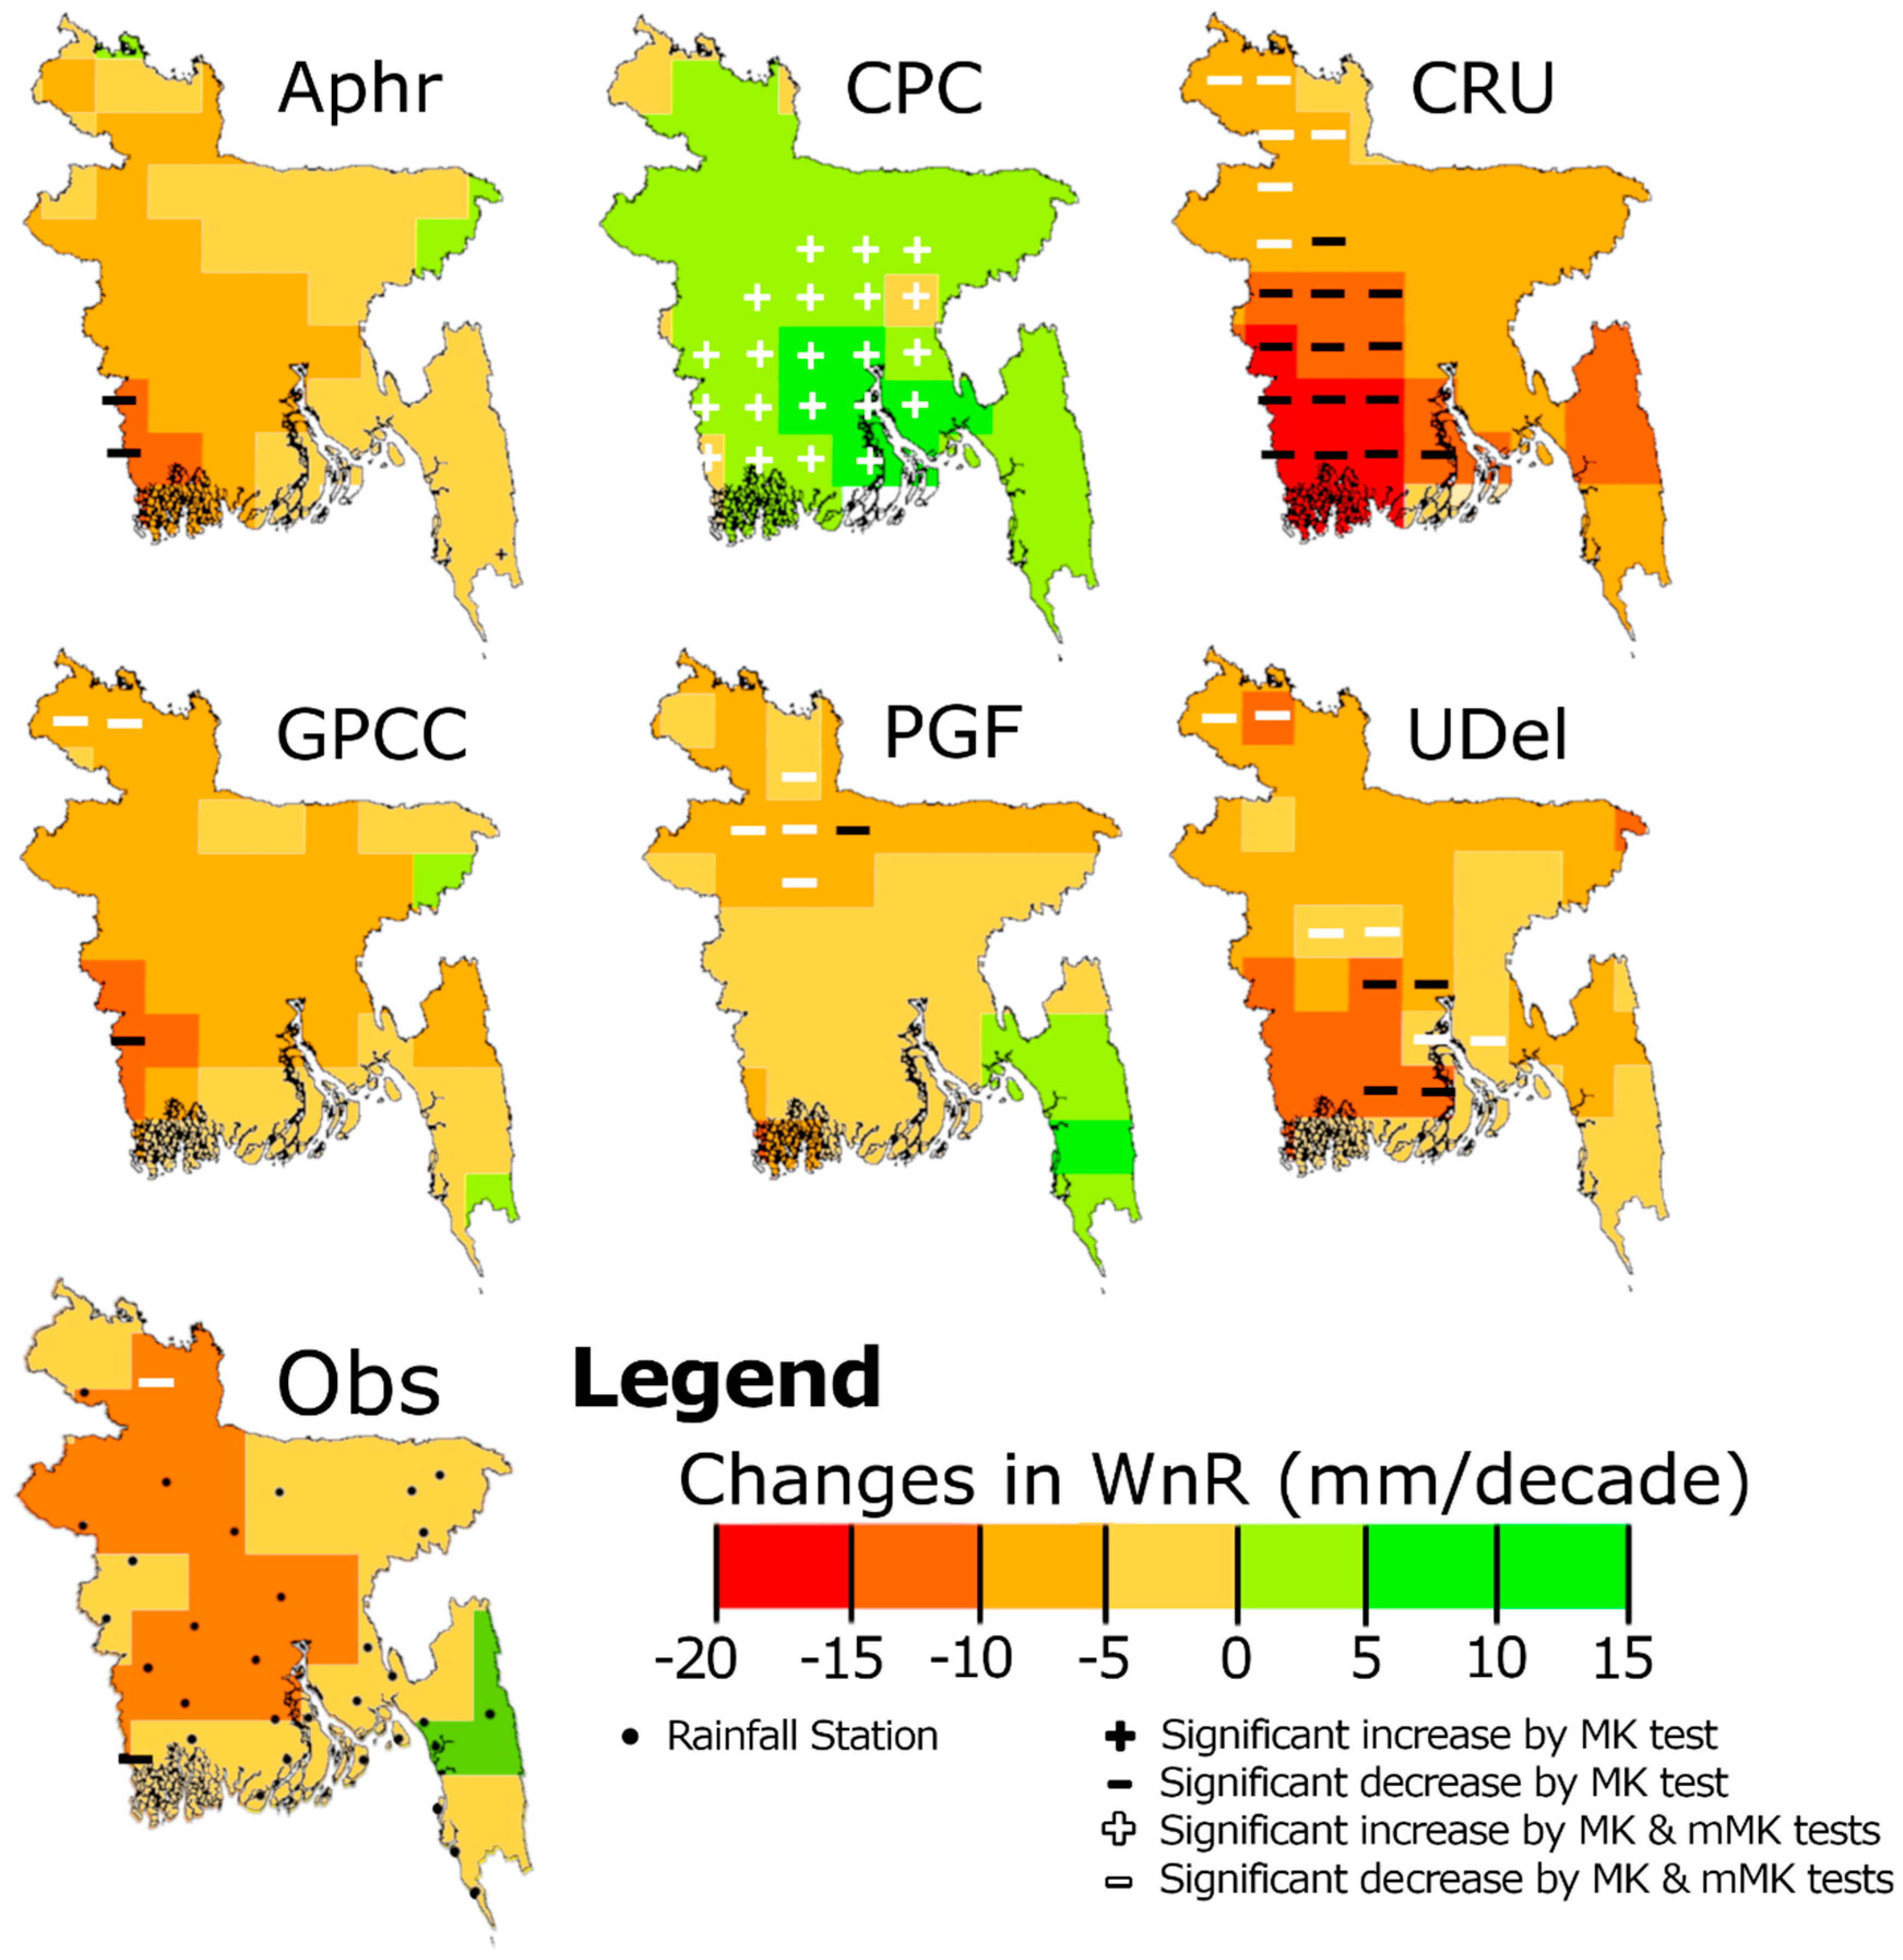
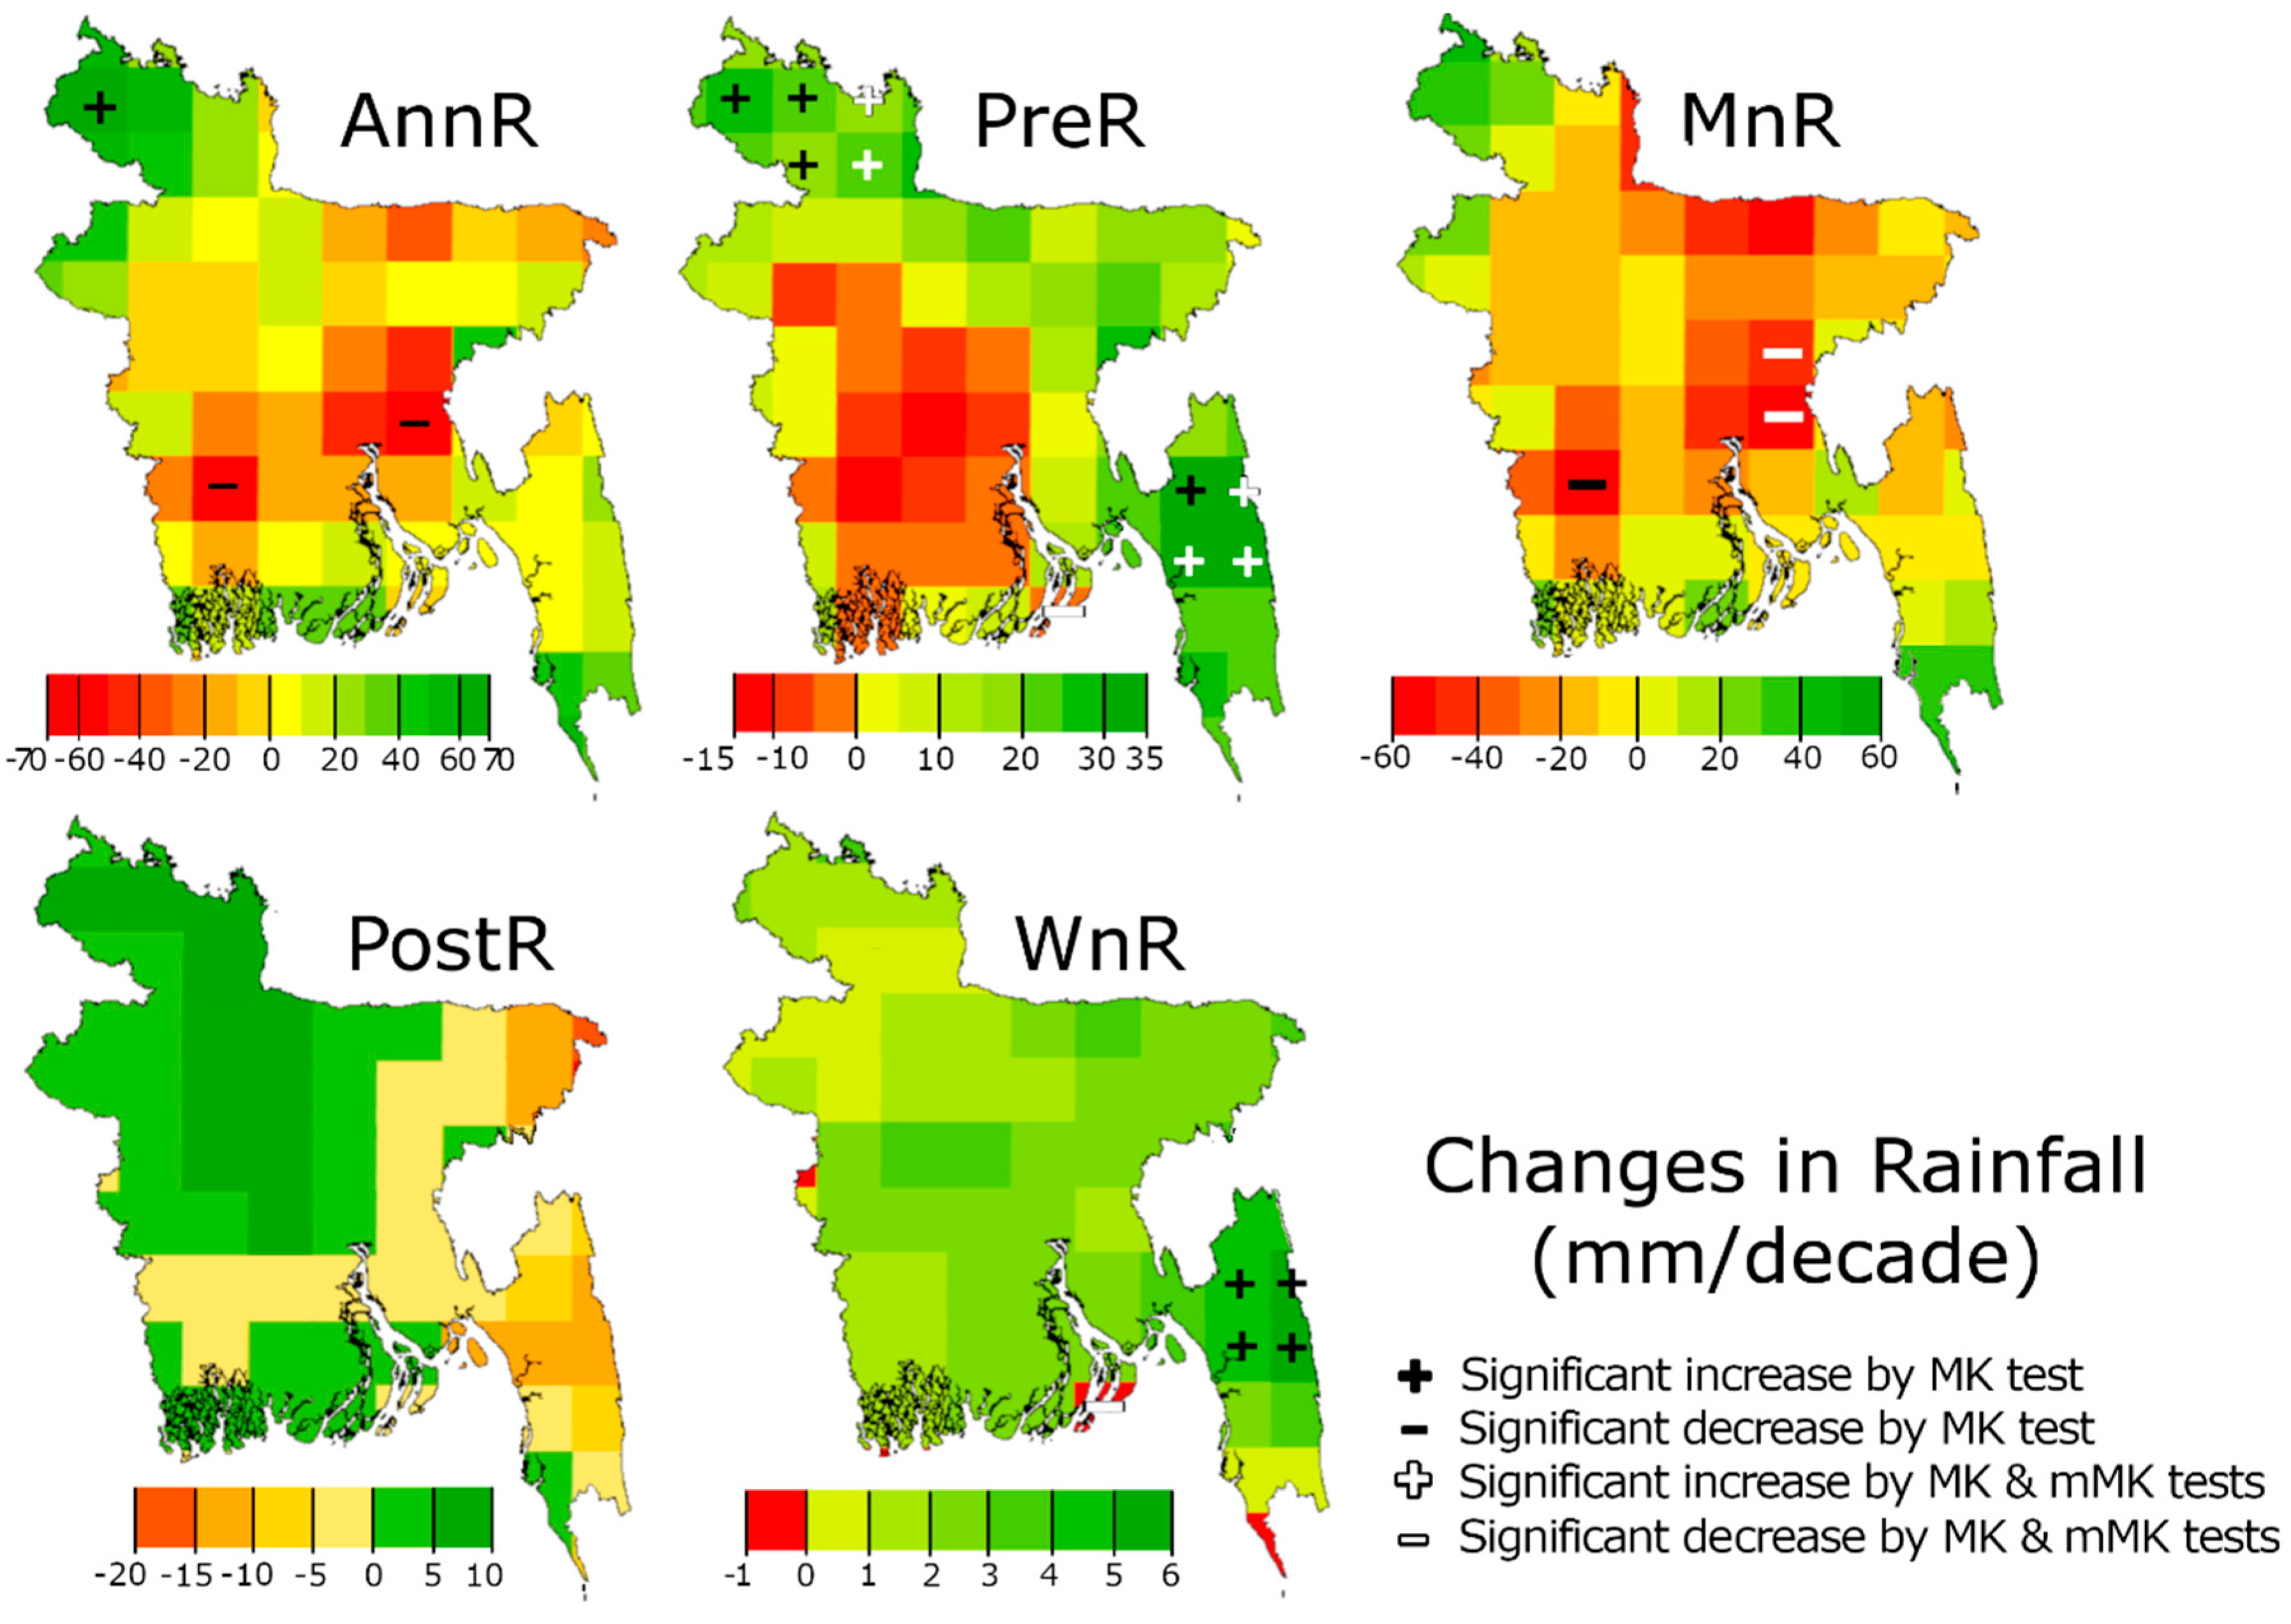
The spatial distribution of the changes in annual rainfall in Bangladesh obtained using different gridded data and observed data is shown in Figure 8. The colour gradients of the maps in Figure 8 represent the Sen’s slopes and the signs (positive or negative) represent the significance of trends at a 95% level of confidence at the grid/station location. The black signs represent significance in trend estimated by MK test while the white signs represent the significance of trend estimated by MK and mMK. Table 3 represents the percentage of areal coverage where different gridded data products showed a significant change in rainfall at a 95% level of confidence.
The spatial distribution of Sen’s slope in annual rainfall (Figure 8) showed negative values (0 to −183 mm/decade) in most parts of Bangladesh. A significant decrease in annual rainfall was observed at two stations (Chandpur and Faridpur) by both MK and mMK tests and a significant increase at two stations (Teknaf and Khepupara) by only MK test at a 95% level of confidence. None of the gridded rainfall data showed exactly the same spatial distribution of Sen’s slope obtained using observed data. However, GPCC showed a significant positive trend in annual rainfall in the southwest corner of the country (216 mm/decade) and negative trends in the south-central region (−183 mm/decade) where positive and negative trends were detected using observed data. The CPC showed a significant increase in annual rainfall in most of the country, while CRU and PGF showed no change at any grid point over Bangladesh.
The spatial distributions of the trends in pre-monsoon rainfall are shown in Figure 9. Overall, the Sen’s slope estimated negative changes (−31 to −121 mm/decade) in pre-monsoon rainfall in the centre region and positive changes (93 mm/decade) in the southeast of Bangladesh. Trend analysis results showed that the Sen’s slopes estimated using observed data were significant only at a few grid points in the central and south-central regions (negative) and mountainous southeast corner (positive). A very similar result was obtained using GPCC, which showed negative trends in pre-monsoon rainfall in the central region and positive trends in the southeast corner. However, GPCC showed negative trends at more grid points in the central region compared to that obtained using observed data. On the contrary, CRU showed a negative trend for both MK and mMK tests in the southeast corner. CPC showed no change in the central region, however showed increases in pre-monsoon rainfall in the northeast and southeast.
The spatial distributions of trends in monsoon rainfall are presented in Figure 10. The Sen’s slope estimated for monsoon rainfall using observational data showed negative slopes (0 to −81 mm/decade) in most parts of Bangladesh, except at a few locations in the southeast, northeast, and northwest. Trend analysis results obtained using MK and mMK tests revealed that the slopes were not significant at any of the stations. Among the six gridded data, only GPCC showed no significant trend in monsoon rainfall at any grid point, while the others showed increasing/decreasing trends in different parts. CPC showed an increase in rainfall in most parts of the country, APHRODITE showed a significant increase in the southeast, CRU showed a decrease in the northeast, PGF showed a decrease in the north, and UDel showed a decrease at three grid points in the central region. The results revealed highly contradictory results in the trends of monsoon rainfall, which shares a major portion of annual total rainfall in the country.
The spatial distributions of the Sen’s slopes estimated for post-monsoon rainfall are presented in Figure 11. The spatial distribution of slopes obtained using GPCC and APHRODITE was found to be consistent with that obtained using observed data. A significant increasing trend in post-monsoon rainfall was found only at two stations located in the southern coastal region using the mMK test. Only GPCC was found to replicate the spatial distribution of the observed trend in post-monsoon rainfall. GPCC also showed a significant increasing trend at two grid points near to those observed stations but only one using the mMK test and another using the MK test. A large variation in trends was found for other data products. The CPC showed an increase in post-monsoon rainfall over the whole country except in the southeast. The increase was found to be significant for most of the grid points by the MK test and in the central and southern areas for the mMK test. APHRODITE also showed a significant increase in the southern coastal region and the north of Bangladesh. CRU showed no significant change at any grid point, while UDel showed a decrease at a few grid points in the central and southern regions, where APHRODITE and PGF showed an increase. The results clearly indicate large variability in the spatial pattern of post-monsoon rainfall trends obtained using different gridded data products.
Compared to other seasons, better consistency in rainfall changes among the gridded data was observed for winter (Figure 12). Nevertheless, a large variation was noticed in the patterns of significant trends. CRU showed a significant decrease in winter rainfall mostly in the southwest, UDel in the south-central region, and PGF in the north, while APHRODITE showed almost no changes and CPC showed an increase in the whole central and southern regions. Station data showed a decrease in winter rainfall only at two stations, one located in the north and the other in the southwest, which was found to match better with APHRODITE and GPCC. GPCC showed an increase in winter rainfall at two grid points, one in the north and the other in the southwest, while APHRODITE showed a decrease in rainfall at two grid points in the southwest.
The JSI was calculated for Sen’s slope maps prepared for each gridded data against the observed data at 0.5° resolution (Figure 6, Figure 7, Figure 8, Figure 9 and Figure 10). The results (Table 4) showed more similarly of the GPCC map with the observed map for annual and all seasonal rainfall except pre-monsoon. The JSI was found to be 22%, 21%, 80%, and 22% for annual, monsoon, post-monsoon, and winter rainfall for GPCC. APHRODITE was found to be more similar for pre-monsoon rainfall. However, it was found to score zero for annual rainfall.
The results of the three statistical indices used to assess the spatial similarity are presents in Table 5. The statistical indices were calculated between the slopes estimated from interpolated observed data and gridded data at all the grid points to assess the spatial similarity in slopes. The Pbias of the Sen’s slopes estimated for GPCC at different grid points was found to be very near to zero for annual and all seasonal rainfall expect post-monsoon, for which UDel was found to outperform the GPCC. For the monsoon, all the products were found to overestimate the rate of change, while in winter all of them were found to underestimate the change. Also, GPCC obtained the highest score of md for all the seasons except post-monsoon. The md for post-monsoon was highest for APHRODITE (0.4) while it was second-highest (0.39) for GPCC. In the case of SS, GPCC was found to be best at replicating the PDF of annual and all seasonal rainfall trends. Overall, the results revealed the ability of GPCC to generate the most accurate rainfall slopes and trends in Bangladesh.
Though GPCC was found to be most suitable in estimating rainfall changes and trends in Bangladesh; the statistical scores of GPCC for winter were very low (Pbias −552.6%, md = 0.05, SS = −0.26). The winter rainfall in Bangladesh accounts for only 3% of the total annual rainfall. In some years, it is 0 at some stations. Therefore, a small deviation in winter rainfall between observed and GPCC caused a large variation in bias and other statistics. The mean winter rainfall in Bangladesh is 27 mm, whereas the GPCC estimated the mean winter rainfall as 4.89 mm; thus, the Pbias is −552.6%.
Table 6 shows the POD score for different gridded data for annual and seasonal rainfall trends. POD was estimated based only on the ability of gridded data to detect the sign of significant trend (positive and negative) and no trend in observed data. Changes in other grid points where no station data was available were not taken into consideration during the computation of POD. Overall, PODs of all products were found to be above 0.5, except for CPC, in detecting trends in annual and post-monsoon (0.44 and 0.35, respectively) rainfall using the MK test. GPCC showed the highest POD, which indicates its capability of accurate detection of trends in annual and seasonal rainfall expect for pre-monsoon. The POD of GPCC in detecting monsoon and post-monsoon rainfall trends using the MK test was 1, while annual, pre-monsoon, and winter rainfall were 0.88, 0.82, and 0.94, respectively. The POD of APHRODITE was the highest in detecting trends in pre-monsoon rainfall using both the MK and mMK tests. However, PGF can be considered as the second best in terms of POD, and the CPC as the worst in detecting trends using the MK test and the UDel using mMK.
6. Discussion
Though Bangladesh is relatively small in area, rainfall in the country varies widely from the west to the east. Therefore, the country receives a different amount of rainfall in different geographical regions. Changes in rainfall could have different impacts in different climatic regions. For example, a decrease in rainfall in the northwest low-rainfall region can increase the severity of existing water scarcity, while an increase in rainfall in the northeast high-rainfall region can increase the probability of more extreme rainfall events and floods. Therefore, a reliable estimation of the spatial pattern of the changes in rainfall is very important for the country for climate change impact assessment and mitigation planning.
The lack of long-term high-quality data from many sites is a major problem for the spatiotemporal assessment of the changes in the climate of Bangladesh. Gridded data has been used in recent years in several studies for the analysis of hydro-climatic changes in Bangladesh and nearby countries [51]. The present study revealed large uncertainty associated with different gridded climate data in replicating the spatial pattern of such changes. The study revealed that gridded climate data should be assessed properly in respect to observed data based on the purpose of the study.
Many factors influence the performance of gridded rainfall data in a certain region, including the number and distribution of gauges used, the quality and homogeneity of collected data, and the interpolation method used. In the present study, GPCC data was found to be better at replicating monthly rainfall compared to other data products used in terms of all statistical measures used. One of the major causes of the better accuracy of GPCC data is the use of relatively more gauge data during data interpolation. The smart interpolation is used for the development of GPCC data, which considers the elevation of gauges while estimating the gridded data, and consequently enhances the interpolation accuracy. Furthermore, observation data used in GPCC were inspected through a series of automatic statistical and visual quality checks to ensure the reliability of extreme outliers in the collected data. Schneider et al. [52] validated GPCC over several topography terrains in reproducing precipitation amount and pattern worldwide. GPCC data are also used in the ground bias correction of the latest remote-sensing rainfall estimate, Integrated Multi-satellitE Retrievals for GPM (IMERG) [53]. Those factors probably made GPCC more reliable than other gridded datasets.
Several studies have revealed GPCC to be the most suitable rainfall dataset in neighbouring countries of Bangladesh [54,55]. For instance, Prakash et al. [54] compared the performance of four gauge-based land-only rainfall products with the Indian Meteorological Department gridded rainfall dataset and reported that APHRODITE and GPCC rainfall showed the highest scores in term of different skill indices compared to other rainfall products. Additionally, Kishore et al. [55] investigated the features of Indian rainfall using reanalysis and gauge datasets and found that GPCC has a high degree of similar characteristics.
The GPCC data was used for the assessment of long-term trends (1901–2017) in annual and seasonal rainfall in Bangladesh using the MK and mMK tests. The spatial patterns of trends using both tests are presented in Figure 13. The trend in annual rainfall showed an increase at a point in the north and decrease at two points in the south, while the mMK test showed no change in annual rainfall at any locations in Bangladesh. This result indicates that the annual rainfall trend estimated at the three grid points in Bangladesh by the MK test may be due to its insensitivity to natural variability of climate. Using similar analysis, it was observed that the pre-monsoon rainfall in Bangladesh is increasing at two grid points in the north and at three grid points in the southwest mountainous region. Monsoon rainfall was found to decrease significantly at two grid points in the central-west region. The winter rainfall was found to increase in the southeast, while the pre-monsoon rainfall was not found to change at any locations by the mMK test.
7. Conclusions
The spatial pattern in rainfall trends in Bangladesh was assessed using six gridded rainfall data, namely APHRODITE, CPC, CRU, GPCC, PGF, and UDel, in order to understand the uncertainty in results. The results revealed a large variation in the spatial pattern of the trends in annual and seasonal rainfall. Determining the spatial pattern in rainfall trends is vital for climate change impact assessment and adaptation planning. The use of gridded climate data without proper validations can be misleading regarding the understanding of climate change impacts. The ability of gridded data to replicate the mean and variability of rainfall is not sufficient to use it for any hydro-climatic studies. The gridded data should be validated according to their ability to replicate the phenomena for which they are to be used.
The results of the present study revealed a better performance of GPCC over other gridded rainfall data used in this study in estimating monthly observations and in the assessment of rainfall trends in Bangladesh. However, large differences were still observed in annual and seasonal trend distributions between the GPCC and observed rainfall maps. The long-term trend analysis of rainfall using GPCC revealed no change in annual and post-monsoon rainfall, increase in pre-monsoon rainfall at a few grids in the north and southeast regions, decrease in monsoon rainfall in the central-west region, and increase in winter rainfall in the southeast region. It is expected that the findings of this study will help to understand the uncertainty in the spatial pattern of the trends estimated using gridded climate data. The results of long-term rainfall trend analysis can be helpful for understanding the impacts of climate change and necessary mitigation planning for Bangladesh.
Author Contributions
Conceptualization, and analysis, M.S.N., S.S., and X.W; original draft preparation, M.S.N., S.S., and X.W; review and writing the final draft M.S.N., S.S., and X.W.
Funding
We are grateful to the Young Top-Notch Talent Support Program of National High-Level Talents Special Support Plan for providing financial support for this research.
Acknowledgements
We are thankful to anonymous reviewers and editors for their helpful comments and suggestions.
Conflicts of Interest
The authors declare no conflict of interest.
References
- Ahmed, K.; Shahid, S.; Chung, E.S.; Ismail, T.; Wang, X.J. Spatial distribution of secular trends in annual and seasonal precipitation over Pakistan. Clim. Res. 2017, 74, 95–107. [Google Scholar] [CrossRef]
- Khan, N.; Shahid, S.; Ismail, T.B.; Wang, X.J. Spatial distribution of unidirectional trends in temperature and temperature extremes in Pakistan. Theor. Appl. Climatol. 2018. [Google Scholar] [CrossRef]
- Nashwan, M.S.; Shahid, S. Spatial distribution of unidirectional trends in climate and weather extremes in Nile River Basin. Theor. Appl. Climatol. 2018. [Google Scholar] [CrossRef]
- WMO. WMO Statement on the Status of the Global Climate in 2016; World Meteorological Organization: Geneva, Switzerland, 2017; Volume 1189, p. 25. [Google Scholar]
- Salman, S.A.; Shahid, S.; Ismail, T.; Rahman, N.B.A.; Wang, X.; Chung, E.S. Unidirectional trends in daily rainfall extremes of Iraq. Theor. Appl. Climatol. 2017. [Google Scholar] [CrossRef]
- Nashwan, M.S.; Shahid, S.; Abd Rahim, N. Unidirectional trends in annual and seasonal climate and extremes in Egypt. Theor. Appl. Climatol. 2018. [Google Scholar] [CrossRef]
- Ahmed, K.; Shahid, S.; Ali, R.; Harun, S.; Wang, X. Evaluation of the performance of gridded precipitation products over Balochistan province, Pakistan. Desalination 2017, 1, 14. [Google Scholar] [CrossRef]
- Shiru, M.; Shahid, S.; Alias, N.; Chung, E.-S. Trend analysis of droughts during crop growing seasons of Nigeria. Sustainability 2018, 10, 871. [Google Scholar] [CrossRef]
- Nashwan, M.S.; Shahid, S.; Chung, E.-S.; Ahmed, K.; Song, Y.H. Development of climate-based index for hydrologic hazard susceptibility. Sustainability 2018, 10, 2182. [Google Scholar] [CrossRef]
- Salman, S.A.; Shahid, S.; Ismail, T.; Al-Abadi, A.M.; Wang, X.-J.; Chung, E.-S. Selection of gridded precipitation data for iraq using compromise programming. Measurement 2019, 132, 87–98. [Google Scholar] [CrossRef]
- Shahid, S. Recent trends in the climate of Bangladesh. Clim. Res. 2010, 42, 185–193. [Google Scholar] [CrossRef] [Green Version]
- Shahid, S. Probable impacts of climate change on public health in Bangladesh. Asia-Pac. J. Public Health 2010, 22, 310–319. [Google Scholar] [CrossRef]
- Gain, A.K.; Mondal, M.S.; Rahman, R. From flood control to water management: A journey of Bangladesh towards integrated water resources management. Water 2017, 9, 55. [Google Scholar] [CrossRef]
- Nashwan, M.S.; Ismail, T.; Ahmed, K. Flood susceptibility assessment in Kelantan river basin using copula. Int. J. Eng Technol. 2018, 7, 584–590. [Google Scholar]
- Rahman, M.; Salehin, M.; Matsumoto, J. Trends of monsoon rainfall pattern in Bangladesh. Bangladesh J. Water Resour. 1997, 14, 121–138. [Google Scholar]
- Singh, O.P. Cause-effect relationships between sea surface temperature, precipitation and sea level along the Bangladesh coast. Theor. Appl. Climatol. 2001, 68, 233–243. [Google Scholar] [CrossRef]
- Hossain, M.; Roy, K.; Datta, D. Spatial and temporal variability of rainfall over the south-west coast of Bangladesh. Climate 2014, 2, 28–46. [Google Scholar] [CrossRef]
- Shahid, S. Rainfall variability and the trends of wet and dry periods in Bangladesh. Int. J. Climatol. 2010, 30, 2299–2313. [Google Scholar] [CrossRef] [Green Version]
- Shahid, S. Trends in extreme rainfall events of Bangladesh. Theor. Appl. Climatol. 2011, 104, 489–499. [Google Scholar] [CrossRef]
- Shahid, S.; Wang, X.J.; Harun, S. Unidirectional trends in rainfall and temperature of Bangladesh. In Hydrology in a Changing World, Proceedings of the FRIEND, Montpellier, France, 7–10 October 2014; IAHS Press: Montpellier, France, 2014; pp. 177–182. [Google Scholar]
- Endo, N.; Matsumoto, J.; Hayashi, T.; Terao, T.; Murata, F.; Kiguchi, M.; Yamane, Y.; Alam, M.S. Trends in precipitation characteristics in Bangladesh from 1950 to 2008. SOLA 2015, 11, 113–117. [Google Scholar] [CrossRef]
- Sheikh, M.M.; Manzoor, N.; Ashraf, J.; Adnan, M.; Collins, D.; Hameed, S.; Manton, M.J.; Ahmed, A.U.; Baidya, S.K.; Borgaonkar, H.P.; et al. Trends in extreme daily rainfall and temperature indices over South Asia. Int. J. Climatol. 2015, 35, 1625–1637. [Google Scholar] [CrossRef]
- Wang, X.L.; Feng, Y. Rhtestsv3 User Manual; Climate Research Division, Atmospheric Science and Technology Directorate, Science and Technology Branch, Environment Canada: Gatineau, QC, Canada, 2010; p. 24. [Google Scholar]
- Bari, S.H.; Rahman, M.T.U.; Hoque, M.A.; Hussain, M.M. Analysis of seasonal and annual rainfall trends in the northern region of Bangladesh. Atmos. Res. 2016, 176, 148–158. [Google Scholar] [CrossRef]
- Nury, A.H.; Hasan, K.; Mohammed Erfan, K.; Chandra Dey, D. Analysis of spatially and temporally varying precipitation in Bangladesh. Asian J. Water Environ. Pollut. 2016, 13, 15–27. [Google Scholar] [CrossRef]
- Mullick, M.R.A.; Nur, R.M.; Alam, M.J.; Islam, K.M.A. Observed trends in temperature and rainfall in bangladesh using pre-whitening approach. Glob. Planet. Chang. 2019, 172, 104–113. [Google Scholar] [CrossRef]
- Yue, S.; Wang, C.Y. Applicability of prewhitening to eliminate the influence of serial correlation on the Mann-Kendall test. Water Resour. Res. 2002, 38. [Google Scholar] [CrossRef]
- Syed, Z.H.; Choi, G.; Byeon, S. A numerical approach to predict water levels in ungauged regions—Case study of the meghna river estuary, Bangladesh. Water 2018, 10, 110. [Google Scholar] [CrossRef]
- Curtis, S.; Crawford, T.; Rahman, M.; Paul, B.; Miah, M.G.; Islam, M.R.; Patel, M. A hydroclimatological analysis of precipitation in the Ganges-Brahmaputra-Meghna river basin. Water 2018, 10, 1359. [Google Scholar] [CrossRef]
- Shahid, S. Spatial and temporal characteristics of droughts in the western part of Bangladesh. Hydrol. Process. 2008, 22, 2235–2247. [Google Scholar] [CrossRef]
- Kohler, M.A. On the use of double-mass analysis for testing the consistency of meteorological records and for making required adjustments. Bull. Am. Meteorol. Soc. 1949, 30, 188–189. [Google Scholar] [CrossRef]
- Panofsky, H.A.; Brier, G.W. Some Applications of Statistics to Meteorology; Mineral Industries Extension Services; College of Mineral Industries; Pennsylvania State University: State College, PA, USA, 1958. [Google Scholar]
- Ahmed, K.; Shahid, S.; Wang, X.; Nawaz, N.; Khan, N. Evaluation of gridded precipitation datasets over arid regions of Pakistan. Water 2019, 11, 210. [Google Scholar] [CrossRef]
- Mahmoud, M.T.; Al-Zahrani, M.A.; Sharif, H.O. Assessment of global precipitation measurement satellite products over Saudi Arabia. J. Hydrol. 2018, 559, 1–12. [Google Scholar] [CrossRef]
- Gupta, H.V.; Kling, H.; Yilmaz, K.K.; Martinez, G.F. Decomposition of the mean squared error and NSE performance criteria: Implications for improving hydrological modelling. J. Hydrol. 2009, 377, 80–91. [Google Scholar] [CrossRef] [Green Version]
- Willmott, C.J. On the validation of models. Phys. Geogr. 2013, 2, 184–194. [Google Scholar] [CrossRef]
- Perkins, S.E.; Pitman, A.J.; Holbrook, N.J.; McAneney, J. Evaluation of the AR4 climate models’ simulated daily maximum temperature, minimum temperature, and precipitation over Australia using probability density functions. J. Clim. 2007, 20, 4356–4376. [Google Scholar] [CrossRef]
- Sen, P.K. Estimates of the regression coefficient based on Kendall’s tau. J. Am. Stat. Assoc. 1968, 63, 1379–1389. [Google Scholar] [CrossRef]
- Mann, H.B. Nonparametric tests against trend. Econometrica 1945, 13, 245–259. [Google Scholar] [CrossRef]
- Kendall, M.G. Rank correlation Methods; Hafner Publishing Co.: Oxford, UK, 1948. [Google Scholar]
- Hamed, K.H. Exact distribution of the Mann-Kendall trend test statistic for persistent data. J. Hydrol. 2009, 365, 86–94. [Google Scholar] [CrossRef]
- Hamed, K.H. Trend detection in hydrologic data: The Mann-Kendall trend test under the scaling hypothesis. J. Hydrol. 2008, 349, 350–363. [Google Scholar] [CrossRef]
- Yue, S.; Wang, C. The mann-kendall test modified by effective sample size to detect trend in serially correlated hydrological series. Water Resour. Manag. 2004, 18, 201–218. [Google Scholar] [CrossRef]
- Koutsoyiannis, D.; Montanari, A. Statistical analysis of hydroclimatic time series: Uncertainty and insights. Water Resour. Res. 2007, 43. [Google Scholar] [CrossRef] [Green Version]
- Kumar, S.; Merwade, V.; Kam, J.; Thurner, K. Streamflow trends in Indiana: Effects of long term persistence, precipitation and subsurface drains. J. Hydrol. 2009, 374, 171–183. [Google Scholar] [CrossRef]
- Lacombe, G.; Hoanh, C.T.; Smakhtin, V. Multi-year variability or unidirectional trends? Mapping long-term precipitation and temperature changes in continental southeast Asia using precis regional climate model. Clim. Chang. 2012, 113, 285–299. [Google Scholar] [CrossRef]
- Jaccard, P. Nouvelles researches sur la distribution florale. Bull. Soc. Vaud. Sci. Nat. 1908, 44, 223–270. [Google Scholar]
- Jaccard, P. The distribution of the flora in the alpine zone. New Phytol. 1912, 11, 37–50. [Google Scholar] [CrossRef]
- Yin, Y.; Yasuda, K. Similarity coefficient methods applied to the cell formation problem: A comparative investigation. Comput. Ind. Eng. 2005, 48, 471–489. [Google Scholar] [CrossRef]
- Johnson, F.; Westra, S.; Sharma, A.; Pitman, A.J. An assessment of GCM skill in simulating persistence across multiple time scales. J. Clim. 2011, 24, 3609–3623. [Google Scholar] [CrossRef]
- Pour, S.H.; Shahid, S.; Chung, E.-S.; Wang, X.-J. Model output statistics downscaling using support vector machine for the projection of spatial and temporal changes in rainfall of Bangladesh. Atmos. Res. 2018, 213, 149–162. [Google Scholar] [CrossRef]
- Schneider, U.; Becker, A.; Finger, P.; Meyer-Christoffer, A.; Ziese, M.; Rudolf, B. GPCC’s new land surface precipitation climatology based on quality-controlled in situ data and its role in quantifying the global water cycle. Theor. Appl. Climatol. 2014, 115, 15–40. [Google Scholar] [CrossRef]
- Hou, A.Y.; Kakar, R.K.; Neeck, S.; Azarbarzin, A.A.; Kummerow, C.D.; Kojima, M.; Oki, R.; Nakamura, K.; Iguchi, T. The global precipitation measurement mission. Bull. Am. Meteorol. Soc. 2014, 95, 701–722. [Google Scholar] [CrossRef]
- Prakash, S.; Mitra, A.K.; Momin, I.M.; Rajagopal, E.N.; Basu, S.; Collins, M.; Turner, A.G.; Achuta Rao, K.; Ashok, K. Seasonal intercomparison of observational rainfall datasets over India during the southwest monsoon season. Int. J. Climatol. 2015, 35, 2326–2338. [Google Scholar] [CrossRef]
- Kishore, P.; Jyothi, S.; Basha, G.; Rao, S.; Rajeevan, M.; Velicogna, I.; Sutterley, T.C. Precipitation climatology over india: Validation with observations and reanalysis datasets and spatial trends. Clim. Dyn. 2016, 46, 541–556. [Google Scholar] [CrossRef]
Figure 1.
Geographical map of Bangladesh showing ground elevation obtained using Advanced Spaceborne Thermal Emission and Reflection Radiometer (ASTER) Global Digital Elevation Model (GDEM) and rainfall gauge locations.
Figure 1.
Geographical map of Bangladesh showing ground elevation obtained using Advanced Spaceborne Thermal Emission and Reflection Radiometer (ASTER) Global Digital Elevation Model (GDEM) and rainfall gauge locations.

Figure 2.
Spatial distribution of average annual rainfall in Bangladesh during 1979–2010 obtained using different gridded and interpolated observed (Obs) rainfall data at a resolution of 0.5° × 0.5°.
Figure 2.
Spatial distribution of average annual rainfall in Bangladesh during 1979–2010 obtained using different gridded and interpolated observed (Obs) rainfall data at a resolution of 0.5° × 0.5°.

Figure 3.
Flowchart of the methodology used in this study.

Figure 4.
Box plots of the four indices—(a) Root-Mean-Square Error (RMSE), (b) Kling–Gupta Efficiency (KGE), (c) modified index of agreement (md), and (d) Skill Score (SS)—used to evaluate the performance of monthly gridded rainfall data against observed rainfall data recorded at 34 locations distributed over Bangladesh during 1979–2010 using the grid-to-grid comparison method.

Figure 5.
Box plots of the four indices—(a) RMSE, (b) KGE, (c) md, and (d) SS—used to evaluate the performance of monthly gridded rainfall data against observed rainfall data recorded at 34 locations distributed over Bangladesh during 1979–2010 using point-to-point comparison method.
Figure 5.
Box plots of the four indices—(a) RMSE, (b) KGE, (c) md, and (d) SS—used to evaluate the performance of monthly gridded rainfall data against observed rainfall data recorded at 34 locations distributed over Bangladesh during 1979–2010 using point-to-point comparison method.

Figure 6.
Plots of the autocorrelation function of the annual rainfall of Bangladesh for the period 1979–2010 at: (a) Bogra, in the north; and (b) Khulna, in the south.
Figure 6.
Plots of the autocorrelation function of the annual rainfall of Bangladesh for the period 1979–2010 at: (a) Bogra, in the north; and (b) Khulna, in the south.

Figure 7.
The fourth-level decomposition of the annual rainfall data for Bogra (black) and Khulna (red), which revealed the presence of multi-decadal variability with a cycle of nearly 20 years.
Figure 7.
The fourth-level decomposition of the annual rainfall data for Bogra (black) and Khulna (red), which revealed the presence of multi-decadal variability with a cycle of nearly 20 years.

Figure 8.
Trends in annual rainfall (AnnR) in Bangladesh during 1979–2010.

Figure 9.
Trends in pre-monsoon rainfall (PreR) in Bangladesh during 1979–2010.

Figure 10.
Trends in monsoon rainfall (MnR) in Bangladesh during 1979–2010.

Figure 11.
Trends in post-monsoon rainfall (PostR) in Bangladesh during 1979–2010.

Figure 12.
Trends in winter rainfall (WnR) in Bangladesh during 1979–2010.

Figure 13.
Spatial distribution of long-term trends (1901–2017) in annual and seasonal rainfall in Bangladesh obtained using Global Precipitation Climatology Centre (GPCC) data.
Figure 13.
Spatial distribution of long-term trends (1901–2017) in annual and seasonal rainfall in Bangladesh obtained using Global Precipitation Climatology Centre (GPCC) data.


Table 1.
Summary of recent studies on rainfall trend in Bangladesh.
| Study | Study Timeframe | Study Period | Data Type | Quality Control of Data | Trend Analysis Method | Major Findings |
|---|---|---|---|---|---|---|
| Rahman et al. [15] | Monsoon | - | Gauge | - | MK test | Southeast rainfall pattern was changing, no change was found in monsoon rainfall pattern |
| Singh [16] | Monsoon | 1961–1991 | Gauge | Not mentioned | Least squares method | Monsoon rainfall increased, with the highest increase in September then July |
| Hossain et al. [17] | Seasonal | 1948–2007 | Gauge | Daily missing data were filled using a simple averaging | Sen’s slope, MK test, and linear regression | Post-monsoon and winter rainfall had significant positive trends, pre-monsoon and monsoon rainfall had no significant trend |
| Shahid [18] | Annual and seasonal | 1958–2007 | Gauge | A total of 17 stations with missing data ≤2%. The standard normal homogeneity test used | Sen’s slope and MK test | Annual and pre-monsoon precipitation increased, no trend in monsoon, post-monsoon, and winter rainfalls |
| Shahid [19] | Annual and seasonal | 1958–2007 | Gauge | Double mass curve and the Student’s t test | Sen’s slope and MK test | An increasing trend in extreme precipitation indices |
| Shahid et al. [20] | Annual and seasonal | 1958–2007 | Gauge | Double mass curve and the Student’s t test | Sen’s slope and mMK | After removing the scaling effect, annual rainfall increased in North Bangladesh, and increase in pre-monsoon period |
| Endo et al. [21] | Seasonal | 1950–2008 | Gauge | Missing data <10%, except monsoon filled and the standard normal homogeneity tests used | Mann–Kendall’s tau test | Trends in monsoon and post-monsoon were not significant |
| Sheikh et al. [22] | Annual | 1961–2000 | Gauge | RHTest software [23] used to fill missing data | Mann–Whitney and MK tests | An increasing trend of annual rainfall |
| Bari et al. [24] | Annual and seasonal | 1964–2013 | Gauge | Months with missing days discarded and years having missing data ≥20% omitted | Sen’s slope, MK, sequential Mann–Kendall tests | Pre-monsoon and post-monsoon rainfall were increasing, annual and monsoon rainfall showed a decreasing trend |
| Nury et al. [25] | Monthly | 1975–2012 | Gauge | Not mentioned | Sen’s slope and MK test | Southeast of Bangladesh had the highest increasing trend, while the northwest had the lowest. |
| Mullick et al. [26] | Annual and seasonal | 1966–2015 | Gauge | Not mentioned | Yue and Wang [27]’s version of MK test | Annual, pre-monsoon, monsoon, and post-monsoon rainfall had a positive trend in most of the stations used |
Table 2.
Summary of the gridded rainfall datasets evaluated in the present study.
| Dataset | Spatial Resolution | Temporal Resolution | Available Time Span | Data Sources |
|---|---|---|---|---|
| APHRODITE | 0.25° | Daily | 1951–2010 | GTS, National and International Agencies |
| CPC | 0.5° | Daily | 1979–2017 | NOAA and GTS |
| CRU | 0.5° | Monthly | 1901–2016 | WMO and NOAA |
| GPCC | 0.5° | Monthly | 1901–2017 | GTS, climate reports and synoptic weather reports |
| UDel | 0.5° | Monthly | 1900–2014 | GHCN2 GHCN-Daily, GSOD, NCAR |
| PGF | 0.25° | Daily | 1948–2010 | NCEP, NCAR, and global observed data |
GTS: Global Telecommunication System network; NOAA: National Oceanic and Atmospheric Administration; WMO: World Meteorological Organization; GHCN: Global Historical Climatology Network; GSOD: Global Summary of Day; NCEP: National Centers for Environmental Prediction; NCAR: National Center for Atmospheric Research.
Table 3.
Percentage of the area where gridded data showed significant positive (+ve) or negative (−ve) change in annual and seasonal rainfall using the Mann–Kendall (MK) and modified MK (mMK) tests during 1979–2010.
Table 3.
Percentage of the area where gridded data showed significant positive (+ve) or negative (−ve) change in annual and seasonal rainfall using the Mann–Kendall (MK) and modified MK (mMK) tests during 1979–2010.
| Method | Gridded Dataset | Area (%) | |||||||||
|---|---|---|---|---|---|---|---|---|---|---|---|
| Annual | Pre-Monsoon | Monsoon | Post-Monsoon | Winter | |||||||
| +ve | −ve | +ve | −ve | +ve | −ve | +ve | −ve | +ve | −ve | ||
| MK | APHRODITE | 9.5 | 0.0 | 2.7 | 1.4 | 5.4 | 0.0 | 16.2 | 0.0 | 0.0 | 2.7 |
| CPC | 43.2 | 0.0 | 10.8 | 0.0 | 31.1 | 0.0 | 50.0 | 0.0 | 29.7 | 0.0 | |
| CRU | 0.0 | 0.0 | 0.0 | 5.4 | 0.0 | 5.4 | 0.0 | 0.0 | 0.0 | 27.0 | |
| GPCC | 1.4 | 2.7 | 1.4 | 10.8 | 0.0 | 0.0 | 2.7 | 0.0 | 0.0 | 4.1 | |
| PGF | 0.0 | 0.0 | 0.0 | 8.1 | 0.0 | 4.1 | 17.6 | 0.0 | 0.0 | 8.1 | |
| UDel | 0.0 | 4.1 | 0.0 | 4.1 | 0.0 | 4.1 | 5.4 | 6.8 | 0.0 | 13.5 | |
| mMK | APHRODITE | 2.7 | 0.0 | 2.7 | 1.4 | 0.0 | 0.0 | 16.2 | 0.0 | 0.0 | 0.0 |
| CPC | 1.4 | 0.0 | 4.1 | 0.0 | 0.0 | 0.0 | 29.7 | 0.0 | 29.7 | 0.0 | |
| CRU | 0.0 | 0.0 | 0.0 | 5.4 | 0.0 | 5.4 | 0.0 | 0.0 | 0.0 | 8.1 | |
| GPCC | 0.0 | 1.4 | 1.4 | 9.5 | 0.0 | 0.0 | 1.4 | 0.0 | 0.0 | 2.7 | |
| PGF | 0.0 | 0.0 | 0.0 | 8.1 | 0.0 | 4.1 | 13.5 | 0.0 | 0.0 | 6.8 | |
| UDel | 0.0 | 4.1 | 0.0 | 4.1 | 0.0 | 4.1 | 2.7 | 6.8 | 0.0 | 8.1 | |
Table 4.
The Jaccard similarity coefficient calculated for annual and seasonal rainfall changes estimated for the period 1979–2010. The highest values for different seasons are presented using bold font.
Table 4.
The Jaccard similarity coefficient calculated for annual and seasonal rainfall changes estimated for the period 1979–2010. The highest values for different seasons are presented using bold font.
| Dataset | Annual | Pre-Monsoon | Monsoon | Post-Monsoon | Winter |
|---|---|---|---|---|---|
| APHRODITE | 0% | 24% | 1% | 63% | 7% |
| CPC | 0% | 12% | 1% | 30% | 5% |
| CRU | 10% | 12% | 16% | 72% | 6% |
| GPCC | 22% | 12% | 21% | 80% | 22% |
| PGF | 13% | 11% | 16% | 61% | 16% |
| UDel | 17% | 22% | 17% | 51% | 14% |
Table 5.
The results of the statistical indices used to assess the spatial similarity in changes (Sen’s slope) obtained using different gridded datasets for annual and seasonal rainfall during 1979–2010. The best scores obtained for different seasons are highlighted using bold font.
Table 5.
The results of the statistical indices used to assess the spatial similarity in changes (Sen’s slope) obtained using different gridded datasets for annual and seasonal rainfall during 1979–2010. The best scores obtained for different seasons are highlighted using bold font.
| Test | Dataset | Annual | Pre-Monsoon | Monsoon | Post-Monsoon | Winter |
|---|---|---|---|---|---|---|
| Pbias | APHRODITE | −872.7 | −478.7 | 49.1 | −125.1 | −765.2 |
| CPC | −1868.5 | −956 | 67 | −624.1 | −845 | |
| CRU | 581.9 | 324.5 | 19.6 | 167.7 | −633.5 | |
| GPCC | −26.4 | −9.6 | 1.5 | 53.9 | −552.6 | |
| PGF | −81.1 | 37.6 | 31.1 | 67.2 | −685 | |
| UDel | −118.8 | −38.6 | 17.3 | 24.6 | −623.3 | |
| md | APHRODITE | 0.27 | 0.2 | 0.51 | 0.4 | 0.04 |
| CPC | 0.13 | 0.1 | 0.27 | 0.27 | 0.04 | |
| CRU | 0.28 | 0.22 | 0.45 | 0.07 | 0.05 | |
| GPCC | 0.61 | 0.36 | 0.62 | 0.39 | 0.05 | |
| PGF | 0.47 | 0.28 | 0.51 | 0.36 | 0.04 | |
| UDel | 0.48 | 0.31 | 0.27 | 0.38 | 0.05 | |
| SS | APHRODITE | 0.21 | −0.06 | 0.88 | 0.33 | −0.25 |
| CPC | −0.10 | −0.19 | 0.75 | −0.23 | −0.25 | |
| CRU | 0.05 | 0.30 | 0.80 | −0.051 | −0.29 | |
| GPCC | 0.73 | 0.42 | 0.90 | 0.44 | −0.26 | |
| PGF | 0.51 | 0.37 | 0.81 | 0.38 | −0.20 | |
| UDel | 0.55 | 0.38 | 0.64 | 0.41 | −0.26 |
Pbias: percentage of bias; md: modified index of agreement; and SS: skill score.
Table 6.
The Probability of Detection (POD) score of the different gridded datasets in detecting trends obtained using observed data for the period 1979–2010. The highest values of POD for annual and seasonal rainfall are shown in bold.
Table 6.
The Probability of Detection (POD) score of the different gridded datasets in detecting trends obtained using observed data for the period 1979–2010. The highest values of POD for annual and seasonal rainfall are shown in bold.
| Method | Gridded Dataset | POD | ||||
|---|---|---|---|---|---|---|
| Annual | Pre-Monsoon | Monsoon | Post-Monsoon | Winter | ||
| MK | APHRODITE | 0.76 | 0.85 | 0.88 | 0.71 | 0.91 |
| CPC | 0.44 | 0.71 | 0.53 | 0.35 | 0.94 | |
| CRU | 0.85 | 0.59 | 0.88 | 0.91 | 0.53 | |
| GPCC | 0.88 | 0.82 | 1.00 | 1.00 | 0.94 | |
| PGF | 0.85 | 0.71 | 0.91 | 0.68 | 0.94 | |
| UDel | 0.76 | 0.65 | 0.76 | 0.68 | 0.65 | |
| mMK | APHRODITE | 0.91 | 0.88 | 1.00 | 0.71 | 0.97 |
| CPC | 0.91 | 0.79 | 0.97 | 0.56 | 0.94 | |
| CRU | 0.91 | 0.65 | 0.88 | 0.91 | 0.91 | |
| GPCC | 0.94 | 0.82 | 1.00 | 0.97 | 0.97 | |
| PGF | 0.94 | 0.74 | 0.94 | 0.74 | 0.97 | |
| UDel | 0.76 | 0.71 | 0.76 | 0.71 | 0.74 | |
© 2019 by the authors. Licensee MDPI, Basel, Switzerland. This article is an open access article distributed under the terms and conditions of the Creative Commons Attribution (CC BY) license (http://creativecommons.org/licenses/by/4.0/).
Share and Cite
MDPI and ACS Style
Nashwan, M.S.; Shahid, S.; Wang, X. Uncertainty in Estimated Trends Using Gridded Rainfall Data: A Case Study of Bangladesh. Water 2019, 11, 349. https://doi.org/10.3390/w11020349
AMA Style
Nashwan MS, Shahid S, Wang X. Uncertainty in Estimated Trends Using Gridded Rainfall Data: A Case Study of Bangladesh. Water. 2019; 11(2):349. https://doi.org/10.3390/w11020349
Chicago/Turabian StyleNashwan, Mohamed Salem, Shamsuddin Shahid, and Xiaojun Wang. 2019. "Uncertainty in Estimated Trends Using Gridded Rainfall Data: A Case Study of Bangladesh" Water 11, no. 2: 349. https://doi.org/10.3390/w11020349
Note that from the first issue of 2016, this journal uses article numbers instead of page numbers. See further details here.