A Regional Difference Analysis of Microplastic Pollution in Global Freshwater Bodies Based on a Regression Model

1
School of Resources and Environmental Engineering, Hefei University of Technology, Hefei 230009, China
2
College of Civil Engineering, Sichuan Agricultural University, Chengdu 611830, China
3
Wuhan Planning and Design Company, Wuhan 430014, China
*
Author to whom correspondence should be addressed.
Water 2020, 12(7), 1889; https://doi.org/10.3390/w12071889
Submission received: 12 May 2020
/
Revised: 27 June 2020
/
Accepted: 30 June 2020
/
Published: 2 July 2020
(This article belongs to the Special Issue Environmental Chemistry of Water Quality Monitoring)
Abstract
:Based on statistical data of the average abundance of microplastics from 37 global freshwater locations up to November 2019, we classified the freshwater bodies according to developments in their local countries and geographic positions. We highlighted the differences and causes of microplastic pollution in the waters of both developed and developing countries and urban and rural areas. The results showed that microplastic pollution was highest in Asia. The pollution in developed countries was significantly lower than in developing countries. The differences in freshwater pollution between urban and rural areas mainly depended on the extent of human activity. The present study found the following phenomena by comprehensively using simple and multiple regression models and a Pearson correlation analysis to solve the impacts of the features, natural factors, and social and economic factors on the distribution of microplastic pollution. The density of microplastics was higher, which promoted the aggregation of microplastics in sediments. Pursuant to that, microplastic pollution was also influenced by the space-time pollution of movable surface sources, such as the soil and air. A population increase and the average gross domestic product (GDP) could also worsen microplastic pollution.

1. Introduction
With the continuous progress and development of society, plastics have permeated every major facet of human life and economy. Large scale production and plastic waste have had great negative impacts on our environment [1]. According to statistical data, the global production and widespread use of plastics led to an accumulation of 348 million tons in 2017. China produced 102.3 million tons of plastic materials, accounting for 29.4% of the world’s plastic production. As a result of this, China became the world’s largest producer and consumer of plastic materials [2].
In 2004, Thompson et al. from the University of Plymouth published an article in Science that first posited that microplastics are small pieces and particles of plastic less than 5 mm in diameter [3]. Microplastics are divided according to their source: primary type and secondary type [4]. Scientific research proved that secondary microplastics have a stronger potential adsorption rate on organics and several heavy metals, like Pb and Hg, compared with primary microplastics. Pollutants will be immediately transferred to aquatic organisms when they ingest food laced with microplastic particles, which is a threat to humans and the environment through the food chain [5,6,7]. Therefore, microplastics have a strong biotoxicity that leads aquatic organisms to develop symptoms, including mechanical damage, low growth rate, declining reproduction, etc. [8].
Microplastics are widespread in freshwater environments. The severity, location, and terminal treatment of microplastics varies widely by region due to differences in the population, economic development, treatment technology, microplastics composition, and waterbody characteristics [9]. Besides, Lisa et al. investigated the effect of hydrologic and hydraulic factors on the migration of microplastics in waterways. It proved that microplastics concentrations were significantly different in different flow conditions and some obstacles in waterways caused microplastics to accumulate, such as dams [10,11]. However, the current studies on microplastics in waterbodies are mostly experimental determinations of microplastics concentrations and basic chemical properties. Therefore, the purpose of this study was to determine the relevant factors that affect microplastic pollution. In this paper, 37 freshwater bodies were selected globally and samples from the literature were collected from multiple databases, in order to compare the differences in the global distribution of microplastic pollution, trace the source of pollutants in different regions, and study the main effects of the pollution distribution of microplastics.
2. Methods
2.1. Data Sources
Existing data on microplastic abundance and concentration were obtained for 37 freshwater bodies located in 12 countries spanning six continents (except Antarctica) (Table 1). The sample included 1 reservoir, 4 rivers, and 32 lakes. The data on the average abundance and composition of the microplastics in the waterbodies required for the study came from the relevant literature in major Chinese and English databases as of November 2019. The data on the continent and country, country type, population, per capita GDP, secondary industry structure, and urbanization rate came from the 2018 International Statistical Yearbook. Then, population density was calculated by drainage area and the population of the area. The suburb type was determined according to the number of people and geographical location of the surrounding waterbodies. Among them, the urban waterbodies were closer to the city with a larger population density, while the rural waterbodies were the opposite.
2.2. Units of Measurement
As an emerging research field, microplastic pollution has attracted the attention of many international researchers in recent years. Due to the different research methods and the lack of internationally unified standards, there have been many forms of measurement units for microplastic abundance. In this paper, n/m3 was selected as the standard unit. There were 13 different forms of units used to describe the abundance of microplastics in the investigated waterbodies, and the conversion methods are shown in Table 2.
2.3. Research Methods
Modeling analysis methods are generally applied to trace regional differences in pollution. For example, Meng Lixia et al. used the Theil Index to analyze the differences in the intensity of water pollution emissions in China [33]. Through the application of the Hybrid Single Particle Lagrandian Integrated Trajectory Model (HYSPLIT), potential source contribution factor method (WPSCF), and concentration weighted trajectory analysis (WCWT), Yan Yu et al. analyzed the pollution characteristics and source differences of fine particulate matter (PM2.5) [34]. Based on the Stochastic Impacts by Regression on Population, Affluence and Technology model (STIRPAT), Wang Naichun et al. analyzed the influencing factors of carbon emissions [35]. In view of the absence of multicollinearity among the selected influencing factors and the scattered research contents related to microplastic pollution (the significances of all variables were higher than 0.05 in the Pearson correlation analysis), we adopted a regression model to analyze the factors that cause differences in the distribution of microplastic pollution.
Through the literature collection and data collation, this paper first describes the distribution map of the average microplastic abundance in freshwater bodies by ArcGIS (a software that can collect, organize, and analyze the geographic information), and compares the differences of microplastic pollution characteristics in developing countries and developed countries, as well as urban and rural freshwater bodies. After collecting all relevant data on the composition and structure of microplastics, water depth, surface area of the water, distance from the city center, region population, population density, per capita GDP, urbanization rate, and secondary industry structure, the primary influencing factors for the distribution of microplastics were identified using a Pearson correlation analysis, univariate or multiple regression models, and other analytical methods.
3. Results and Discussion
3.1. Difference Analysis of Microplastic Pollution in Global Freshwater Bodies
Through the collection and collation of the sample data, we obtained the pollution distribution of microplastics in global freshwater bodies (Figure 1). There were relatively more studies on water microplastics in Asia, Europe, and North America. The order of microplastic pollution in freshwater bodies of six continents was: Asia > North America > Africa > Oceania > South America > Europe. China was the country with the most serious microplastic pollution in the world, with the average concentration of microplastics in the water as high as 3793.38 ± 799.68 n/m3. Among Chinese locations, the average abundance of microplastics in Wuhan Bei Lake was the highest, reaching 8925 n/m3 [18]. Globally, Switzerland had the lowest level of pollution, with an average concentration of 0.04 ± 0.01 n/m3. In terms of the concentration of microplastics, the highest was Lake Neuchatel, which was 0.061 n/m3 [17], and the lowest was Lake Zurich with 0.011 n/m3 [12].
3.1.1. Difference Analysis of Microplastic Pollution in Developed Countries and Developing Countries
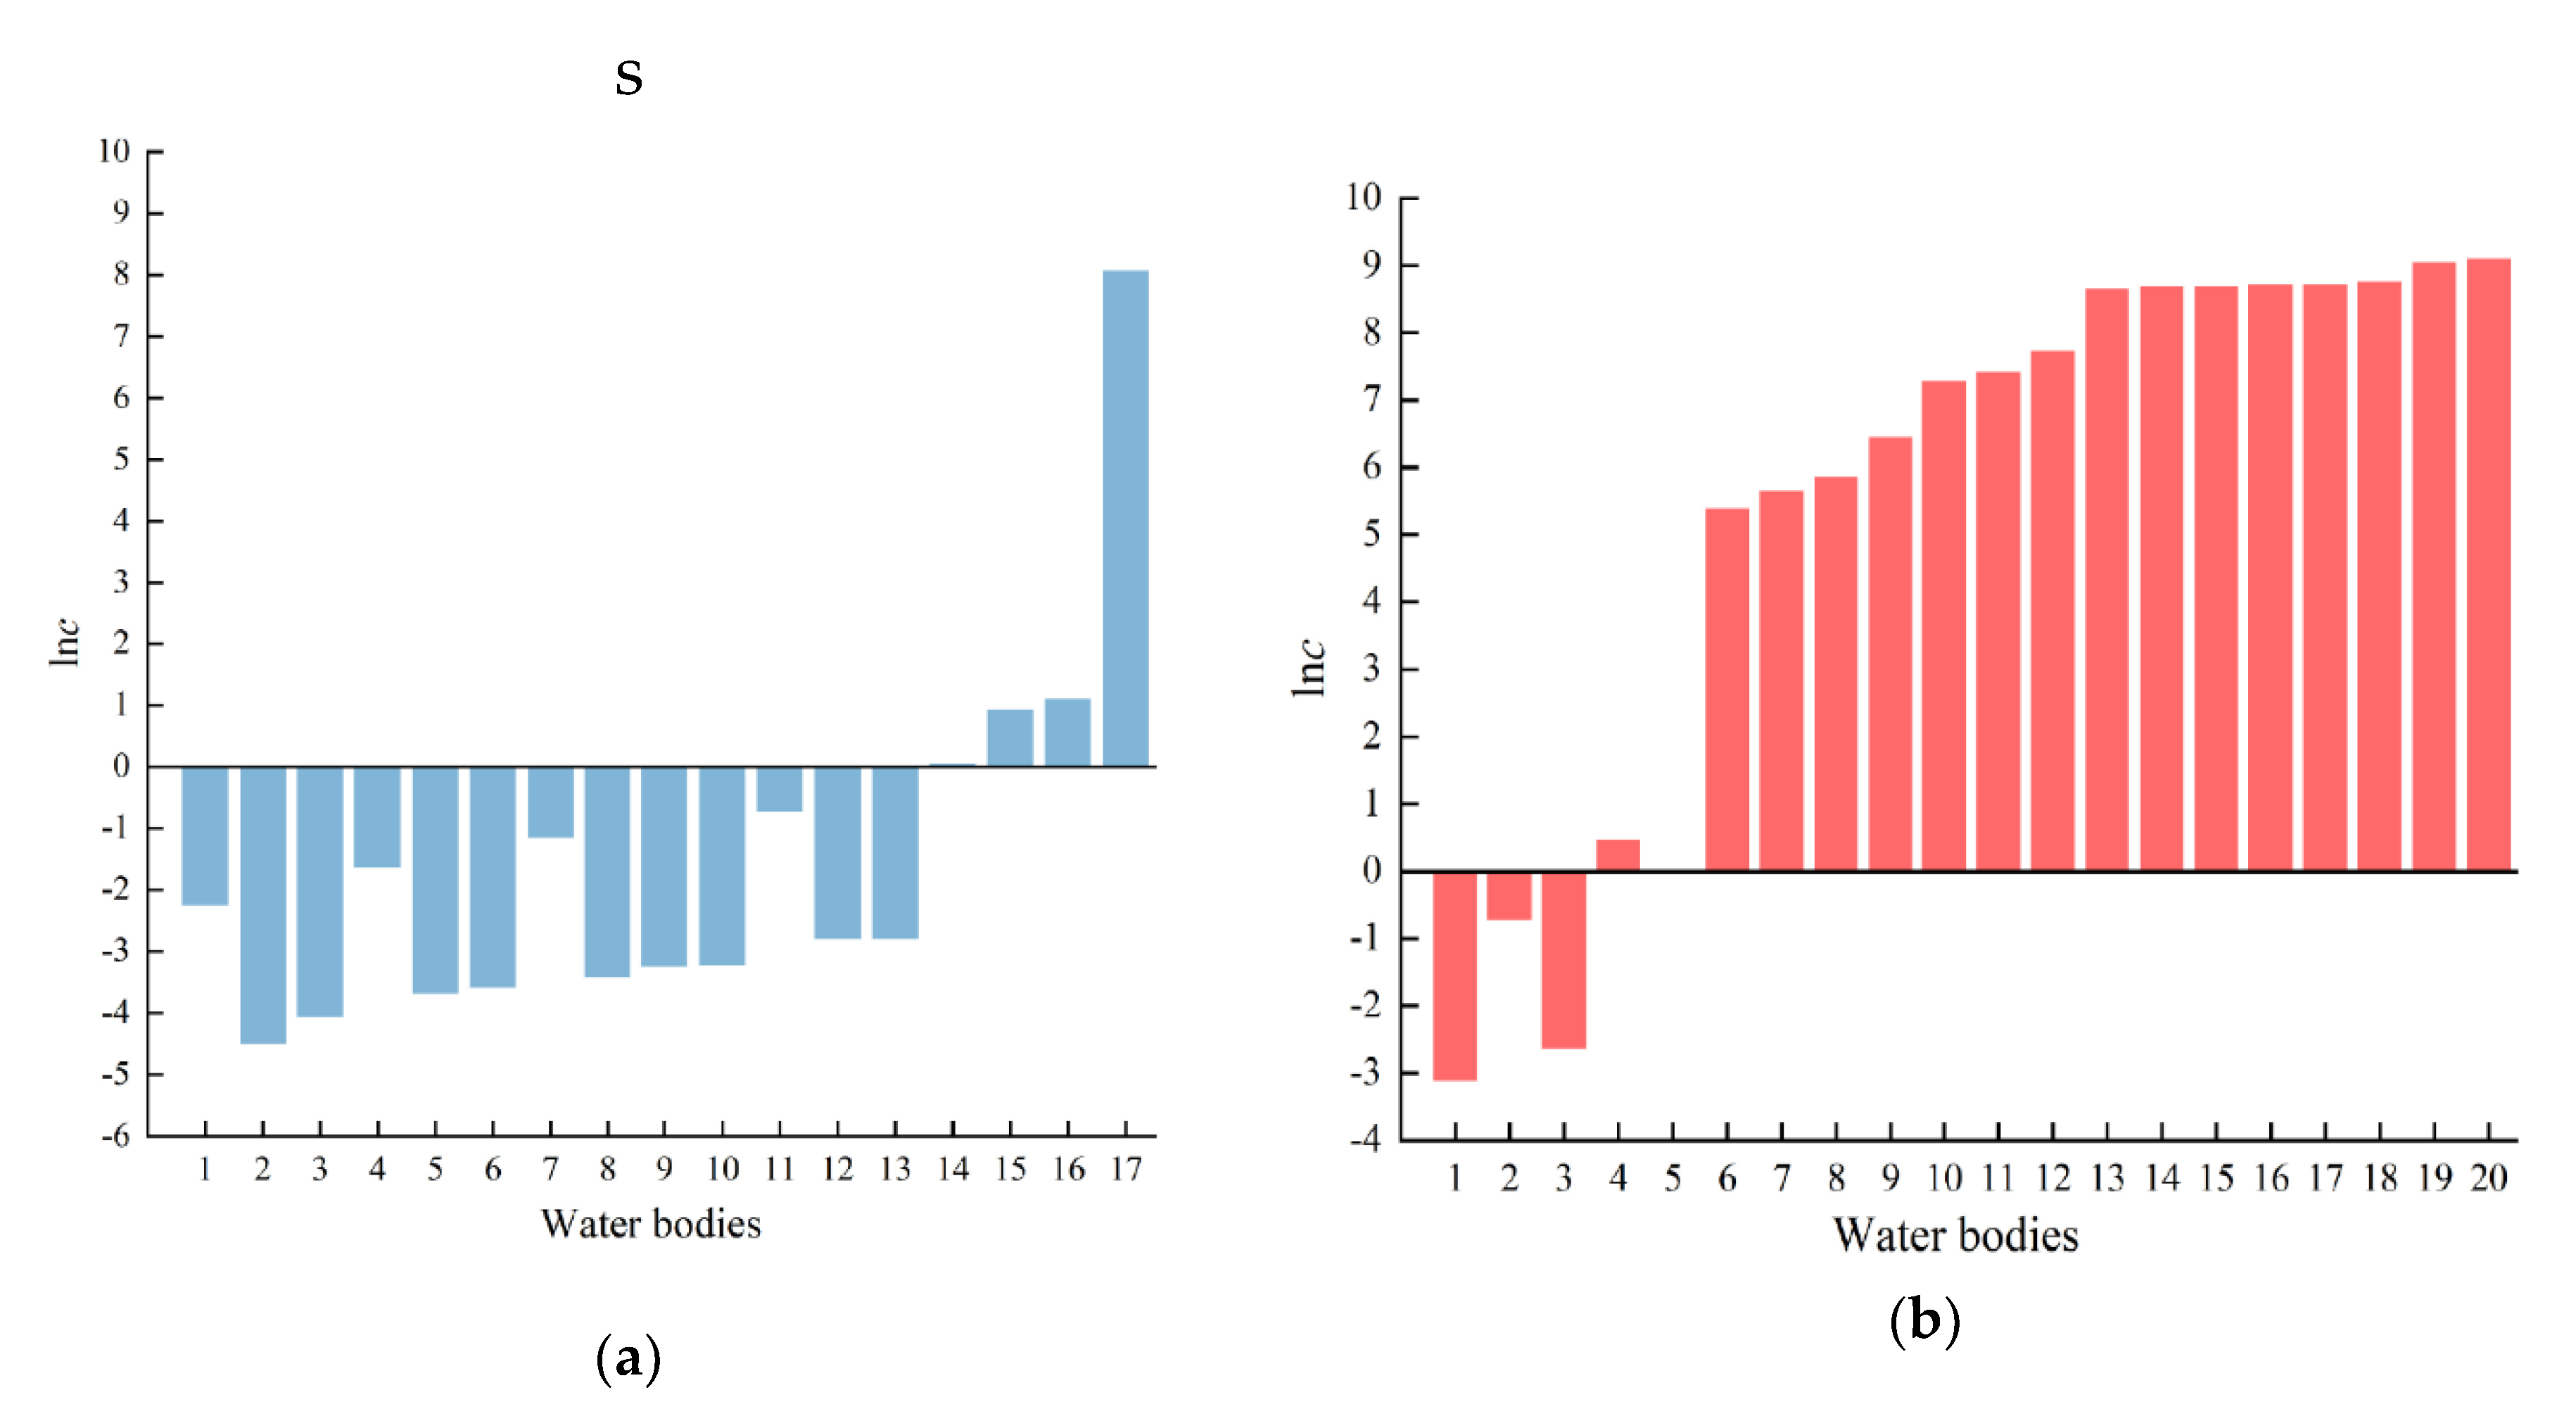
Among the selected samples, 17 waterbodies were located in developed countries, including the United States, Switzerland, Canada, Italy, the United Kingdom, and Australia, and 20 waterbodies were located in developing countries, including Mongolia, South Africa, Chile, Brazil, and China (Figure 2). Significant statistical difference (Sig) (2-tailed) = 0.001 was obtained using an independent sample T-test of the two groups, indicating a significant difference. The total average abundance of microplastics in the waterbodies of developed countries was 189.2 ± 188.7 n/m3, while the total average abundance of microplastics in the waterbodies of developing countries was 3034 ± 725 n/m3.
As a developing country, China’s waterbodies are polluted by microplastics. In addition to the direct pollution caused by industry and human life, it is also necessary to comprehensively consider the spatial and temporal connections between soil pollution and air pollution. For example, agricultural plastic film is a major source of soil microplastic pollution. The annual growth rate of the area covered by agricultural plastic film in the world was found to be 5.7%. The annual growth rate of the agricultural plastic film coverage area in China from 1991 to 2004 reached as high as 30% [36]. Compared with more than 50% of the global plastic film usage, the plastic film recovery rate in China was less than 2/3 [37]. The residual plastic film can enter waterbodies through the ground rain runoff, resulting in large areas of water with microplastic pollution.
There were differences in the composition of microplastics in the waters between developed and developing countries. We selected 16 samples to determine the settling ratio, main microplastic composition, and proportion (Table 3) in the waterbodies. The main difference identified was that the microplastics in the waters from developing countries had more polyethylene terephthalate (PET). As shown in Figure 3, the proportion of light microplastics, like polypropylene (PP) and polyethylene (PE), in waterbodies from developed counties was higher than those from developing countries. The waterbodies from developed countries demonstrated 6.75% expanded polystyrene (EPS), 0.9% polyurethane (PU), and 0.9% acrylonitrile butadiene styrene plastic (ABS), while none of these were recorded in waterbodies from developing countries.
The types and densities of microplastics were different, which directly influenced the locations of microplastics in waterbodies. High-density microplastics were difficult to contain in waters and later became sediments. As a result, there were microplastic distribution variations between the waterbodies and the sediments from developed and developing countries. This section used a Pearson correlation analysis to screen out the major effects (Table 4) on the concentration distribution of microplastics. These compositions, including PET, polyamide (PA), polyvinyl chloride (PVC), PU, ABS, and EPS, had correlations with the concentration distribution of microplastics. In addition, the correlation pecking order for these compositions was PET > PA > PVC = PU = ABS = EPS. The PET contents had the most significant statistical difference (Sig = 0.005) for the concentration distribution of microplastics, and the PET density was as high as 1.38 g/m3, which could explain the phenomenon that the settling ratio of microplastics in waters from developing countries was higher than that from developed countries.
3.1.2. Difference Analysis of Microplastic Pollution in Urban and Rural Freshwater Bodies
As shown in Figure 4, there were 31 urban waterbodies in the global sample, and the total average value of microplastic abundance was 1861 ± 520 n/m3. The total number of rural waterbodies was six, and the total average value of microplastic abundance was 1038 ± 981 n/m3. Sig (2-tailed) = 0.519 was obtained by an independent sample T-test of the two samples, with no significant difference. Considering the differences of environmental governance between developed countries and developing countries, it was of little significance to explore the differences in suburban waterbodies on a global scale. Therefore, the scope of discussion was limited to developed countries and developing countries (Table 5).
The main difference between urban and rural freshwater bodies is the surrounding population and building density. The rural waterbodies are usually far away from cities with low populations and building density. There may be a correlation between the distance between each waterbody and the city center and the distribution of microplastic pollution. Based on the classification in Table 5, this section explores the above correlations. The determination coefficient R2 of the linear regression model was close to 0 (Figure 5), indicating that the distance was not the main effect affecting the concentration of microplastics in freshwater bodies. Due to the independence between the waterbodies (even urban waterbodies), developed countries can reduce the microplastics content in their waterbodies through efficient sewage treatment processes, for instance, Lake Zurich in Switzerland, where the average abundance of microplastics in waterbodies was only 0.11 n/m3 [14].
On the contrary, for developing countries, even if it is a rural waterbody, if the sewage treatment system is not mature enough to treat the sewage discharged by the surrounding factories, it will cause water pollution more serious than some urban lakes, such as Lake Ulansuhai in China, where the concentration of microplastics in seawater was as high as 5940 n/m3 [29]. In addition, some of the rural lakes in scenic spots, such as the Three Gorges Reservoir, are frequented by tourists all year round and inevitably influenced by human activities, which can also aggravate the degree of pollution.
3.2. Research on the Influencing Factors of Global Microplastic Pollution Distribution
3.2.1. Natural Factors: Water Depth and Water Area
Water depth and water area are two significant limnological and morphological variables, which are closely related to the water storage capacity and heat capacity of waterbodies. There are differences in the hydrodynamic processes of waterbodies at different water depths. The different flow field distribution and wind and wave characteristics lead to the different self-purification capacities of waterbodies [38]. Therefore, the difference in the average water depth and water area may become factors that affect the concentration of microplastics in waterbodies. We selected the basic information of 28 freshwater bodies and extracted the relevant data of the average water depth and water area of each waterbody. The selected freshwater bodies were located in Europe, Asia, and North America (Table 6). The average depth of the waterbodies was of the order of Europe > North America > Asia, while the order of the degree of microplastic pollution was exactly the opposite. No obvious correlation law was found between the water area and the water microplastic concentration. Based on this, we explored the influence of the average water depth and water area differences on the water microplastic concentration, and then screened out the main effect. As shown in Table 7, Sig = 0.009 was obtained by the regression model of the average water depth and the water microplastic concentration, indicating that there was a weak correlation. In order to control the interaction of country development level with other variables, we fit the linear model of developed and developing countries, respectively. After fitting, the R2 and p-value for developed countries were 0.024 and −0.155 and for the developing countries were 0.128 and 0.357, which revealed that the x-value parameter did not support this model (Figure 6). According to the above analysis, when the water depth was large, although the distribution of the water flow field was different, the self-purification capacity did not change significantly. Especially for developed countries, the concentration of microplastics was lower than for developing countries, so the effect was not obvious.
3.2.2. Social Factors: Population, Population Density, GDP per Capita, Urbanization Level, and Secondary Industry Contribution Rate
Social factors symbolize a country’s level of economic development and industrialization, and may have an indirect effect on microplastic pollution [39]. Developed countries had a small population, a high level of urbanization and GDP per capita, and the contribution rate of secondary industry was slightly lower than that of developing countries (Table 8). Compared with developing countries, developed countries were generally less polluted by microplastics. In this section, the multiple regression analysis method was used to solve the regression equations, with population, population density, GDP per capita, urbanization level, and secondary industry contribution rate as independent variables, to explore the effects of the above five factors on microplastic pollution. The test result of residual independence was Durbin–Watson (DW) = 2.74, indicating that there was no obvious autocorrelation in the residual sequence. Based on the P-P diagram (Figure 7), the distribution of residual disability was relatively concentrated, and the histogram was in line with the characteristics of normal distribution, indicating that the regression equation model was suitable to explain the variation law of microplastic pollution with population, population density, GDP per capita, urbanization level, and the contribution rate of secondary industry.
Based on the analysis results of further research, the fitted equation Sig = 0.002 was obtained, from which the regression equation was judged to be highly significant. The regression equation model indicated that the determination coefficient R2 = 0.993, indicating that the fitting effect was excellent. The Sig values of the two independent variables of the population scale and per capita GDP were 0.001 and 0.033, respectively (Table 9), which passed the test at the significance level of 5%, while the other three factors failed the significance test. According to the coefficients obtained from the non-standardized coefficient B in the table, the regression equation can be obtained as:
where x1 is the population (ten thousand people), x2 is the GDP per capita (ten thousand yuan), x3 is the contribution rate of the secondary industry (%), x4 is the urbanization rate (%), and x5 is the population density.
y = 0.029x1 + 1.403x2 − 0.076x3 − 10.279x4 − 0.303x5 + 310.453
From the signs of the indicators, the coefficient of population number and per capita GDP of the independent variables were positive, indicating that population factors and human living standards were positive for microplastic pollution. With the increase of population and the improvement of living standards, the demand for plastic products increases, and economic development accelerates, leading to the increase in the degree of microplastic pollution. There was no correlation between the population density, the contribution rate of the secondary industry, and the urbanization rate to the concentration of microplastics. Therefore, it was of little significance to discuss them separately. Only their combined effect with other indicators should be considered.
4. Conclusions
After the above comparative analysis, the conclusions are as follows:
- The degree of microplastic pollution in the freshwater bodies of the six continents in the world were ranked as follows: Asia > North America > Africa > Oceania > South America > Europe. China was the most seriously polluted and Switzerland was the least polluted. The pollution levels in developed countries were significantly lower than those in developing countries.
- The average density of microplastics in the water environments of developed countries was lower than that of developing countries. Therefore, microplastics in the water environment of developed countries did not easily sink, and were mostly stored in waterbodies. In developing countries, microplastics were mostly found in sediments. The geographical location and the size of the waterbodies had no significant influence on the distribution of microplastic pollution, so they were not the primary factors affecting the distribution of microplastic pollution.
- The regional differences in the distribution of microplastic pollution may depend on factors such as the population, GDP per capita, national economic production level, the receiving waterbody of sewage, and the city pollution treatment technology. Among them, the population and the GDP per capita were directly proportional to the concentration of microplastics. When the waterbody was used as the receiving waterbody of sewage, it depended on the maturity of the urban sewage treatment technology.
The above conclusions are based on the previous research. The research on microplastics is still not fully mature. The majority of the research objects are large urban waterbodies. There is no uniform measurement method for microplastic content internationally; therefore, it is inevitable that there may be errors when comparing the experimental results. In addition, hydrology was the key element missing from this study, which would require another systematic analysis and be difficult to present in the limited space. In this case, taking the regional differences of microplastic pollution distribution as the starting point, we attempted to use the existing research results to further analyze the fundamental factors affecting microplastic pollution, which has significance as a reference for the formulation of governance strategies.
Author Contributions
Conceptualization, H.C. and Y.Q.; methodology, H.C.; software, H.C.; validation, Y.Q., H.H., and W.X.; formal analysis, H.C.; investigation, Y.Q.; resources, H.H.; data curation, Y.Q.; writing—original draft preparation, H.C.; writing—review and editing, H.H.; visualization, W.X.; supervision, W.X.; project administration, W.X.; funding acquisition, W.X. All authors have read and agreed to the published version of the manuscript.
Funding
This research was funded by the National Key Research and Development Program (grant numbers 2019YFC0408504).
Acknowledgments
We would like to express our sincere thanks to the National Key Research and Development Program (2019YFC0408504) for the financial support to the research. At the same time, we would also like to thank Wu Chenxi and Xu Dong of the Institute of Hydrobiology, Chinese Academy of Sciences, for their valuable suggestions on manuscript writing.
Conflicts of Interest
The authors declare no conflict of interest.
References
- Jia, E. A world without humans. Disaster Reduct. China 2010, 32, 52–53. [Google Scholar]
- Zhang, K.; Shi, H.; Peng, J.; Wang, Y.; Xiong, X.; Wu, C.; Lam, P.K.S. Microplastic pollution in China’s inland water systems: A review of findings, methods, characteristics, effects, and management. ScTEn 2018, 630, 1641–1653. [Google Scholar] [CrossRef] [PubMed]
- Thompson, R.C.; Olsen, Y.; Mitchell, R.P.; Davis, A.; Rowland, S.J.; John, A.W.G.; McGonigle, D.; Russell, A.E. Lost at sea: Where is all the plastic? Science 2004, 304, 838. [Google Scholar] [CrossRef]
- Zhang, N.; Chen, L. Research progress on additives in micro-plastics and the biological risk. Appl. Chem. Ind. 2019, 1–4. [Google Scholar] [CrossRef]
- Zhao, C.; Li, X.; Zhang, H.; Chen, L.; Ji, Y.; Li, Z.; Ding, G.; Dong, B.; Dai, X. Effect of chemical pretreatment on adsorption of microplastics to Pb. Acta Sci. Circumstantiae 2019, 39, 3387–3394. [Google Scholar] [CrossRef]
- Xu, P.; Guo, J.; Ma, D.; Ge, W.; Zhou, Z.; Chai, C. Sorption of polybrominated diphenyl ethers by virgin and aged microplastics. Environ. Sci. 2020, 41, 1329–1337. [Google Scholar] [CrossRef]
- Zhang, K.; Sun, H. Adsorption of organic pollutants on (degradable) microplastics and the influences on their bioavailability. Environ. Chem. 2018, 37, 375–382. [Google Scholar] [CrossRef]
- Bo, J.; Chen, M.; Fang, C.; Zheng, R.; Wang, S.; Hong, F.; Zhang, Y. Advance in the study on ecotoxicological effects of microplastics on marine organisms. J. Appl. Oceanogr. 2018, 37, 594–600. [Google Scholar] [CrossRef]
- Heidbreder, L.M.; Bablok, I.; Drews, S.; Menzel, C. Tackling the plastic problem: A review on perceptions, behaviors, and interventions. ScTEn 2019, 668, 1077–1093. [Google Scholar] [CrossRef]
- Watkins, L.; Sullivan, P.J.; Walter, M.T. A case study investigating temporal factors that influence microplastic concentration in streams under different treatment regimes. Environ. Sci. Pollut. Res. 2019, 26, 21797–21807. [Google Scholar] [CrossRef]
- Watkins, L.; McGrattan, S.; Sullivan, P.J.; Walter, M.T. The effect of dams on river transport of microplastic pollution. ScTEn 2019, 664, 834–840. [Google Scholar] [CrossRef]
- Anderson, P.J.; Warrack, S.; Langen, V.; Challis, J.K.; Hanson, M.L.; Rennie, M.D. Microplastic contamination in Lake Winnipeg, Canada. Environ. Pollut. 2017, 225, 223–231. [Google Scholar] [CrossRef] [PubMed]
- Lechner, A.; Keckeis, H.; Lumesberger-Loisl, F.; Zens, B.; Krusch, R.; Tritthart, M.; Glas, M.; Schludermann, E. The Danube so colourful: A potpourri of plastic litter outnumbers fish larvae in Europe’s second largest river. Environ. Pollut. 2014, 188, 177–181. [Google Scholar] [CrossRef] [PubMed] [Green Version]
- Faure, F.; Demars, C.; Wieser, O.; Kunz, M.; De Alencastro, L.F. Plastic pollution in Swiss surface waters: Nature and concentrations, interaction with pollutants. Environ. Chem. 2015, 12, 582–591. [Google Scholar] [CrossRef]
- Alencastro, D. Pollution due to plastics and microplastics in Lake Geneva and in the Mediterranean Sea. Arch. Sci. 2012, 65, 157–164. [Google Scholar]
- Mason, S.A.; Kammin, L.; Eriksen, M.; Aleid, G.; Wilson, S.; Box, C.; Williamson, N.; Riley, A. Pelagic plastic pollution within the surface waters of Lake Michigan, USA. J. Great Lakes Res. 2016, 42, 753–759. [Google Scholar] [CrossRef]
- Sadri, S.S.; Thompson, R.C. On the quantity and composition of floating plastic debris entering and leaving the Tamar Estuary, Southwest England. Mar. Pollut. Bull. 2014, 81, 55–60. [Google Scholar] [CrossRef]
- Sighicelli, M.; Pietrelli, L.; Lecce, F.; Iannilli, V.; Falconieri, M.; Coscia, L.; Di Vito, S.; Nuglio, S.; Zampetti, G. Microplastic pollution in the surface waters of Italian Subalpine Lakes. Environ. Pollut. 2018, 236, 645–651. [Google Scholar] [CrossRef] [PubMed]
- Free, C.M.; Jensen, O.P.; Mason, S.A.; Eriksen, M.; Williamson, N.J.; Boldgiv, B. High-levels of microplastic pollution in a large, remote, mountain lake. Mar. Pollut. Bull. 2014, 85, 156–163. [Google Scholar] [CrossRef] [PubMed]
- Wang, W. A study on Microplastics Pollution in Lakes of Central China and the Sorptive Behavior of Phenanthrene and Pyrene onto Microplastics. Ph.D. Thesis, University of Chinese Academy of Sciences, Beijing, China, 2018. [Google Scholar]
- Eriksen, M.; Mason, S.; Wilson, S.; Box, C.; Zellers, A.; Edwards, W.; Farley, H.; Amato, S. Microplastic pollution in the surface waters of the Laurentian Great Lakes. Mar. Pollut. Bull. 2013, 77, 177–182. [Google Scholar] [CrossRef]
- Zbyszewski, M.; Corcoran, P.L. Distribution and degradation of fresh water plastic particles along the beaches of Lake Huron, Canada. Water Air Soil Pollut. 2011, 220, 365–372. [Google Scholar] [CrossRef]
- Lima, A.R.A.; Costa, M.F.; Barletta, M. Distribution patterns of microplastics within the plankton of a tropical estuary. Environ. Res. 2014, 132, 146–155. [Google Scholar] [CrossRef] [PubMed]
- Naidoo, T.; Glassom, D.; Smit, A.J. Plastic pollution in five urban estuaries of KwaZulu-Natal, South Africa. Mar. Pollut. Bull. 2015, 101, 473–480. [Google Scholar] [CrossRef] [PubMed]
- Xu, B.; Huang, Y.; Zheng, Q. Research on micro plastics in fresh water bodies in Taizhou city. Exp. Teach. Appar. 2017, 34, 71–73. [Google Scholar] [CrossRef]
- Su, L.; Xue, Y.; Li, L.; Yang, D.; Kolandhasamy, P.; Li, D.; Shi, H. Microplastics in Taihu Lake, China. Environ. Pollut. 2016, 216, 711–719. [Google Scholar] [CrossRef]
- Feng, Z.; Zhong, W.; Luo, X.; Hu, S.; Zhou, Z.; Yu, G. Evaluation on eutrophication of water body in a new wharf of Dongting Lake area and study on pollution characteristics of micro plastics. Environ. Prot. Circ. Econ. 2019, 39, 46–49. [Google Scholar] [CrossRef]
- Zhang, K.; Gong, W.; Lv, J.; Xiong, X.; Wu, C. Accumulation of floating microplastics behind the Three Gorges Dam. Environ. Pollut. 2015, 204, 117–123. [Google Scholar] [CrossRef] [PubMed]
- Hidalgo-Ruz, V.; Thiel, M. Distribution and abundance of small plastic debris on beaches in the SE Pacific (Chile): A study supported by a citizen science project. Mar. Environ. Res. 2013, 87–88, 12–18. [Google Scholar] [CrossRef]
- Li, C.; Busquets, R.; Campos, L.C. Assessment of microplastics in freshwater systems: A review. ScTEn 2020, 707, 135578. [Google Scholar] [CrossRef]
- Zhang, K.; Su, J.; Xiong, X.; Wu, X.; Wu, C.; Liu, J. Microplastic pollution of lakeshore sediments from remote lakes in Tibet plateau, China. Environ. Pollut. 2016, 219, 450–455. [Google Scholar] [CrossRef]
- Wang, Z.; Qin, Y.; Li, W.; Yang, W.; Meng, Q.; Yang, J. Microplastic contamination in freshwater: First observation in Lake Ulansuhai, Yellow River Basin, China. Environ. Chem. Lett. 2019, 17, 1821–1830. [Google Scholar] [CrossRef]
- Meng, L.; Yang, Z.; Li, H.; Xue, R. Analysis on the regional differences of water pollution emission intensity in China based on the Theil index. Environ. Pollut. Control 2018, 40, 241–246. [Google Scholar] [CrossRef]
- Yan, Y.; Wang, X.; Zhou, J. The seasonal differences of PM2.5 pollution characteristics and source regions between winter and spring in Fuzhou urban areas. Acta Sci. Circumstantiae 2019, 39, 1049–1056. [Google Scholar] [CrossRef]
- Wang, N.; Xu, C. Analysis of factors affecting carbon emissions in Qingdao based on STIRPAT model. J. Qingdao Univ. (Nat. Sci. Ed.) 2016, 29, 90–94. [Google Scholar] [CrossRef]
- Steinmetz, Z.; Wollmann, C.; Schaefer, M.; Buchmann, C.; David, J.; Tröger, J.; Muñoz, K.; Frör, O.; Schaumann, G.E. Plastic mulching in agriculture. Trading short-term agronomic benefits for long-term soil degradation? ScTEn 2016, 550, 690–705. [Google Scholar] [CrossRef]
- Xu, Y.; Fang, S.; Ma, X.; Zhu, Q. Prevention and control strategy for the pollution of agricultural plastic film. Eng. Sci. 2018, 20, 96–102. [Google Scholar] [CrossRef]
- Bai, X.; Hu, W. Effect of water depth on concentration of TN, TP and Chla in Taihu Lake, China. Adv. Water Sci. 2006, 17, 727–732. [Google Scholar] [CrossRef]
- Wang, M. Research on prediction of GDP per capita in China based on semi-parametric time series model. Mark. Res. 2018, 476, 23–25. [Google Scholar] [CrossRef]
Figure 1.
The distribution of microplastics in typical freshwater bodies around the world.
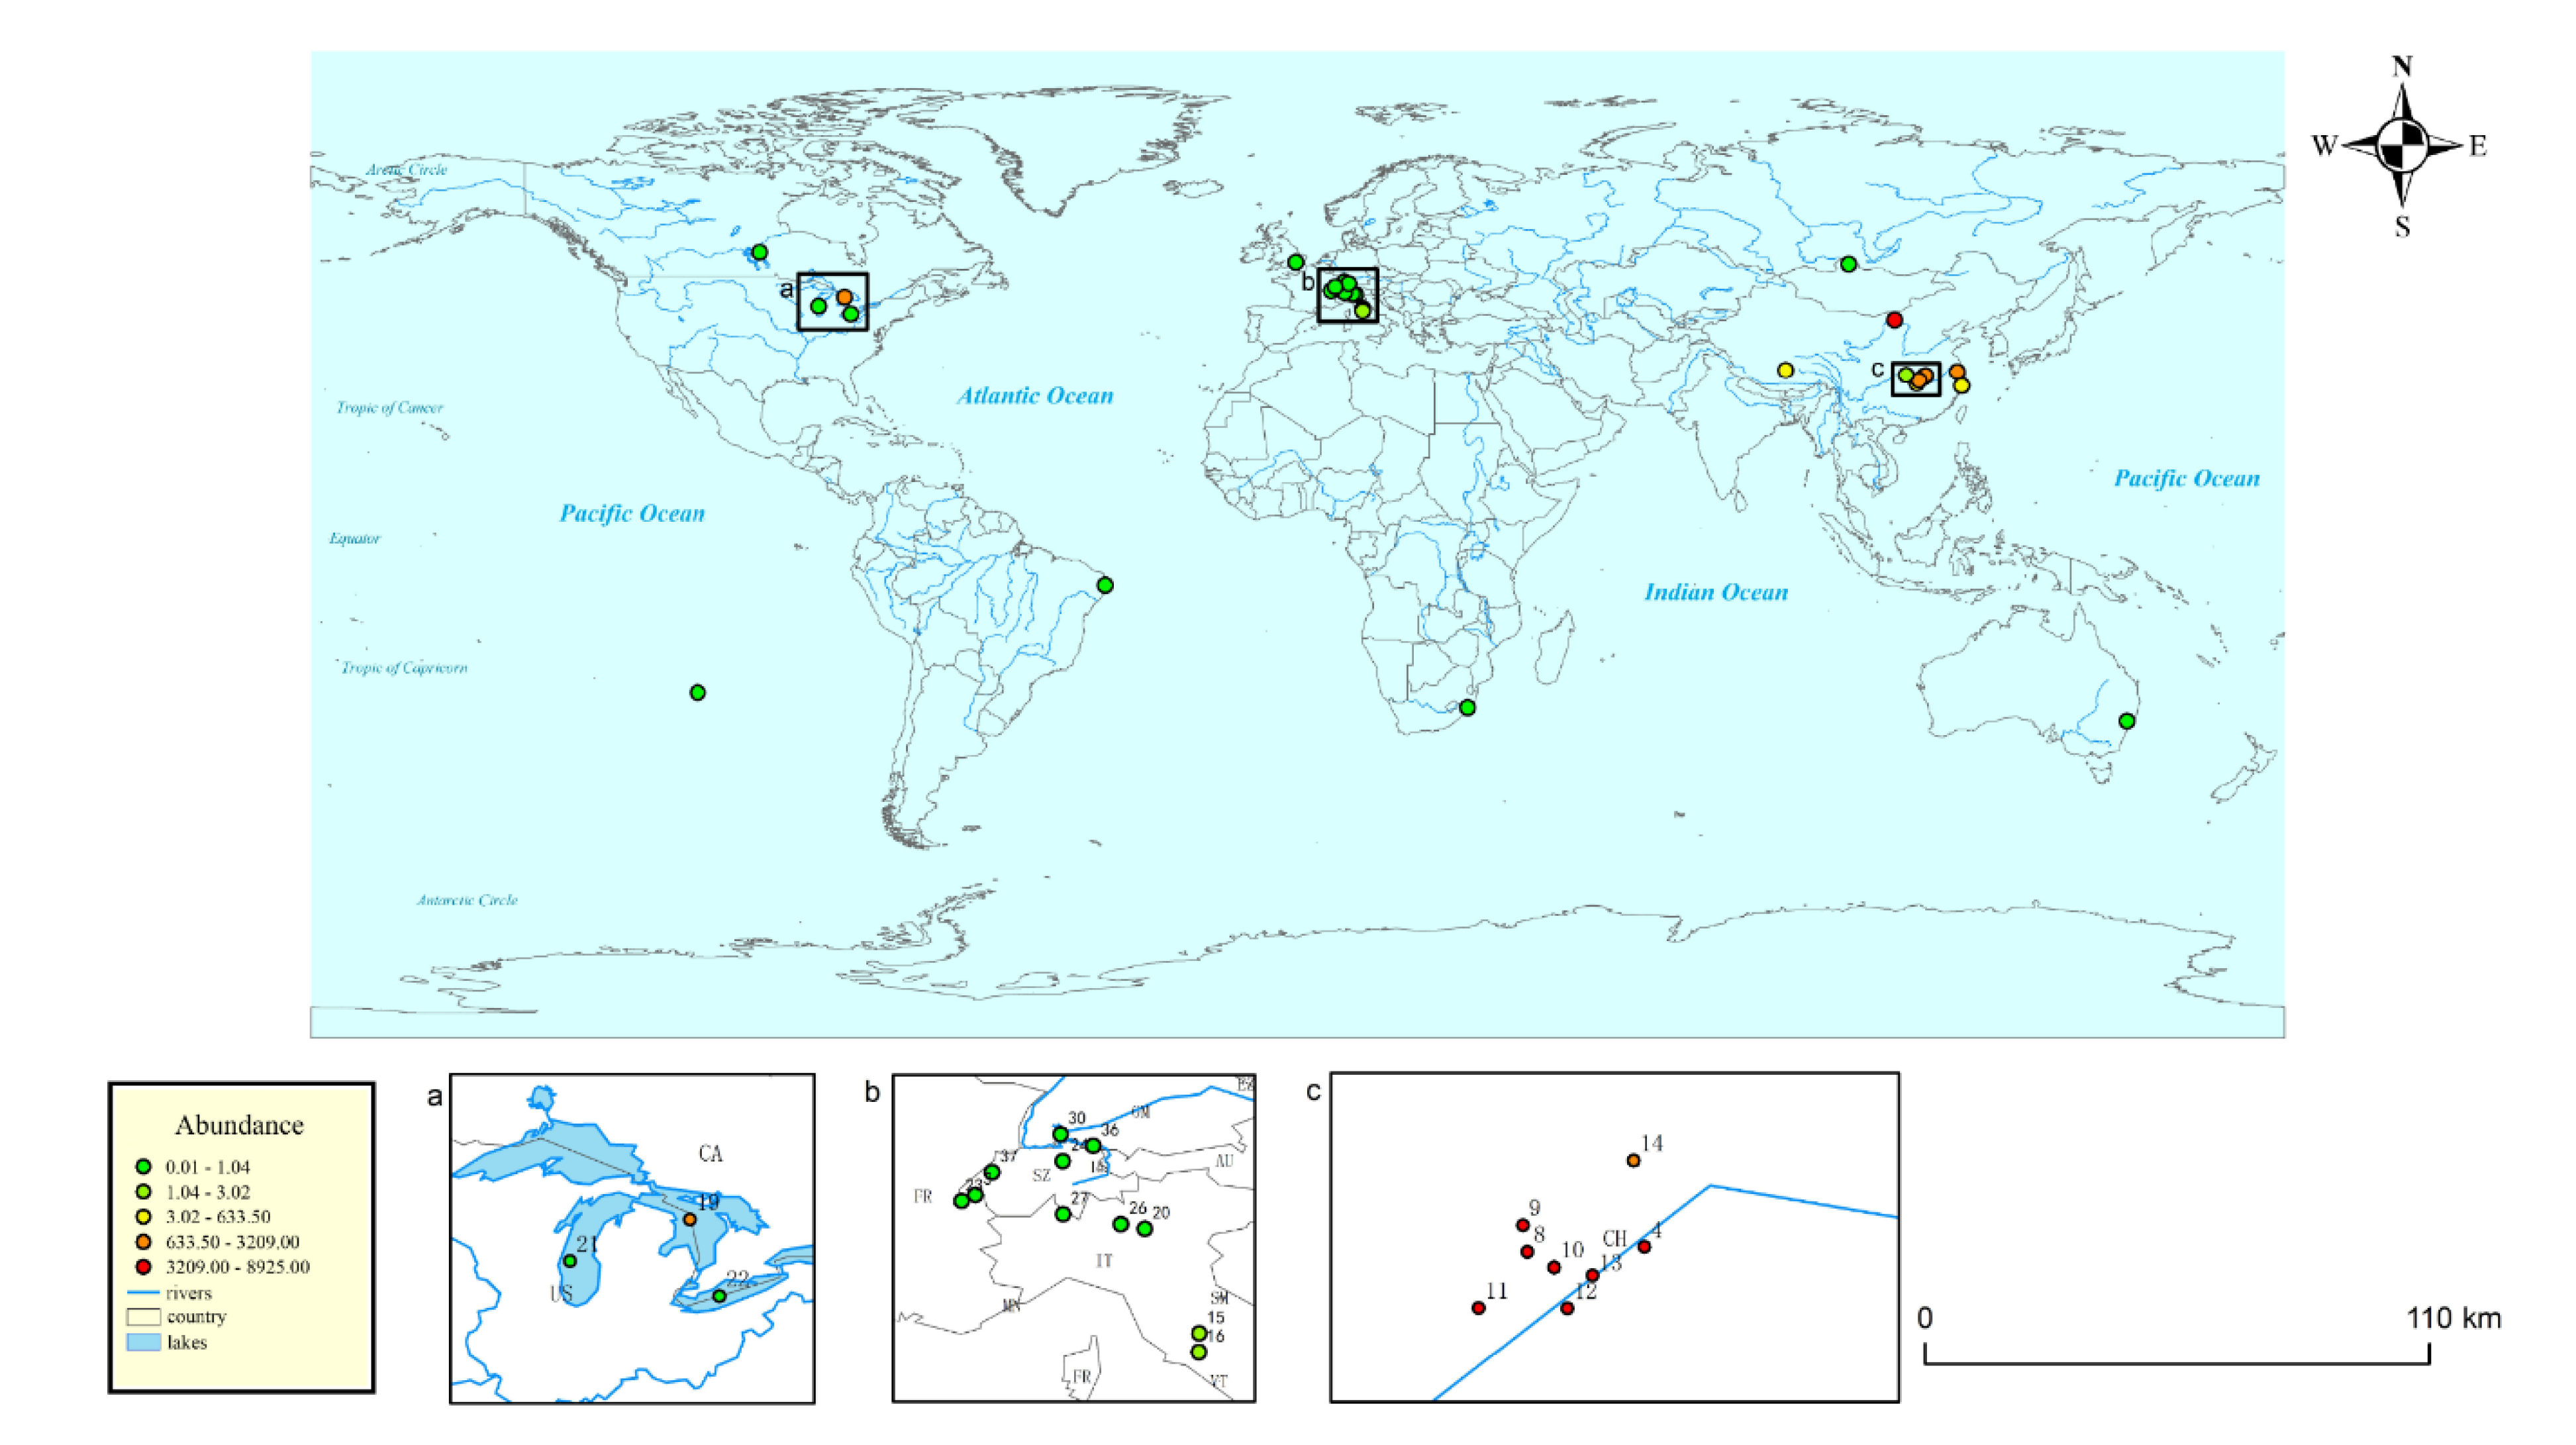
Figure 2.
The average content of microplastics in typical freshwater bodies: (a) in developed countries; (b) in developing countries.
Figure 2.
The average content of microplastics in typical freshwater bodies: (a) in developed countries; (b) in developing countries.

Figure 3.
Average percentage composition of microplastics: (a) in developed countries; (b) in developing countries. Polyamide (PA), polyvinyl chloride (PVC), expanded polystyrene (EPS), polyurethane (PU), and acrylonitrile butadiene styrene plastic (ABS).
Figure 3.
Average percentage composition of microplastics: (a) in developed countries; (b) in developing countries. Polyamide (PA), polyvinyl chloride (PVC), expanded polystyrene (EPS), polyurethane (PU), and acrylonitrile butadiene styrene plastic (ABS).

Figure 4.
The average content of microplastics in freshwater bodies in urban and rural areas of the world.
Figure 4.
The average content of microplastics in freshwater bodies in urban and rural areas of the world.

Figure 5.
A scatter diagram of distance correlation between the concentration of microplastics in the waterbodies and the distance from the city center: (a) in developed countries; (b) in developing countries.
Figure 5.
A scatter diagram of distance correlation between the concentration of microplastics in the waterbodies and the distance from the city center: (a) in developed countries; (b) in developing countries.

Figure 6.
A scatter diagram of the correlation analysis between the microplastic concentration and average water depth in global freshwater bodies: (a) in developed countries; (b) in developing countries.
Figure 6.
A scatter diagram of the correlation analysis between the microplastic concentration and average water depth in global freshwater bodies: (a) in developed countries; (b) in developing countries.

Figure 7.
Regression normalized residual: (a) normal P-P diagram; (b) histogram.


Table 1.
Research sample information table.
| Serial Number | Name of Waterbody | Type of Waterbody | Continent | Country | Type of Country | Type of Geography | Overall Average Abundance (n/m3) |
|---|---|---|---|---|---|---|---|
| 1 | Lake Winnipeg | Lake | North America | Canada | Developed country | Urban type | 0.19 [12] |
| 2 | Danube River | River | Europe | Germany | Developed country | Urban type | 0.317 [13] |
| 3 | Lake Zurich | Lake | Europe | Switzerland | Developed country | Urban type | 0.011 [14] |
| 4 | Lake Geneva | Lake | Europe | Switzerland | Developed country | Urban type | 0.048 [15] |
| 5 | Lake Michigan | Lake | North America | America | Developed country | Urban type | 0.017 [16] |
| 6 | Tamar River | River | Europe | Britain | Developed country | Urban type | 0.028 [17] |
| 7 | Lake Petit | Lake | Europe | Switzerland | Developed country | Urban type | 0.033 [18] |
| 8 | Lake Maggiore | Lake | Europe | Italy | Developed country | Urban type | 0.039 [19] |
| 9 | Lake Iseo | Lake | Europe | Italy | Developed country | Urban type | 0.040 [18] |
| 10 | Lake Constance | Lake | Europe | Switzerland | Developed country | Urban type | 0.061 [19] |
| 11 | Lake Neuchatel | Lake | Europe | Switzerland | Developed country | Urban type | 0.061 [19] |
| 12 | Lake Bolsena | Lake | Europe | Italy | Developed country | Urban type | 2.51 [20] |
| 13 | Lake Chusi | Lake | Europe | Italy | Developed country | Urban type | 3.02 [20] |
| 14 | Lake Erie | Lake | North America | America | Developed country | Urban type | 0.106 [21] |
| 15 | Lake Huron | Lake | North America | America | Developed country | Urban type | 3209 [22] |
| 16 | Lake Garda | Lake | Europe | Italy | Developed country | Rural type | 0.025 [22] |
| 17 | Lake St. Clair | Lake | Oceania | Australia | Developed country | Rural type | 1.048 [13] |
| 18 | Goiana River | River | South America | Brazil | Developed country | Urban type | 0.190 [22] |
| 19 | KwaZulu-Natal River | River | Africa | South Africa | Developing country | Urban type | 0.487 [23] |
| 20 | Lake Hovsgol | Lake | Asia | Mongolia | Developing country | Urban type | 0.044 [14] |
| 21 | East Lake (Zhejiang) | Lake | Asia | China | Developing country | Urban type | 220 [24] |
| 22 | Ling Lake | Lake | Asia | China | Developing country | Urban type | 350 [24] |
| 23 | Dongting Lake | Lake | Asia | China | Developing country | Urban type | 633.5 [25] |
| 24 | Tai Lake | Lake | Asia | China | Developing country | Urban type | 1460 [26] |
| 25 | Wu Lake | Lake | Asia | China | Developing country | Urban type | 1660 [20] |
| 26 | Hong Lake | Lake | Asia | China | Developing country | Urban type | 2282.5 [20] |
| 27 | South Lake | Lake | Asia | China | Developing country | Urban type | 5745 [20] |
| 28 | East Lake (Hubei) | Lake | Asia | China | Developing country | Urban type | 5914 [20] |
| 29 | South Prince Edward Lake | Lake | Asia | China | Developing country | Urban type | 6162.5 [20] |
| 30 | Tazi Lake | Lake | Asia | China | Developing country | Urban type | 6175 [20] |
| 31 | Sha Lake | Lake | Asia | China | Developing country | Urban type | 6390 [20] |
| 32 | Huanzi Lake | Lake | Asia | China | Developing country | Urban type | 8550 [20] |
| 33 | North Lake | Lake | Asia | China | Developing country | Urban type | 8925 [20] |
| 34 | Three Gorges Reservoir | Reservoir | Asia | China | Developing country | Rural type | 1.600 [27] |
| 35 | Easter Island | Lake | South America | Chile | Developing country | Rural type | 0.072 [28,39] |
| 36 | Siling Co Basin | Lake | Asia | China | Developing country | Rural type | 285 [30,31] |
| 37 | Lake Ulangsuhai | Lake | Asia | China | Developing country | Rural type | 5940 [32] |
Table 2.
Different system unit conversion comparison table for microplastic abundances.
| Measure | Original Unit | Conversion Formula | Note |
|---|---|---|---|
| Unit volume | items/L | 1 items/L = 103 n/m3 | Items, ind, and pieces are equal to abundance units n. |
| ind/m3 | 1 ind/m3 = 1 n/m3 | ||
| ind/L | 1 ind/L = 103 n/m3 | ||
| pieces/m3 | 1 pieces/m3 = 1 n/m3 | ||
| Unit water area | items/m2 | 1 items/m2 = 1 n/m3 | Suppose the water depth per unit area is 1 m,1 km2 = 106 m2 |
| items/km2 | 1 items/km2 = 10−6 n/m3 | ||
| ind/km2 | 1 ind/km2 = 10−6 n/m3 | ||
| ind/m2 | 1 ind/m2 = 1 n/m3 | ||
| particles/m2 | 1 particles/m2 = 1 n/m3 | ||
| particles/km2 | 1 particles/km2 = 10−6 n/m3 | ||
| pieces/m2 | 1 pieces/m2 = 1 n/m3 |
Table 3.
A comparison of the main components of microplastics in the waterbodies of developed and developing countries. Polypropylene (PP), polyethylene (PE), and polyethylene terephthalate (PET).
Table 3.
A comparison of the main components of microplastics in the waterbodies of developed and developing countries. Polypropylene (PP), polyethylene (PE), and polyethylene terephthalate (PET).
| Type of Country | Number of Samples | Settlement Ratio (%) | Main Composition | Main Ingredient Content (%) | ||
|---|---|---|---|---|---|---|
| PP | PE | PET | ||||
| Developed country | 4 | 90.72 | PP, PE | 17.2–19 | 19–48 | - |
| Developing country | 12 | 99.24 | PP, PE, PET | 0–29.54 | 19–63.7 | 14–40.91 |
Table 4.
The correlation analysis results of each microplastic component content and microplastic concentration.
Table 4.
The correlation analysis results of each microplastic component content and microplastic concentration.
| PP | PE | PS | PET | PEst | PVC | PA | EPS | PU | Cellophane | ABS | |
|---|---|---|---|---|---|---|---|---|---|---|---|
| Pearson correlation | 0.333 | −0.340 | −0.112 | 0.661 ** | −0.295 | −0.625 ** | 0.596 ** | −0.522 * | −0.522 * | −0.295 | −0.522 * |
| Sig | 0.207 | 0.198 | 0.681 | 0.005 | 0.267 | 0.010 | 0.015 | 0.038 | 0.038 | 0.267 | 0.038 |
** indicates significant correlation at the 0.01 level; * indicates significant correlation at the 0.05 level.
Table 5.
Comparison table of the microplastic concentration in urban and rural waterbodies.
| Type of Waterbody | Type of Country | Number of Samples | Average Distance from City Center (km) | Average Abundance Range of Microplastics (n/m3) |
|---|---|---|---|---|
| Urban type | Developed country | 15 | 76.21 | 0.011–3209 |
| Developing country | 16 | 31.37 | 0.044–8925 | |
| Rural type | Developed country | 2 | 79.85 | 0.025–1.05 |
| Developing country | 4 | 92.98 | 0.072–5940 |
Table 6.
The statistical average water depths and water areas of the waterbody samples.
| Continent | Number of Samples | Average Water Depth (m) | Water Area (m2) |
|---|---|---|---|
| Europe | 9 | 115.57 | 306.6 |
| Asia | 15 | 18 | 731.5 |
| North America | 4 | 43.75 | 7238.3 |
Table 7.
The results of the binary regression analysis with the average water depth and water area as independent variables.
Table 7.
The results of the binary regression analysis with the average water depth and water area as independent variables.
| Model | Unstandardized Coefficient | Standardized Coefficient | t | Significance | |
|---|---|---|---|---|---|
| B | Standard Error | Beta | |||
| Constant | 3069.931 | 653.170 | 4.700 | 0.000 | |
| Average water depth (m) | −24.252 | 8.454 | −0.531 | −2.869 | 0.009 |
| Water area (m2) | −0.106 | 0.564 | 0.579 | ||
Table 8.
Comparison of the economic development and industrial structure between developed countries and developing countries.
Table 8.
Comparison of the economic development and industrial structure between developed countries and developing countries.
| Developing Country | Developed Country | |
|---|---|---|
| Number of waterbodies | 20 | 17 |
| Number of countries involved | 5 | 7 |
| Average population (ten thousand people) | 33,279.66 | 8552.86 |
| Average population density (n/km2) | 47.82 | 156.42 |
| GDP per capita (ten thousand yuan) | 60.10 | 356.72 |
| Average secondary industry contribution rate (%) | 22.67 | 19.67 |
| Average urbanization rate (%) | 63.90 | 80.72 |
Table 9.
The regression equation independent variable coefficients.
| Model | Unstandardized Coefficient | Standardized Coefficient | t | Distinctiveness | |
|---|---|---|---|---|---|
| B | Standard Error | Beta | |||
| onstant | 310.453 | 611.812 | 0.507 | 0.647 | |
| Population (ten thousand people) | 0.029 | 0.002 | 0.983 | 15.493 | 0.001 |
| GDP per capita (ten thousand yuan) | 1.403 | 0.516 | 0.160 | 2.718 | 0.033 |
| Secondary industry contribution rate (%) | −0.076 | 4.095 | −0.001 | -0.019 | 0.986 |
| Urbanization rate (%) | −10.279 | 7.700 | −0.110 | −1.335 | 0.274 |
| Population density (n/km2) | −0.303 | 0.683 | −0.026 | −0.443 | 0.688 |
| Dependent variable: average abundance of microplastics in waterbodies (n/m3). | |||||
© 2020 by the authors. Licensee MDPI, Basel, Switzerland. This article is an open access article distributed under the terms and conditions of the Creative Commons Attribution (CC BY) license (http://creativecommons.org/licenses/by/4.0/).
Share and Cite
MDPI and ACS Style
Chen, H.; Qin, Y.; Huang, H.; Xu, W. A Regional Difference Analysis of Microplastic Pollution in Global Freshwater Bodies Based on a Regression Model. Water 2020, 12, 1889. https://doi.org/10.3390/w12071889
AMA Style
Chen H, Qin Y, Huang H, Xu W. A Regional Difference Analysis of Microplastic Pollution in Global Freshwater Bodies Based on a Regression Model. Water. 2020; 12(7):1889. https://doi.org/10.3390/w12071889
Chicago/Turabian StyleChen, Hanwen, Yinghuan Qin, Hao Huang, and Weiyi Xu. 2020. "A Regional Difference Analysis of Microplastic Pollution in Global Freshwater Bodies Based on a Regression Model" Water 12, no. 7: 1889. https://doi.org/10.3390/w12071889
Note that from the first issue of 2016, this journal uses article numbers instead of page numbers. See further details here.