Towards Monitoring of Nutrient Pollution in Coastal Lake Using Remote Sensing and Regression Analysis


1
Department of Civil Engineering, American University of Sharjah, Sharjah P.O. Box 26666, UAE
2
Koler Builders, Toronto, ON M6A 3B4, Canada
3
College of Engineering, New Mexico State University, 1780 E University Ave, Las Cruces, NM 88003, USA
4
Department of Biology, Chemistry and Environmental Sciences, American University of Sharjah, Sharjah P.O. Box 26666, UAE
*
Authors to whom correspondence should be addressed.
Water 2020, 12(7), 1954; https://doi.org/10.3390/w12071954
Submission received: 1 June 2020
/
Revised: 3 July 2020
/
Accepted: 7 July 2020
/
Published: 9 July 2020
(This article belongs to the Special Issue Environmental Chemistry of Water Quality Monitoring)
Abstract
:The last few decades have witnessed a tremendous increase in nutrient levels (phosphorus and nitrogen) in coastal water leading to excessive algal growth (Eutrophication). The presence of large amounts of algae turns the water’s color into green or red, in the case of algal blooms. Chlorophyll-a is often used as an indicator of algal biomass. Due to increased human activities surrounding Dubai creek, there have been eutrophication concerns given the levels of nutrients in that creek. This study aims to map chlorophyll-a in Dubai Creek from WorldView-2 imagery and explore the relationship between chlorophyll-a and other eutrophication indicators. A geometrically- and atmospherically-corrected WorldView-2 image and in-situ data have been utilized to map chlorophyll-a in the creek. A spectral model, developed from the WorldView-2 multispectral image to monitor Chlorophyll-a concentration, yielded 0.82 R2 with interpolated in-situ chlorophyll-a data. To address the time lag between the in-situ data and the image, Landsat 7 Enhanced Thematic Mapper Plus (ETM+) images were used to demonstrate the accuracy of the WorldView-2 model. The images, acquired on 20 May and 23 July 2012, were processed to extract chlorophyll-a band ratios (Band 4/Band 3) following the standard approach. Based on the availability, the 20 May image acquisition date is the closest to the middle of Quarter 2 (Q2) of the in-situ data (15 May). The 23 July 2012 image acquisition date is the closest to the WorldView-2 image date (24 July). Another model developed to highlight the relationship between spectral chlorophyll-a levels, and total nitrogen and orthophosphate levels, yielded 0.97 R2, which indicates high agreement. Furthermore, the generated models were found to be useful in mapping chlorophyll-a, total nitrogen, and orthophosphate, without the need for costly in-situ data acquisition efforts.
1. Introduction
Anthropogenic activities have a direct and indirect impact on the environment [1]. One such type of water pollution is eutrophication, a case of algal bloom caused by increasing levels of nutrients [2,3]. As part of the water pollution management, it is important to detect and manage pollution sources [4,5]. Traditional means of monitoring nutrients and algal growth monitoring are often point based, requiring large amounts of effort in the laboratory analysis, in addition to a mathematical approach in analyzing the data [4,6]. This study examines the role of nutrient pollution on algal growth in a coastal lagoon. However, these methods are costly and do not provide a real spatial and temporal coverage [7]. Satellite remote sensing methods provide a cost-effective means for the robust estimation of algal growth in large areas, providing significant advantages in terms of spatial and temporal coverage.
Remote sensing has been used to monitor algal bloom and selected water quality parameters in water bodies [8,9,10,11,12]. However, these methods heavily rely on changes in color for the detection of chlorophyll-a. The traditional remote sensing approach is not suitable for the detection of nutrients, as they do not have spectral signatures. Chlorophyll-a, which indicates the presence of algae, can optically turn watercolor into green or reddish green. Sunlight and temperature, along with the increase in nutrient concentrations, influence algal growth in water bodies [13]. Coastal lagoons are often home to many touristic attractions, which lead to increased anthropogenic activities (i.e., storm water originating from green spaces, wastewater disposal, cruise ships, beach activities) with nutrient pollution, leading to eutrophication.
A related study utilized the combination of the in-situ data and remote sensing images to map chlorophyll-a concentration along the Dubai Creek [14]. Another study presented an empirical model for chlorophyll-a prediction utilizing satellite imagery and a hybrid coordinate ocean numerical model [15]. The study developed a unique method that none of the studies had used for mapping chlorophyll-a using high-resolution images. Matthews (2011) provided a review of different empirical procedures based on remote sensing technologies for accurate algal growth extraction in water bodies [16]. There are different publicly available satellite sensors, including MODIS, MERIS, SeaWiFS, AVHRR and Landsat, for chlorophyll-a detection [17]. MERIS and SeaWiFS are outdated and no longer operational. ESA Sentials and LandSat 8 are now active. However, the spatial and/or temporal resolutions of these sensors make them unsuitable for small size study areas requiring high precision. In recent years, there has been a significant number of studies aimed at developing remote sensing models using Landsat images [18,19,20,21], also in combination with other satellite images [22,23,24,25,26,27]. Even though Landsat-based models are popular, their accuracy is limited due to having a resolution of 30 m. This can be limiting for water bodies with a small surface area and limited water quality monitoring. Even though models related to the prediction of chlorophyll-a are common, the prediction of nutrients in water bodies in the literature is limited. The relationship between nutrient loads and river water quality was explored using Quick Bird imagery [28]. There are other studies that investigated the use of remote sensing to map nutrients in lakes [16,29]. Remote sensing and geographic information systems (GIS) were used to evaluate nonpoint source pollution and were used for the monitoring of water quality [30,31]. Unlike chlorophyll-a-based models, nutrient prediction models are not common and limited in terms of their accuracy for monitoring across the entire area with appropriate spatial and temporal resolution. This is also critical for water bodies with a small number of monitoring locations.
The Dubai Creek in the UAE is a popular tourist destination. It has been affected by a few Algal Blooms (ABs) events, which are believed to have occurred due to anthropogenic activities and poor circulation in the lagoon part of the Creek [32]. Hussein et al. (2017) developed a water quality model in Dubai Creek to investigate the cause of frequent events of ABs [33]. Ali et al. (2016), developed a GIS-based model to evaluate the susceptibility of the creek to eutrophication and, further, to evaluate the variability of water quality in Dubai Creek [34]. The goal of this study is to monitor chlorophyll-a and nutrients in the Dubai Creek. The paper presents a possible new approach using a limited dataset to validate the method. Two models were developed using a Worldview-2 image and in-situ data; one relates spectral-based to in-situ-based chlorophyll-a measurements in the creek, and the second model correlates nutrients (mainly nitrogen and phosphorus) to the spectral-based chlorophyll-a measurements. WorldView-2 images have a high resolution (1.84 m). As a result, the study provides reasonable accuracy for the area. Overall, the study provides a common remote sensing-based model for the prediction of nutrients.
2. Data and Methodology
2.1. Study Area
The study area is the Dubai Creek, which is a tidal saltwater marine intrusion located in the heart of Dubai, separating it into two areas, Deira and Bur Dubai. The Dubai Creek is a 5–8 m deep, 14 km long water body, which has a width that varies from 0.1 km at the mouth to 1.2 km at the lagoon section. The creek is surrounded by urban landscapes and residential areas. The rapid urbanization along the Dubai Creek is believed to be the main cause of organic pollution and eutrophication [32].
2.2. Data
2.2.1. Data Preparation
Two types of data were used in this study; a high resolution WorldView-2 satellite image that was obtained on 24 July 2012, as shown in Figure 1, and water quality quarterly in-situ measurements provided by the Dubai Municipality. Figure 1A shows the location of Dubai within the UAE. Figure 1B shows the location of the Dubai Creek in Dubai, and Figure 1C displays the Dubai Creek on the georeferenced WorldView-2 image used in the study as well as the locations of the water quality monitoring stations. Figure 1D shows the location and the names of the monitoring stations. Water quality data were collected using multi-parameter sondes and grab samples at a depth of approximately 1 m. The chlorophyll-a was measured based on fluorometric methods using sonde (Method 100,200 H) once every 30 min (Standard Method). Grab samples were used to test orthophosphate (Method 4500 P), nitrate (Method 4500 NO3−) and total nitrogen (Method 4500 N) on a quarterly basis [35]. WorldView-2 imagery consists of one panchromatic and eight multispectral bands, which are used for enhanced spectral analysis. Table 1 shows the characteristics of the eight bands of WorldView-2 satellite imagery. The chlorophyll-a quarterly in-situ measurements were interpolated in order to estimate chlorophyll-a values in the creek at the image acquisition time, due to unavailability of chlorophyll-a data at that time.
2.2.2. In-Situ Data
The Dubai Municipality collects water quality data regularly at ten monitoring/sampling stations along the Dubai Creek (Figure 1). The in-situ measurements include chlorophyll-a, in addition to nitrates, orthophosphates, oxygen, turbidity, pH, and salinity, which are considered the critical factors affecting the growth of algae. Two monitoring stations (out of the ten) were excluded because one was located outside the image and the other was located under a bridge.
2.2.3. Landsat ETM+ Images
The limited access to in-situ water quality data (collected by the municipality) resulted in the unavailability of chlorophyll-a data at the WorldView-2 image acquisition date, which is 24 July 2012. In order to address this field data limitation, standard Landsat image based models demonstrated a similarity with chlorophyll-a acquired from WorldView-2 images. Landsat 7 Enhanced Thematic Mapper Plus (ETM+) images acquired for the study area on 20 May and 23 July 2012 were obtained from the Nasa Landsat Science website. Since Landsat-7 was launched, it has been used to extract water parameters for inland water bodies through band combinations [23,25,26,27].
The 20 May 2012 image acquisition date is the closest to the Middle of Quarter 2 (Q2) of the field data, which is 15 May. The 23 July 2012 image acquisition date is the closest to the WorldView-2 image date, which is 24 July. The ETM+ imagery, which was launched by NASA in 1999, has seven spectral bands with 30-m resolution. The seven wavelength range of each band is as follows: Band 1: 450–520 nm, Band 2: 520–600 nm, Band 3: 630–690 nm, Band 4: 770–900 nm, Band 5: 1550–1750 nm, Band 6: 10,400–12,500 nm, and Band 7: 2080–2350 nm.
2.3. Methodology
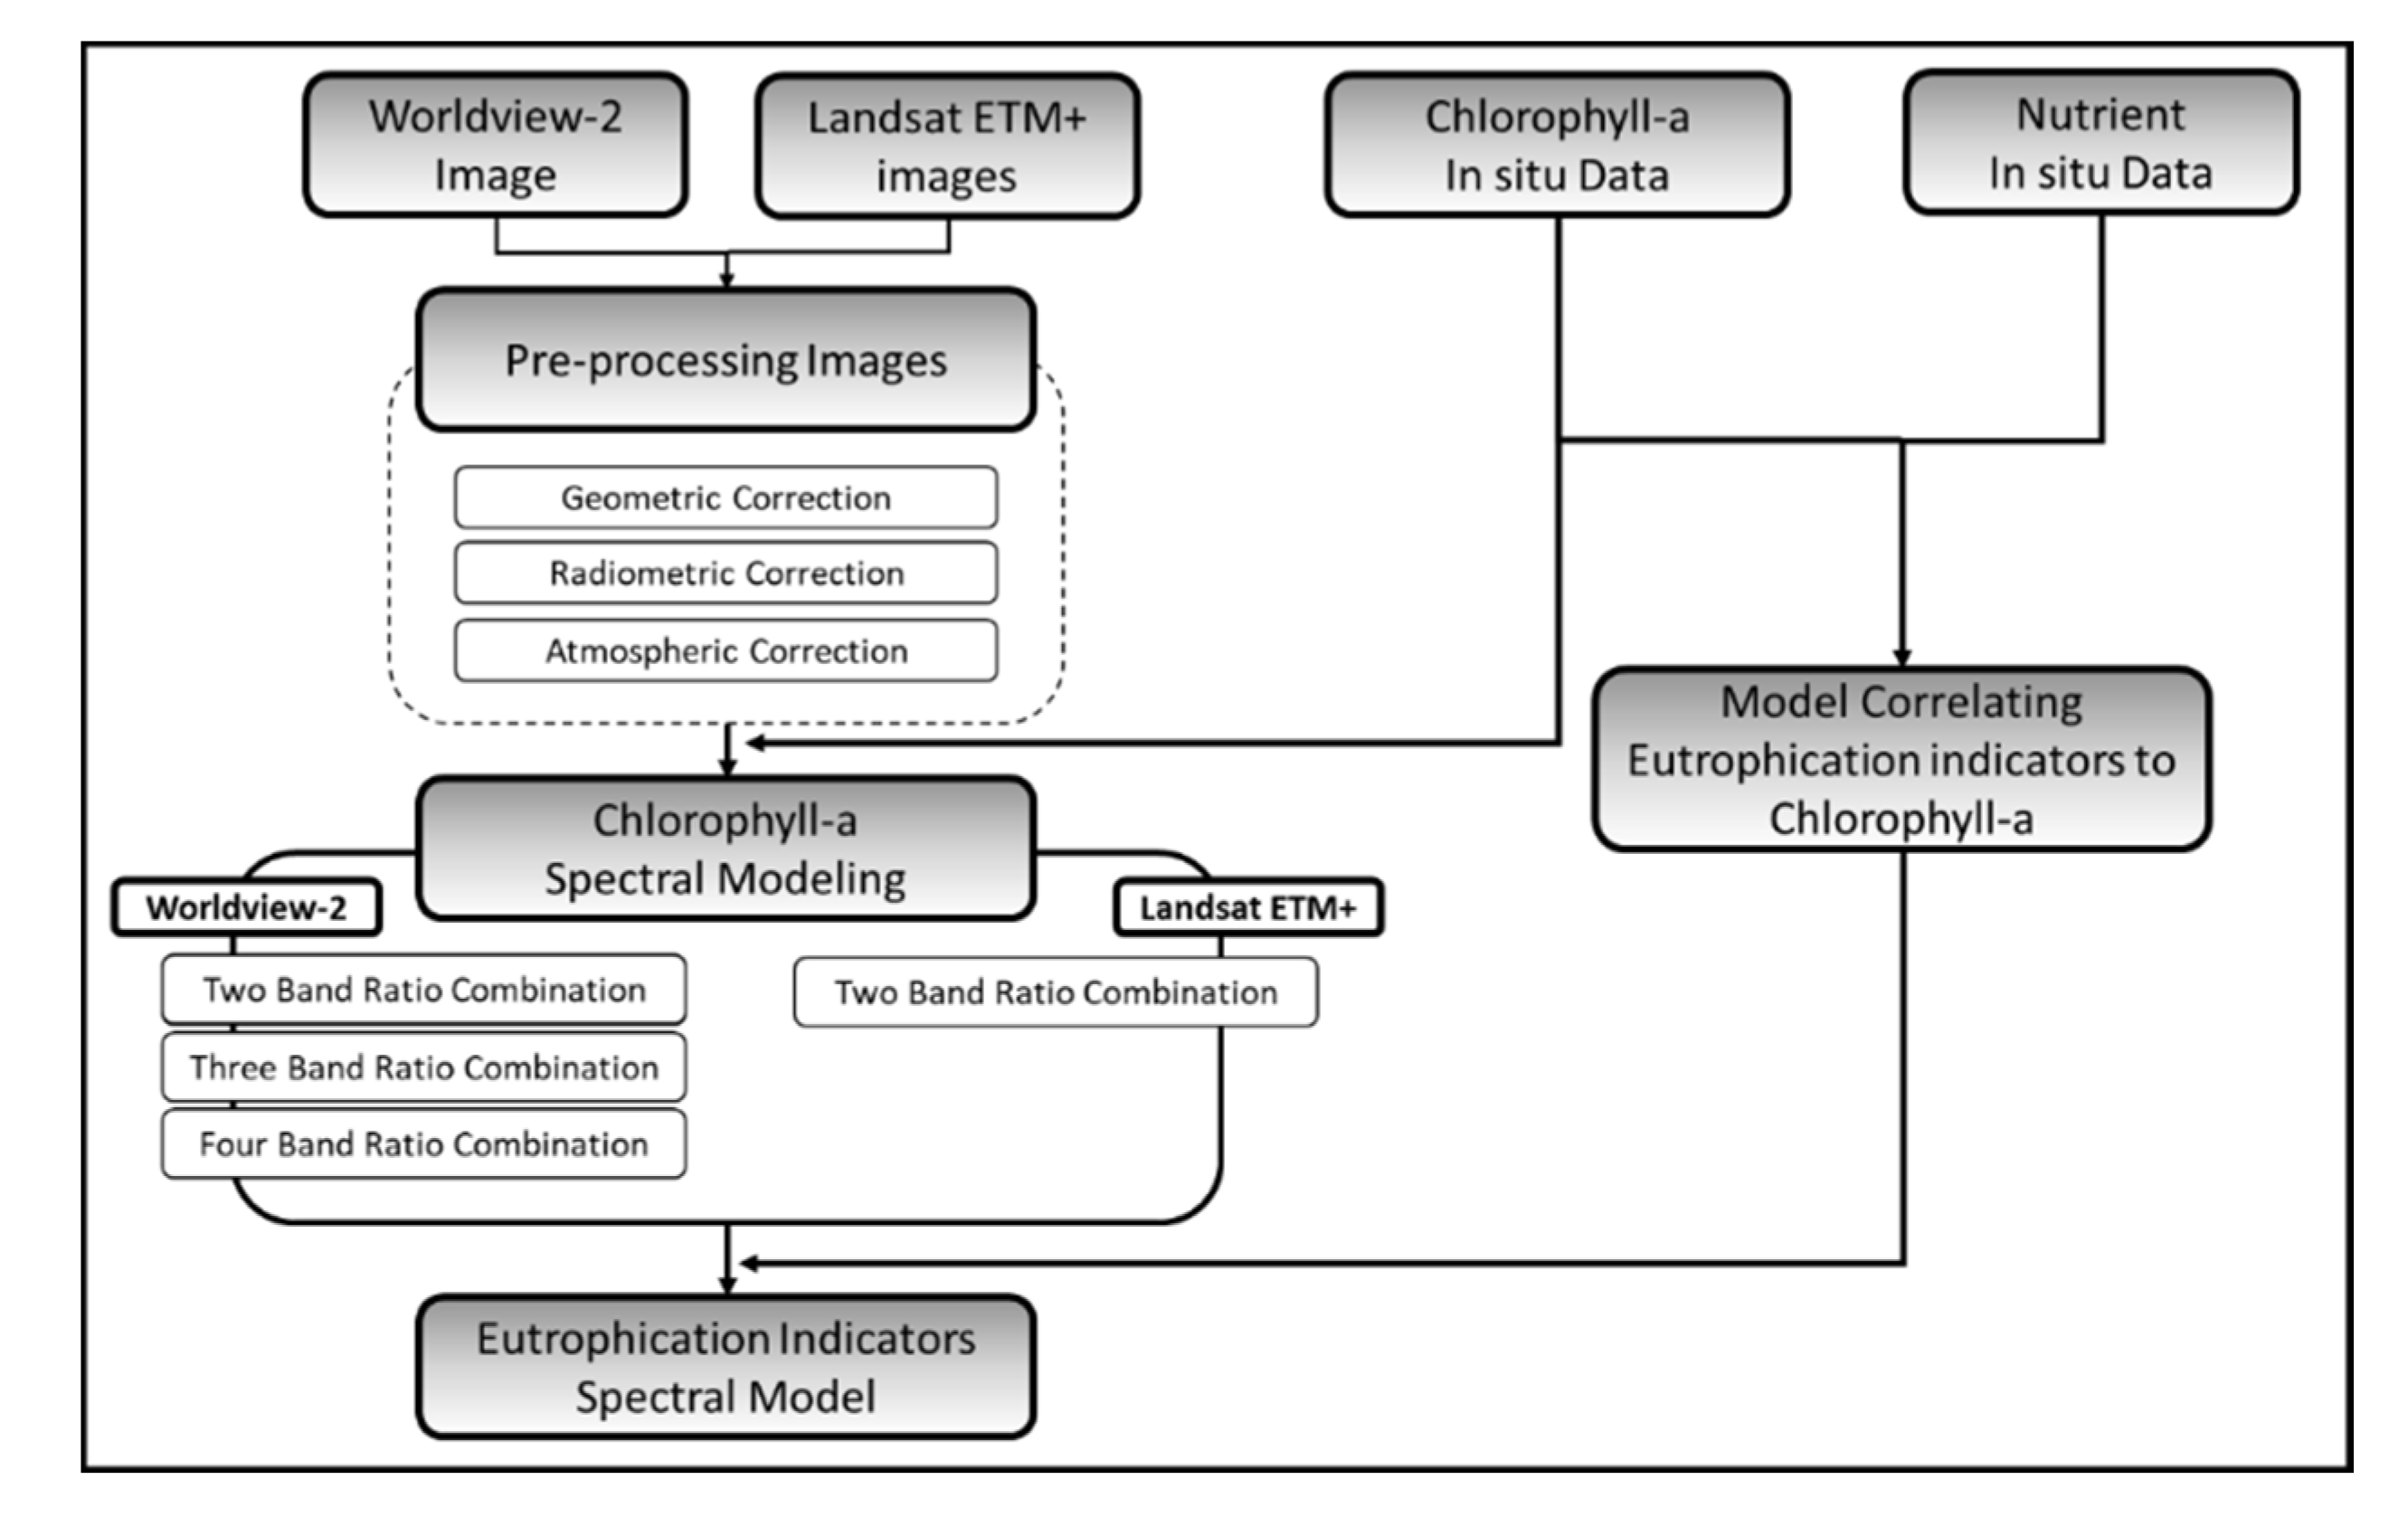
A Band Ratio model was developed to estimate the concentration of chlorophyll-a from the WorldView-2 image, with the intension of validating the model by the interpolated in-situ data and simultaneously correlating it with the eutrophication indicators. As the initial phase of the preprocessing, the image was projected into the Dubai Local Transverse Mercator (DLTM). Then, the radiance values were obtained from the Digital Numbers (DN) values and were further processed for atmospheric correction using the Cosine of the Sun Zenith Angle (COST) algorithm. Figure 2 displays the workflow of the methodology used in this study to produce the eutrophication indicators model.
2.3.1. Preprocessing of WorldView-2 Image and In Situ Data
Before extracting the data from the satellite image, it is essential to apply geometric, radiometric and atmospheric corrections. This ensures the conversion of the pixel values to radiometrically calibrated radiance. A pre-launch radiometric calibration was performed in the sensor to correct the WorldView-2 image since it can be directly converted from DN to Top of Atmosphere (TOA) spectral radiance. In addition, recorded in-situ chlorophyll-a data was interpolated to obtain the values at the image acquisition time, assuming that the mean quarterly value is the best-fit radial point value.
The DN values were derived using the algorithm provided by Digital Globe [36], as shown in Equation (1) below,
where Lλpixel,band is the top of atmosphere spectral radiance for a band, Kband is the absolute radiometric calibration factor, qpixel,band is the radiometrically corrected image pixels, and Δλband is the effective bandwidth for a band.
Lλpixel,band = (Kband × qpixel,band)/Δλband
The atmospheric correction is implemented using the COST method [37]. The mathematical expression of this method is as shown below:
where ρλpixel,band is the atmospherically corrected reflectance, Lλpixel,band is the top of atmosphere spectral radiance, d2ES is the earth–sun distance, and Esunλ, band is the band-averaged solar spectral irradiance.
2.3.2. Model Based on Chlorophyll-a Spectral Value from WorldView-2 Image
The eight bands of the WorldView-2 image were used to develop various combinations of band ratios including two, three, and four band ratios for the spectral reflectance and these were assessed with respect to the in-situ measurements of chlorophyll-a data. The correlation between the spectral model and the in-situ measurements were evaluated using the R-squared values.
2.3.3. Preprocessing of Landsat ETM+ Images
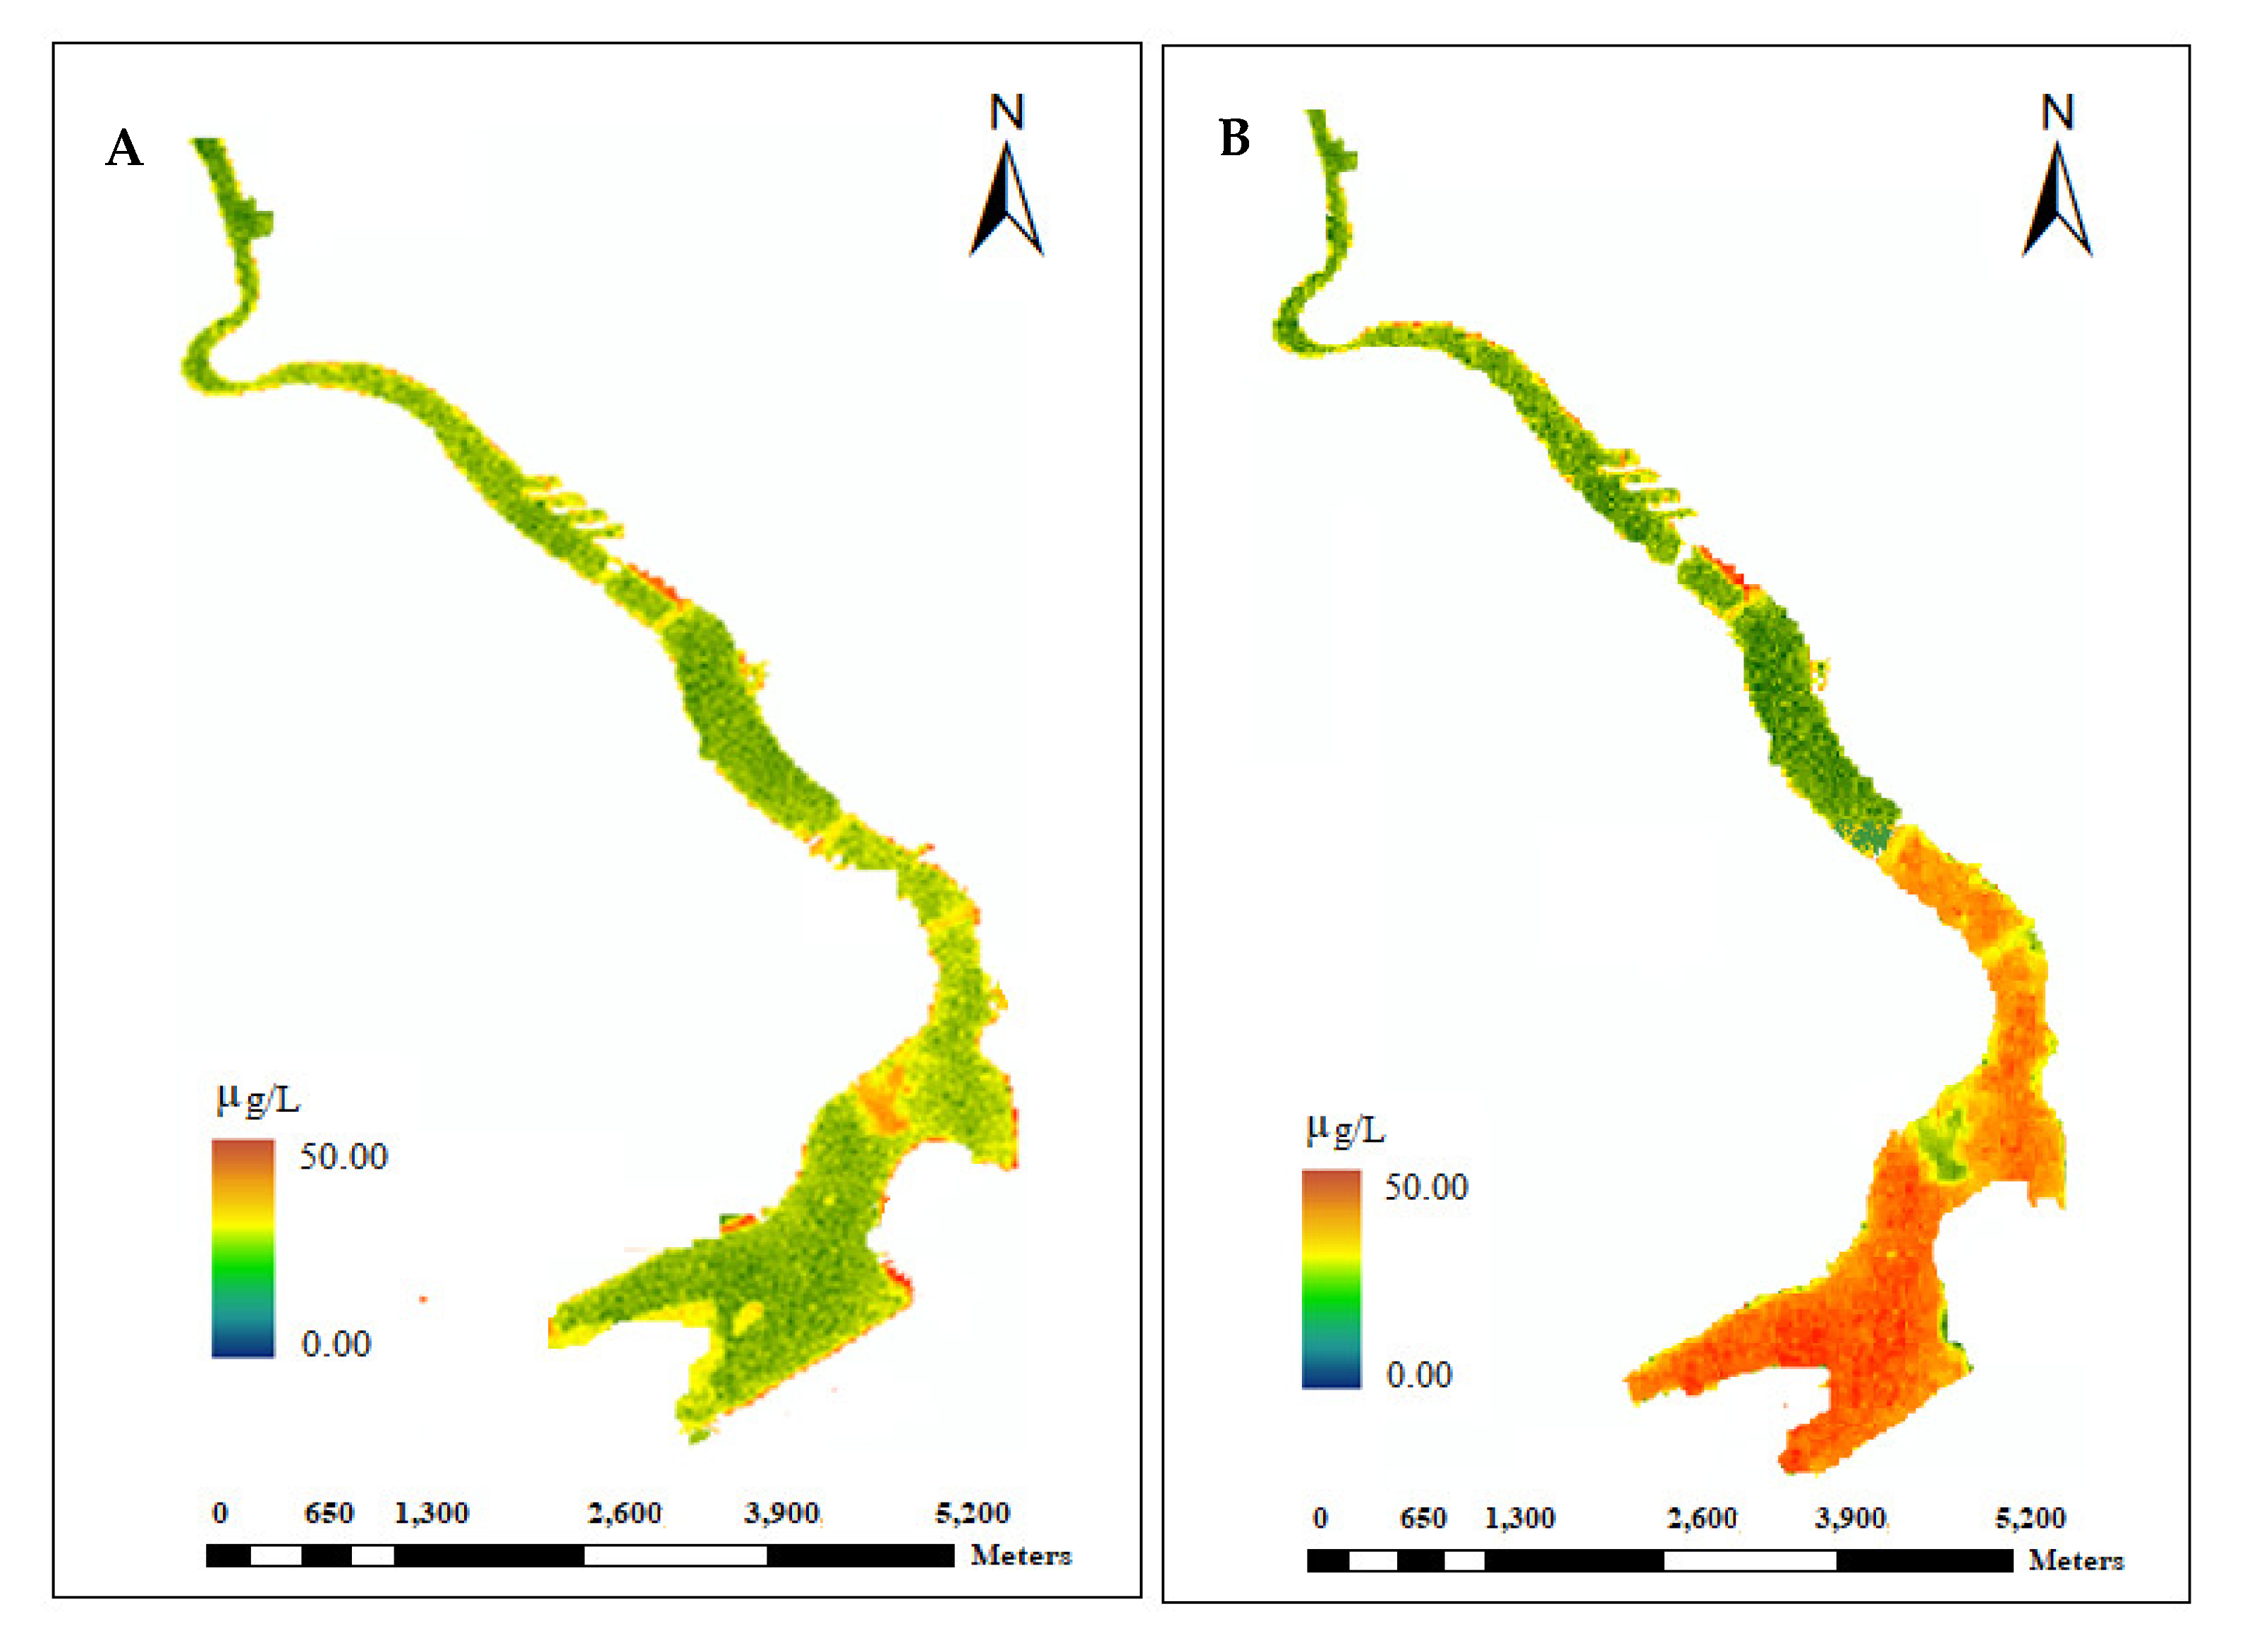
To process the 20 May 2012 ETM+ image, a band ratio of Band 4/Band 3 was used to derive chlorophyll-a following Tebbs et al. (2013) using the Top of Atmosphere (TOA) reflectance of the two bands [25] (Figure 3A). The empirical relationship between the spectrally derived chlorophyll-a values and the field chlorophyll-a values of Quarter 2 produced an R2 value of 0.78 and standard error of 11.6 μg/L. Note that the authors assumed the field chlorophyll-a values of Quarter 2 are the values at the 5 monitoring stations on 15 May 2012; the middle of Quarter 2. Then, a chlorophyll-a map was derived from the 23 July ETM+ image using the same band ratio method stated above by applying the TOA reflectance values (Figure 3B).
A residual map (Figure 4) was created by subtracting the chlorophyll-a map derived from the WorldView-2 image of 24 July (to be presented in the results) from the one created from the ETM+ image of 23 July. The residual map chlorophyll-a values ranged from −3.75 µg/L to 8.33 µg/L, which is acceptable given the value of the standard error (11.6 μg/L) of the empirical relationship between the spectrally derived chlorophyll-a values (ETM+ image of 20 May) and the field chlorophyll-a values of Quarter 2. The results indicate that the approach used for chlorophyll-a estimation using the WorldView-2 image can be reliable.
2.3.4. Modelling the Field Chlorophyll-a against Nutrients
Eutrophication parameters including the concentration of the total nitrogen, orthophosphates, oxygen and salinity were used in relation to the developed regression model. The resulting model was investigated with respect to one, or a ratio of two, of the above parameters against chlorophyll-a. Interpolated in-situ chlorophyll-a data was used in contrast to the indicators of eutrophication, incorporating salinity, dissolved oxygen, total nitrogen, orthophosphates or any developed ratio among two parameters in Quarter 2, 2012. The obtained results were assessed and the one with the highest R-squared value was chosen to correlate with the derived spectral chlorophyll-a model.
3. Results and Discussion
Based on the obtained R-squared values shown in Table 2, the developed spectral chlorophyll-a model with three-band ratios; (Coastal blue + Near infrared 1)/Near infrared 2 was found to be most accurate. Table 2 and Figure 5 show the different band combinations investigated in this study and the R-squared values of the models of these band combinations and the in-situ chlorophyll-a data. The model with the highest R-squared value (0.83) combines the Coastal Blue band and the two near infrared bands of the Worldview-2 image. The R-squared value obtained in this study is comparable to that obtained in previous studies [36,37]. In addition, the selected model also demonstrated the lowest Root Mean Square Error (RMSE) value among all the models. Table 3 shows the spectral chlorophyll-a values obtained with the model above, the in-situ values, and the percentage residual considering all eight monitoring stations in the study area.
The lowest percent errors were obtained at the Jaddaf and the Creek Mouth stations (Table 3). Abra station showed the highest difference, of 10.37 µg/L, among all the stations. It is evident that this location had low chlorophyll-a concentration (less than 20 µg/L) in the creek, while the anthropogenic activities along this segment of the creek caused a high concentration value for chlorophyll-a (in the range of 20–40 µg/L). In fact, the lagoon area of the creek that showed the highest concentration with the range of 30–50 µg/L due to the poor circulation and flushing of water, was mostly influenced by the effluents from the nearby waste water treatment plant. However, the recent modifications in the Dubai Creek geometry may help in improving the quality of the water.
The minimum mean threshold value for chlorophyll-a stated by the Organization of Economic Operation and Development (OECD) is 8 µg/L [38,39,40]. As shown in Table 4, the average concentration of chlorophyll-a in 2010 is below the OECD threshold [40]. However, the average values in both 2011 and 2012 exceeded the minimum threshold value and reached 20.86 and 17.64 µg/L, respectively. Moreover, it is evident that the changing pattern in 2011 has increased significantly by 200%, proceeded by a slight fluctuation of about 15% in 2012. Figure 6 shows the spectral chlorophyll-a map of the Dubai Creek. The model has indicated low chlorophyll-a values for Creek Mouth station, consistent with the in situ data. In addition, consistent with the in situ data, spectral chlorophyll-a levels were high in all the stations around the lagoon area. However, spectral chlorophyll-a values were underestimated around Floating Bridge station.
3.1. Relationship between In-Situ Chlorophyll-a and the Eutrophication Indicators
The spectral chlorophyll-a model of the band combination (CB + NIR1)/NIR2, which gave the highest R-squared value (0.83), was used to compute chlorophyll-a values at the locations of the monitoring stations. The spectral chlorophyll-a values estimated with this model were plotted versus TN/P, P/Salinity, Salinity, Orthophosphates, and TN/salinity and linear regression models were developed as shown in Figure 7. Note that the model for the log (total nitrogen/orthophosphates) presented high correlation with the in-situ chlorophyll-a measurement as shown in Figure 7A, which illustrates the relationship between the level of total nitrogen and the orthophosphate. Further, this represents the fluctuation of the levels of orthophosphate and total nitrogen that would not influence the proliferation of chlorophyll-a. Therefore, high amounts of total nitrogen or orthophosphates will not necessarily increase algal growth, which depends on both parameters as limiting nutrients [41].
The pollution of water bodies with orthophosphate occurs mainly due to anthropogenic activities, whereas nitrogen pollution occurs due to additional factors, including nearby vegetation. Al Awir wastewater treatment plant, which is located near the lagoon part, discharges part of its treated wastewater (nitrogen rich) into the creek, since this plant does not treat nitrogen, as the treated wastewater is used for growing landscapes in Dubai. In addition, nitrogen-rich fertilizers are used in the nearby green areas, which are believed to cause nitrogen pollution in the creek through the storm water runoff. Figure 7B demonstrates the impact of salinity on algal growth. Hakanson and Eklund [42] found a similar relationship between salinity, phosphate and chlorophyll-a as shown in Figure 7C. Figure 7D illustrates the relationship between orthophosphates and chlorophyll-a, which suggests that orthophosphate is the limiting nutrient in this case. This explains the weak correlation between total nitrogen and chlorophyll-a in the Creek. Notably, the relationship between the in-situ and modelled TN-P ratio (Figure 8) seems to be weak, which is in agreement with others [42].
The following model, which provided the highest R-squared value, was further analyzed,
where TN is the Total Nitrogen (mg/L), P is the Orthophosphate (mg/L), and chl-a is the Chlorophyll-a (µg/L).
Log (TN/P) = −0.388 × log (chl-a) + 1.6982
3.2. Relationship between Spectral Chlorophyll-a and the Eutrophication Indicators
Equation (3) was applied to the spectral chlorophyll-a map presented in Figure 4, which was developed according to Equation (4),
where CB is the reflectance of Coastal Blue, and NIR1 and NIR2 are the Near Infra-Red spectral bands 1 and 2 of the WorldView-2 image.
Spectral Chlorophyll-a = 243.06 × ((CB + NIR1)/NIR2) – 429.6
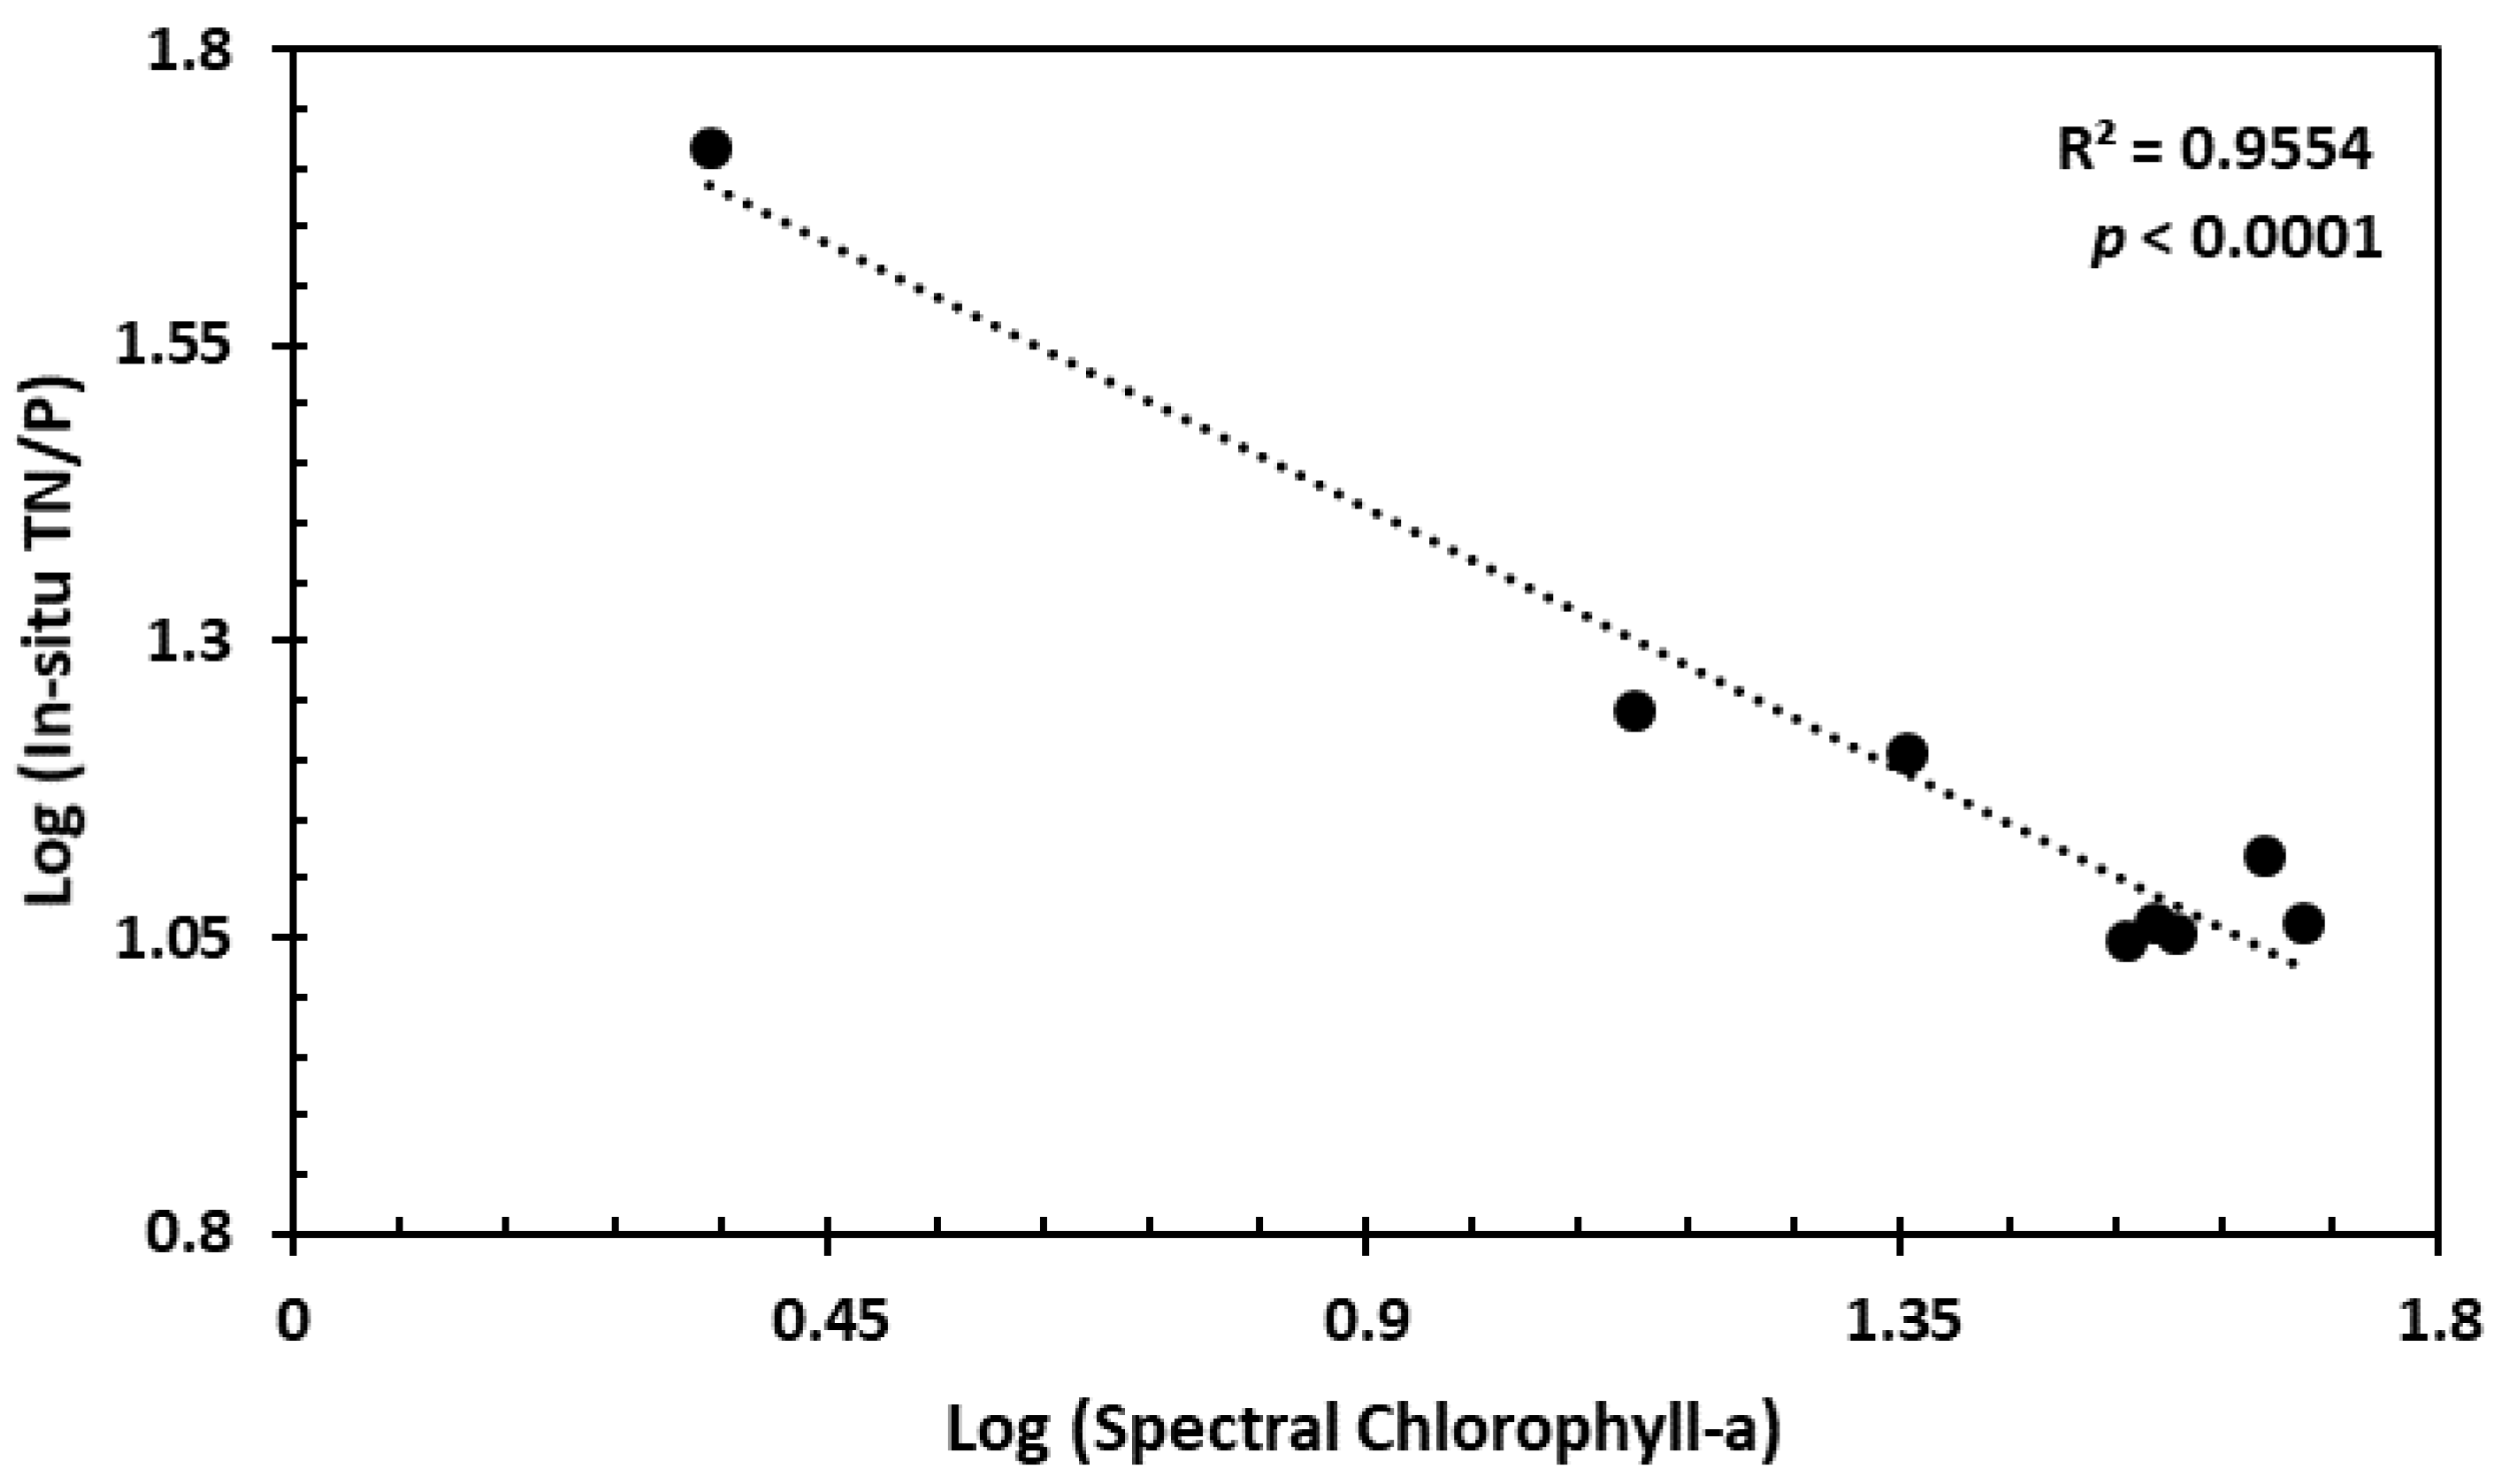
The following observations can be made from the map in Figure 6 (A) Chlorophyll-a values less than 10 µg/L are noticed in the same part of the creek mentioned above. (B) The TN/P ratio in the northern part of the creek is mostly in the range of 15–40, which matches the chlorophyll-a values. These correspond to the high TN/P values at the edges of the creek as illustrated in Figure 6B. The TN/P values in the creek’s lagoon section are mostly in the range of 11–15, while they are smaller around some of the edges of the creek’s lagoon part. This matches the chlorophyll-a levels in that part of the creek, which are generally higher than 30 µg/L. At the edges of the lagoon part, the TN/P values are lower than the middle of the lagoon, which illustrates high chlorophyll-a levels due to the effluent from the Al Awir sewage treatment plant at that location. In addition, this part of the creek is characterized by poor flushing. The log of spectral chlorophyll-a against the log of the in-situ TN/P model shown in Figure 9 produced a 0.95 R-squared value, which indicates high correlation compared to that of the log of in-situ chlorophyll-a, which produced 78%. The big difference in correlation could be due to the in-situ chlorophyll-a values at the Creek Mouth and Dhow Wharfage stations, which are considered outliers, as shown in Figure 7A. Due to the difference between the values of the spectral and in-situ chlorophyll-a values at the monitoring stations, these two outliers happened to be closer to the regression line in Figure 9.
4. Conclusions
In this research, a WorldView-2 satellite image was used to derive chlorophyll-a values in the Dubai Creek, in Dubai, UAE. Due to the time lag between in-situ data and satellite images, standard Landsat image-based models were used to demonstrate the accuracy of the proposed WorldView-2-based model. The authors were able to estimate chlorophyll-a concentration with an R-squared value of 0.82 through a model developed by combining two Near Infrared bands in the satellite image. It was found that the estimated chlorophyll-a values exceed the limits set by local authorities, especially in the lagoon part. The observed algal growth is believed to be the result of anthropogenic activities in the area and the discharge from a nearby sewage treatment plant. Moreover, a model was developed using regression analysis to study the relationships between eutrophication indicators and chlorophyll-a. The relationship between total nitrogen–phosphorus ratio and chlorophyll-a illustrated the vital role of nutrients in the eutrophication process. This was evident because of the high correlation (R-squared value of 0.79) between TN/P and chlorophyll-a. The TN/P values for each pixel in the area of interest were acquired by the spectral chlorophyll-a values of this model. The TN/P ratios map for the creek significantly correlated with the chlorophyll-a distribution. Anthropogenic activities and poor flushing resulted in lower TN/P ratios and higher chlorophyll-a concentration in the lagoon part compared to the upper part of the creek. The two models developed in this study showed strong correlation between the spectral characteristics of the water column used to estimate chlorophyll-a and the corresponding nutrient contents.
Author Contributions
Conceptualization, M.M., T.A., A.B., A.E., and M.A.; Data curation, M.M., T.A., A.B., A.E., and M.A.; Funding acquisition, M.M., T.A., and M.A.; Writing—original draft, M.M., T.A., A.B., A.E., and M.A.; Writing—review & editing, M.M., T.A., A.B., A.E., and M.A.. All authors have read and agreed to the published version of the manuscript
Funding
This research was funded by the faculty research grant from the American University of Sharjah, FRG14-2-16.
Acknowledgments
The authors would like to acknowledge the support of the American University of Sharjah. The authors would also like to acknowledge the Dubai Municipality for supporting this study by providing the water quality monitoring data.
Conflicts of Interest
The authors declare no conflict of interest.
References
- Napiorkowska-Krzebietke, A.; Kalinowska, K.; Bogacka-Kapusta, E.; Stawecki, K.; Traczuk, P. Cyanobacterial Blooms and Zooplankton Structure in Lake Ecosystem under Limited Human Impact. Water 2020, 12, 1252. [Google Scholar] [CrossRef]
- Gao, N.; Ma, Y.; Zhao, M.; Zhang, L.; Zhan, H.; Cai, S.; He, Q. Quantile Analysis of Long-Term Trends of Near-Surface Chlorophyll-a in the Pearl River Plume. Water 2020, 12, 1662. [Google Scholar] [CrossRef]
- Putri, M.S.A.; Lin, J.; Hsieh, L.C.; Zafirah, Y.; Andhikaputra, G.; Wang, Y. Influencing Factors Analysis of Taiwan Eutrophicated Reservoirs. Water 2020, 12, 1325. [Google Scholar] [CrossRef]
- Banda, T.D.; Kumarasamy, M. Application of Multivariate Statistical Analysis in the Development of a Surrogate Water Quality Index (WQI) for South African Watersheds. Water 2020, 12, 1584. [Google Scholar] [CrossRef]
- Carvalho, R.C.D.; Paco, T.; Branquinho, C.; Silva, J.M.D. Using Chlorophyll a Fluorescence Imaging to Select Desiccation-Tolerant Native Moss species for Water-Sustainable Green Roofs. Water 2020, 12, 1748. [Google Scholar] [CrossRef]
- Brito, D.; Neves, R.; Branco, M.A.; Prazeres, A.; Rodriques, S.; Concalves, M.C.; Ramos, T.B. Assessing Water and Nutrient Long-Term Dynamics and Loads in the Enxoe Temporary River Basin (Southeast Portugal). Water 2019, 11, 354. [Google Scholar] [CrossRef] [Green Version]
- Abdelmalik, K. Role of statistical remote sensing for Inland water quality parameters prediction. Egypt. J. Remote Sens. Space Sci. 2018, 21, 193–200. [Google Scholar] [CrossRef]
- Zhu, Z.; Zhou, Y.; Seto, K.; Stokes, E.; Deng, C.; Pickett, S.; Taubenbock, H. Understanding an urbanizing planet: Strategic directions for remote sensing. Remote Sens. Environ. 2019, 228, 164–182. [Google Scholar] [CrossRef]
- Li, J.; Tian, L.; Song, Q.; Sun, Z.; Yu, H.; Xing, Q. Temporal Variation of Chlorophyll-a Concentrations in Highly Dynamic Waters from Unattended Sensors and Remote Sensing Observations. Sensors 2018, 18, 2699. [Google Scholar] [CrossRef] [Green Version]
- Blix, K.; Palffy, K.; Toth, V.R.; Eltoft, T. Remote Sensing of Water Quality Parameters over Lake Balaton by Using Sentinel-3 OLCI. Water 2018, 10, 1428. [Google Scholar] [CrossRef] [Green Version]
- Lins, R.C.; Martinez, J.M.; Marques, D.D.M.; Cirilo, J.A.; Fragoso, C.R. Assessment of Chlorophyll-a Remote Sensing Algorithms in Productive Tropical Estuarine-Lagoon System. Remote Sens. 2017, 9, 516. [Google Scholar] [CrossRef] [Green Version]
- Arabi, B.; Salama, M.S.; Wernand, M.R.; Verhoef, W. MOD2SEA: A coupled Atmosphere-Hydro-Optical Model for the Retrieval of Chlorphyll-a from Remote Sensing Observations in Complex Turbid Water. Remote Sens. 2016, 8, 722. [Google Scholar] [CrossRef] [Green Version]
- Gittings, J.; Raitsos, D.; Racault, M.; Brewin, R.; Pradhan, Y.; Sathyendranath, S.; Platt, T. Seasonal phytoplankton blooms in the Gulf of Aden revealed by remote sensing. Remote Sens. Environ. 2017, 189, 56–66. [Google Scholar] [CrossRef] [Green Version]
- Richlen, M.; Morton, S.; Jamali, E.; Rajan, A.; Anderson, D. The catastrophic 2008–2009 red tide in the Arabian gulf region, with observations on the identification and phylogeny of the fish-killing dinoflagellate Cochlodinium polykrikoides. Harmful Algae 2010, 9, 163–172. [Google Scholar] [CrossRef]
- Blondeau-Patissier, D.; Gowe, J.; Dekker, A.; Phinn, S.; Brando, V. A review of ocean color remote sensing methods and statistical techniques for the detection, mapping and analysis of phytoplankton blooms in coastal and open oceans. Prog. Oceanogr. 2014, 123, 123–144. [Google Scholar] [CrossRef] [Green Version]
- Matthews, M. A current review of empirical procedures of remote sensing in inland and near-coastal transitional waters. Int. J. Remote Sens. 2011, 32, 6855–6899. [Google Scholar] [CrossRef]
- Kutser, T. Quantitative detection of chlorophyll in cyanobacterial blooms by satellite remote sensing. Limnol. Oceanogr. 2004, 49, 2179–2189. [Google Scholar] [CrossRef]
- Ledesma, M.M.; Bonansea, M.; Ledesma, C.R.; Rodriquez, C.; Carreno, J.; Pinotti, L. Estimation of chlorophyll-a concentration using Landsat 8 in the Cassaffousth reservoir. Water Supply 2019, 19, 2021–2027. [Google Scholar] [CrossRef] [Green Version]
- Boucher, J.; Weathers, K.C.; Norouzi, H.; Steele, B. Assessing the effectiveness of Landsat 8 Chlorophyll a retrieval algorithms for regional freshwater monitoring. Ecol. Appl. 2018, 28, 1044–1054. [Google Scholar] [CrossRef] [Green Version]
- Buditama, G.; Damayanti, A.; Pin, T.G. Identifying Distribution of Chlorophyll-a Concentration Using Landsat 8 OLI on Marine Waters Area of Cirebon. IOP Conf. Ser. Earth Environ. Sci. 2017, 98, 012040. [Google Scholar] [CrossRef]
- Guo, Q.; Wu, X.; Bing, Q.; Pan, Y.; Wang, Z.; Fu, Y.; Wang, D.; Liu, J. Study on Retrieval of chlorophyll-a Concentration Based on Landsat OLI Imagery in the Haihe River, China. Sustainability 2016, 8, 758. [Google Scholar] [CrossRef] [Green Version]
- Podder, S.; Chacko, N.; Swain, D. Estimation of Chlorophyll-a in Northern Coastal Bay of Bengal Using Landsat-8 OLI and Sentinel-2 MSI Sensors. Front. Mar. Sci. 2019, 6, 598. [Google Scholar] [CrossRef]
- Kuhn, C.; Valerio, A.D.M.; Ward, N.; Loken, L.; Sawakuchi, H.O.; Kampel, M.; Richey, J.; Stadler, P.; Crawford, J.; Striegl, R.; et al. Performance of Landsat-8 and Sentinel-2 surface reflectance products for river remote sensing retrievals of chlorophyll-a and turbidity. Remote Sens. Environ. 2019, 224, 104–118. [Google Scholar] [CrossRef] [Green Version]
- Watanabe, F.; Alcantara, E.; Rodriques, T.; Rotta, L.; Bernardo, N.; Imai, N. Remote sensing of the chlorophyll-a based on OLI/Landsat-8 and MSI/Sentinel-2A (Barra Bonita reservoir, Brazil). An. Acad. Bras. Cienc. 2018, 90, 1987–2000. [Google Scholar] [CrossRef] [Green Version]
- Tebbs, E.; Remedios, J.; Harper, D. Remote sensing of chlorophyll-a as a measure of cyanobacterial biomass in Lake Bogoria, a hypertrophic, saline–alkaline, flamingo lake, using Landsat ETM+. Remote Sens. Environ. 2013, 135, 92–106. [Google Scholar] [CrossRef]
- Torbick, N.; Hu, F.; Zhang, J.; Qi, J.; Becker, B. Mapping Chlorophyll-a Concentrations in West Lake, China using Landsat 7 ETM+. J. Great Lakes Res. 2008, 34, 559–565. [Google Scholar] [CrossRef]
- Brezonik, P.; Menken, K.D.; Bauer, M. Landsat-based remote sensing of lake water quality characteristics, including chlorophyll and colored dissolved organic matter (CDOM). Lake Reserv. Manag. 2005, 21, 373–382. [Google Scholar] [CrossRef]
- Zhao, J.; Ghedira, H. Monitoring red tide with satellite imagery and numerical models: A case study in the Arabian Gulf. Mar. Pollut. Bull. 2014, 97, 305–313. [Google Scholar] [CrossRef]
- Ali, T.; Mortula, M.; Atabay, S. Study of water quality in Dubai Creek using DubaiSat-1 multispectral imagery. Commun. Comput. Inf. Sci. 2013, 398, 200–210. [Google Scholar]
- Isenstein, E.; Park, M. Assessment of nutrient distributions in Lake Champlain using satellite remote sensing. J. Environ. Sci. 2014, 26, 1831–1836. [Google Scholar] [CrossRef]
- Oki, K.; Wang, Y.; Oki, T.; Yamashiki, Y.; Takara, K.; Miura, S.; Imai, A.; Komatsu, K.; Kawasaki, N. Analysis of stream water quality and estimation of nutrient load with the aid of Quick Bird remote sensing imagery. Hydrol. Sci. J. 2012, 57, 850–860. [Google Scholar]
- Ali, T.; Mortula, M.; Atabay, S. Monitoring and assessment of water quality of a coastal lake using high resolution imagery and GIS. Pollut. Res. 2017, 36, 8–17. [Google Scholar]
- Hussein, H.; Atabay, S.; Mortula, M.M.; Ali, T. Investigation of Water Quality Parameters for Coastal Lagoon. Pollut. Res. 2017, 37, 25–31. [Google Scholar]
- Ali, T.; Mortula, M.; Atabay, S. GIS-based study on the Susceptibility of Dubai Creek (UAE) to Eutrophication. Pol. J. Environ. Stud. 2016, 25, 2275–2282. [Google Scholar] [CrossRef]
- APHA. Standard Methods for the Examination of Water and Waste Water; American Public Health Association: Washington, DC, USA, 1998; 874p. [Google Scholar]
- Upkide, T.; Comp, C. Radiometric Use of WorldView-2 Imagery. 2010. Available online: https://dg-cms-uploads-production.s3.amazonaws.com/uploads/document/file/104/Radiometric_Use_of_WorldView-2_Imagery.pdf (accessed on 1 November 2019).
- Chavez, P. Image-based atmospheric correction: Revisited and improved. Photogramm. Eng. Remote Sens. 1996, 62, 1025–1036. [Google Scholar]
- Brivio, P.; Giardino, C.; Zilioli, E. Determination of chlorophyll concentration changes in Lake Garda using an image-based radiative transfer code for Landsat TM images. Int. J. Remote Sens. 2001, 22, 487–502. [Google Scholar] [CrossRef]
- Caspers, H. Eutrophication of waters. Monitoring, assessment and control. Organ. Econ. Coop. Dev. 1982, 69, 200. [Google Scholar]
- Dial, G.; Bowen, H.; Gerlach, F.; Grodecki, J.; Oleszczuk, R. The Benefits of the 8 Spectral Bands of WorldView-2. 2010. Available online: http://www.army.mil/article/70358/Nano_technology_marches_ on/ (accessed on 4 March 2020).
- Ali, T.; Mortula, M.; Atabay, S.; Navadeh, E. A GIS-based spatiotemporal study of the variability of water quality in the Dubai Creek, UAE. Water Qual. Res. J. Can. 2015, 51, 219–232. [Google Scholar] [CrossRef] [Green Version]
- Hakanson, L.; Eklund, J. Relationships between chlorophyll, salinity, phosphorus, and nitrogen in lakes and marine areas. J. Coast. Res. 2010, 26, 412–423. [Google Scholar] [CrossRef]
Figure 1.
Study Area and Monitoring Stations: (A) location of Dubai within the UAE, (B) location of the Dubai Creek in Dubai, (C) displays the Dubai Creek on the georeferenced WorldView-2 image used in the study as well as the locations of the water quality monitoring stations, and (D) location and the names of the monitoring stations.
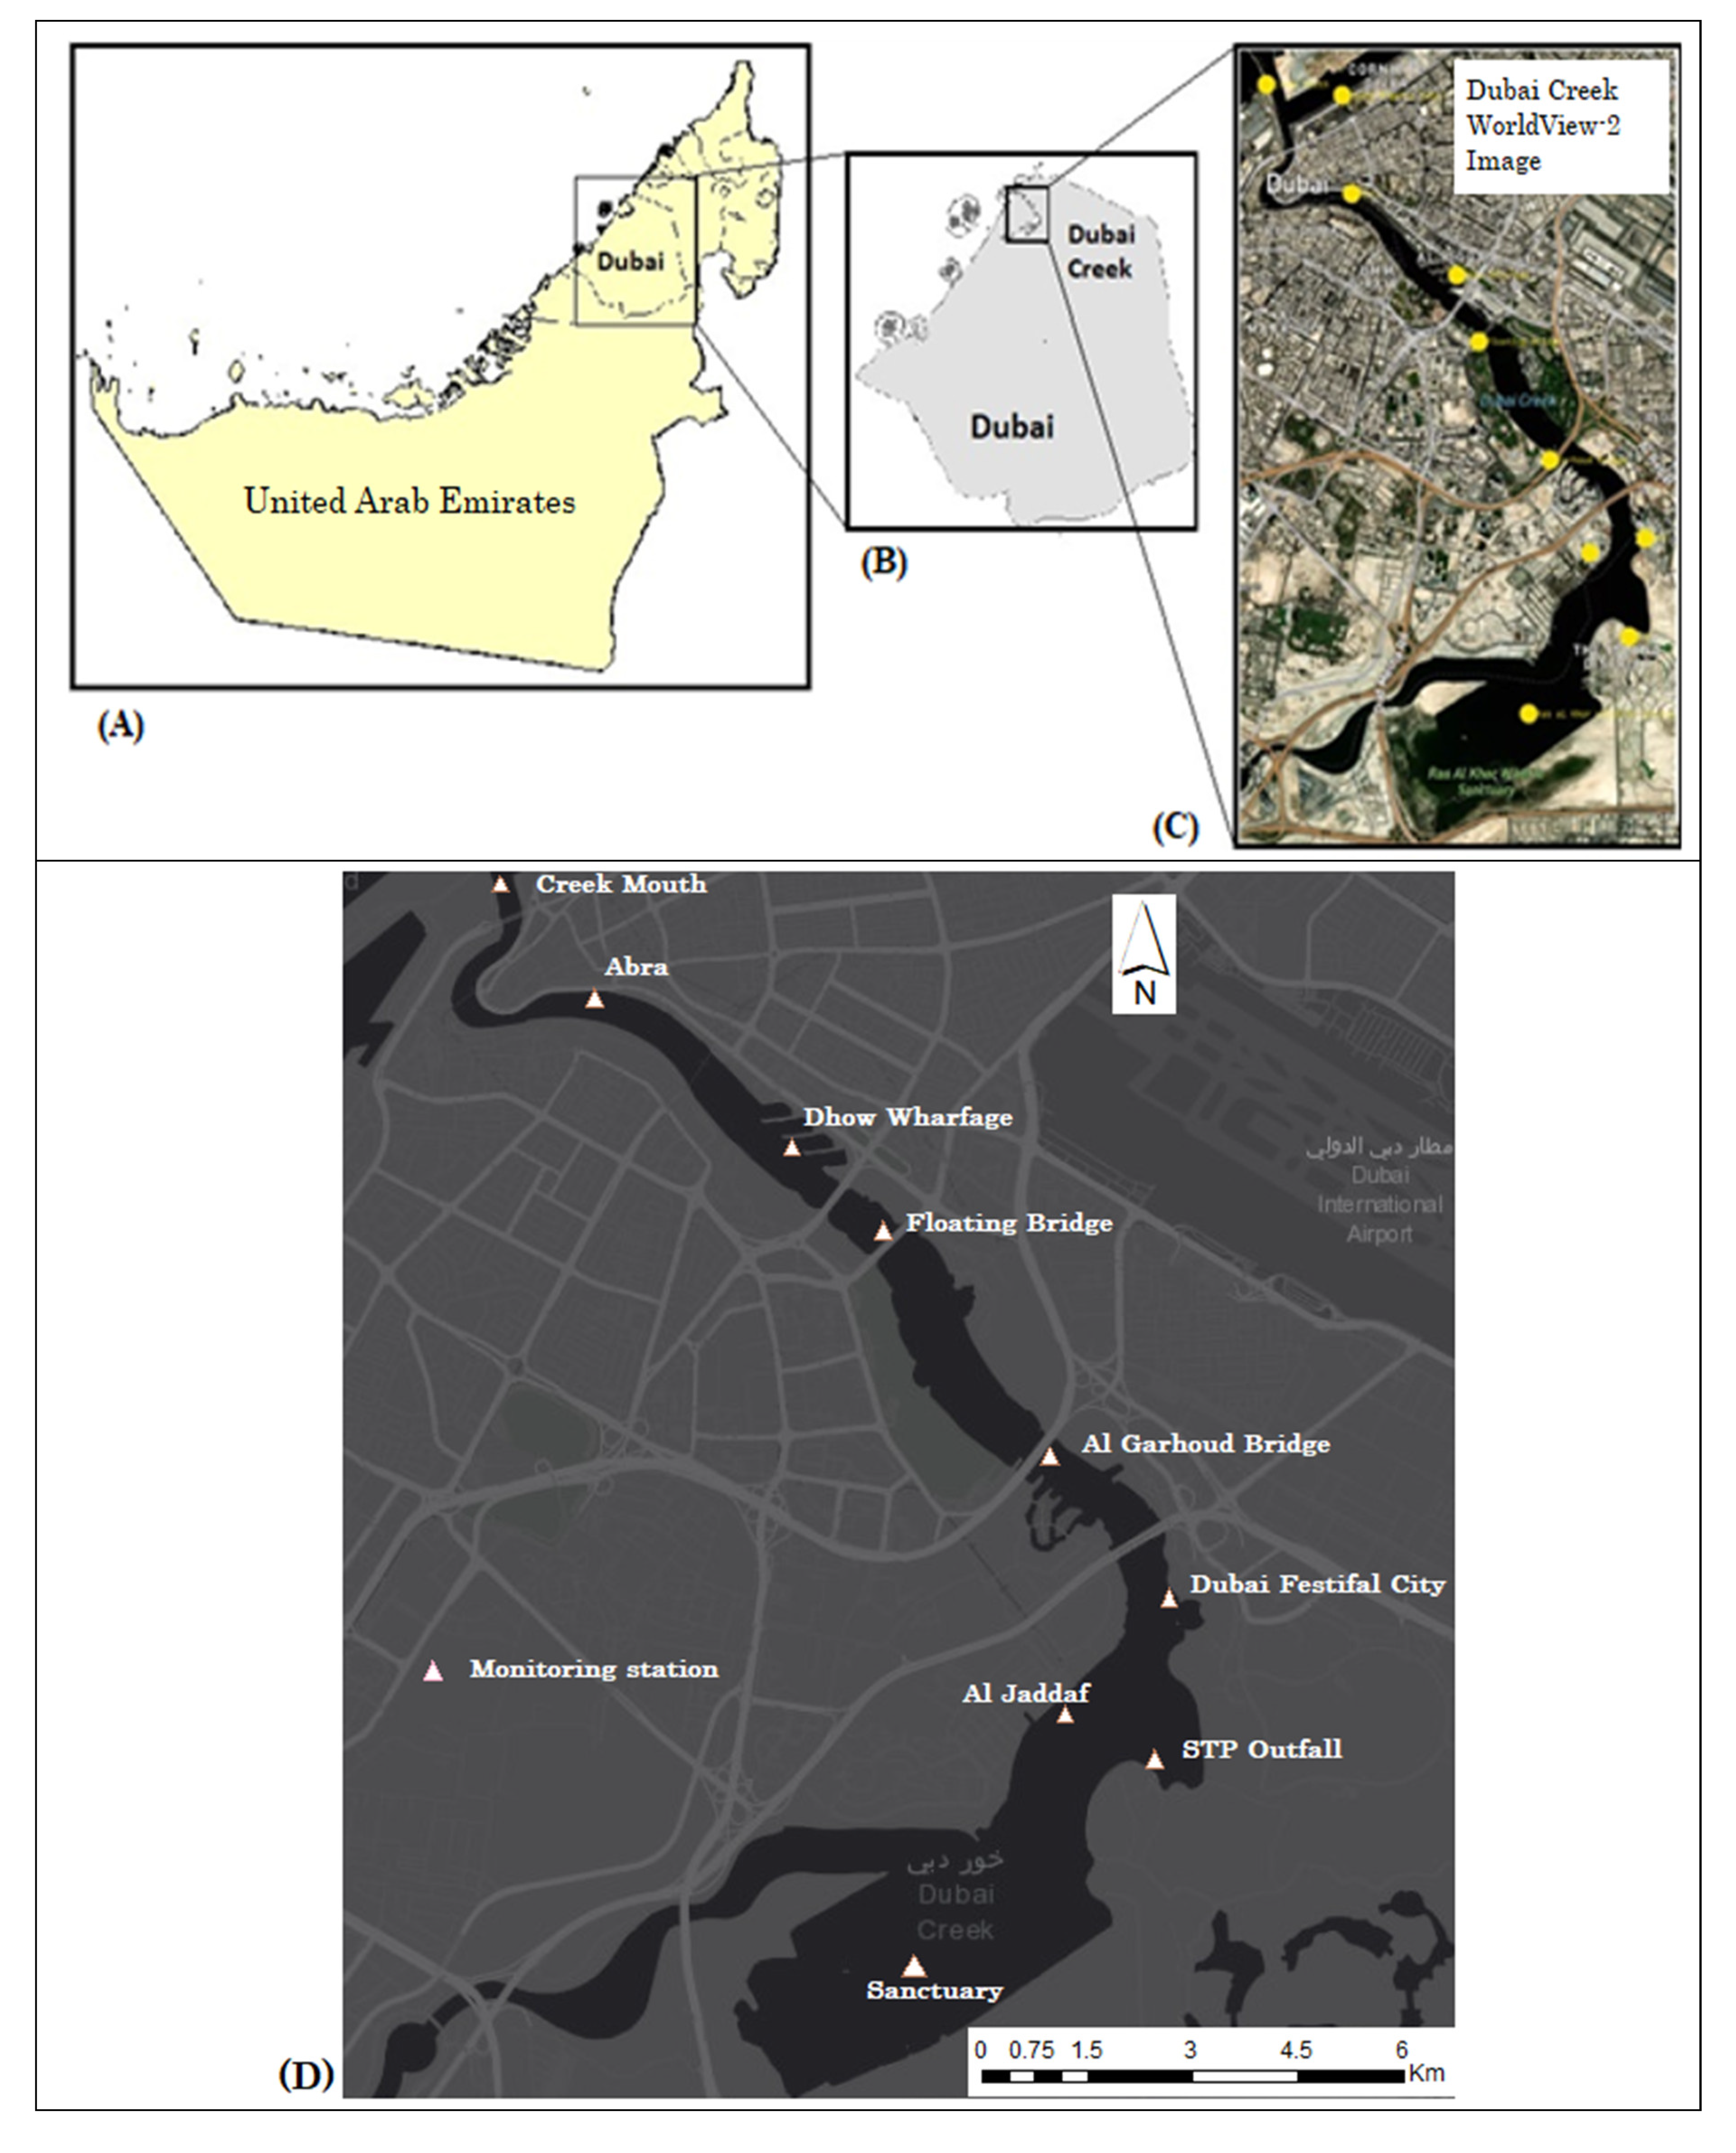
Figure 2.
Main steps of the methodology.

Figure 3.
Chlorophyll-a derived from Landsat 7 ETM+ image of (A) 20 May 2012, (B) 23 July 2012.
Figure 4.
The residual (differences between spectral chlorophyll-a originating from WorldView-2 and Landsat images) map.
Figure 4.
The residual (differences between spectral chlorophyll-a originating from WorldView-2 and Landsat images) map.
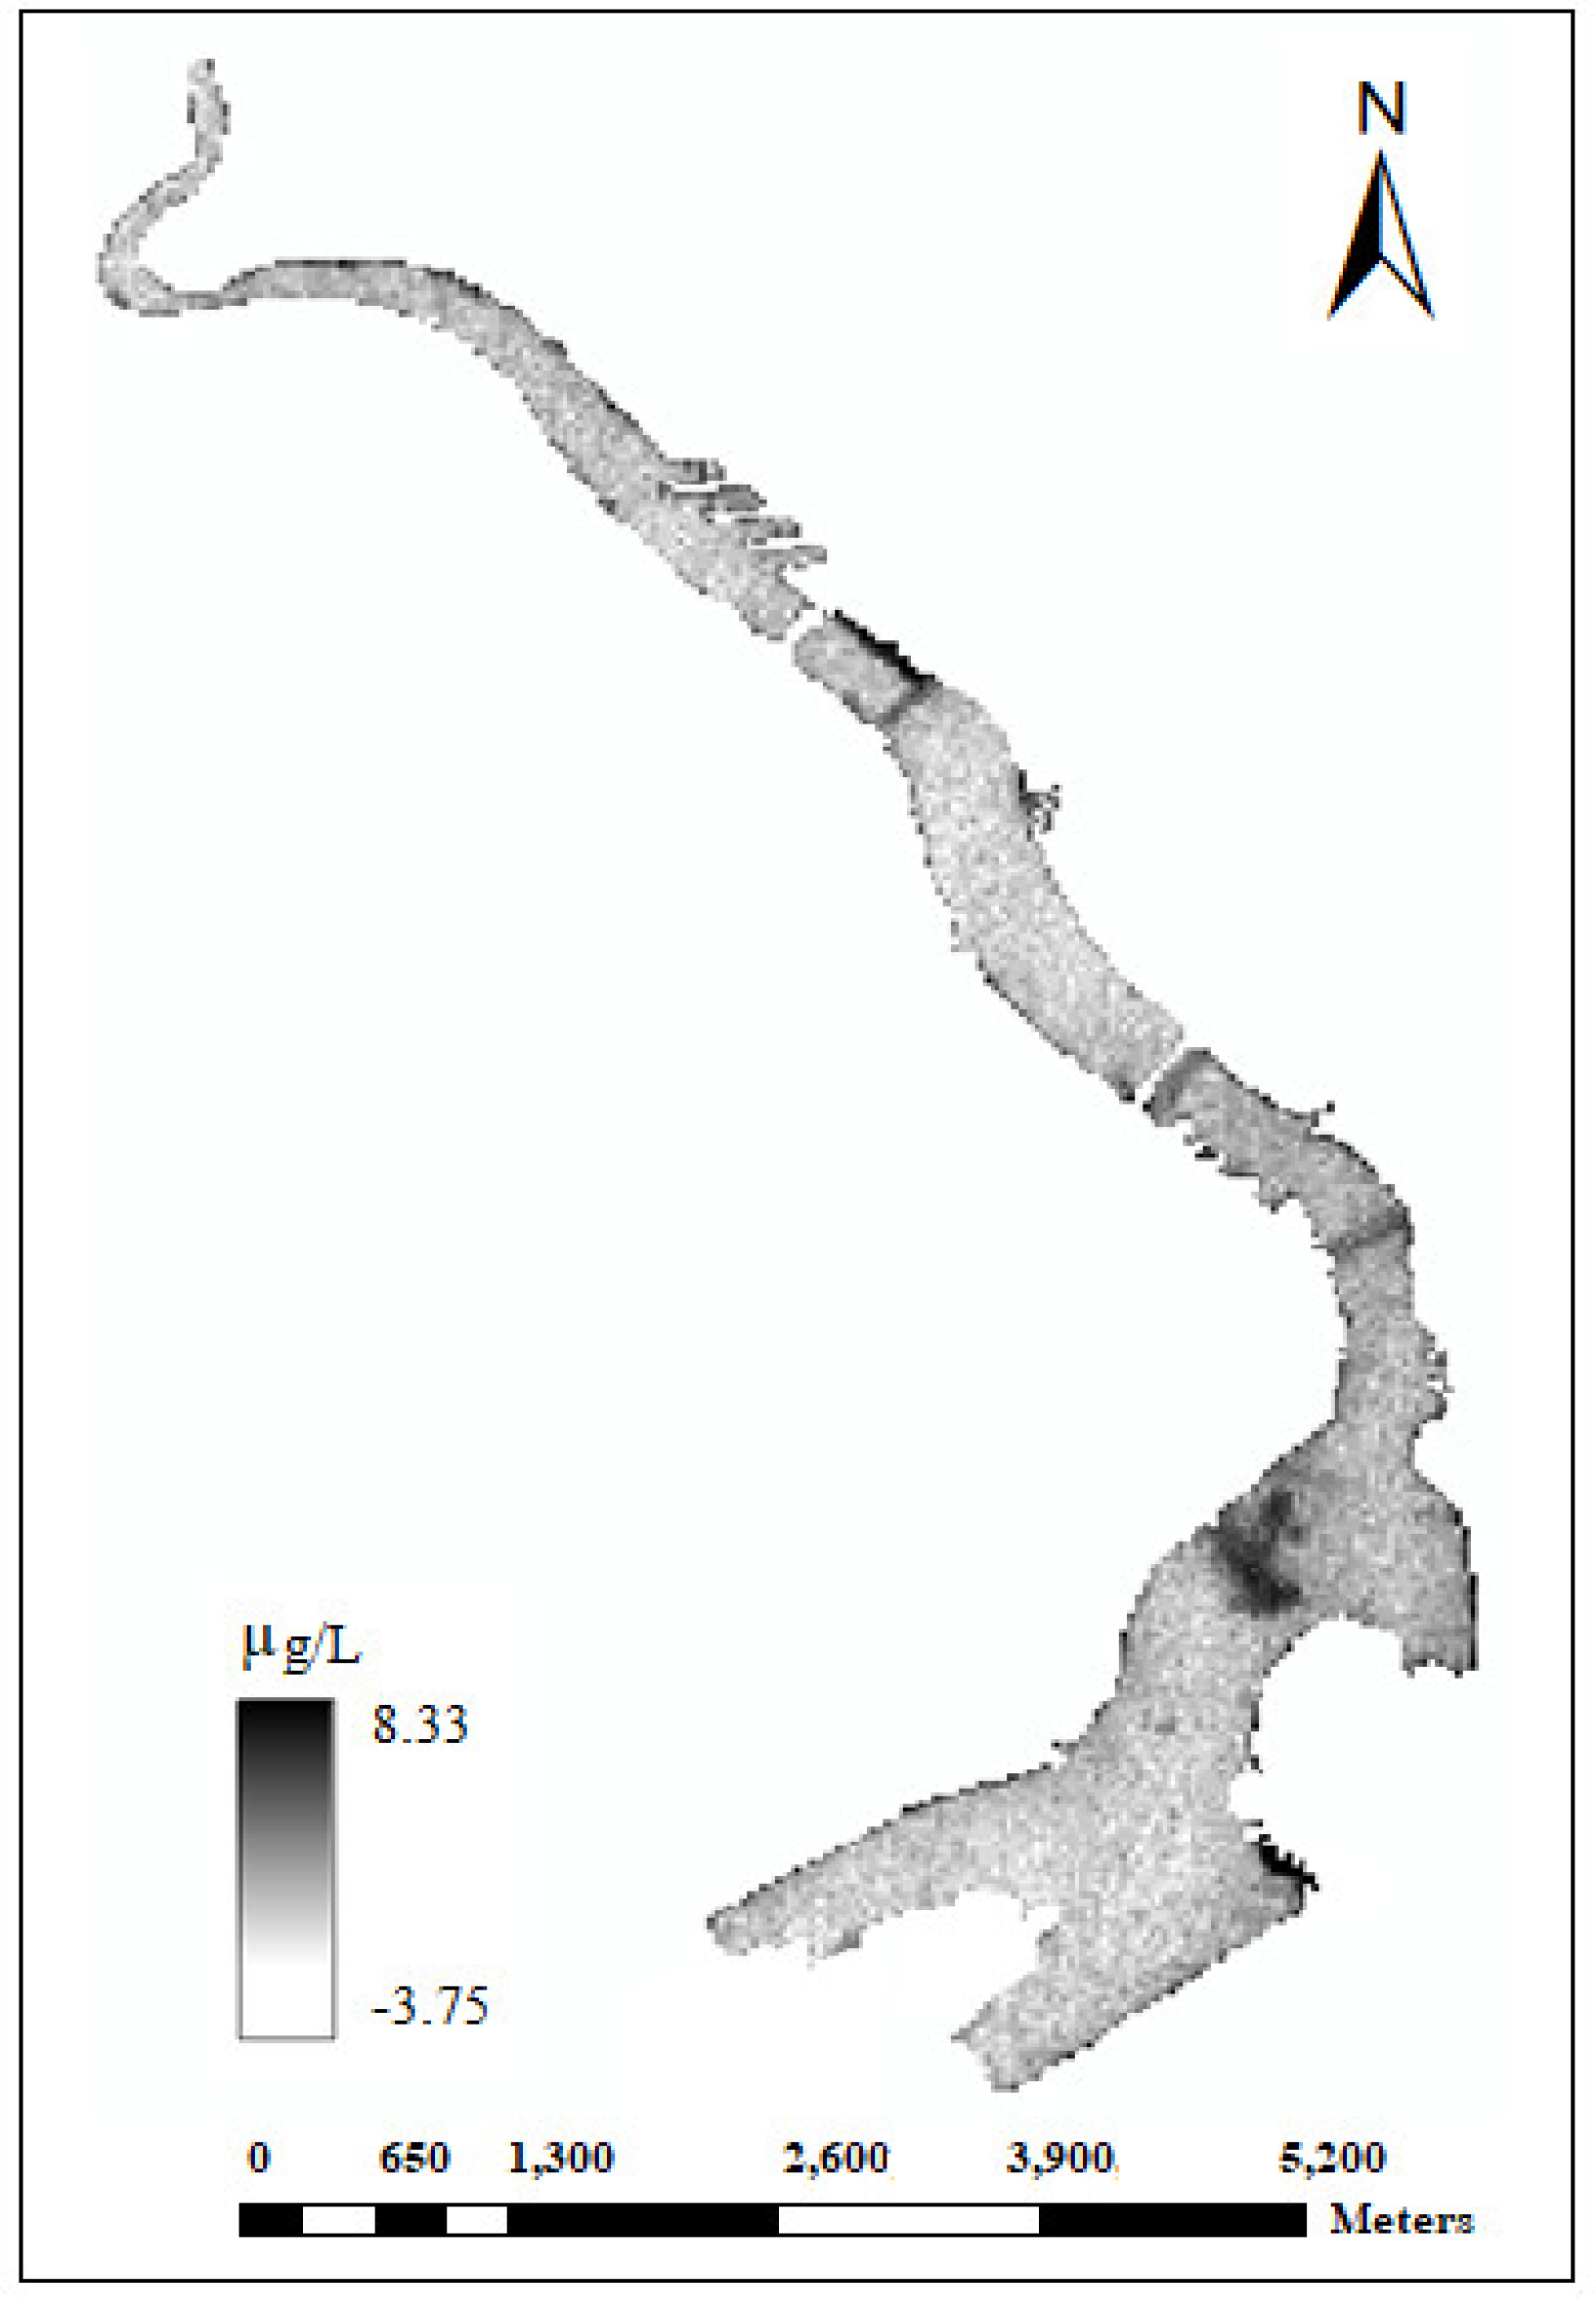
Figure 5.
The correlation between in-situ measurements and the spectral reflectance of chlorophyll-a using the developed models with different band ratios based on WorldView-2 image (A) (CB + NIR1)/NIR2 (CI = 0.0551), (B) (B + NIR1)/NIR2 (CI = 0.0668), (C) (G + NIR1)/NIR2 (CI = 0.0717), (D) (Y + NIR1)/NIR2 (CI = 0.0772), (E) (B + NIR1)/RED (CI = 0.0980). (CI = Confidence interval).
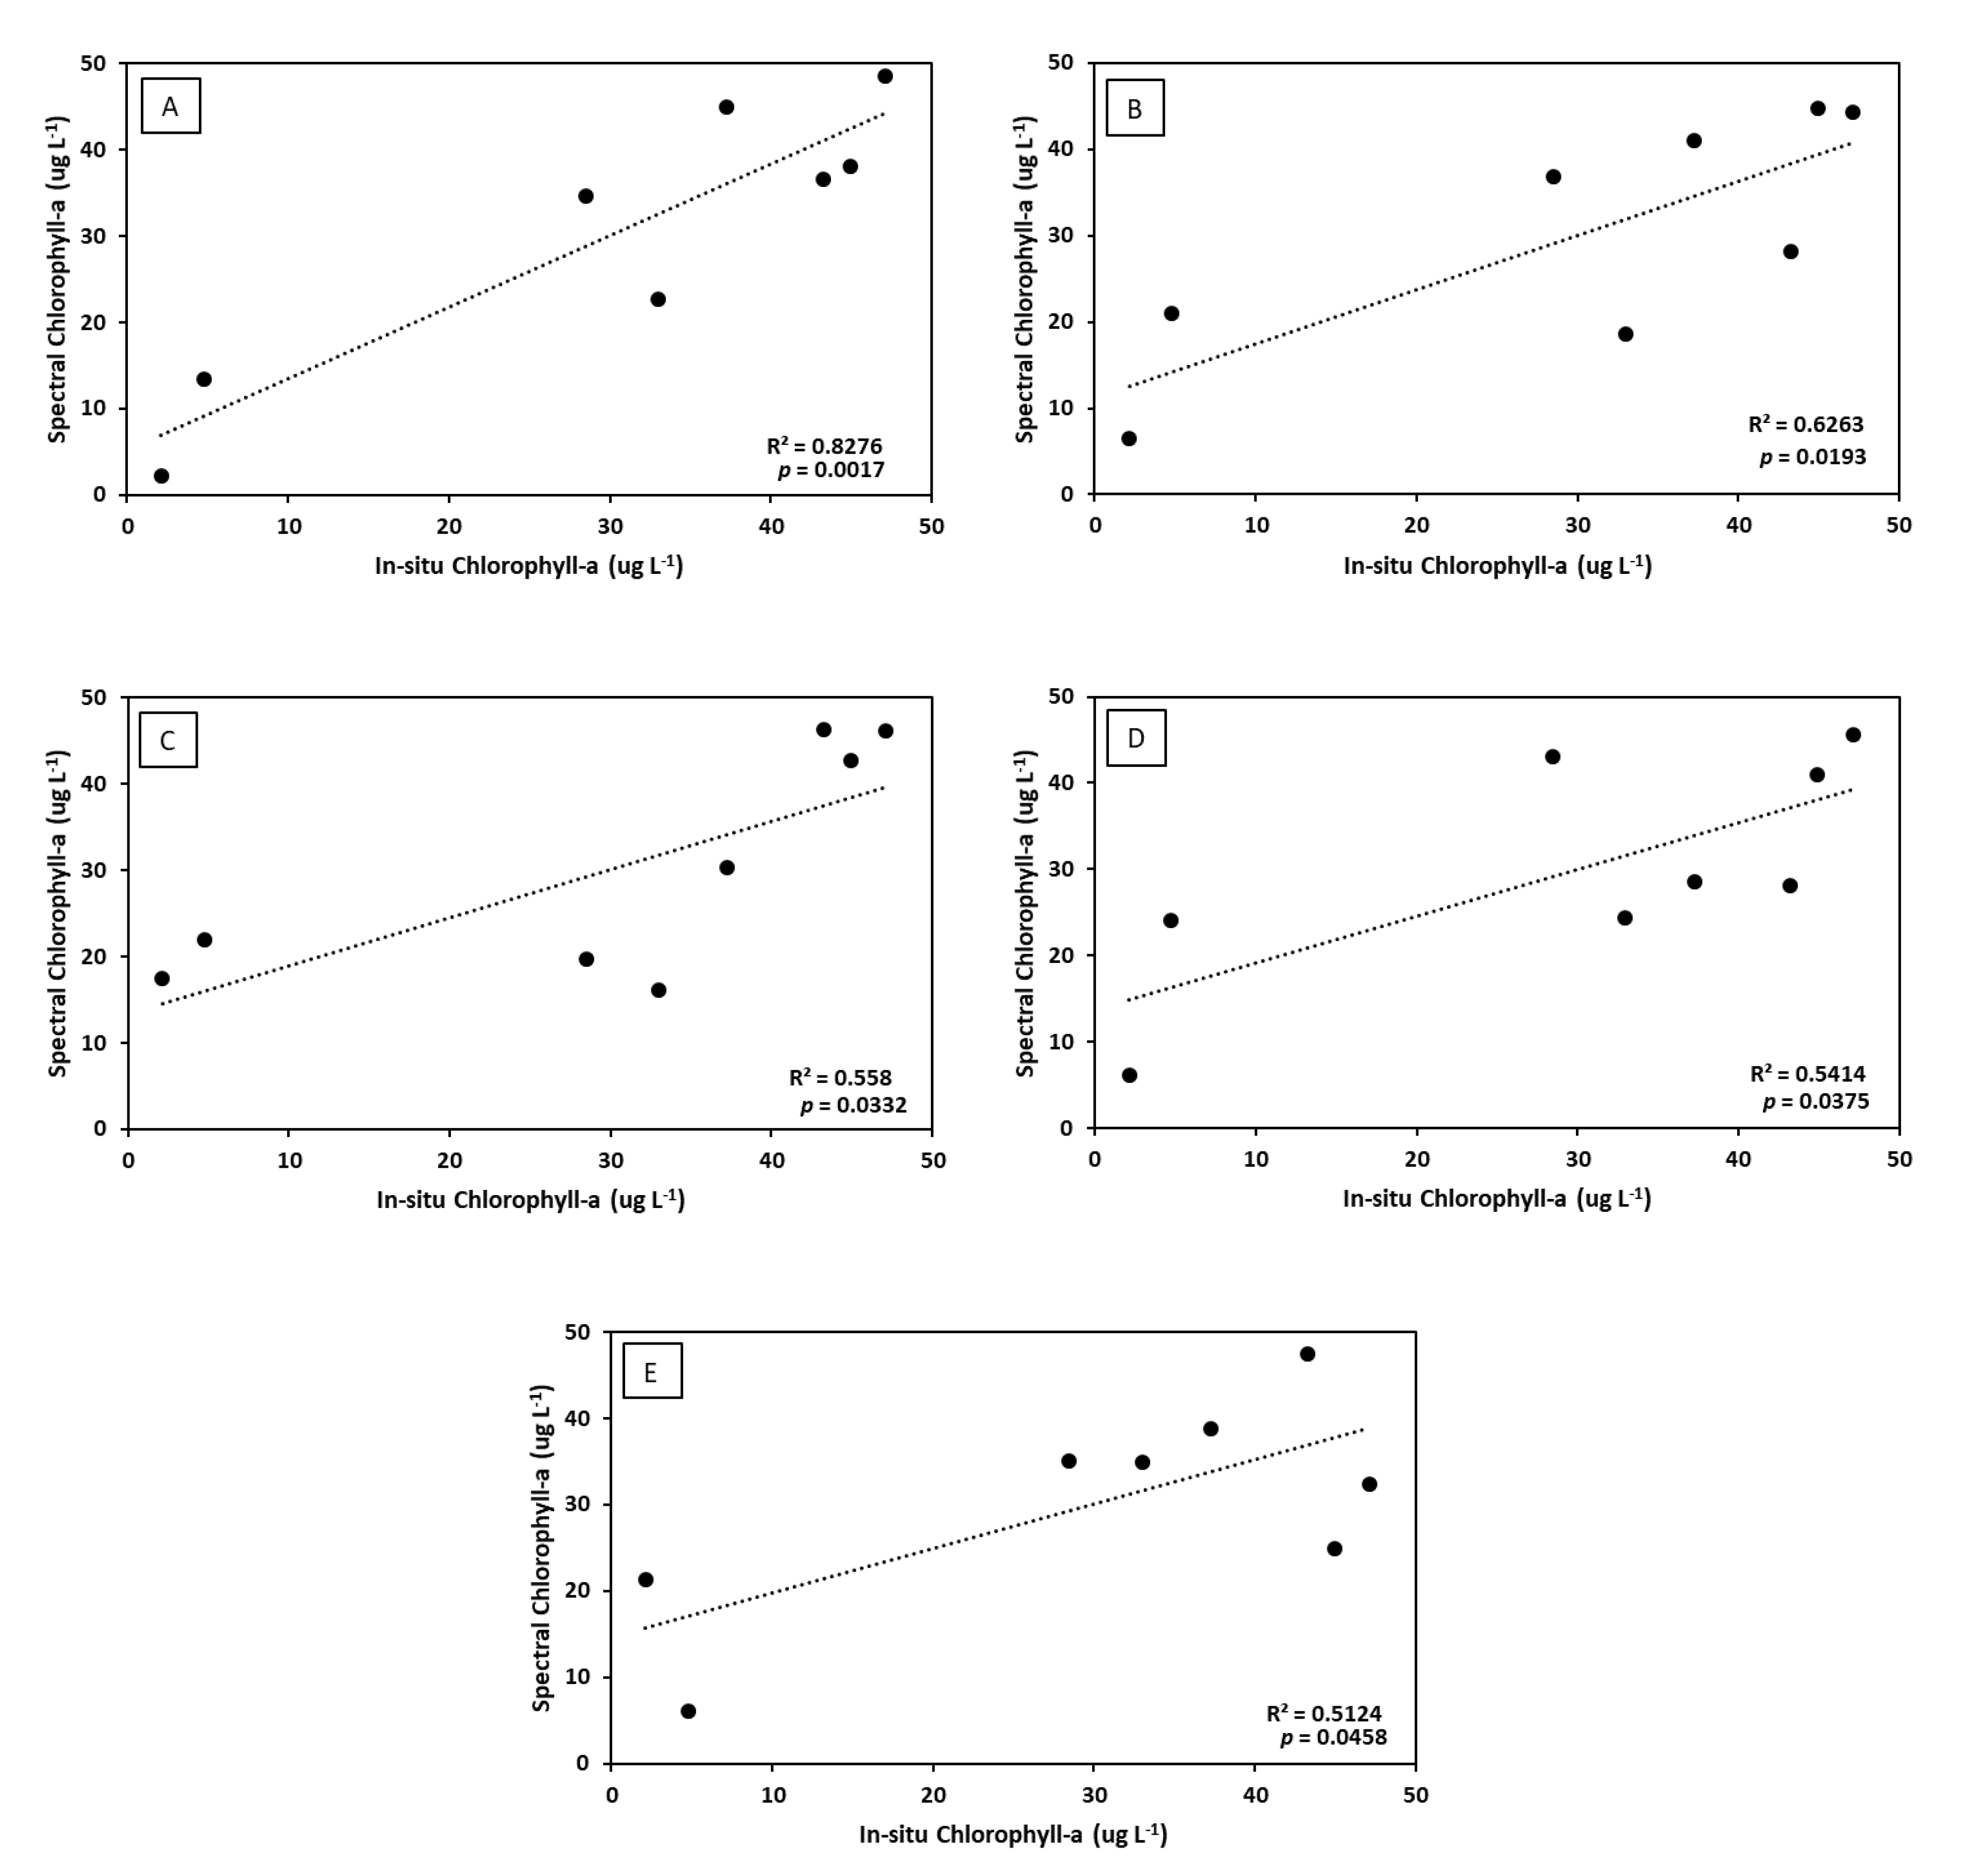
Figure 6.
(A) Chlorophyll-a map extracted from WorldView-2 image of 24 July 2012, (B) TN/P (mass/mass) Ratio.
Figure 6.
(A) Chlorophyll-a map extracted from WorldView-2 image of 24 July 2012, (B) TN/P (mass/mass) Ratio.

Figure 7.
The relationship between the in-situ chlorophyll-a and the eutrophication indicators (A) TN/P, (B) P/Salinity, (C) Salinity, (D) Orthophosphates, (E) TN/salinity.
Figure 7.
The relationship between the in-situ chlorophyll-a and the eutrophication indicators (A) TN/P, (B) P/Salinity, (C) Salinity, (D) Orthophosphates, (E) TN/salinity.
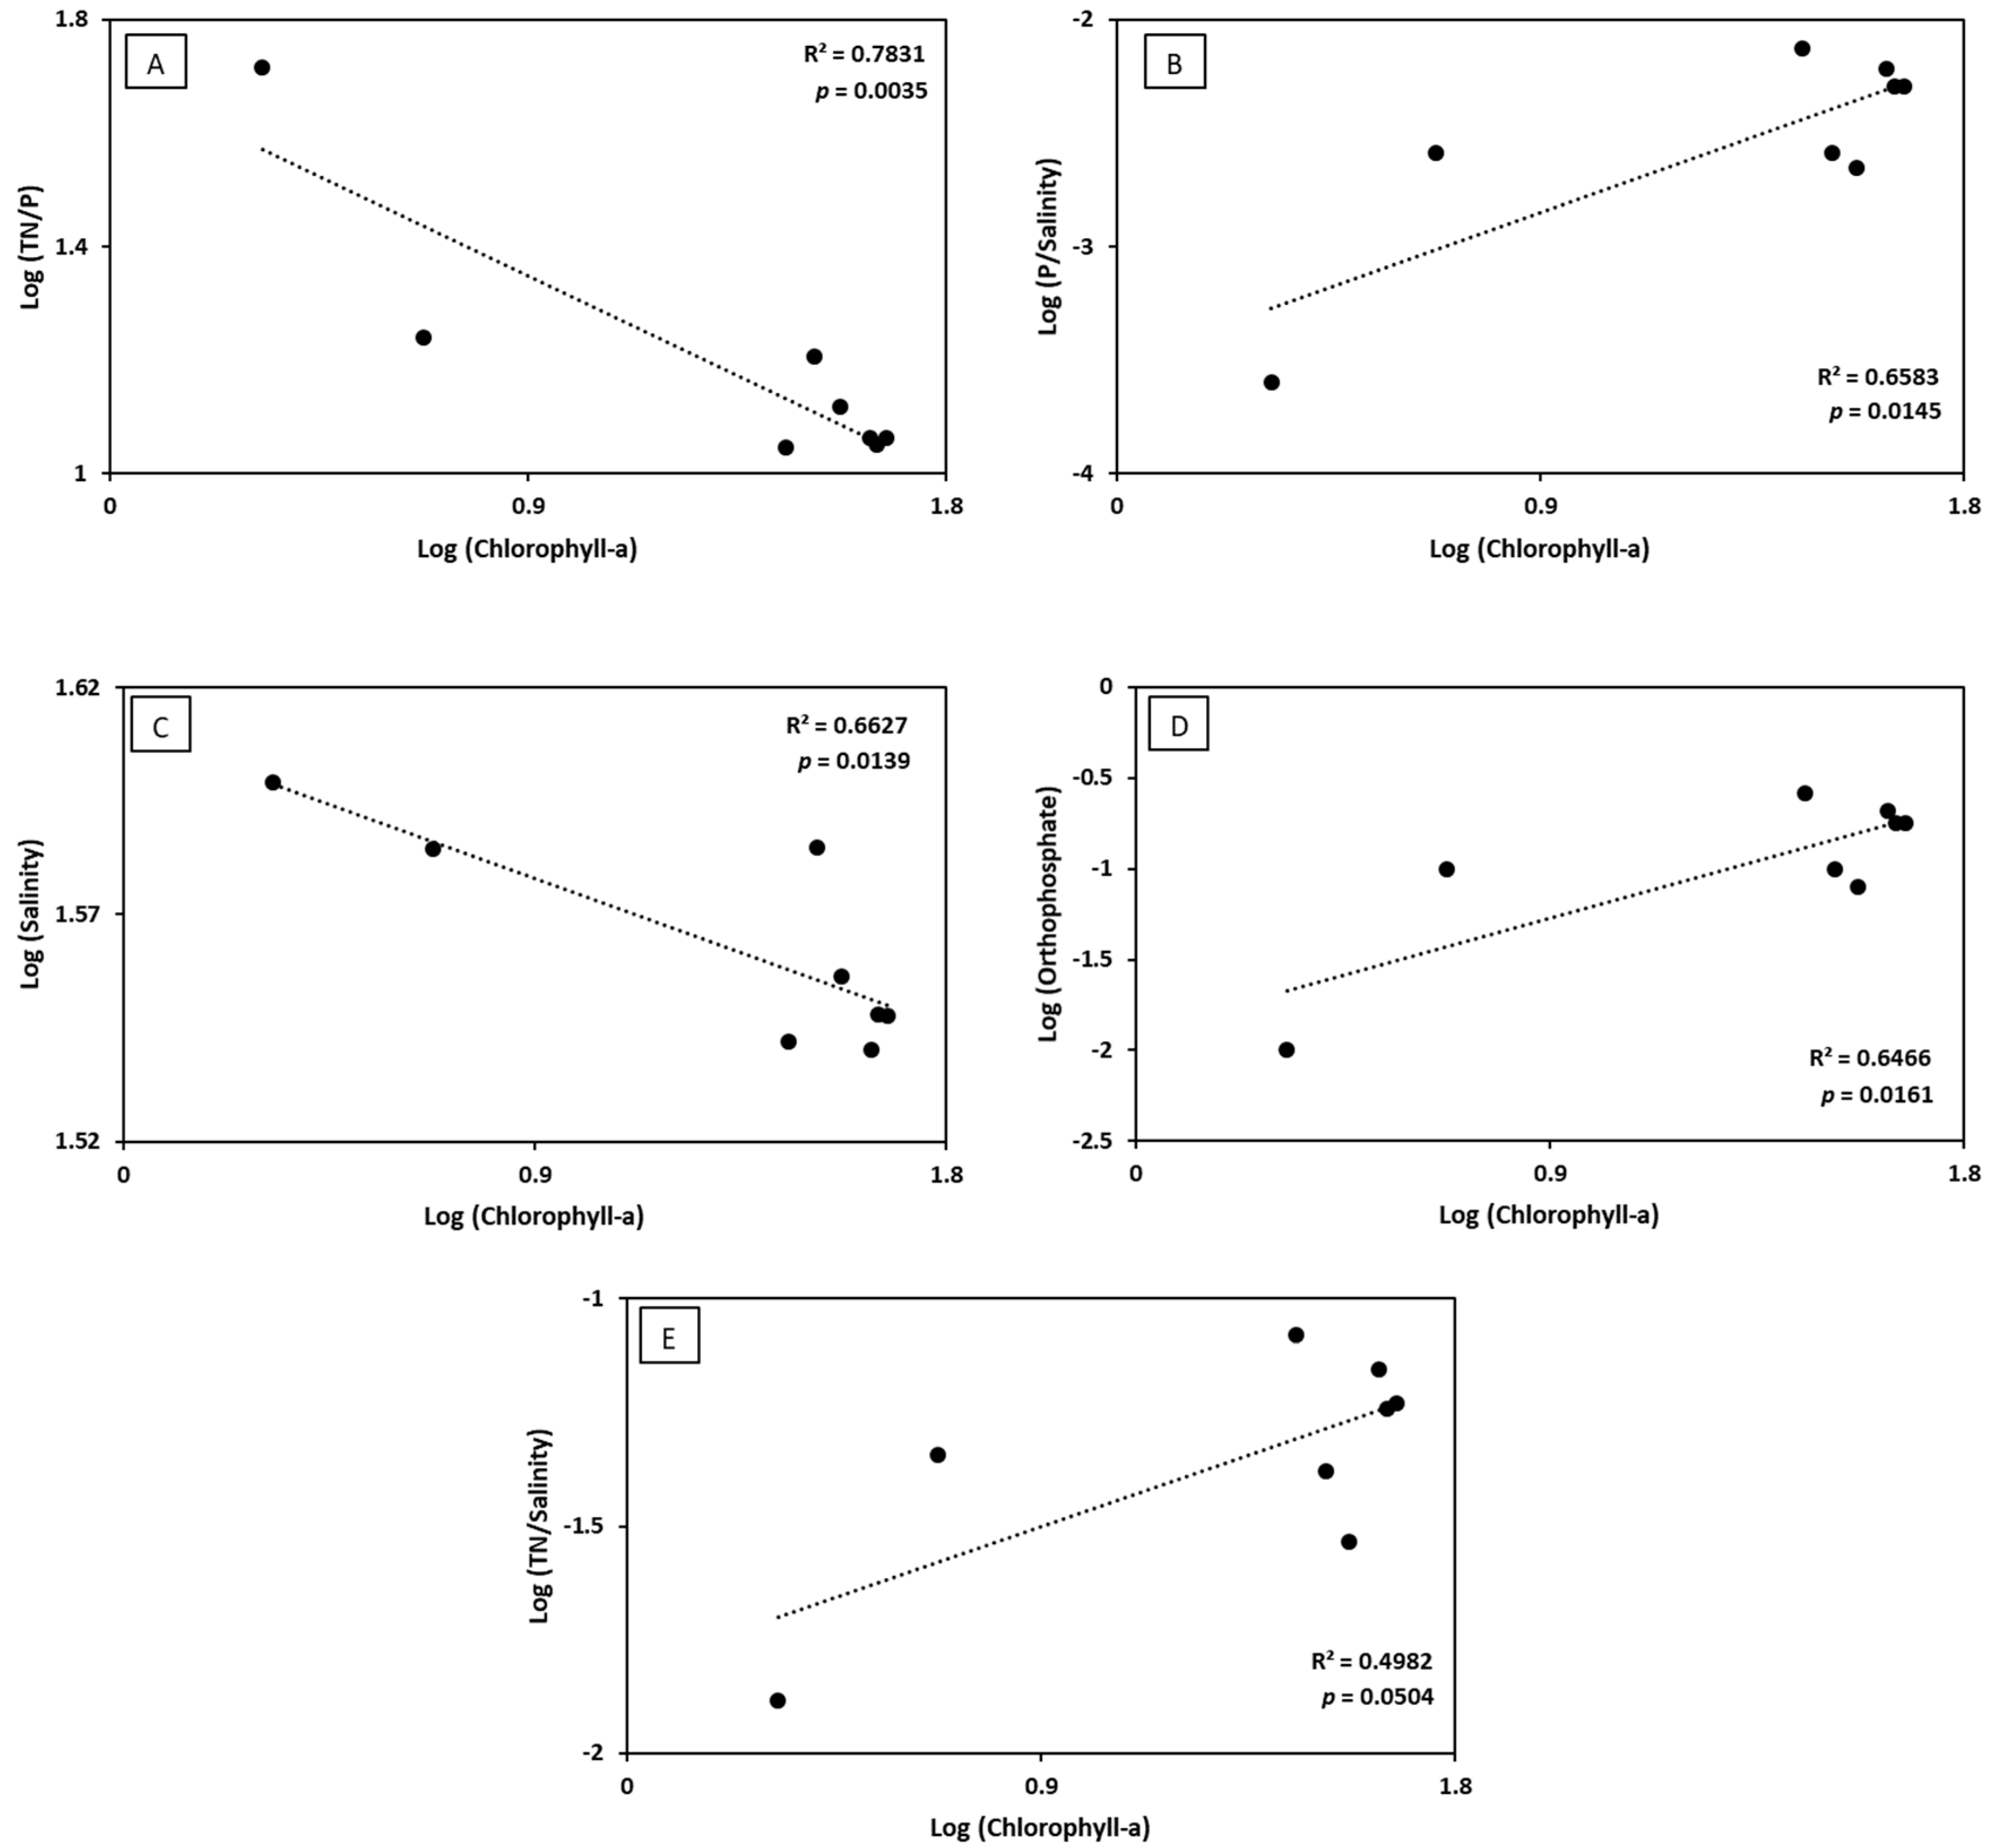
Figure 8.
The relationship between the in-situ TN/P, and (A) modelled TN/P, and (B) Spectral TN/P.

Figure 9.
The relationship between log (spectral chlorophyll-a) and log (in-situ TN/P).

Table 1.
Characteristics of the bands of WorldView-2 satellite imagery.
| Band: Center Wavelength (Width) | Description |
|---|---|
| Coastal Blue (CB): 427 nm (400–450 nm) | Absorbed by chlorophyll in healthy plants, it therefore aids in vegetation analysis |
| Near Infrared 1 (NIR1): 831 nm (770–895 nm) | Useful in separating water from vegetation |
| Near Infrared 2 (NIR2): 908 nm (860–1040 nm) | Aids in vegetation analysis and biomass studies |
| Blue (B): 478 nm (450–510 nm) | It gets absorbed by chlorophyll in plants |
| Green (G): 546 nm (510–580 nm) | Characterized by high reflectance in healthy plants |
| Yellow (Y): 608 nm (585–625 nm) | Detects the degree of yellow color of vegetation |
| Red edge (RED): 724 nm (705–745 nm) | Targeted at the high reflectivity portion of vegetation response |
| Red (R): 659 nm (630–690 nm) | Highly absorbed by healthy plants |
Table 2.
Developed models with different band ratios and the corresponding R-squared values.
| WorldView-2 Band Combinations | R2 | RMSE | Confidence Interval (CI) (95%) | |
|---|---|---|---|---|
| (Coastal blue + Near infrared 1)/Near infrared 2 | (CB + NIR1)/NIR2 | 0.83 | 6.839 | 0.0551 |
| (Blue + Near infrared 1)/Near infrared 2 | (B + NIR1)/NIR2 | 0.63 | 10.07 | 0.0668 |
| (Green + Near infrared 1)/Near infrared 2 | (G + NIR1)/NIR2 | 0.56 | 10.95 | 0.0717 |
| (Yellow + Near infrared 1)/Near infrared 2 | (Y + NIR1)/NIR2 | 0.54 | 11.15 | 0.0772 |
| (Red edge + Near infrared 2)/Near infrared 1 | (RED + NIR2)/NIR1 | 0.53 | 11.29 | 0.0765 |
| (Blue + Near infrared 1)/Red edge | (B + NIR1)/RED | 0.51 | 11.50 | 0.0980 |
| (Yellow + Red)/Red edge | (Y + R)/RED | 0.46 | 12.07 | 0.0018 |
| Near infrared 1/Near infrared 2 | NIR1/NIR2 | 0.43 | 12.40 | 0.0491 |
| Red edge/Near infrared 1 | RED/NIR1 | 0.41 | 12.63 | 0.0560 |
| Yellow/Red edge | Y/RED | 0.32 | 13.71 | 0.0514 |
Table 3.
Comparison of the in-situ and spectral chlorophyll-a concentrations computed by “(CB + NIR1)/NIR2” model.
Table 3.
Comparison of the in-situ and spectral chlorophyll-a concentrations computed by “(CB + NIR1)/NIR2” model.
| Sampling Station | In-Situ Chlorophyll-a (µg/L) | Spectral Chlorophyll-a (µg/L) | % Residual |
|---|---|---|---|
| Creek Mouth | 2.130 | 2.24 | 5.16 |
| Abra | 32.98 | 22.61 | 31.44 |
| Dhow Wharfage | 4.750 | 13.4 | 182.10 |
| Floating Bridge | 28.48 | 34.65 | 21.66 |
| Dubai Festival City (DFC) | 43.25 | 36.6 | 15.38 |
| Sewage Treatment Plant (STP) | 44.93 | 38.01 | 15.4 |
| Al Jaddaf | 47.13 | 48.48 | 2.86 |
| Ras Al Khor Wildlife Sanctuary | 37.25 | 44.98 | 20.75 |
Table 4.
The in-situ chlorophyll-a concentration in the second quarter of 2010, 2011 and 2012, in selected stations in the Dubai Creek.
Table 4.
The in-situ chlorophyll-a concentration in the second quarter of 2010, 2011 and 2012, in selected stations in the Dubai Creek.
| Sampling Station | Q2, 2010 (µg/L) | Q2, 2011 (µg/L) | Q2, 2012 (µg/L) |
|---|---|---|---|
| Creek Mouth | 0.1 | 8.1 | 4.6 |
| Hyatt Regency Dubai | 10.8 | 11.2 | 15.6 |
| Abra | 6.4 | 29.8 | 5.9 |
| Dhow Wharfage | 9.2 | 32.8 | 4.6 |
| Floating Bridge | 7.7 | 22.4 | 57.5 |
| Average | 6.84 | 20.86 | 17.64 |
Table 5.
Comparison of field and modelled TN/P.
| Sampling Station | In-Situ Chl-a (µg/L) | LOG (TN/P) (Modelled) | TN/P (Modelled) | LOG (TN/P) (In-Situ) | TN/P (In-Situ) | % Error |
|---|---|---|---|---|---|---|
| Creek Mouth | 2.13 | 1.57 | 37.22 | 1.72 | 52 | 28.42 |
| Abra | 32.98 | 1.11 | 12.86 | 1.21 | 16.1 | 20.15 |
| Dhow Wharfage | 4.75 | 1.44 | 27.27 | 1.24 | 17.4 | 56.71 |
| Floating Bridge | 28.48 | 1.13 | 13.61 | 1.05 | 11.15 | 22.02 |
| Dubai Festival City (DFC) | 43.25 | 1.06 | 11.57 | 1.06 | 11.57 | 0.01 |
| Sewage Treatment Plant (STP) | 44.93 | 1.06 | 11.40 | 1.05 | 11.28 | 1.11 |
| Al Jaddaf | 47.13 | 1.05 | 11.19 | 1.06 | 11.56 | 3.13 |
| Ras Al Khor Wildlife Sanctuary | 37.25 | 1.09 | 12.26 | 1.12 | 13.13 | 6.57 |
© 2020 by the authors. Licensee MDPI, Basel, Switzerland. This article is an open access article distributed under the terms and conditions of the Creative Commons Attribution (CC BY) license (http://creativecommons.org/licenses/by/4.0/).
Share and Cite
MDPI and ACS Style
Mortula, M.; Ali, T.; Bachir, A.; Elaksher, A.; Abouleish, M. Towards Monitoring of Nutrient Pollution in Coastal Lake Using Remote Sensing and Regression Analysis. Water 2020, 12, 1954. https://doi.org/10.3390/w12071954
AMA Style
Mortula M, Ali T, Bachir A, Elaksher A, Abouleish M. Towards Monitoring of Nutrient Pollution in Coastal Lake Using Remote Sensing and Regression Analysis. Water. 2020; 12(7):1954. https://doi.org/10.3390/w12071954
Chicago/Turabian StyleMortula, Maruf, Tarig Ali, Abdallah Bachir, Ahmed Elaksher, and Mohamed Abouleish. 2020. "Towards Monitoring of Nutrient Pollution in Coastal Lake Using Remote Sensing and Regression Analysis" Water 12, no. 7: 1954. https://doi.org/10.3390/w12071954
Note that from the first issue of 2016, this journal uses article numbers instead of page numbers. See further details here.