Article

Investigating the Effects of Agricultural Water Management in a Mediterranean Coastal Aquifer under Current and Projected Climate Conditions

by
Vassilios Pisinaras
*,
Charalampos Paraskevas
and
Andreas Panagopoulos
Soil & Water Resources Institute, Hellenic Agricultural Organization, Gorgopotamou, Sindos, 57400 Thessaloniki, Greece
*
Author to whom correspondence should be addressed.
Water 2021, 13(1), 108; https://doi.org/10.3390/w13010108
Submission received: 11 December 2020 / Revised: 30 December 2020 / Accepted: 30 December 2020 / Published: 5 January 2021

Abstract

:
Coastal delta plains are areas with high agricultural potential for the Mediterranean region because of their high soil fertility, but they also constitute fragile systems in terms of water resources management because of the interaction of underlying aquifers with the sea. Such a case is the Pinios River delta plain located in central Greece, which also constitutes a significant ecosystem. Soil and Water Assessment Tool (SWAT) and SEAWAT models were combined in order to simulate the impact of current water resources management practices in main groundwater budget components and groundwater salinization of the shallow aquifer developed in the area. Moreover, potential climate change impact was investigated using climate data from Regional Climate Model for two projected periods (2021–2050 and 2071–2100) and two sea level rise scenarios (increase by 0.5 and 1 m). Modeling results are providing significant insight: although the contribution of the river to groundwater inflows is significant, direct groundwater recharge from precipitation was found to be higher, while capillary rise constitutes a major part of groundwater outflows from the aquifer. Moreover, during the simulation period, groundwater flow from the aquifer to the sea were found to be higher than the inflows of seawater to the aquifer. Regarding climate change impact assessment, the results indicate that the variability in groundwater recharge posed by the high variability of precipitation during the projected periods is increasing the aquifer’s deterioration potential of both its quantity and quality status, the latter expressed by the increased groundwater Cl concentration. This evidence becomes more significant because of the limited groundwater storage capacity of the aquifer. Concerning sea level rise, it was found to be less significant in terms of groundwater salinization impact compared to the decrease in groundwater recharge and increase in crop water needs.

1. Introduction

Globally, the agricultural sector constitutes the dominant water consumer, as about 80% of the total water consumption is accounted to agriculture [1], while according to Rost et al. [2], irrigation water use, abstracted from rivers, lakes and aquifers has been estimated to be about 70% of total human blue water consumption. Irrigation demand is estimated to be higher in Mediterranean region and especially in the south and the east part, in which irrigation accounts for 74% and 81% of the total water withdrawals, respectively [3]. Therefore, the relation between agricultural production and water resources is direct, especially in arid and semi-arid areas, such as located in the south and east Mediterranean, where agricultural production is largely dependent on irrigation. Taking into account: (a) the expected population growth which will increase the agricultural production needs, (b) the anticipated reduction in water resources availability in Mediterranean region due to climate change [4,5,6] and (c) the overexploitation and overall poor water resources management [7], the necessity for effective water management in agricultural areas becomes very important. More specifically, according to Molden [8], crop water requirements and therefore agricultural water demand is expected to be almost doubled by 2050, assuming that the current status of water productivity remains stable. Nevertheless, according to Olesen et al. [9] increasing irrigation amounts in Mediterranean region will possibly not be a viable option due to water resources availability reduction, as a consequence of total runoff and groundwater recharge reduction. Moreover, Garrote et al. [10] indicate that a reduction on future maximum potential water withdrawal for irrigation in the south Mediterranean-European countries is expected, which was estimated to be higher for basins in Iberian Peninsula and Greece.
Especially for groundwater management in Mediterranean region related to agriculture, two more critical aspects are identified: (a) Considering the fact that groundwater constitutes the primary irrigation water source for a significant part of the Mediterranean region, the importance of groundwater for irrigated land becomes vital. As indicated by Garrido and Iglesia [11] and Fornes et al. [12], in most cases, almost all groundwater extracted in Mediterranean countries is used for irrigation. (b) Due to the long shoreline of Mediterranean region, a significant part of fertile agricultural land is developed in coastal deltaic systems in which coastal aquifers constitutes a significant source of irrigation water. Because of the hydraulic connection between coastal aquifers and the sea, overexploitation can potentially lead to seawater intrusion and therefore to groundwater quality deterioration. According to Mazi et al. [13], several aquifer systems located along the Mediterranean coastline are significantly impacted by seawater intrusion, while according to Nixon et al. [14], seawater intrusion has affected large areas of the Mediterranean coastline in Italy, Spain and Turkey. The impact of seawater intrusion in groundwater quality is expected to increase in Mediterranean due to increased groundwater abstractions driven by increased irrigation water requirements. Stigter et al. [15] indicated that groundwater quality deterioration because of seawater intrusion is expected to increase due to climate change effects in three coastal aquifers located in Morocco, Portugal and Spain. Haj-Amor et al. [16] simulated an increase in average aquifer salinity located in a Tunisian coastal oasis from 4.2 dS m−1 in 2018 to about 5.3 dS m−1 in 2050.
Considering the above, effective water resources management in coastal agricultural areas of the Mediterranean region is more crucial than ever in order to cope and potentially adapt to climate change effects and thus maintain sustainability. Water systems modeling is inevitably one of the most effective tools in water resources management due to the fact that based on assumptions, the complex processes and mechanisms taking place in a water system can be simulated and represented in a realistic manner. Especially for climate change impact studies, water models give the opportunity to incorporate climate data into the corresponding processes and therefore assess and quantify the impacts of climate change. One of the most effective approaches for simulating groundwater salinization processes is numerical modeling. Such an approach has also been applied in Mediterranean coastal aquifers. Despite the fact that this approach requires significant computational resources, numerical modeling and especially variable density models, provide a more realistic representation of groundwater salinization processes [17]. Alcolea et al. [18] combined a surface water balance model with the open-source finite elements code SUTRA [19] in order to simulate the dynamics of an unconfined aquifer discharging in a lagoon located in Spanish Mediterranean coast. The model gave significant insight towards the understanding of the link between the aquifer and the lagoon. SUTRA was also applied by Haj-Amor et al. [16] in order to simulate climate change effects in an aquifer located in a Tunisian coastal oasis. Hugman et al. [20] applied a density-coupled flow and transport model in a coastal aquifer located in southern Portugal and concluded that the adverse effects of climate change in saltwater intrusion are attenuated by the slow rate of movement of the freshwater-saltwater interfaces. Stigter et al. [15] applied the FEN code, which consists of well-known groundwater flow codes in three coastal aquifers located in Morocco, Portugal and Spain in order to simulate climate change impacts. Siarkos and Latinopoulos [21] applied the finite difference code SEAWAT to an overexploited coastal aquifer located in north Greece. SEAWAT model has been also applied in Nile Delta Aquifer [22], in a coastal aquifer in Lebanon [23] and in the aquifer systems located in Apulia region, Italy [24,25].
The present study aims to investigate the impacts of current water resources management practices in the quantity and salinity status (expressed as Cl) of an environmentally sensitive, coastal aquifer located in central Greece, focusing on potential climate change effects. This is achieved by applying sequentially two well established modeling codes, namely Soil and Water Assessment Tool (SWAT) [26,27] and SEAWAT [28] models with climate data from a carefully selected high resolution Regional Climate Model (RCM) for two projected periods indicating high variability in terms of precipitation and temperature variation. Moreover, two sea level rise scenarios are tested in order to identify and assess potential impacts on quantity and salinity status of the study area aquifer.

2. Materials and Methods

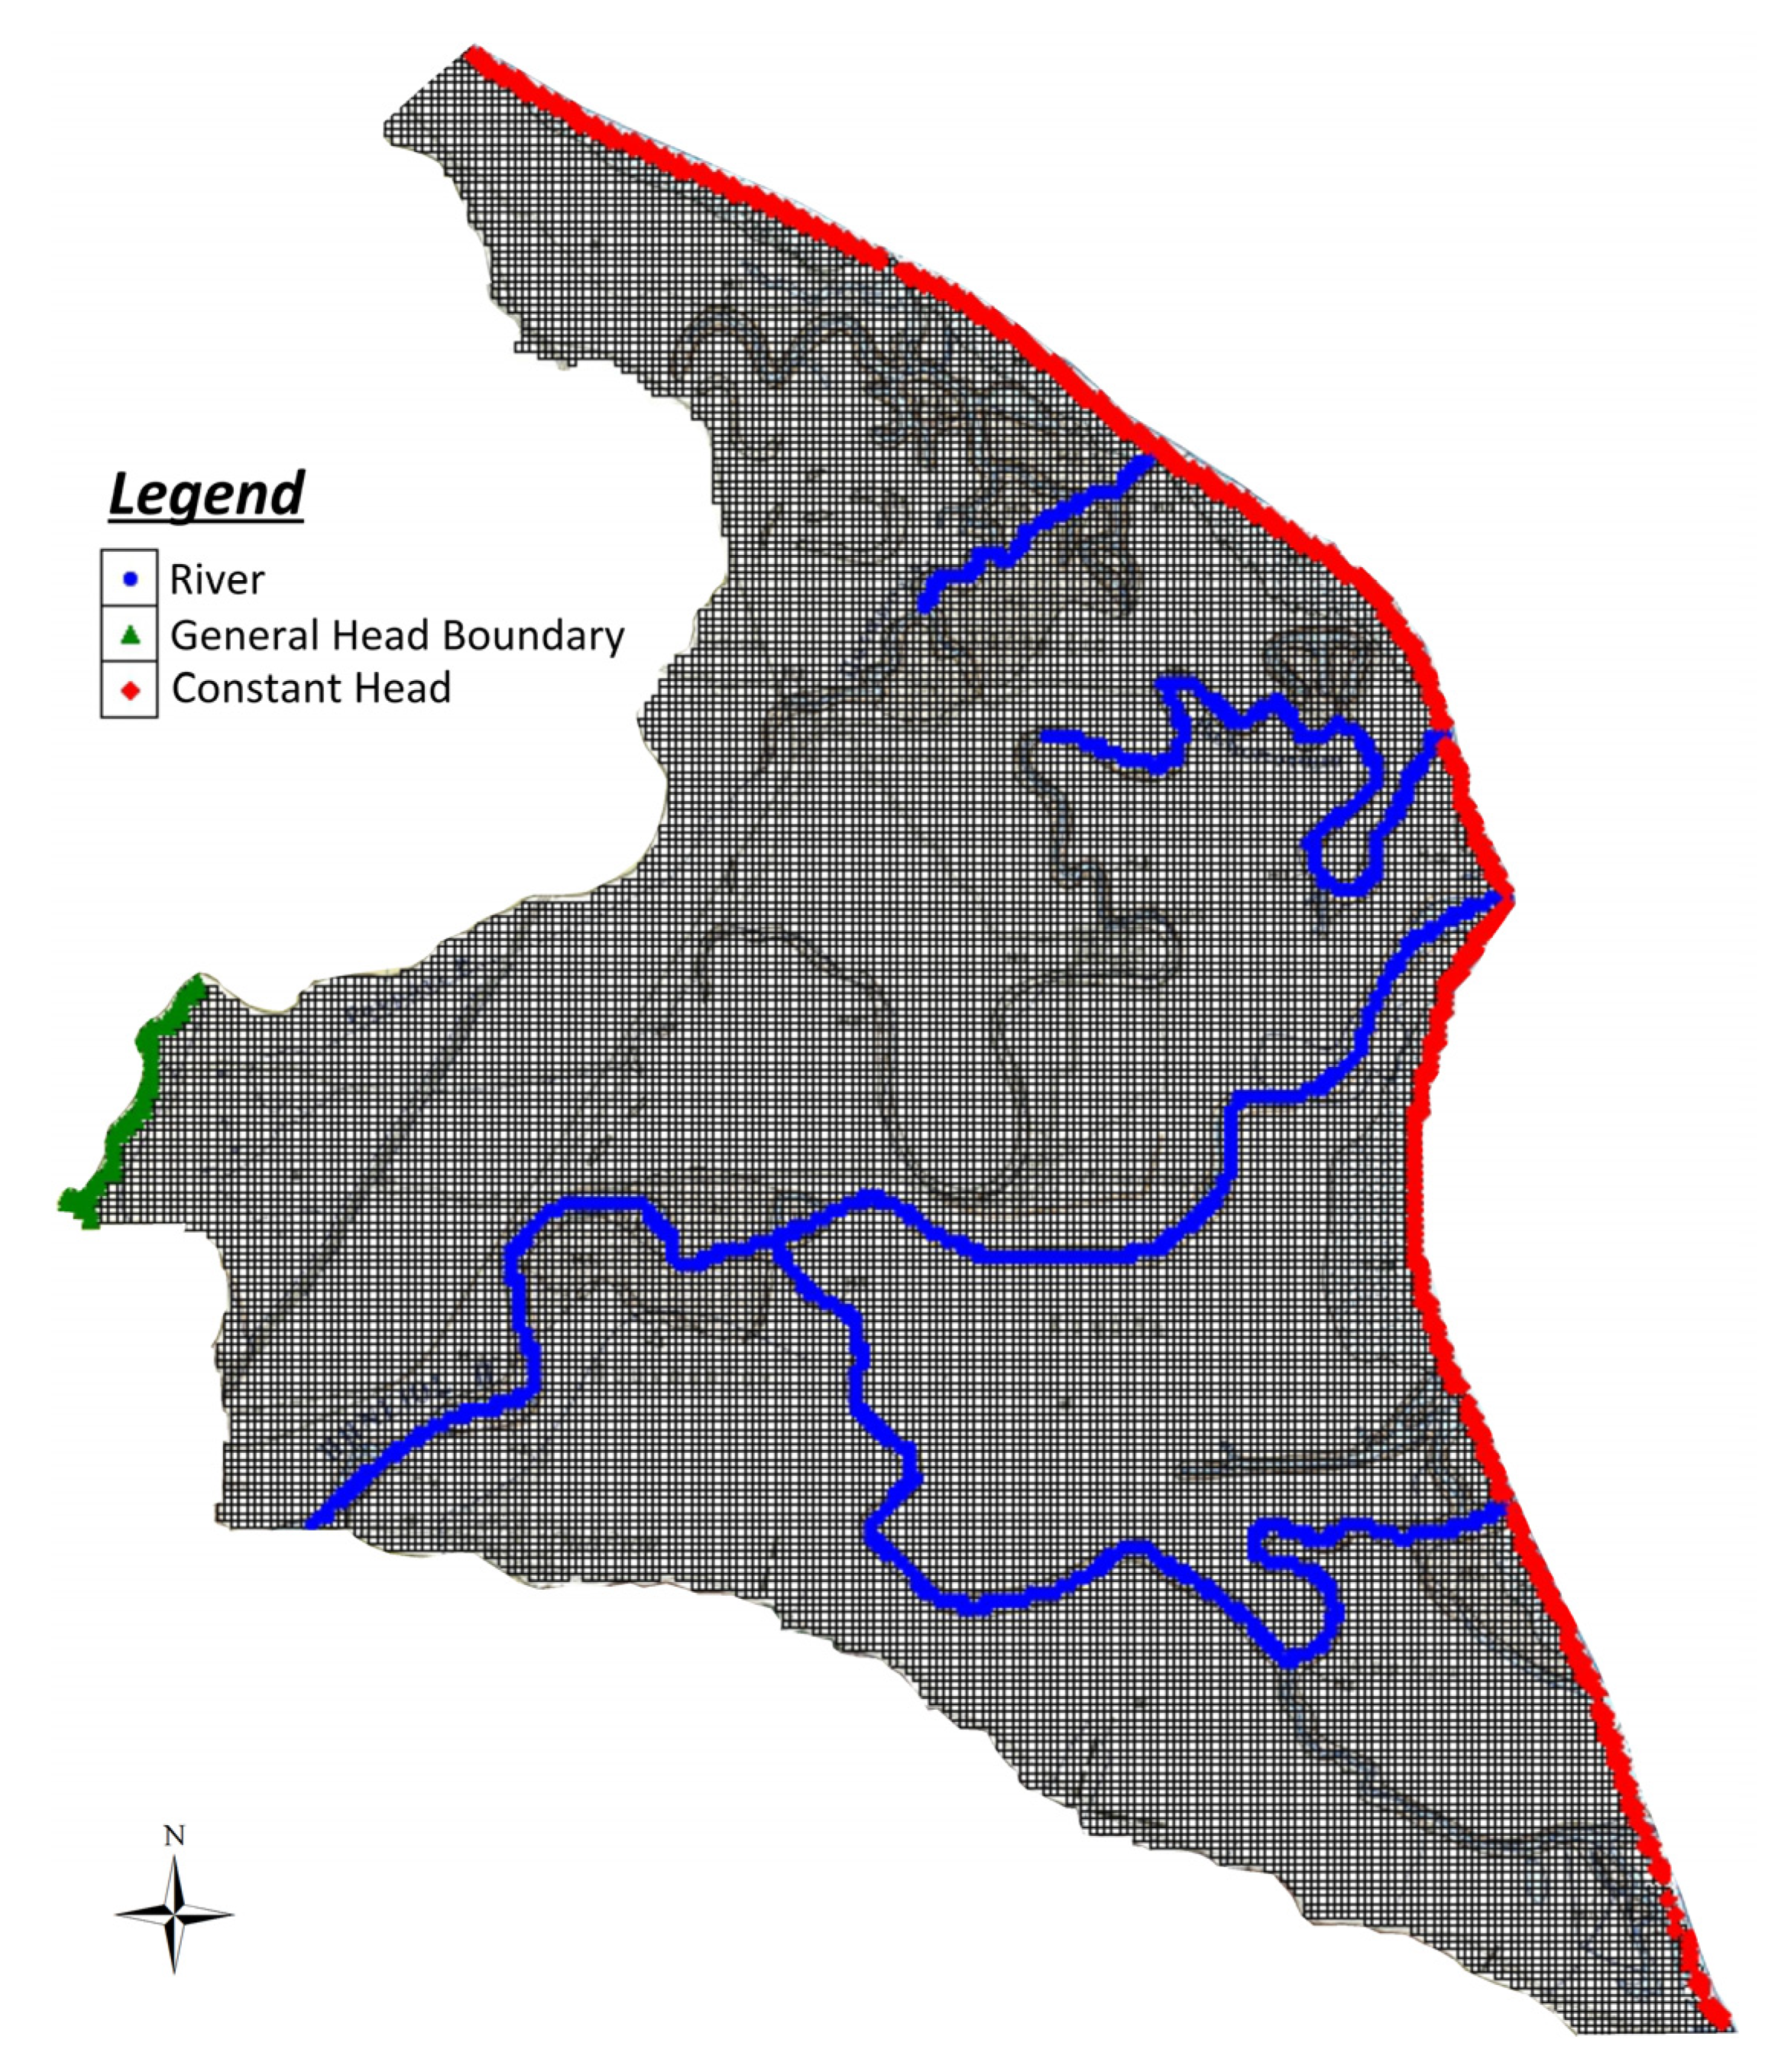
2.1. Study Area Description

The location and boundary of the Pinios River Deltaic Plain (PRDP), as well as the geological regime of the surrounding area is presented in Figure 1. PRDP covers an area of about 75 km2 and is situated at the downstream-most part of Pinios River basin, which constitutes the largest fully developing basin in Greece (11,000 km2). The economic, social and environmental significance of PRDP is high, as the agricultural and touristic activities developed in PRDP are significantly supporting the local society, while the basin has been included in NATURA2000 network (GR1420002) and is a designated international Important Bird Area.
Two major geological formations are found in the wider study area, including sequences of folded alpine formations and plio-quaternary deposits in which PRDP is situated. More specifically, Neogene terrestrial and lacustrine deposits spread at the northwestern boundary of PRDP, which are considered to be the bedrock of the overlying Pleistocene and Holocene sediments. Concerning Pleistocene deposits, they are located at the western boundary of PRDP and they include talus cones and screes. Holocene is represented by alluvial deposits that are dominant in PRDP and considered hydrologically significant, coastal formations situated along the coast, and unconsolidated material along the old and recent Pinios river course. Metamorphic basic ophiolithic rocks and blue gneiss-schists and prasinites outcrops are dominant at the gern margins of the basin.
With regard to the hydrogeological conditions of PRDP, three major hydrogeological units are identified according to the study of Alexopoulos et al. [30], in which geophysical investigation methods were applied: (a) An upper hydrogeological unit in which an unconfined aquifer occurs, (b) a middle hydrogeological unit which indicates very low permeability and therefore serves as an aquitard and (c) a lower hydrogeological unit in which a confined aquifer is present. The unconfined aquifer exists within the alluvial deposits and its thickness is up to 10–15 m. The general trend observed for alluvial deposits is to become finer shifting from the margins of the plain (at the west) towards the coast to the east, with subsequent impact on the hydraulic properties of the unconfined aquifer. Coarser fractions, at least towards the upstream part of the deltaic plain, are indicated along the river course as a result of river sediment deposition process. A typical alluvial stratigraphic structure occurs, hence, continuous alterations of fine (silt and clay) and coarse sediments are found. The aquitard consists mainly of fine material (clay-marl composition) and its thickness varies between 30 and 35 m, while it clearly discretizes the overlying and underlying aquifers. With regard to the lower hydrogeological unit (the confined aquifer), it consists mainly of sandstones and compacted conglomerates possibly of the Neogene sequence, which crops out and is observed at the western part of the wider study area. Since there is inadequate hydrogeological information for the confined aquifer, and groundwater abstractions from it are very limited, the present study focuses on the unconfined aquifer only.
The unconfined aquifer of PRDP was, almost exclusively, used to serve irrigation needs of the deltaic plain. Therefore, according to the local farmers’ information, more than 600 small diameter groundwater wells of depth ranging between 6 and 15 m were used in order to cover irrigation demands. This water resources management motif has progressively changed the last 15–20 years. Pinios River surface waters nowadays serve a significant part of the irrigation needs, especially at the western and southern part of the deltaic plain, while groundwater is used complementarily and in conjunction with Pinios River surface water. Land use distribution in the deltaic plain resulted from CORINE2000 land cover and crop spatial distribution data as provided by the Hellenic Payment and Control Agency for Guidance and Guarantee Community Aid, is presented in Figure 2. More than 75% of the deltaic plain area is covered by agricultural land. The dominant crop in PRDP is corn (20.11%), followed by wheat (17.27%) and sunflower (13.73%). Other crops such as kiwi fruit, cotton, alfalfa and olives are also cultivated in the study area and are covering a considerable portion of agricultural land.

2.2. Modeling

Two models were combined and applied in order to reliably simulate the several components of the hydrologic budget of the aquifer system. The core of the modeling framework is the SEAWAT code [28] which was used in order to simulate groundwater flow, groundwater budget and seawater intrusion in the coastal aquifer. SEAWAT constitutes a combination of MODFLOW [31] and MT3DMS [32] codes developed in order to simulate three-dimensional, variable-density, transient groundwater flow and pollution transport in porous media and has been globally applied in numerous aquifers. The groundwater flow equation is solved using an implicit finite-difference approximation while several implicit or explicit finite-difference methods can be applied in order to solve the solute transport equation.
The second model included in the modeling framework is the Soil & Water Assessment Tool (SWAT) model [26,27]. SWAT is one of the most widely applied watershed management models that it is physically-based and semi-distributed. It was initially developed to be applied in large, ungauged watersheds under complex soil, land use and management conditions, while it simulates a wide range of processes including surface and subsurface hydrology, crop and vegetative growth, pesticide transport and fate and nutrient transport and cycling in streams, soils and crop uptake [33]. SWAT was chosen to be included in the present modeling framework for three reasons. The first reason is that SWAT gives the opportunity to simulate actual crop growth and subsequently crop water needs by incorporating the local-specific cultivation practices. Crop growth in SWAT is simulated by a simplified version of EPIC model [34] according to which the concept of accumulated heat units is used to simulate the phenological plant development. The calculation of potential biomass production is made according to Monteith and Moss approach [35], while water, temperature and nutrient stress can potentially affect crop growth. Therefore, the actual water amount consumed by crops in an agricultural area, which constitutes the major water sink, can be estimated by a physically based approach and in essence, accounting for the specific land and water management conditions.
The second reason is that SWAT simulates the land phase of the hydrologic cycle incorporating all the related components and therefore groundwater recharge from the vadose zone can be computed. The third reason is that SWAT incorporates the estimation of capillary rise from the shallow aquifers to the soil profile for which there is strong evidence that it constitutes a significant component of the PRDP phreatic aquifer budget. Capillary rise in SWAT is empirically calculated as the product of revap coefficient and potential evapotranspiration and it is controlled by the amount of water existing in the shallow aquifer. In order to estimate the potential of capillary rise to contribute to crop water needs, HYDRUS 1-D [36] was applied for several combinations of crops, soil profiles and groundwater table depth. HYDRUS 1-D internal pedotransfer functions were used in order to predict soil hydraulic parameters. HYDRUS 1-D has been applied for the same purposes in several studies [37,38,39]. SEAWAT and SWAT have been effectively applied together in the study of Chang et al. [40] in order to simulate the effects of climate change and urbanization on groundwater resources in a small barrier island located in the USA.

2.3. Data Collection

Except from the geological, hydrogeological and land use data presented above, a comprehensive wells’ census was carried out in the study area, that resulted in the establishment of a monitoring network in which monthly groundwater level measurements and seasonal groundwater sampling was performed for the period October 2013–September 2015 (Figure 2). This network consists of: (a) seventeen wells in which groundwater level measurements and sampling was performed, (b) seven wells in which only groundwater level measurements were conducted and (c) four wells in which only groundwater sampling was performed. Due to the very mild slopes observed in PRDP, the location of all monitoring wells was recorded using a high accuracy Leica Viva GS08 GPS system in order to achieve high precision altitude values hence reliable absolute groundwater level elevation. Chloride concentrations were determined at the collected groundwater samples. Moreover, topographical, weather and meteorological data were collected in order to support SWAT application. Therefore, a Digital Elevation Model (DEM) produced from the interpolation of elevation contours of 1:5000 scale topographic maps was used. Also, detailed soil data for the PRDP were incorporated that include more than 40 soil profiles [41]. Weather data including precipitation, temperature, wind speed, relative humidity and global solar radiation were gathered from a local meteorological station (Figure 2), which is located at the center of the deltaic plain and is considered representative of the climate conditions at PRDP. Since the current study focuses on agriculture, information on cultivation practices was collected from local agricultural cooperatives and farmers including sowing and harvest day of crops, tillage practices, crop yields, as well as irrigation practices and applied irrigation water quantities.

2.4. Climate Change Impacts

In order to investigate the potential climate change impacts on PRDP, data from RACMO2 Regional Climate Model (RCM) [42] driven by ECHAM5-r3 Global Circulation Model (GCM) were used. This RCM was incorporated in the framework of ENSEMBLES project and it was implemented in the current study due to its better performance in simulating climate conditions compared to other models. More specifically, as stated by Karali et al. [43] and based on ENSEMBLES [44], RACMO2 has been found to present the highest accuracy in simulating climate and extremes in Mediterranean region, when compared to the other climate models included in ENSEMBLES project dataset. Deidda et al. [45] investigated the performance of 14 RCMs in representing precipitation and temperature variation over six Mediterranean catchments and their results demonstrated that RACMO2 is included in the best options for the four catchments while it was indicated as good option for the other two. Moreover, Kostopoulou et al. [46] compared datasets produced by RCMs of ENSEMBLES project against E-OBS gridded dataset and concluded that RACMO2 is satisfactorily reproducing extreme temperature and precipitation patterns in the Balkan Peninsula. Furthermore, this RCM has been efficiently used in several studies for climate change impact assessment on water resources around Greece [47,48,49]. Two time periods were considered in order to investigate the potential climate change impacts on PRDP: the period 2021–2050 representing near future and the period 2071–2100 representing far future.
Sea level rise is expected to be one of the most severe impacts of climate change. As indicated by Intergovernmental Panel on Climate Change (IPCC) [50] and depending on the emissions scenario, global mean sea level is likely to increase on the average by 0.24–0.30 m for the period 2046–2065 and by 0.40–0.63 for the period 2081–2100. The likely range of global mean sea level rise for the highest emissions scenario (RCP8.5) is 0.45–0.82 m for the period 2081–2100. Other studies are indicating higher sea level rise values, such as this of Rahmstorf [51], according to which sea level rise values of 0.5 to 1.4 m are projected by year 2100, while Hansen [52] mentions that sea level rise is probable to be significantly larger than the range presented in most studies. Ketabchi et al. [53] reviewed studies investigating the impacts of sea level rise in coastal aquifers. The majority of the studies included are applying sea level rise up to 1 m, while sea level rise by 1 m constitutes the most frequently applied scenario. Based on the above, two scenarios were considered for the study area, assuming 0.5 m and 1.0 m sea level rise. These scenarios were incorporated in SEAWAT in a simplified way and more specifically by increasing the hydraulic head in Constant Head boundary along the coast. Both sea level rise scenarios were applied for both future periods.

3. Results

3.1. SWAT Model Application

Based on topographic, soil and land use data, PRDP was divided into 20 sub-basins which were further divided into 384 Hydrologic Response Units (HRUs). Moreover, cultivation and irrigation practices, as well as capillary rise as estimated by HYDRUS-1D application were introduced in SWAT. Since SWAT was originally developed to be applied in ungauged basins, it has been found to demonstrate satisfactory performance when applied in basins for which calibration data was not available or the calibration dataset was of limited quantity or quality [33,54,55,56]. Nevertheless, model calibration has to be applied when it is possible in order to decrease the degree of uncertainty in model results. The most common approach in hydrological models’ calibration is the adjustment of several parameters in ranges restricted by the physical boundaries of each, in order to achieve satisfactory match between observed and simulated river discharge. This approach is not applicable for the purposes of the present study since PRDP contributes only with less than 0.7% to the total area of Pinios River basin, and combined to the very mild slopes, the overall contribution of PRDP in surface runoff is very hard to be identified in Pinios main river course. Moreover, some other streams located in PRDP are indicating surface runoff only after severe precipitation events.
Considering the above, SWAT application in PRDP was based on actual evapotranspiration (ETa) calibration. This parameter was chosen due to the fact that it constitutes the major water sink in PRDP and moreover it can be estimated with a satisfactory degree of accuracy. Reference evapotranspiration (ETo) was calculated using the Penman-Monteith formula [57]. Then, potential evapotranspiration for each crop (ETc) cultivated in PRDP, which corresponds to the evapotranspiration that would have occurred under full crop development, was calculated as the product of crop coefficient (Kc) and ETo. This method which was introduced by Jensen [58] and further developed by Doorenbos and Pruitt [59] and Allen et al. [60] gives the ability to adjust ET based on specific crops and local conditions and therefore to have a satisfactory approach of ETc. Kc values after Papazafeiriou [61] and Galanopoulou-Sendouka [62], that are representative of the Greek cultivation environment, were used. Considering the fact that actual crop yields in PRDP during the calibration period (2013–2015) were very close to full development crop yields, as stated by local agricultural cooperatives and farmers, it was assumed that ETa was also very close to ETc. Consequently, ETc for each crop was used as the basis for ETa calibration in SWAT.
Two groups of parameters were adjusted in order to perform SWAT model calibration in PRDP. The first group includes parameters that relate evapotranspiration process and soil. Two parameters were identified to significantly affect actual evapotranspiration, namely the soil evaporation-compensation factor (ESCO) and the plant uptake compensation factor (EPCO). ESCO controls the depth distribution of soil evaporative demands and values of 0.7–0.8 were found to fit better in PRDP. EPCO controls the depth within the soil profile from which plant water uptake can occur and values of 0.95–1.0 were found to improve matching between ETa and ETc. The second group includes parameters that control plant growth and subsequently crop water uptake and actual evapotranspiration.
ET calibration results are presented in Table 1. With regard to corn, the average simulated ETa was found to be very close to the corresponding ETc, as their difference was found to be 3.9 mm or 0.7%. Similarly, the corresponding results for cotton are satisfactory (difference of 3.4 mm or 0.6%). On the average, higher differences between simulated ETa and ETc were noted for sunflower (14.4 mm or 2.7%) and winter wheat (32.1 mm or 10.9%). The highest differences were found for alfalfa (55.0 mm or 7.3%) and kiwi fruit (48.3 mm or 6.6%). As expected, the above results indicate that for all crops the average simulated ETa was found to be lower than ETc. This fact can be attributed to the following: a) intrinsically, the simulated ETa has incorporated the real cultivation and water management practices which may deviate from the nominal conditions assumed in ETc calculation and b) SWAT incorporates pressures resulting from lack of water and nutrients, as well as from the high or low temperature, thus reducing the actual evapotranspiration.

3.2. SEAWAT Model Application

The model grid as well as boundary conditions assigned in PRDP phreatic aquifer are presented in Figure 3. The study area was discretized in 25,080 cells of 50 × 50 m size and the whole model grid area was 62.7 km2. SEAWAT was applied on the phreatic aquifer, the thickness of which varies between 5 and 15 m, while it was simulated as a single layer due to its small thickness and in order to reduce computational effort. The hydraulic interaction of the aquifer with the sea (eastern boundary) was simulated with Dirichlet (or first-type) boundary condition by implementing the Constant Head package of MODFLOW code. Head value was assumed to be 0 m above mean sea level (amsl), while chloride concentration was also kept constant at 21 g/L. The hydraulic communication of the aquifer with talus cones and screes at the west was simulated with Cauchy (or third-type) boundary condition by implementing the General Head package of MODFLOW code. Head values from neighboring wells were used to assign the relevant parameter, while the initially estimated conductance values, on the basis of the boundary geometry and the hydrogeological properties of the aquifer matrix and the bounding formations, were fine trimmed during calibration. The RIVER package of MODFLOW code (Cauchy boundary condition), was employed to account for the hydraulic interaction of the aquifer with the main hydrographic network. River stage and geometry were assigned based on measurements at several points, while river conductance was calibrated following the initially introduced estimates. Finally, capillary rise, as estimated by SWAT for each sub-basin, was introduced in the simulation using the evapotranspiration (ET) package of MODFLOW. Due to the fact that the pumping program and potential of each production well in the aquifer is not known, groundwater abstractions were also incorporated in the ET package at the sub-basin scale, calculated on the basis of irrigation demands resulted from SWAT. To this end, it was assumed that the totally used irrigation water is abstracted from groundwater at the areas where no surface water irrigation network occurs.
SEAWAT model calibration was based on the methodological framework of Siarkos and Latinopoulos [21], according to which steady-state (only groundwater flow), false transient and transient simulations are involved in the calibration procedure. With regard to transient simulation, monthly stress periods were used for a two-year model application period (October 2013–September 2015). The transient model calibration period was from October 2013 to September 2014, while the validation period was from October 2014 to September 2015. Eleven monthly groundwater level datasets and 3 seasonal groundwater chloride datasets were used for each simulation period (calibration and validation). SEAWAT model application performance was made using typical indices such as Mean Error (ME), Mean Absolute Error (MAE), Root Mean Squared Error (RMSE) and normalised RMSE (NRME). Moreover, scatter diagrams were used in which simulated quantities are plotted against observed ones and a linear regression line is fitted through, resulting in line slope (SLP) and correlation coefficient (R2) calculation.
Regarding aquifer’s hydraulic parameters, they were initially assigned based on pumping test data available and were further adjusted during the calibration process. Hydraulic conductivity was found to range between 1.2 and 5 m/d with a trend to decrease on the west-east direction, while specific yield values varied between 0.024 and 0.089. With regard to pollutant transport model, longitudinal dispersivity was calibrated at 5 m, while transverse dispersivity, molecular diffusion and effective porosity were calibrated at 0.1, 1 × 10⁻¹⁰ m2/d and 0.08, respectively.
Transient model calibration and validation results are summarized in Table 2 and Figure 4. Model performance was evaluated for each dataset and the results demonstrated satisfactory matching between simulated and observed groundwater levels and chloride concentrations.
More specifically, with regard to groundwater flow simulation, groundwater level R2 values were found to be very close to 1 (0.992 for calibration and 0.985 for validation periods, respectively) while ME was found to be less than 0.1 m both for calibration and validation periods. MAE was 0.28 m for calibration and 0.45 for validation. Both RMSE and NRMSE values were satisfactory, since RMSE value for calibration was 0.417 m and 0.608 m for validation, while the corresponding values for NRMSE were 1.855% and 2.517%, respectively. The values of SLP were very close to 1 and therefore considered as satisfactory. The fact that SLP value for calibration period was lower than 1 (0.985), indicates that the model slightly underestimates groundwater levels, while for the validation the model slightly overestimates groundwater levels (SLP = 1.019). The corresponding statistical metrics for groundwater Cl concentrations are also indicating satisfactory model performance. R2 was 0.966 for calibration and 0.963 for validation periods, respectively, and therefore very close to 1, which corresponds to the perfect matching between observed and simulated values. ME values were −7.238 mg/L and −6.255 mg/L for calibration and validation periods, respectively, while the corresponding MAE values were 14.745 mg/L and 20.781 mg/L. RMSE and NRMSE values were also found in satisfactory levels: RMSE was 32.077 mg/L for calibration and 41.129 mg/L for validation, while the corresponding values for NRMSE were 6.179 and 7.058%. SLP values were lower but close to 1, thus indicating underestimation of groundwater Cl concentrations both for calibration and validation periods.
The water budget of PRDP phreatic aquifer for the hydrological years 2014 and 2015 is presented in Figure 5. Groundwater recharge from surface water percolation constitutes the major inflow for PRDP aquifer during both years, since it accounts for 5.165 Mm3 for year 2014 and 8.796 Mm3 for year 2015, corresponding to 88% and 95% of total inflows, respectively. Inflows from Pinios River main course and streams located in PRDP are contributing to groundwater budget with 0.52 Mm3 for year 2014 and 0.368 Mm3 for year 2015, corresponding to 9% and 4% of total inflows, respectively. Seawater intrusion accounts for 0.156 Mm3 during 2014 and 0.098 Mm3 during 2015 or 3% and 1% of total inflows, respectively. Inflows from the scree cones can be considered as negligible.
With regard to outflows from PRDP phreatic aquifer, the major outflow includes capillary rise and groundwater pumping, accounting for 5.435 Mm3 or 86% of the total outflows for year 2014, while the corresponding values for year 2015 are 5.965 Mm3 or 77%. The next most significant outflow was found to be groundwater discharge to the hydrographic network, which accounts for 0.663 Mm3 or 10% of total outflows for year 2014 and for 1.256 Mm3 or 16% of total outflows for year 2015. With regard to groundwater discharge to the sea, it was estimated for year 2014 at 0.191 Mm3 or 3.5% of total outflows, while the corresponding values for year 2015 were 0.37 Mm3 and 16%, respectively. Outflows to the scree cones were found to be negligible for year 2014 and less than 2% of total outflows for year 2015.

3.3. Water Budget of PRDP Aquifer under Projected Climate Conditions

Before the presentation and analysis of projected water balance and variation of groundwater chloride concentration, the temporal variation of total annual precipitation and average annual temperature for the two projected periods are presented in Figure 6, as deduced from the results of RACMO2 RCM, driven by ECHAM5-r3 Global Circulation Model (GCM). The results demonstrate a significant decrease trend of 5.2 mm/year for total annual precipitation during the period 2021–2050, while for the period 2071–2100 a very small increase trend of 0.37 mm/year is indicated. Average total annual precipitation for the period 2021–2050 was 615 mm and very close to the corresponding value for the period 1961–1990 (625 mm). The corresponding value for the period 2071–2100 was found about 25% lower (469 mm), thus indicating significantly decreased precipitation during the latter period. Moreover, when counting years with total precipitation lower than 400 mm, which could be considered as threshold for severely dry conditions in the study area, 3 years are counted for the period 1971–1990, 4 years for the period 2021–2050 and 12 years for the period 2071–2100. Even more interestingly, for the reference and the near-future projection (2021–2050) periods, only single year occurrence of annual precipitation of lees than 400 mm is noted. On the contrary, for the projection period 2071–2100, five cases may be observed where 2 or more consecutive dry years (annual precipitation less than 400 mm) occur. Therefore, much drier conditions are indicated for the period 2071–2100 compared to the period 2021–2050. With regard to average annual temperature variation, increase trends are clearly indicated for both projected periods with almost equal rates (0.05 °C/year). Despite the almost equal increase trends, the average annual temperature for the period 2071–2100 (18.0 °C) is much higher than the corresponding value of the period 2021–2050 (15.6 °C). The average annual temperature for the period 1961–1990 was 13.9 °C, thus indicating temperature increase by 1.7 °C for the period 2021–2050 and by 4.1 °C for the period 2071–2100.
The annual variation of aquifer water budget elements for the two projected periods is presented in the box-plots of Figure 7. With regard to inflows, median direct groundwater recharge for the period 2021–2050 is estimated at 7.93 Mm3/year, while the corresponding estimated value for the period 2071–2100 is almost half (4.2 Mm3/year). The minimum and maximum annual groundwater recharge values for the two projected periods are almost equal, likewise the extent of the interquartile range. Nevertheless, it is interesting to mention that the upper bound of the interquartile range for the period 2071–2100 is close to the median of the period 2021–2050; This in turn, indicates considerable variability of annual groundwater recharge, which in absolute values is significantly lower during the period 2071–2100, compared to 2021–2050. Annual median seawater inflows for the period 2021–2050 is estimated at 0.14 Mm3/year while for the period 2071–2100 it is more than triple (0.385 Mm3/year). Moreover, interquartile ranges of the two projected period almost do not coincide, thus indicating significantly different temporal variation pattern of seawater intrusion for the two periods. A similar variation pattern is also presented for the inflows from the hydrographic network, according to which median annual values for the period 2071–2100 is almost triple compared to those of the period 2021–2050 (Figure 7a), while interquartile ranges of the two projected periods almost do not coincide.
The variation of aquifer budget outflows during the two projected periods are presented in Figure 7b. Annual outflows in the form of groundwater abstraction and capillary rise for the satisfaction of irrigation demands were found to be on the median 5.9 Mm3/year for the period 2021–2050, while for the period 2071–2100 8.5% higher (6.4 Mm3/year). With regard to annual groundwater discharge to the sea, its simulated median value was 0.55 Mm3/year for the period 2021–2050, while for the period 2071–2100 it was estimated about two times lower (0.19 Mm3/year). The difference in annual groundwater discharge to rivers between the two projected periods was even higher, since the corresponding values were 1.7 and 0.36 Mm3/year for the periods 2021–2050 and 2071–2100, respectively.

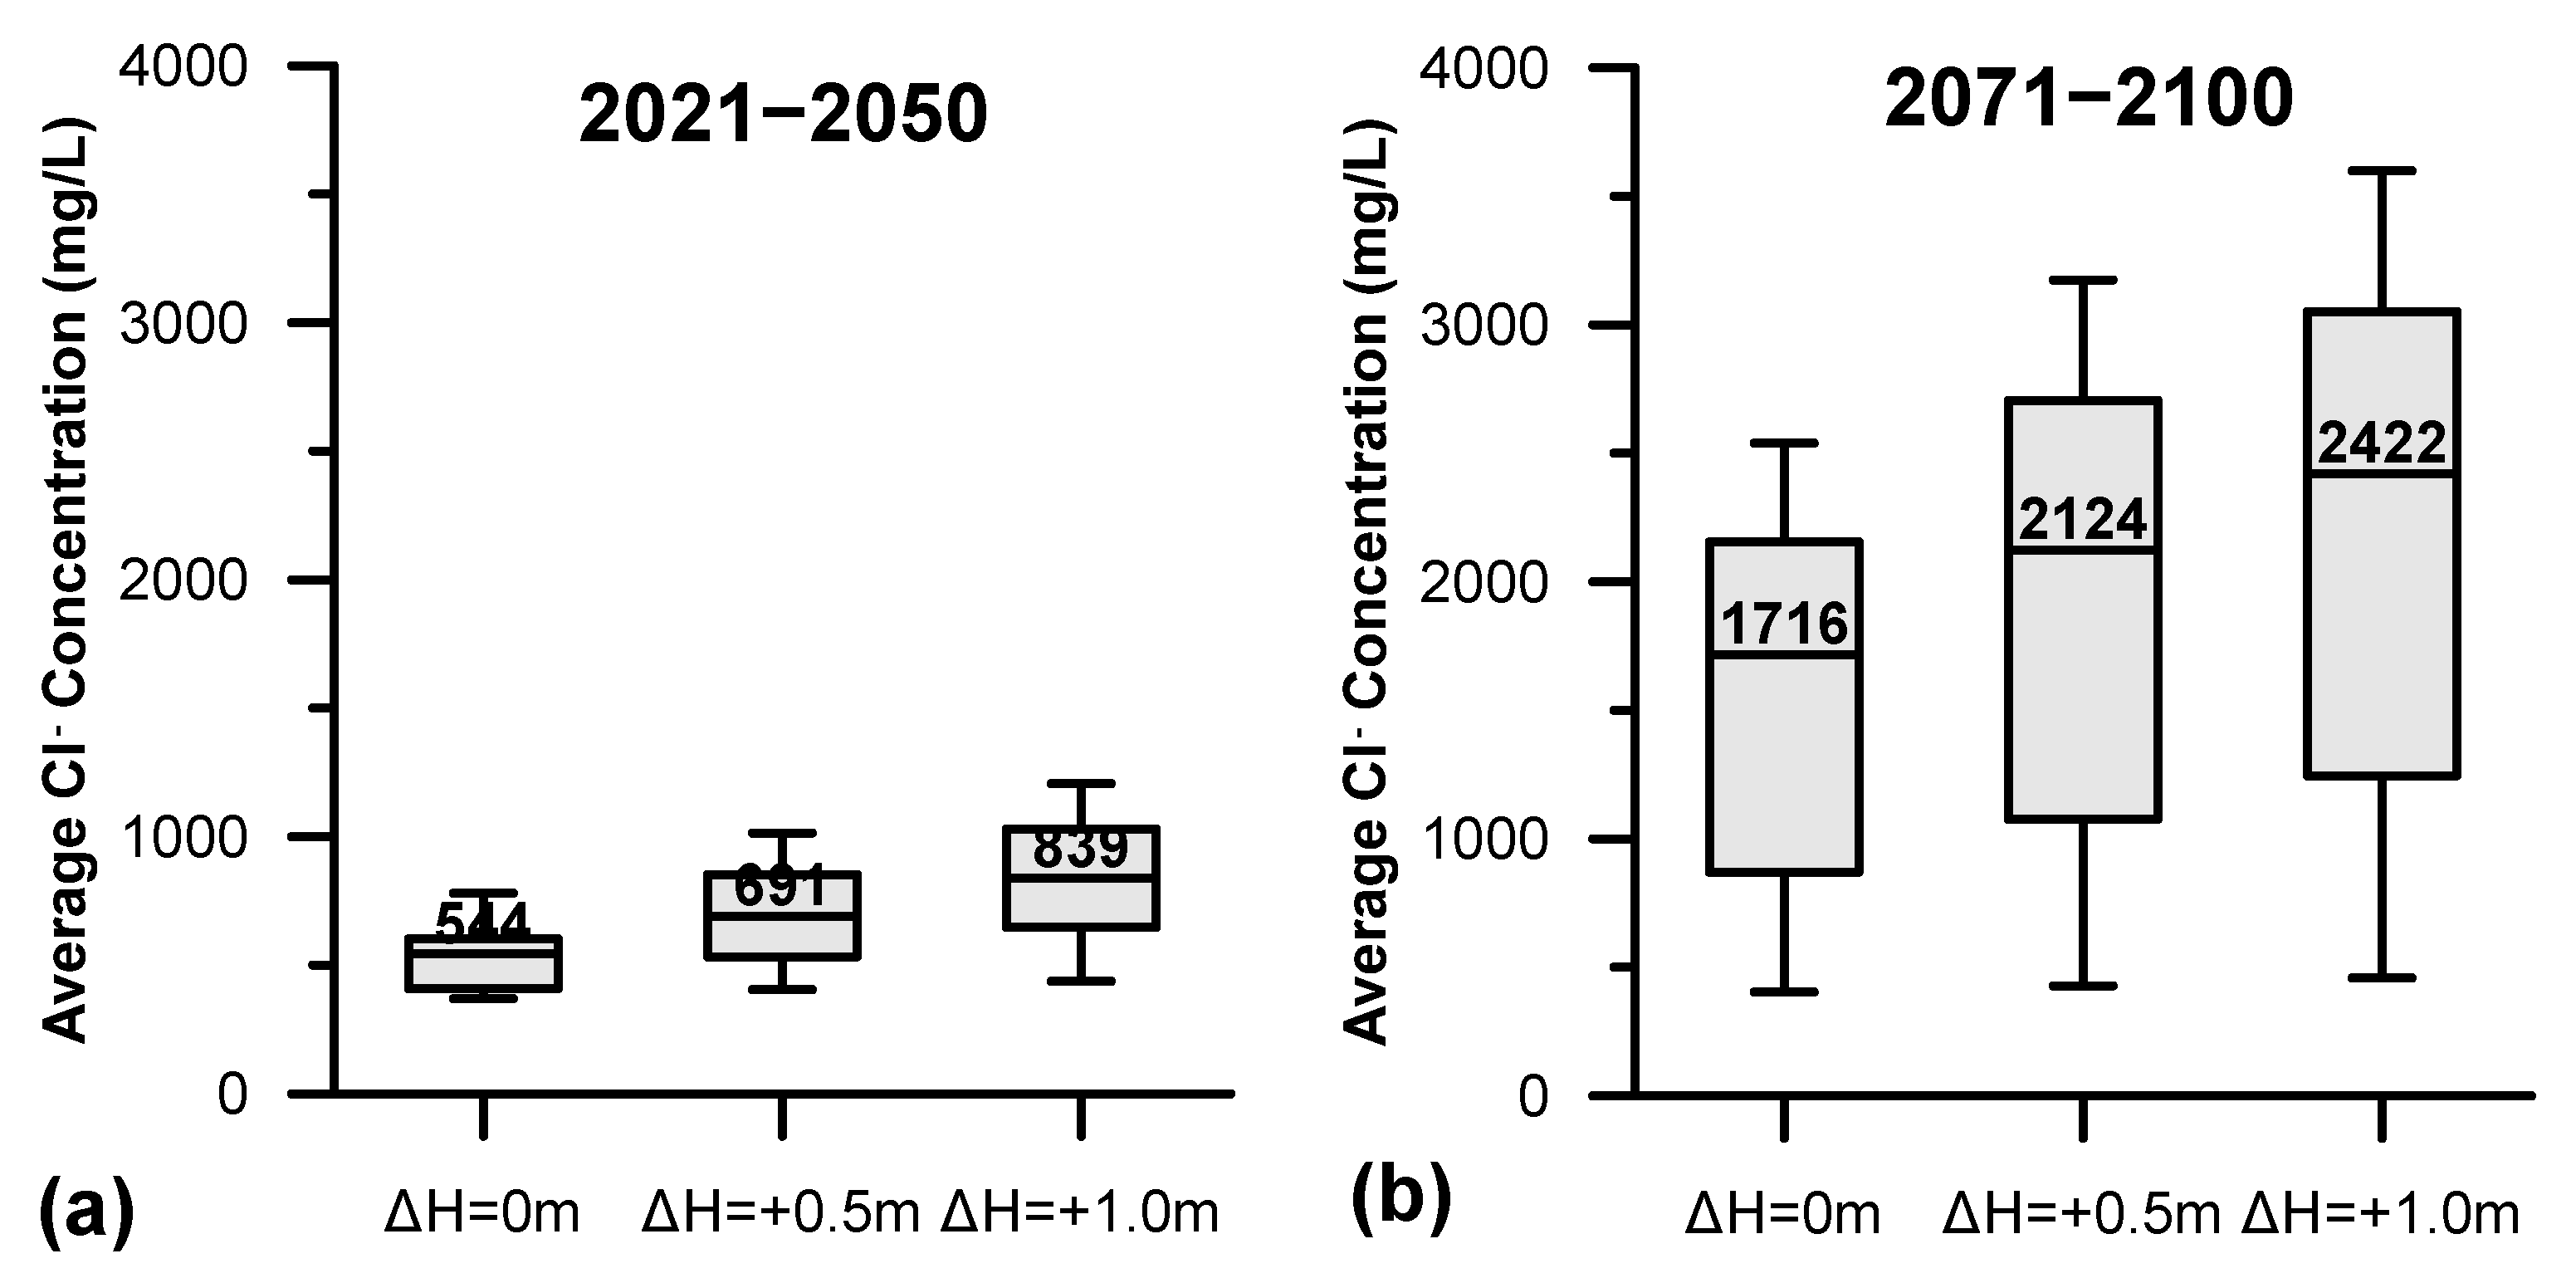
3.4. Groundwater Chloride Concentration in PRDP Aquifer under Projected Climate Conditions

The variation of annual groundwater Cl concentration in PRDP aquifer for the two projected periods is presented in Figure 8 (no sea level rise, ΔH0). Median annual groundwater Cl concentration was found to be 544 mg/L for the period 2021–2050, while for the period 2071–2100 the corresponding value was 1,716 mg/L. The minimum and maximum annual groundwater Cl concentration values for the period 2021–2050 were 369 mg/L and 780 mg/L, respectively, while the corresponding values for the period 2071–2100 were 404 mg/L and 2539 mg/L. Moreover, the interquartile range for the period 2021–2050 was found to be 405 mg/L to 602 mg/L, while for the period 2071–2100 the interquartile range was 862 mg/L to 2145 mg/L.
The significant differences in the water budget of PRDP aquifer between the two projected periods are further reflected in annual groundwater Cl concentration. The median annual groundwater Cl concentration for the period 2071–2100 was found to be more than triple compared to the period 2021–2050 (Figure 7b as opposed to Figure 7a, respectively), while groundwater Cl variation pattern during the two periods is completely different, as demonstrated by the fact that the interquartile ranges do not coincide at all. This is the impact of seawater intrusion on groundwater salinization because of the decrement of precipitation by 24% and the subsequent decrement of groundwater recharge by about 50%, accompanied by the increment of groundwater outflows for irrigation and capillary rise by 8% compared to period 2021–2050.
The spatial distribution of groundwater Cl concentration at the end of the two projected periods is presented in Figure 9. At the end of hydrologic year 2050, the major part of PRDP deltaic aquifer was found to be almost completely unaffected from seawater intrusion, while groundwater Cl concentration values above 2000 mg/L are mainly observed along the coast in a zone of no more than 200 m width. This is very close to the current spatial distribution of groundwater Cl concentration, thus demonstrating that the current water management status does not significantly impact groundwater salinization under the climate conditions predicted by the adopted RCM scenario. The corresponding spatial distribution at the end of the hydrologic year 2100 demonstrate that, although the western part of the aquifer seems to be unaffected from seawater intrusion, the eastern half presents considerable deterioration since the zone with groundwater Cl concentration > 2000 mg/L has been extended up to about 500 m, especially at the southern coastal part, while groundwater Cl concentrations up to 1000 mg/L were simulated for the central part of the aquifer.

3.5. Effects of Sea Level Rise Scenarios on Water Budget and Groundwater Chloride Concentration

The simulated effects of sea level rise by 0.5 m (ΔH0.5) and 1 m (ΔH1) on critical groundwater budget elements for the two projected periods are presented in Figure 10. The effects of sea level rise in seawater intrusion was found to be significant, since seawater intrusion volume was found to be on the median increased by 0.1 Mm3/year (or 71%) under ΔH0.5 scenario and by 0.24 Mm3/year (or 157%) under the ΔH1 scenario for the period 2021–2050. Significant increase in seawater intrusion volume was also simulated for the period 2071–2100, since seawater intrusion volume was found to be on the median increased by 0.18 Mm3/year (or 57%) under ΔH0.5 scenario and by 0.39 Mm3/year (or 100%) under the “ΔH1” scenario. Inflows from rivers indicated decrease trend for both projected periods. More specifically, they were found to be on the median decreased by 0.05 Mm3/year (or 11.6%) under ΔH0.5 scenario and by 0.08 Mm3/year (or 18.6%) under the ΔH1 scenario for the period 2021–2050, compared to no sea level rise (ΔH0). The corresponding decreases for the period 2071–2100 were 0.07 Mm3/year (or 6.0%) under ΔH0.5 scenario and by 0.12 Mm3/year (or 10.4%) under the ΔH1 scenarios.
Regarding sea level rise impact on outflows from PRDP, groundwater discharge to the sea demonstrates decrease trend for both scenarios and both projected periods, while groundwater discharge to rivers demonstrate increase trend. In detail, for the period 2021–2050, groundwater discharge to the sea was found to be on the median decreased by 0.06 Mm3/year (or 10.9%) under ΔH0.5 scenario and by 0.11 Mm3/year (or 20%) under the ΔH1 scenario compared to no sea level rise. The corresponding decrease for the period 2071–2100 was 0.07 Mm3/year (or 36.9%) under ΔH0.5 scenario and 0.1 Mm3/year (or 52.6%) under the ΔH1 scenario. With regard to groundwater discharge to rivers during the period 2021–2050, it was simulated to be increased by 0.12 Mm3/year (or 7.1%) under ΔH0.5 scenario and 0.25 Mm3/year (or 14.7%) under ΔH1 scenario, compared to no sea level rise scenario. Accordingly, for the period 2071–2100, groundwater discharge to rivers was simulated to be increased by 0.14 Mm3/year (or 38.9%) under ΔH0.5 scenario and 0.34 Mm3/year (or 94.4%) under ΔH1 scenario, compared to no sea level rise scenario.
The spatial distribution of groundwater Cl concentration at the end of the two projected periods for all three sea level rise scenarios is presented in Figure 9. An expansion of the high Cl concentration zones is observed which is found to be higher for the central coastal part of the aquifer and, as expected, higher for the ΔH1 scenario compared to the other 2 scenarios.

4. Discussion and Conclusions

4.1. Models Application

The statistic indices used for the assessment of SEAWAT model calibration and validation in PRDP phreatic aquifer indicated satisfactory matching between simulated and observed parameters (groundwater level and chloride concentration). It has to be mentioned that uncertainty in model performance is considerable in the present application originating not only from uncertainty on model conceptualization and the aquifer’s hydraulic parameters’ distribution and values, but also from the short duration of groundwater level and chloride concentration time series (2 years). Although the temporal density of measurements within the 2-year period is relatively high (monthly measurements for groundwater level and seasonal for Cl concentrations), seawater intrusion constitutes a slow process and therefore long times series are increasing model calibration efficiency and therefore reducing uncertainty. According to Werner et al. [17], data scarcity in relation to seawater intrusion is widely observed and it is one of the reasons for lacking seawater intrusion studies on the global scale. Nevertheless, a wide range of studies are offered in the literature which are based on datasets similar to the one used in the present study [63,64,65,66,67,68,69].
With regard to SWAT model application in PRDP, it was calibrated using ETa and assuming that ETa was also equal to ETc. Although this assumption is simplistic, it was based on the fact that actual crop yields were very close to the full development crop yields during the model calibration period. Therefore, despite the uncertainty that such an assumption incorporates in the modeling procedure, it can provide a good quantitative estimate of the land phase of the hydrologic cycle in PRDP watershed. Moreover, ETa has been proved to be an efficient calibration parameter in areas (mainly agricultural) in which ETa constitutes the major hydrologic budget component, when river discharge data is absent [70,71,72].

4.2. Water Budget under Current Climate Conditions

The aquifer budget presented above reveals new evidence and is quantifying hydrological processes in PRDP, for which only qualitative information and approaches were existing until now. Previous studies suggested that there is hydraulic interaction between PRDP aquifer and the Pinios River, but the interaction pattern (recharging or discharging) is variable, depending on the exact location and the season [73,74]. Our results are justifying that there is hydraulic interaction between the Pinios River and the other river courses across PRDP, since both inflows and outflows are simulated. Inflows from surface waters are mainly observed during the dry period for which groundwater levels are lower than surface water levels due to capillary rise and pumping. Outflows from the aquifer to river courses are observed mainly during the wet period since direct groundwater recharge from precipitation is rising groundwater above surface water levels. Moreover, the variation of inflows and outflows related to surface waters was found to be high during the simulation period, thus indicating that the interaction of surface and ground waters in PRDP is highly dynamic and in line with the corresponding variation in climate conditions affecting direct groundwater recharge. Although not clearly mentioned in previous studies, Pinios River was thought to be the factor that dominates in aquifer budget and controls it. Our results indicate that although the hydraulic interaction is clear, the contribution of the river to the water budget is significant but not dominant.
According to the results presented above, the dominant inflow to PRDP phreatic aquifer is direct groundwater recharge from precipitation. Although the dominant inflow (about 90% of total inflows), groundwater recharge for PRDP phreatic aquifer was found to be 11.1% and 19.9% of total precipitation for years 2014 (620 mm) and 2015 (589 mm), respectively. According to Lambrakis et al. [75], direct groundwater recharge for Glafkos alluvial plain was estimated at 20% of total annual precipitation. Pisinaras et al. [76] estimated direct groundwater recharge rates varying between 10.3% and 13.3% of total annual precipitation in Xanthi’s alluvial plain, while groundwater recharge rates for other alluvial aquifers in Greece are also reported in this study, ranging between 9.5% and 15% of total annual precipitation.
With regard to hydraulic interaction of the study area aquifer with the scree cones located at the western part of PRDP, it could be expected to constitute a significant inflow due to the fact that these formations are typically indicating high groundwater potential. Nevertheless, our findings indicate that the contribution of scree cones in PRDP groundwater budget is practically negligible. This finding comes in agreement with hydrolithological information about the study area, which indicate that these formations are expected to be of poor groundwater potential with hydraulic conductivity values ranging between 10−7 and 10−5 m/sec. Except from the scree cones, the hydraulic interaction of study area aquifer with the sea was also found to be limited, while outflow of phreatic aquifer to the sea was found to be higher than the corresponding inflow. The restricted hydraulic interaction is attributed to: (a) the low permeability sand dunes developed in the central part of the coastal zone as described by Alexopoulos et al. [30] and (b) to the climate and hydrological conditions prevailing during the simulation period.
The major outflow from the phreatic aquifer corresponds to groundwater pumping and capillary rise from the saturated to unsaturated zone. Similarly to other agricultural areas [38,77,78] capillary rise was found to significantly contribute to the satisfaction of crop water requirements. The experimental runs conducted with HYDRUS-1D model, indicated capillary rise contribution ranging up to 280 mm per cultivation period for the crops cultivated in PRDP. These results come in agreement with those of Babajimopoulos et al. [79], according to which groundwater contribution to crop water requirements were 283.8 mm for irrigated maize in the plain of Thessaloniki, located adjacent to PRDP.

4.3. Projected Climate Change Impacts

Projected climate change signal for the study area, as retrieved by RCM data, indicated: (a) a decrease in precipitation by 1.6% and an average increase in temperature by 1.7 °C for the period 2021–2050 and (b) an average decrease in annual precipitation by about 25% and an average increase in annual temperature by 4.1 °C for the period 2071–2100. Comparing to previous studies for the whole Pinios River basin, a decrease in precipitation by 5% for the period 2021–2040 and by 25% for the period 2081–2100 were reported by Arampatzis et al. [47], in the study of which data from three RCMs was incorporated. With regard to temperature, the results of the aforementioned study indicated increase by 1.7 °C for the period 2021–2040 and increase by 4 °C for the period 2081–2100. Zanis et al. [80] used the PRUDENCE dataset consisting of nine RCMs, and their results for central-eastern Greece indicated an annual precipitation decrease by 15.5% and an average annual temperature increase by 4.0 °C for the period 2071–2100. In conclusion, two highly different scenarios are created according to which precipitation is practically stable and temperature is moderately increased for the period 2021–2050 and precipitation is significantly decreased and temperature is significantly decreased for the period 2071–2100.
The significant differences in the major aquifer budget elements between the two periods indicate the impact of the corresponding differences in temperature, but mainly in precipitation variation. Despite the fact that, on the median, precipitation decrease for the period 2071–2100 was 25%, the corresponding decrease in groundwater recharge was almost double (47%). This can be attributed not only to the decreased precipitation volume but also to changes in precipitation intensities within the hydrological year, as well as changes in wet and dry spells distribution. According to Pisinaras [49], different groundwater recharge volumes should be expected even when wet spells are of equal duration and precipitation intensity but the duration of intervening dry spells is different. Indeed, during the second climate projection period studied (2071–2100) there are consecutive periods of dry spells consisting of at least two consecutive years of low annual precipitation (below 400 mm). These differences are impacting the complex soil water balance and therefore soil water percolation and groundwater recharge. Moreover, increased ET due to temperature increase constitute another reason for the significant decrease of groundwater recharge. When expressing groundwater recharge as percentage of precipitation, its value for the period 2021–2050 was 17.9% while for the period 2071–2100 it was 13.3%. This fact comes to underline that the simplistic approach of assigning a constant percentage of precipitation for groundwater recharge may significantly affect groundwater budget results and their interpretation, especially in climate change impact assessment studies.
With regard to the hydraulic interaction of PRDP phreatic aquifer with the sea, the results indicate two contrasting situations for the two projected periods: (a) significantly higher groundwater discharge to the sea compared to seawater intrusion during the period 2021–2050 and (b) significantly higher seawater intrusion compared to groundwater discharge to the sea during the period 2071–2100. The above demonstrate the notably higher water quality deterioration potential during the period 2071–2100 due to seawater intrusion caused by decreased groundwater recharge and increased crop water demand. This is also indicated by the fact that during the period 2021–2050, seawater intrusion constitutes about 1.7% of the total inflows, while during the period 2071–2100, it raises to 6.7%. Moreover, the significant impact of change in precipitation variation in seawater intrusion is also underlined, since the decrease of precipitation by 25% during the period 2071–2100 and the subsequent changes in hydrologic cycle resulted, on the median, in 4 times higher seawater intrusion compared to the period 2021–2050 and expansion of the high groundwater salinity area by about 250 m. Despite the fact that the current high groundwater salinity area is covered mainly by touristic houses and facilities, the aforementioned expansion will pose groundwater of high salinity in the cultivated area, thus increasing the possibility of agricultural land deterioration or abandonment.
Similarly contrasting results are demonstrated for the hydraulic interaction of PRDP phreatic aquifer with Pinios River and the other courses. During the period 2021–2050, groundwater discharge to rivers was about four times higher than the corresponding inflows, while during the period 2071–2100, groundwater discharge to rivers was about 3 times lower. This is attributed to the fact that groundwater level is for the most time lower than river water level, as a result of reduced groundwater recharge caused by reduced precipitation, increased irrigation demands and in conjunction to occurrence of prolonged consecutive dry spells.
Since water budget of PRDP phreatic aquifer is controlled by groundwater recharge and subsequently from precipitation, the significantly decreased precipitation during the period 2071–2100 resulted in significantly decreased groundwater recharge and therefore in significant and contrasting changes in water budget, compared to period 2021–2050. Taking into account the results of several climate change impact assessment studies compiled for Pinios River basin which indicate decreasing trend in precipitation and high inter-annual variability [47,80,81], the anticipated effects in PRDP phreatic aquifer budget have to be strongly considered for effective water management, mainly due to the fact that: (a) precipitation affects groundwater recharge, which constitutes the major inflow and subsequently the whole water budget, (b) PRDP phreatic aquifer potential and buffer capacity, hence resilience to climate change phenomena, is relatively restricted because of its hydraulic characteristics and limited thickness. Considering the increased by about 9% groundwater abstractions, water stress potential for PRDP phreatic aquifer is further increased. Since groundwater abstractions from PRDP phreatic aquifer are fully allocated to irrigation, decreasing irrigation water demand would act beneficially towards decreasing the water stress of the aquifer. Sprinkler irrigation systems are dominating in PRDP, which can be substituted by the much more efficient drip irrigation systems. Moreover, for some crops such as cotton and corn which are cultivated in PRDP, deficit irrigation has been proved to be very effective for decreasing irrigation water consumption with a negligible loss on crop production [82,83].
The fact that PRDP phreatic aquifer presents limited groundwater storage capacity indicate the necessity for short-term effective water resources management in order to avoid significant deterioration of both its quality and quantity status, especially under the high variability in groundwater recharge posed by the high variability of precipitation.
Shallow aquifers such as this of PRDP could be of high importance both from the environmental and socio-economic point of view due to the fact that these aquifers: (a) support the ecosystems developed especially in deltaic areas through a wide range of hydro-environmental processes such as baseflow and (b) constitute a technically and economically feasible solution for water abstraction in order to support the agricultural production and therefore local food security and economy. Another aspect that has not been investigated in the present study but has to be mentioned as critical for shallow aquifers and the interacting ecosystems is the influence of air temperature increase in groundwater temperature. Taylor and Stefan [84] indicate that in the extreme case of atmospheric carbon dioxide doubling, groundwater temperature could be increased by 4 °C in the Minneapolis/St. Paul metropolitan area. Kurylyk et al. [85] simulated temperature increase up to 3.6 °C of groundwater discharge to the adjacent river for the period 2045–2065, while they emphasize the influence of aquifer dimensions in thermal response of shallow, unconfined aquifers to climate change. Moreover, the projected dramatic reduction in outflow to Pinios River is suggested to have a serious adverse effect on the riparian zone of the river, thus impacting not only on the abiotic but also on the biotic factors of the regional ecosystem. Last but not least, soil salinization, which constitutes a common problem for the Mediterranean coastal areas [86], will potentially increase because of the increasing salt content of irrigation water and the increasing irrigation water demand. Soil salinization constitutes one of the major threats for Mediterranean agriculture and desertification. For instance, Zekri et al. [87] estimated that the currently applied irrigation water management practices in Batinah region of Oman will result in 46% loss of the cropland.
With regard to sea level rise, both scenarios indicated further increment of groundwater salinity for both projected periods. When comparing seawater intrusion volumes for the two projected periods under the no sea level rise scenario to the impact of sea level rise it can be concluded that the impact of groundwater recharge decrement is higher than sea level rise by 0.5 or 1 m. This finding comes in agreement with the study of Stigter et al. [15], according to which sea level rise was found to be less significant than the decrease in groundwater recharge and increase in crop water needs under climate change conditions for three Mediterranean aquifers. Nevertheless, when assessing the combined effects of high sea level rise and high groundwater recharge decrease (ΔH1 scenario for the period 2071–2100) it is remarkable, since it indicated more than 5 times higher seawater intrusion volumes, compared to the ΔH0 scenario for the period 2021–2050. Considering that land-surface inundation has not been incorporated in the simulation, the aquifer deterioration potential from sea level rise could be higher.

5. Conclusions

SWAT and SEAWAT models were implemented in the PRDP in order to simulate and quantify the effects of current agricultural water management practices to the groundwater budget and groundwater salinization status of the underlying shallow, unconfined aquifer under current and projected climate conditions. Despite the uncertainty incorporated in the modeling process, the corresponding results revealed significant insight on the hydrogeologic/hydraulic behavior of the aquifer: (a) direct groundwater recharge from precipitation was found to be the dominant inflow to PRDP aquifer, (b) aquifer-river hydraulic interaction is variable depending both on the exact location and season, (c) capillary rise from the saturated to the unsaturated zone was found to significantly contribute to the satisfaction of crop water requirements.
Despite the fact that during the calibration/validation period, the aquifer was not found to be affected by seawater intrusion, as indicated from the simulation of Cl concentrations with the SEAWAT model, the corresponding results for the projected period 2071–2100 indicate that groundwater salinization potential could be significantly increased mainly because of the significant decrease of precipitation which leads to direct groundwater recharge decrease. The aquifer is further stressed due to the increased groundwater abstractions needed for the satisfaction of the increased crop water requirements. Sea level rise was found to further contribute to increasing groundwater salinization but nevertheless, the significant decrease in precipitation was found to have a higher impact on groundwater budget and subsequently to groundwater salinization.
Considering the above and taking into account the fact that shallow aquifers such as this of PRDP could be of high importance both from the environmental and socio-economic point of view, both short and long-term effective water resources management strategies have to be developed in order to avoid significant deterioration of both its quality and quantity status, especially under the high variability in groundwater recharge posed by the high variability of precipitation. Maintaining sufficient crop production and simultaneously ecosystem’s functions and integrity should be the priority axis followed towards the development of sustainable, integrated water resources management strategies.

Author Contributions

Writing—original draft preparation, V.P.; writing—review and editing, C.P. and A.P.; modeling, V.P. and C.P.; conceptualization, V.P., C.P. and A.P.; methodology, V.P., C.P. and A.P.; data curation, V.P. and C.P.; supervision, A.P.; funding aquisition, A.P. All authors have read and agreed to the published version of the manuscript.

Funding

This research work was elaborated in the framework of the project “AGROCLIMA”, under the national action “SYNERGASIA 2011: Partnerships of Production and Research Institutions in Focused Research and Technology Sectors” that is co-funded by the European Regional Development Fund of the EU and National Resources of Hellenic Government.

Institutional Review Board Statement

Not applicable.

Informed Consent Statement

Not applicable.

Data Availability Statement

The data presented in this study are available on request from the corresponding author.

Acknowledgments

The author would like to acknowledge the fruitful comments of the four anonymous reviewers who provided beneficial suggestions that improved the quality of this paper.

Conflicts of Interest

The authors declare no conflict of interest.

References

  1. Shiklomanov, I.A.; Rodda, J.C. World Water Resources at the Beginning of the Twenty-First Century; Cambridge University Press: Cambridge, UK, 2003; ISBN 9780521617222. [Google Scholar]
  2. Rost, S.; Gerten, D.; Bondeau, A.; Lucht, W.; Rohwer, J.; Schaphoff, S. Agricultural Green and Blue Water Consumption and Its Influence on the Global Water System. Water Resour. Res. 2008, 44, 44. [Google Scholar] [CrossRef] [Green Version]
  3. Thivet, G.; Fernandez, S. Water Demand Management: The Mediterranean Experience; Global Water Partnership (GWP): Stockholm, Sweden, 2012; ISBN 9185321885. [Google Scholar]
  4. Bates, B.C.; Kundzewicz, Z.; Wu, S.; Palutikof, J. Climate Change and Water, IPCC Technical Paper VI; Intergovernmental Panel on Climate Change (IPCC): Geneva, Switzerland, 2008; ISBN 9789291691234. [Google Scholar]
  5. Alpert, P.; Hemming, D.; Jin, F.; Kay, G.; Kitoh, A.; Mariotti, A. The Hydrological Cycle of the Mediterranean; Springer Science and Business Media: Berlin/Heidelberg, Germany, 2013; Volume 50, pp. 201–239. [Google Scholar]
  6. Mariotti, A.; Zeng, N.; Yoon, J.-H.; Artale, V.; Navarra, A.; Alpert, P.; Li, L.Z.X. Mediterranean Water Cycle Changes: Transition to Drier 21st Century Conditions in Observations and CMIP3 Simulations. Environ. Res. Lett. 2008, 3, 044001. [Google Scholar] [CrossRef]
  7. De Fraiture, C.; Wichelns, D. Satisfying Future Water Demands for Agriculture. Agric. Water Manag. 2010, 97, 502–511. [Google Scholar] [CrossRef]
  8. Molden, D. Water for Food, Water for Life: A Comprehensive Assessment of Water Management in Agriculture; Earthscan: London, UK, 2007; ISBN 9781844073979. [Google Scholar]
  9. Olesen, J.; Trnka, M.; Kersebaum, K.; Skjelvåg, A.; Seguin, B.; Peltonensainio, P.; Rossi, F.; Kozyra, J.; Micale, F. Impacts and Adaptation of European Crop Production Systems to Climate Change. Eur. J. Agron. 2011, 34, 96–112. [Google Scholar] [CrossRef]
  10. Garrote, L.; Iglesias, A.; Granados, A.; Mediero, L.; Martín-Carrasco, F. Quantitative Assessment of Climate Change Vulnerability of Irrigation Demands in Mediterranean Europe. Water Resour. Manag. 2014, 29, 325–338. [Google Scholar] [CrossRef]
  11. Garrido, A.; Iglesias, A. Groundwater’s Role in Managing Water Scarcity in the Mediterranean Region. In Proceedings of the International Symposium on Groundwater Sustainability (ISGWAS), Alicante, Spain, 24–27 January 2006; pp. 113–138. [Google Scholar]
  12. Fornés, J.M.; La Hera, Á.; Llamas, M.R. The Silent Revolution in Groundwater Intensive Use and Its Influence in Spain. Hydrol. Res. 2005, 7, 253–268. [Google Scholar] [CrossRef]
  13. Mazi, A.; Koussis, A.D.; Destouni, G. Intensively Exploited Mediterranean Aquifers: Resilience to Seawater Intrusion and Proximity to Critical Thresholds. Hydrol. Earth Syst. Sci. 2014, 18, 1663–1677. [Google Scholar] [CrossRef] [Green Version]
  14. Nixon, S.; Trent, Z.; Marcuello, C.; Lallana, C. Europe’s Water: An Indicator-Based Assessment; European Environment Agency: Copenhagen, Denmark, 2003. [Google Scholar]
  15. Stigter, T.Y.; Nunes, J.P.; Pisani, B.J.; Fakir, Y.; Hugman, R.; Li, Y.; Tome, S.M.; Ribeiro, L.F.; Samper, J.; Oliveira, R.; et al. Comparative Assessment of Climate Change and Its Impacts on Three Coastal Aquifers in the Mediterranean. Reg. Environ. Chang. 2014, 14, 41–56. [Google Scholar] [CrossRef]
  16. Haj-Amor, Z.; Acharjee, T.K.; Dhaouadi, L.; Bouri, S. Impacts of Climate Change on Irrigation Water Requirement of Date Palms under Future Salinity Trend in Coastal Aquifer of Tunisian Oasis. Agric. Water Manag. 2020, 228, 105843. [Google Scholar] [CrossRef]
  17. Werner, A.D.; Bakker, M.; Post, V.E.A.; Vandenbohede, A.; Lu, C.; Ataie-Ashtiani, B.; Simmons, C.T.; Barry, D. Seawater Intrusion Processes, Investigation and Management: Recent Advances and Future Challenges. Adv. Water Resour. 2013, 51, 3–26. [Google Scholar] [CrossRef]
  18. Alcolea, A.; Contreras, S.; Hunink, J.E.; García-Aróstegui, J.L.; Jimenez-Martinez, J. Hydrogeological Modelling for the Watershed Management of the Mar Menor Coastal Lagoon (Spain). Sci. Total. Environ. 2019, 663, 901–914. [Google Scholar] [CrossRef] [PubMed]
  19. Voss, C.I.; Provost, A.M. SUTRA: A model for 2D or 3D Saturated-Unsaturated, Variable-Density Ground-Water Flow with Solute or Energy Transport. Water-Resour. Investig. Rep. 2002, 4231. [Google Scholar] [CrossRef]
  20. Hugman, R.; Stigter, T.Y.; Costa, L.; Monteiro, J.-P. Numerical Modelling Assessment of Climate-Change Impacts and Mitigation Measures on the Querença-Silves Coastal Aquifer (Algarve, Portugal). Hydrogeol. J. 2017, 25, 2105–2121. [Google Scholar] [CrossRef]
  21. Siarkos, I.; Latinopoulos, P. Modeling Seawater Intrusion in Overexploited Aquifers in the Absence of Sufficient Data: Application to the Aquifer of Nea Moudania, Northern Greece. Hydrogeol. J. 2016, 24, 2123–2141. [Google Scholar] [CrossRef]
  22. Abd-Elhamid, H.F.; Abdelaty, I.; Sherif, M. Evaluation of Potential Impact of Grand Ethiopian Renaissance Dam on Seawater Intrusion in the Nile Delta Aquifer. Int. J. Environ. Sci. Technol. 2019, 16, 2321–2332. [Google Scholar] [CrossRef]
  23. Khadra, W.M.; Stuyfzand, P.J. Simulation of Saltwater Intrusion in a Poorly Karstified Coastal Aquifer in Lebanon (Eastern Mediterranean). Hydrogeol. J. 2018, 26, 1839–1856. [Google Scholar] [CrossRef]
  24. Romanazzi, A.; Gentile, F.; Polemio, M. Modelling and Management of a Mediterranean Karstic Coastal Aquifer under the Effects of Seawater Intrusion and Climate Change. Environ. Earth Sci. 2015, 74, 115–128. [Google Scholar] [CrossRef]
  25. Romanazzi, A.; Polemio, M. Modellazione Degli Acquiferi Carsici Costieri a Supporto Della Gestione: IL Caso Del Salento (PUGLIA). Ital. J. Eng. Geol. Environ. 2013, 2013, 65–83. [Google Scholar] [CrossRef]
  26. Arnold, J.G.; Srinivasan, R.; Muttiah, R.S.; Williams, J.R. Large Area Hydrologic Modeling and Assessment Part I: Model Development. JAWRA J. Am. Water Resour. Assoc. 1998, 34, 73–89. [Google Scholar] [CrossRef]
  27. Arnold, J.G.; Kiniry, J.R.; Srinivasan, R.; Williams, J.R.; Haney, E.B.; Neitsch, S.L. Soil and Water Assessment Tool, Input/Output Documentation—Version 2012; Texas Water Resources Institute: College Station, TX, USA, 2012; Available online: https://swat.tamu.edu/media/69296/swat-io-documentation-2012.pdf. (accessed on 31 December 2020).
  28. Langevin, C.D.; Thorne Jr., D.T.; Dausman, A.M.; Sukop, M.C.; Guo, W. SEAWAT Version 4: A Computer Program. for Simulation of Multi-Species Solute and Heat Transport. Tech. Methods 2008, 6. [Google Scholar] [CrossRef]
  29. Katsikatsios, G.; Migiros, G. Rapsani Sheet—Geological Map in Scale 1:50,000; Institute of Geology and Mineral Exploration: Athens, Greece, 1982. [Google Scholar]
  30. Alexopoulos, J.; Matiatos, J.; Dilalos, S.; Vassilakis, E.; Panagopoulos, A.; Ghionis, G.; Poulos, S. Investigation of the Phreatic Aquifer Development at the Pinios Delta Basin (Thessaly), through a Combination of Geophysical and Hydrogeological Data. In Proceedings of the 10th Congress of the Hellenic Geographical Society, Mytilene, Greece, 22–24 October 2014; pp. 1130–1139. [Google Scholar]
  31. McDonald, M.G.; Harbaugh, A.W. A Modular Three-Dimensional Finite-Difference Ground-Water Flow Model; U.S. Department of Energy Office of Scientific and Technical Information: Oak Ridge, TN, USA, 1988. [Google Scholar]
  32. Zheng, C.; Wang, P.P. MT3DMS: A Modular Three-Dimensional Multispecies Transport Model for Simulation of Advection, Dispersion and Chemical Reactions of Contaminants in Groundwater Systems, Documentation and User’s Guide; Engineer Research and Development Center: Washington, DC, USA, 1999. [Google Scholar]
  33. Srinivasan, R.; Zhang, X.; Arnold, J.G. SWAT Ungauged: Hydrological Budget and Crop Yield Predictions in the Upper Mississippi River Basin. Trans. ASABE 2010, 53, 1533–1546. [Google Scholar] [CrossRef]
  34. Neitsch, S.L.; Arnold, J.G.; Kiniry, J.R.; Williams, J.R. Soil and Water Assessment Tool, Theoritical Documentation; Version 2009; Texas A&M University: College Station, TX, USA, 2011. [Google Scholar]
  35. Monteith, J.L. Climate and the Efficiency of Crop Production in Britain. Philos. Trans. R. Soc. Lond. B 1977, 281, 277–294. [Google Scholar] [CrossRef]
  36. Šimůnek, J.; Šejna, M.; Saito, H.; Sakai, M.; van Genuchten, M.T. The HYDRUS-1D Software Package for Simulating the One-Dimensional Movement of Water, Heat, and Multiple Solutes in Variably-Saturated Media; Department of Environmental Sciences, University of California: Riverside, CA, USA, 2009. [Google Scholar]
  37. Akhtar, F.; Tischbein, B.; Awan, U.K. Optimizing Deficit Irrigation Scheduling Under Shallow Groundwater Conditions in Lower Reaches of Amu Darya River Basin. Water Resour. Manag. 2013, 27, 3165–3178. [Google Scholar] [CrossRef]
  38. Awan, U.K.; Tischbein, B.; Martius, C. A GIS—Based Approach for Up-Scaling Capillary Rise from Field to System Level under Soil-Crop-Groundwater MIX. Irrig. Sci. 2014, 32, 449–458. [Google Scholar] [CrossRef]
  39. Khakbaz, B.; Imam, B.; Hsu, K.; Sorooshian, S. From Lumped to Distributed via Semi-distributed: Calibration Strategies for Semi-distributed Hydrologic Models. J. Hydrol. 2012, 61–77. [Google Scholar] [CrossRef] [Green Version]
  40. Chang, S.W.; Nemec, K.; Kalin, L.; Clement, T.P. Impacts of Climate Change and Urbanization on Groundwater Resources in a Barrier Island. J. Environ. Eng. 2016, 142, 4016001. [Google Scholar] [CrossRef] [Green Version]
  41. Toulios, L.; Lelentzis, T.; Lipimenou, E. Soil Survey of Pinios River Delta; Hellenic National Research Foundation: Larisa, Greece, 1997. [Google Scholar]
  42. Van Meijgaard, E.; Van Ulft, L.H.; Van De Berg, W.J.; Bosveld, F.C.; Van Den Hurk, B.J.J.M.; Lenderink, G.; Siebesma, A.P. The KNMI Regional Atmospheric Climate Model RACMO Version 2.1; Koninklijk Nederlands Meteorologisch Instituut: De Bilt, The Netherlands, 2008. [Google Scholar]
  43. Karali, A.; Hatzaki, M.; Giannakopoulos, C.; Roussos, A.; Xanthopoulos, G.; Tenentes, V. Sensitivity and Evaluation of Current Fire Risk and Future Projections Due to Climate Change: The Case Study of Greece. Nat. Hazards Earth Syst. Sci. 2014, 14, 143–153. [Google Scholar] [CrossRef] [Green Version]
  44. ENSEMBLES RCM—Specific Weights Based on Their Ability to Simulate the Present Climate Calibrated for the ERA40-Based Simulations; Deliverable 3.2.2 of ENSEMBEL Project; ENSEMBLES RCM: Cincinnati, OH, USA, 2009.
  45. Deidda, R.; Marrocu, M.; Caroletti, G.N.; Pusceddu, G.; Langousis, A.; Lucarini, V.; Puliga, M.; Speranza, A. Regional Climate Models’ Performance in Representing Precipitation and Temperature over Selected Mediterranean Areas. Hydrol. Earth Syst. Sci. 2013, 17, 5041–5059. [Google Scholar] [CrossRef] [Green Version]
  46. Kostopoulou, E.; Giannakopoulos, C.; Hatzaki, M.; Tziotziou, K. Climate Extremes in the NE Mediterranean: Assessing the E-OBS Dataset and Regional Climate Simulations. Clim. Res. 2012, 54, 249–270. [Google Scholar] [CrossRef]
  47. Arampatzis, G.; Panagopoulos, A.; Pisinaras, V.; Tziritis, E.; Wendland, F. Identifying Potential Effects of Climate Change on the Development of Water Resources in Pinios River Basin, Central Greece. Appl. Water Sci. 2018, 8, 51. [Google Scholar] [CrossRef] [Green Version]
  48. Pisinaras, V.; Wei, Y.; Bärring, L.; Gemitzi, A. Conceptualizing and Assessing the Effects of Installation and Operation of Photovoltaic Power Plants on Major Hydrologic Budget Constituents. Sci. Total. Environ. 2014, 493, 239–250. [Google Scholar] [CrossRef] [PubMed]
  49. Pisinaras, V. Assessment of Future Climate Change Impacts in a Mediterranean Aquifer. Glob. NEST J. 2016, 18, 119–130. [Google Scholar] [CrossRef]
  50. IPCC. Climate Change 2014: Synthesis Report. In Contribution of Working Groups I, II and III to the Fifth Assessment Report of the Intergovernmental Panel on Climate Change; IPCC: Geneva, Switzerland, 2014. [Google Scholar]
  51. Rahmstorf, S. A Semi-Empirical Approach to Projecting Future Sea-Level Rise. Science 2007, 315, 368–370. [Google Scholar] [CrossRef] [PubMed] [Green Version]
  52. Hansen, E.J. Scientific Reticence and Sea Level Rise. Environ. Res. Lett. 2007, 2, 024002. [Google Scholar] [CrossRef]
  53. Ketabchi, H.; Mahmoodzadeh, D.; Ataie-Ashtiani, B.; Simmons, C.T. Sea-Level Rise Impacts on Seawater Intrusion in Coastal Aquifers: Review and Integration. J. Hydrol. 2016, 535, 235–255. [Google Scholar] [CrossRef]
  54. Gitau, M.W.; Chaubey, I. Regionalization of SWAT Model Parameters for Use in Ungauged Watersheds. Water 2010, 2, 849–871. [Google Scholar] [CrossRef]
  55. Omani, N.; Srinivasan, R.; Lee, T. Estimating Sediment. and Nutrient Loads of Texas Coastal Watersheds with SWAT A Case Study of Galveston Bay and Matagorda Bay; Final Report for the Texas Water Development Board; Texas A&M University: College Station, TX, USA, 2012. Available online: https://www.twdb.texas.gov/publications/reports/contracted_reports/doc/1004831012_SWAT.pdf (accessed on 31 December 2020).
  56. Prabhanjan, A.; Rao, E.P.; Eldho, T. Application of SWAT Model and Geospatial Techniques for Sediment-Yield Modeling in Ungauged Watersheds. J. Hydrol. Eng. 2015, 20, 6014005. [Google Scholar] [CrossRef]
  57. Monteith, J.L. Evaporation and Environment. Symp. Soc. Exp. Biol. 1965, 19, 205–234. [Google Scholar]
  58. Jensen, M.E. Water Consumption by Agricultural Plants (Chapter 1). In Water Deficits and Plant Growth; Kozlowski, T.T., Ed.; Academic Press: New York, NY, USA, 1968; pp. 1–22. [Google Scholar]
  59. Doorenbos, J.; Pruitt, W.O. Guidelines for Predicting Crop Water Requirements, FAO Irrigation and Drainage Paper No. 24; Food and Agriculture Organization (FAO): Rome, Italy, 1977; ISBN 9251002797. [Google Scholar]
  60. Allen, R.G.; Pereira, L.S.; Raes, D.; Smith, M. Crop. Evapotranspiration: Guidelines for Computing Crop Water Requirements. FAO Irrigation and Drainage Paper 56; Food and Agriculture Organization of the United Nations: Rome, Italy, 1998; ISBN 9251042195. [Google Scholar]
  61. Papazafeiriou, Z. Crop. Irrigation Needs; Zitis Publishing: Thessaloniki, Greece, 1999; ISBN 960-431-580-3. (In Greek) [Google Scholar]
  62. Galanopoulou-Sendouka, S. Industrial Crops; Stamoulis Publishing: Athens, Greece, 2002. [Google Scholar]
  63. Cobaner, M.; Yurtal, R.; Dogan, A.; Motz, L.H. Three Dimensional Simulation of Seawater Intrusion in Coastal Aquifers: A Case Study in the Goksu Deltaic Plain. J. Hydrol. 2012, 2012, 262–280. [Google Scholar] [CrossRef]
  64. Datta, B.; Vennalakanti, H.; Dhar, A. Modeling and Control of Saltwater Intrusion in a Coastal Aquifer of Andhra Pradesh, India. Hydro. Res. 2009, 3, 148–159. [Google Scholar] [CrossRef]
  65. Nofal, E.; Amer, M.; El-Didy, S.; Fekry, A.M. Delineation and Modeling of Seawater Intrusion into the Nile Delta Aquifer: A New Perspective. Water Sci. 2015, 29, 156–166. [Google Scholar] [CrossRef] [Green Version]
  66. Chang, Y.; Hu, B.X.; Xu, Z.; Li, X.; Tong, J.; Chen, L.; Zhang, H.; Miao, J.; Liu, H.; Ma, Z. Numerical Simulation of Seawater Intrusion to Coastal Aquifers and Brine Water/Freshwater Interaction in South Coast of Laizhou Bay, China. J. Contam. Hydrol. 2018, 215, 1–10. [Google Scholar] [CrossRef] [PubMed] [Green Version]
  67. Mansour, A.Y.S.; Baba, A.; Gunduz, O.; Şimşek, C.; Elçi, A.; Murathan, A.; Sözbilir, H. Modeling of Seawater Intrusion in a Coastal Aquifer of Karaburun Peninsula, Western Turkey. Environ. Earth Sci. 2017, 76, 775. [Google Scholar] [CrossRef]
  68. Zhao, J.; Lin, J.; Wu, J.; Yang, Y.; Wu, J. Numerical Modeling of Seawater Intrusion in Zhoushuizi District of Dalian City in Northern China. Environ. Earth Sci. 2016, 75, 1–18. [Google Scholar] [CrossRef]
  69. Zeng, X.; Wu, J.; Wang, D.; Zhu, X. Assessing the Pollution Risk of a Groundwater Source Field at Western Laizhou Bay under Seawater Intrusion. Environ. Res. 2016, 148, 586–594. [Google Scholar] [CrossRef]
  70. Emam, A.R.; Kappas, M.; Linh, N.H.K.; Renchin, T. Hydrological Modeling and Runoff Mitigation in an Ungauged Basin of Central Vietnam Using SWAT Model. Hydrology 2017, 4, 16. [Google Scholar] [CrossRef] [Green Version]
  71. Immerzeel, W.W.; Gaur, A.; Zwart, S.J. Integrating Remote Sensing and a Process-Based Hydrological Model to Evaluate Water Use and Productivity in a South Indian Catchment. Agric. Water Manag. 2008, 95, 11–24. [Google Scholar] [CrossRef]
  72. Cheema, M.J.M.; Immerzeel, W.; Bastiaanssen, W. Spatial Quantification of Groundwater Abstraction in the Irrigated Indus Basin. Ground Water 2014, 52, 25–36. [Google Scholar] [CrossRef] [Green Version]
  73. Matiatos, I.; Paraskevopoulou, V.; Lazogiannis, K.; Botsou, F.; Dassenakis, M.; Ghionis, G.; Alexopoulos, J.D.; Poulos, S.E. Surface–Ground Water Interactions and Hydrogeochemical Evolution in a Fluvio-Deltaic Setting: The Case Study of the Pinios River Delta. J. Hydrol. 2018, 561, 236–249. [Google Scholar] [CrossRef]
  74. Panagopoulos, A.; Kotsopoulos, S.; Kalfountzos, D.; Alexiou, I.; Evangelopoulos, A.; Belesis, A. Supplementary Environmental Acts of Reg. 2078/92/EU-Study of Natural Resources and Factors Influencing the Yield and the Quality Characteristics of Agricultural Areas in Thessaly; Hellenic National Research Foundation: Thessaloniki, Greece, 2001. [Google Scholar]
  75. Lambrakis, N.J.; Voudouris, K.; Tiniakos, L.N.; Kallergis, G.A. Impacts of Simultaneous Action of Drought and Overpumping on Quaternary Aquifers of Glafkos Basin (Patras region, western Greece). Environ. Earth Sci. 1997, 29, 209–215. [Google Scholar] [CrossRef]
  76. Pisinaras, V.; Petalas, C.; Tsihrintzis, V.A.; Karatzas, G.P. Integrated Modeling as a Decision-Aiding Tool for Groundwater Management in a Mediterranean Agricultural Watershed. Hydrol. Process. 2013, 27, 1973–1987. [Google Scholar] [CrossRef]
  77. Soppe, R.; Ayars, J. Characterizing Ground Water Use by Safflower Using Weighing Lysimeters. Agric. Water Manag. 2003, 60, 59–71. [Google Scholar] [CrossRef]
  78. Kahlown, M.; Ashraf, M.; Haq, Z.-U. Effect of Shallow Groundwater Table on Crop Water Requirements and Crop Yields. Agric. Water Manag. 2005, 76, 24–35. [Google Scholar] [CrossRef]
  79. Babajimopoulos, C.; Panoras, A.; Georgoussis, H.; Arampatzis, G.; Hatzigiannakis, E.; Papamichail, D. Contribution to Irrigation from Shallow Water Table under Field Conditions. Agric. Water Manag. 2007, 92, 205–210. [Google Scholar] [CrossRef]
  80. Zanis, P.; Kapsomenakis, I.; Philandras, C.; Douvis, K.; Nikolakis, D.; Kanellopoulou, E.; Zerefos, C.; Repapis, C. Analysis of an Ensemble of Present Day and Future Regional Climate Simulations for Greece. Int. J. Clim. 2009, 29, 1614–1633. [Google Scholar] [CrossRef]
  81. Vasiliades, L.; Loukas, A.; Patsonas, G. Evaluation of a Statistical Downscaling Procedure for the Estimation of Climate Change Impacts on Droughts. Nat. Hazards Earth Syst. Sci. 2009, 9, 879–894. [Google Scholar] [CrossRef] [Green Version]
  82. Tsakmakis, I.; Kokkos, N.; Pisinaras, V.; Papaevangelou, V.; Hatzigiannakis, E.; Arampatzis, G.; Gikas, G.; Linker, R.; Zoras, S.; Evagelopoulos, V.; et al. Operational Precise Irrigation for Cotton Cultivation through the Coupling of Meteorological and Crop Growth Models. Water Resour. Manag. 2016, 31, 563–580. [Google Scholar] [CrossRef]
  83. Tsakmakis, I.; Kokkos, N.; Gikas, G.D.; Pisinaras, V.; Hatzigiannakis, E.; Arampatzis, G.; Sylaios, G. Evaluation of Aquacrop Model Simulations of Cotton Growth under Deficit Irrigation with an Emphasis on Root Growth and Water Extraction Patterns. Agric. Water Manag. 2019, 213, 419–432. [Google Scholar] [CrossRef]
  84. Taylor, C.A.; Stefan, H.G. Shallow Groundwater Temperature Response to Climate Change and Urbanization. J. Hydrol. 2009, 375, 601–612. [Google Scholar] [CrossRef]
  85. Kurylyk, B.L.; MacQuarrie, K.T.B.; Voss, C.I. Climate Change Impacts on the Temperature and Magnitude of Groundwater Discharge from Shallow, Unconfined Aquifers. Water Resour. Res. 2014, 50, 3253–3274. [Google Scholar] [CrossRef]
  86. Libutti, A.; Monteleone, M. Soil vs. Groundwater: The Quality Dilemma. Managing Nitrogen Leaching and Salinity Control under Irrigated Agriculture in Mediter-Ranean Conditions. Agric. Water Manag. 2017, 186, 40–50. [Google Scholar] [CrossRef]
  87. Zekri, S.; Madani, K.; Bazargan-Lari, M.R.; Kotagama, H.; Kalbus, E. Feasibility of Adopting Smart Water Meters in Aquifer Management: An Integrated Hydro-Economic Analysis. Agric. Water Manag. 2017, 181, 85–93. [Google Scholar] [CrossRef]
Figure 1. Location and geological map [29] of the study area.
Water 13 00108 g001
Figure 2. Land use map of PRDP. Groundwater monitoring network and SWAT model sub-basins are also illustrated.
Water 13 00108 g002
Figure 3. Simulation grid of PRDP phreatic aquifer along with key boundary conditions. Where no specific outer boundary condition is indicated, no flow conditions are implied.
Water 13 00108 g003
Figure 4. Scatter plots of observed versus simulated groundwater levels for calibration (a) and validation (b) periods. The corresponding plots for groundwater chloride concentrations are also presented for calibration (c) and validation (d).
Water 13 00108 g004
Figure 5. Graphical representation of groundwater balance of PRDP phreatic aquifer for hydrological years 2014 (a,b) and 2015 (c,d). Change in groundwater storage is not included.
Water 13 00108 g005
Figure 6. Time series of total annual precipitation (mm) and average annual temperature for the two projected periods, under the adopted RCM.
Water 13 00108 g006
Figure 7. Boxplots presenting the annual variation of major: (a) inflows and (b) outflows for the two projected periods.
Water 13 00108 g007
Figure 8. Boxplots presenting the annual variation of groundwater Cl concentration for the periods (a) 2021–2050 and (b) 2071–2100 under no sea level rise (ΔH0), sea level rise of 0.5 m (ΔH0.5) and sea level rise of 1 m (ΔH1).
Water 13 00108 g008
Figure 9. Spatial distribution of groundwater Cl concentration at the end of periods 2021–2050 and 2071–2100 for no sea level rise (ΔH0), sea level rise of 0.5 m (ΔH0.5) and sea level rise of 1 m (ΔH1).
Water 13 00108 g009
Figure 10. Boxplots presenting the annual simulated variation of inflows and outflows for the two projected periods under no sea level rise (ΔH0), sea level rise of 0.5 m (ΔH0.5) and sea level rise of 1 m (ΔH1).
Water 13 00108 g010
Table 1. Comparison of ETa for the dominant crops of the study area, as simulated by SWAT, and ETc as calculated using the Kc approach for two cultivation periods (2014–2015).
Actual Evapotranspiration (ETa) (mm per Cultivation Period)
CornCottonSunflowerWheatAlfalfaKiwi Fruit
SWAT modelNo. of HRUs571264563219
Average611.2582.4539.5262.6702.9684.4
Median612.2591.4540.1262.4703.5681.5
Min540.1543.1520.0226.0667.0669.1
Max636.2598.2551.3274.0716.9701.0
Crop Reference Evapotranspiration (ETc) (mm per Cultivation Period)
Kc approach615.1585.8553.9294.7757.9732.7
Table 2. Statistical indices of model performance evaluation during calibration and validation periods.
Groundwater LevelGroundwater Cl Concentration
IndexCalibrationValidationIndexCalibrationValidation
No of Observations198136No of Observations5353
SLP0.9851.019SLP0.8770.959
R20.9920.985R20.9660.963
ME (m)−0.068−0.061ME (mg/L)−7.238−6.255
MAE (m)0.2800.450MAE (mg/L)14.74520.781
RMSE (m)0.4170.608RMSE (mg/L)32.07741.129
NRMSE (%)1.8552.517NRMSE (%)6.1797.058
Publisher’s Note: MDPI stays neutral with regard to jurisdictional claims in published maps and institutional affiliations.

