
Using Age Tracers to Estimate Ecological Rates in a Phytoplankton Model
by
 ,
,
Edward Gross
1,2,*,
Rusty Holleman
3,
Wim Kimmerer
4,
Sophie Munger
3,
Scott Burdick
1 and
John Durand
3,5 1
Resource Management Associates, 1756 Picasso Avenue, Suite G, Davis, CA 95618, USA
2
Department of Civil and Environmental Engineering, University of California, Davis, One Shields Avenue, Davis, CA 95616, USA
3
Center for Watershed Sciences, University of California, Davis, One Shields Avenue, Davis, CA 95616, USA
4
Estuary & Ocean Science Center, San Francisco State University, Tiburon, CA 94920, USA
5
Department of Wildlife, Fish and Conservation Biology, University of California, Davis, One Shields Avenue, Davis, CA 95616, USA
*
Author to whom correspondence should be addressed.
Water 2023, 15(11), 2097; https://doi.org/10.3390/w15112097
Submission received: 27 April 2023
/
Revised: 23 May 2023
/
Accepted: 27 May 2023
/
Published: 1 June 2023
(This article belongs to the Special Issue Diagnostic Timescale Methods for the Aquatic Environment: Current Challenges, Recent Improvements, and Applications)
Abstract
:The phytoplankton distribution in estuaries is influenced by multiple spatially variable growth and loss processes. As phytoplankton are transported by tidal and net flows, they are exposed to changing conditions of turbidity, depth, temperature, stratification, and grazing. Understanding the factors influencing the observed phytoplankton distribution patterns will allow better-informed restoration and water management efforts. We developed a Lagrangian approach driven by three-dimensional hydrodynamic model results and a simple representation of the production and losses of phytoplankton, allowing a highly efficient closed-form solution for phytoplankton biomass. Our analysis used continuous observations of chlorophyll concentration at four stations and a near-synoptic chlorophyll dataset collected underway from a boat in the channels of Suisun Marsh in the San Francisco Estuary. We divided the study region into four compartments defined by the water depth and location. For each observation location, hydrodynamic model simulations calculated the time that water parcels spent in each of these compartments and the mean depth encountered by water parcels in those compartments. Then, using that information and continuous monitoring data, we inferred compartment-specific grazing rates and two additional ecological parameters. The underway chlorophyll dataset was used for model validation. The model predicted patterns of observed spatial and tidal variability in chlorophyll in Suisun Marsh. The modeling indicated that the chlorophyll concentration at a point in space in time depends largely on the relative exposure to shallow areas, with positive net productivity and deep areas having negative net productivity.
1. Introduction
Phytoplankton abundance in estuaries is influenced by spatially and temporally variable physical and ecological processes that induce differences in growth and loss rates. Conditions that influence these rates include sunlight, nutrient availability, turbidity, water depth, temperature, stratification, and the density of benthic and pelagic grazers. Physical processes can both advect phytoplankton in the direction of net flows and mix water volumes with different properties. As water masses move with tidal and net flows, they carry with them phytoplankton, zooplankton, and physical and ecological properties, all of which can undergo transformations in their moving reference frame.
The problem of representing ecological processes occurring in moving water parcels is often solved by a two- or three-dimensional hydrodynamic model coupled with an ecological model on the same spatial grid. These coupled hydrodynamic–ecological models are often used to represent spatial variability in ecological and transport processes [1]. When applied to phytoplankton, ecological models typically compute variables such as nutrient concentrations, phytoplankton biomass, and zooplankton biomass on an Eulerian grid, simultaneously capturing local transformations and non-local transport processes (i.e., advection and dispersion). Phytoplankton models vary greatly in the complexity of processes and in spatial resolution (Ganju et al. 2015). The resolution of ecological parameters is often much coarser than the computational grid. For example, grazing rates that vary in time and space [2] are generally specified at far coarser scales than the hydrodynamic model grid. When applied to estuaries, these models are computationally intensive because they require the calculation of all these state variables at a short time interval (typically minutes) at many depth-averaged (two-dimensional) or three-dimensional computational elements. However, the rate constants for ecological processes in such models are typically much slower than for hydrodynamic processes, implying a mismatch in time scales that results in an inefficient method.
In contrast to ecological models that are tightly coupled with a hydrodynamic model and share its spatial and temporal resolution, an alternative approach is to simulate ecological processes and phytoplankton biomass at a coarser spatial or temporal resolution. The spatial resolution may be coarsened to a region, for example, the low-salinity zone of the San Francisco Estuary [3]. This mass-balance approach requires minimal computation but typically does not predict the spatial distribution of phytoplankton within the region. Large-scale spatial variability can also be represented using grid aggregation to compute ecological properties on a coarser spatial and temporal scale than hydrodynamics [4]. Correlative analyses can also provide insight into phytoplankton dynamics [5] but provide a limited scope to predict ecological conditions beyond those for which correlations were developed, or where covariate data are lacking.
Lagrangian approaches represent ecological processes in a water parcel as it moves through space. Information is incorporated into the Lagrangian frame by calculating the conditions (e.g., depth, clam abundance, and light intensity) encountered by a tracer that represents water parcels from a particular source. This approach is conceptually similar to the application of the widely used Streeter–Phelps equation to estimate dissolved oxygen concentrations in rivers. In both cases, the concentration is estimated from the concentration at a known starting location, the travel time to a downstream location of interest, and specified biogeochemical transformation rates. While even the simplest Eulerian modeling approach requires substantial computation to advect and disperse phytoplankton, ecological predictions in a Lagrangian frame become simple computations [6]. Such approaches are of particular interest for ecological models, as the formulations and ecological rate parameters are often uncertain.
One such Lagrangian mechanistic model [6] used water age with the net phytoplankton growth rate to estimate the time course of chlorophyll concentration as a water parcel is advected by tidal and net flows. By using a simple formulation, with no explicit state variables for nutrients or zooplankton, this approach allowed for a closed-form solution for chlorophyll concentration. Furthermore, Ref. [6] included a nonlinear parameter that can roughly represent a feedback mechanism, such as a nonlinear increase in zooplankton grazing with increased phytoplankton abundance.
We built upon the approach in [6] by including additional tracer-based calculations. Tracer-based estimates included the mean water age [7], mean partial age [8], and mean depth exposure [9]. Water age (hereafter “age”) is a transport time scale quantifying the time elapsed since a water parcel entered a study area, which can be estimated using a tracer-based modeling approach [10]. A specific application of this flexible approach provides the algebraic mean age of all water parcels from a specific source as they are transported away from the source. Partial age [8] quantifies the time that the tracer has spent in a specific geographical region. This partial age, which we will refer to as “exposure time,” can be calculated for distinct regions that could represent different compartments [8]. We use the term “compartment” instead of region because the compartments are not spatially contiguous. Property exposure tracking [9] is a tracer-based approach to estimate a tracer’s mean exposure to different properties. For example, mean depth exposure at a specific time and station is the mean depth encountered by water parcels in transit from a source to the station.
Using these tracer-based approaches to estimate the mean exposure time and mean depth encountered in different compartments, we developed a simplified and highly computationally efficient phytoplankton model. The model includes terms for processes known to be important for phytoplankton in the San Francisco Estuary, including light-limited growth [11] and grazing by clams [12] and zooplankton [13]. Additional terms of uncertain importance include phytoplankton mortality [14] and a nonlinear feedback term, as in [6]. Notably, the model did not include nutrient information since nutrient limitation is uncommon in the San Francisco Estuary [11]. In addition, the model does not explicitly predict zooplankton biomass in estimating grazing losses to zooplankton.
This parsimonious approach was applied to predict chlorophyll concentrations in Suisun Marsh, a large brackish-to-freshwater marsh in the northern San Francisco Estuary. Numerical optimization was used to determine the clam grazing rate, phytoplankton mortality rate, and a nonlinear feedback parameter. These parameters were fit to minimize the root-mean-squared deviation between the predicted chlorophyll and the chlorophyll observed at four in situ monitoring stations. Clam grazing rates were assumed to vary with compartment, as clams are more abundant in the main channel of Suisun Marsh than in shallower side channels [15] and absent from intertidal areas.
The model reproduced some patterns in the data and estimated clam grazing rates that were credible. The major advantage of this modeling approach is that it can efficiently estimate biogeochemical rate coefficients that produce predictions consistent with observations. Only one hydrodynamic and tracer simulation was required, and then chlorophyll concentrations were predicted in an offline model, and clam grazing rates were selected to minimize the error in chlorophyll predictions. This specific application is one example of how age tracer approaches can be used to infer ecological rates, which can then be corroborated by incorporation into a multi-dimensional biogeochemical model.
2. Materials and Methods
2.1. Study Area
Suisun Marsh (Figure 1) is the largest tidal marsh system in the San Francisco Estuary [16]. It lies north of Suisun Bay, with hydraulic connections to Grizzly Bay (an arm of Suisun Bay) and to the Sacramento River at the seaward boundary of the California Delta. Suisun Bay is connected to the ocean through the Carquinez Strait, San Pablo Bay, and San Francisco Bay. Suisun Marsh has mixed semidiurnal tides propagating east from the Pacific Ocean and highly variable freshwater flow from the Delta. Formerly a dendritic tidal marsh, in the last century, Suisun Marsh was largely converted to managed wetlands, and the principal current use of the area is duck hunting and other recreation. Of a total area of ~405 km2, ~210 km2 is managed wetland, 31 km2 is remnant tidal marsh, 104 km2 is tidal sloughs, and the remainder is upland [16]. Suisun Marsh is a focal point for habitat restoration and scientific studies [17]. Fish populations have been monitored there since 1979 [18], and plans for the conversion of managed wetlands to open tidal wetlands are proceeding, with the expectation of a benefit for threatened and endangered species, including the delta smelt Hypomesus transpacificus [19] and the longfin smelt Spirinchus thaleichthys [20].
The recovery of these species is likely limited by food availability [21] as well as temperature [22,23] in rearing habitats throughout the upper estuary [21]. Phytoplankton biomass in the main channels of the northern San Francisco Estuary declined sharply in 1987, largely as a result of grazing by the introduced clam Potamocorbula amurensis [12]. Phytoplankton biomass and productivity have remained low [24], with similar declines in zooplankton, attributed to declines in food and consumption by clams [25], and declines in fish attributed to food limitation [19].
The continuing declines in fishes of special concern, including listed species, have stimulated efforts to increase shallow habitats in the hopes of stimulating planktonic production. Several restoration projects are proposed or ongoing within Suisun Marsh [26]. These projects are based on the assumption that the phytoplankton growth rate is light-limited and therefore high in shallow waters, allowing for the accumulation of biomass if clams are not abundant [2,27]. Phytoplankton biomass can be higher in small, dead-end sloughs in the marsh than in larger channels [28], and clams are abundant mainly in larger sloughs [15].
The Suisun Marsh Salinity Control Gates (SMSCG; Figure 1) at the east end of Montezuma Slough were designed to decrease salinity for the managed waterfowl habitat by opening on ebb tides and closing on flood tides. This leads to tidal pulses of freshwater moving westward through the main distributary channel of the marsh, Montezuma Slough. The gates are typically operated in spring but were operated on an experimental basis during August 2018 in an attempt to improve habitats for endangered fish species by reducing salinity in the marsh [17].
2.2. Overview of Approach
The analysis proceeded in three distinct steps. First, we developed the three-dimensional hydrodynamic model of Suisun Marsh and calibrated it by comparing model predictions to observed water level, flow, and salinity data.
Next, we applied the calibrated model to simulate the three-dimensional and time-varying distributions of a set of properties using numerical tracers. The computational domain was divided into four compartments: the main channel, side channel, low intertidal, and marsh plain (Figure 2). The numerical model calculated the time for water to travel from the seaward boundary in Grizzly Bay (Figure 1) to each element in the model for each time step in the simulation. In addition, the duration of exposure to these compartments and mean depth encountered in each were predicted.
Third, we developed and applied a phytoplankton model to predict the chlorophyll concentration. Two datasets were used. To calibrate the model, we used continuous monitoring data collected at 15 min intervals at four stations (Figure 1). To validate the model, we used a near-synoptic dataset collected underway from a high-speed boat during a single day. Our approach estimated time-varying light-limited growth rates for each compartment and loss rates from clam grazing, zooplankton grazing, and phytoplankton mortality over the mean tracer age from the entry of the tracer from the seaward boundary. While the growth rate used an existing formulation without the adjustment of any parameters, four loss rate parameters were determined by optimizing the fit of the model to continuous monitoring chlorophyll observations. The four parameters were clam grazing in the main channel, clam grazing in the side channel, phytoplankton mortality, and a nonlinear parameter representing density-dependent feedback mechanisms [6]. Using estimates of these parameters determined by fitting, predicted chlorophyll was compared to the underway data. Finally, the contributions of individual processes in each compartment to chlorophyll predictions were analyzed.
2.3. Hydrodynamic Model
The hydrodynamic model domain extends through Suisun Marsh (Figure 1). The eastern boundary is located at the National Steel station north of the SMSCG (Figure 1), and the western boundary is at the junction of Montezuma and Suisun Sloughs with Grizzly Bay (Figure 1). This model domain extent was guided by the availability of data for boundary conditions.
The three-dimensional UnTRIM model [29] was applied in this domain with an unstructured computational mesh with edge lengths in the range of 2 m to 10 m in slough channels and up to 100 m near the Grizzly Bay boundary. This model simulates physical processes resulting in the transport of salt and other tracers and allows for the wetting and drying of computational cells [30] and a sub-grid-scale representation of bathymetry [31]. Bottom roughness and other model parameters were specified to be consistent with previous applications extending throughout the San Francisco Estuary [9]. Wind forcing was not included in the simulation and is expected to have a limited influence on transport in this region of strong tidal flows.
The model simulated hydrodynamics and tracer distributions (see Section 2.3) for 1 March 2018 to 1 September 2018 so that the tracer distributions were appropriately “spun up” from the initial condition of zero age for chlorophyll simulations from 23 June 2018 to 6 August 2018. The hydrodynamic model time step was 30 s. Boundary conditions were specified using continuous-flow and salinity data from the National Steel station operated by the California Department of Water Resources (DWR), salinity data from the USGS Grizzly Bay station (380631122032201), and stage data from the DWR Hunter Cut station (Figure 1). An initial salinity field throughout the model domain was derived by interpolating observed salinity.
Hydrodynamic model predictions were compared with observed stage and salinity data collected at continuous monitoring stations in the model domain (Figure 3). Performance metrics were computed at each calibration location, as in previous calibration efforts in the San Francisco Estuary [9]. Performance metrics included the coefficient of determination (R2) and a commonly used model skill metric [32],
where is the number observations, and are the ith pair of observed and predicted values, and overbar denotes an average over i. Skill ranges from 0 to 1, with 1 indicating a perfect model.
2.4. Water Age and Property Tracking
An essential component of the Lagrangian tracer-based approach was the mean age of water, quantifying the time since it entered the model domain from the boundary in Grizzly Bay. Flows that enter the domain from the eastern end of Montezuma Slough have little influence on the study sites during the chlorophyll simulation period and were not tracked. To estimate age, we applied the widely used Constituent-oriented Age and Residence Time theory (CART) [33]. The equations for this approach are provided in Appendix A. A “partial age” approach, as defined in [8], quantified the exposure time of tracers to four spatial compartments (Figure 2). These habitats were defined based on bed elevation and location. Channel habitat was less than 0 m NAVD (North American Vertical Datum), corresponding approximately to mean lower low water in Suisun Marsh. The two compartments of the subtidal channel were the “main channel” and “side channel” (Figure 2), with the main channel corresponding to regions where clams were found to be abundant in field studies [15]. The low intertidal compartment extends from 0 to 1.8 m NAVD, approximately corresponding to bed elevation from mean lower low water to mean higher high water. The marsh plain compartment is located above mean higher high water, defined as above 1.8 m NAVD.
Property exposure tracking estimated depths encountered by tracers since entering from Grizzly Bay using the method described and applied in [9]. This method was generalized to estimate depth exposure in different compartments, as described in Appendix A.
2.5. Predicting Chlorophyll
Chlorophyll concentration can be modeled in an Eulerian frame with a depth-averaged advection–reaction equation [6] (i.e., neglecting diffusion),
where is the chlorophyll concentration at an arbitrary position (bold fonts denote vectors) and time , is the growth rate of phytoplankton and is loss rate, and is the horizontal advection of chlorophyll by the hydrodynamic velocity vector .
Equation (2) can be rewritten in a Lagrangian frame for a specific water parcel following a horizontal trajectory such that the left-hand side simplifies to an ordinary derivative with respect to age:
where is the total water age defined in Appendix A.
This approach was extended [6] to include a nonlinear term to represent food web interactions, such as increased zooplankton grazing at higher chlorophyll concentrations.
where is a term for density dependence.
Equation (4), when integrated from to , permits an analytical solution:
where is the incoming chlorophyll concentration, and is the total water age at the time () and location () of a chlorophyll prediction. The incoming chlorophyll concentration () is the measured chlorophyll at the Grizzly Bay station, low-pass filtered to remove tidal variability (Figure 4). The rate is the mean net production rate from time to time as a water parcel travels from the source of the tracer (Grizzly Bay in our application) to . Note that while in Equation (4) may vary in time, the solution in Equation (5) depends only on the time-averaged rate .
This approach was generalized to multiple compartments with unique rates by averaging the compartment-specific rates according to the exposure time (partial age) for each compartment:
where reflects the exposure of water to compartment j at time , is the mean rate (d−1) in compartment j, and the exposure times to the individual compartments () sum to the total age () in days. The rates are time-averaged at each chlorophyll monitoring station over the period corresponding to the total age () to account for time-varying PAR, light attenuation, and temperature. Since appears in Equation (5) only as a time average, the solution is independent of the order in which compartments are encountered and depends only on the mean rate aggregated across compartments.
The chlorophyll simulation period was limited to the period when the tracer representing the fraction of water from Grizzly Bay that entered during the simulation period was continuously greater than 0.5 at each chlorophyll monitoring station. The fraction is less than one primarily because water initially in the domain, with a tracer concentration of zero, has not been fully exchanged with Grizzly Bay water. The resulting period was 23 June 2018 to 6 August 2018.
2.6. Estimating Phytoplankton Growth and Loss
Several assumptions were implicit in the phytoplankton model formulation, including the lack of nutrient limitation. Clam grazing varied by compartment but was represented as constant in time. We specified time-varying but spatially uniform turbidity and temperature from observations at the four chlorophyll stations (Figure 1). Each spatially uniform value was estimated as the median of the data at the individual stations at a given time (Figure 4). We used equations from [14] to estimate the depth-averaged light-limited growth rate as follows:
where is the maximum potential growth rate (d−1) at a given temperature, and characterizes the light limitation (see Table 1 for definitions of all variables).
where is temperature in degrees Celsius, is water column mean photosynthetically active radiation (PAR), and is the irradiance supporting maximum water column growth, both in moles of photons m−2 d−1.
where is the surface PAR in moles of photons m−2 d−1, measured at the First Mallard station (Figure 1) [34]. is water column depth (m), and is the light attenuation coefficient (m−1).
The light attenuation coefficient, (m−1), was estimated from turbidity using a relationship developed from data for the northern San Francisco Estuary [35]:
where 0.90 m−1 is the background light attenuation, and is turbidity in FNU.
Growth rates were calculated from Equations (7)–(12). Temperature (T), irradiance (E), and turbidity (S) varied only in time, but H varied in time, by station, and by compartment, necessitating a distinct growth rate calculation for each combination of station, compartment, and 15 min time interval. This growth rate therefore varied in time and by compartment and varied slightly among stations because of variation in the mean depth encountered by water as it traveled from the boundary through each compartment to each station. The parameters of these equations were taken from the literature, as described above, leaving no parameters in the growth formulation to be fit in the optimization.
In contrast, several loss rates were fit in our optimization because these rates are uncertain and likely both to be site-specific and to vary seasonally [15,36]. The loss terms in [14] are
where is the specified constant phytoplankton mortality (d−1), is the clam grazing rate (m d−1), which is constant in time, is water depth (m), and is the time-varying microzooplankton grazing rate (d−1), specified in our model as a function of the phytoplankton growth rate [3]:
where was calculated for each compartment at each time interval in Equation (7). Mesozooplankton grazing was not specified with a distinct term but is considered to have a constant component, lumped in with the term , and a component that varies with chlorophyll levels, represented by the nonlinear coefficient . Ecological processes that could contribute to include a density-dependent component of mortality.
The depth used in Equations (10) and (13) was estimated using property (depth) exposure modeling, described in Appendix A. The resulting depth represents the mean depth that water currently at a station has encountered in each compartment. For each observed chlorophyll value, the production term (Equation (5)) was calculated for each compartment over the time corresponding to the total age (i.e., from to , where is the time of the observation). The loss rates were applied, resulting in net rates in each individual compartment, which were then weighted by fractional exposure ( to each compartment (Equation (6)) to estimate chlorophyll at one specific time and location. The procedure was repeated for each individual chlorophyll observation independently of other chlorophyll observations. Changes in predictions were driven primarily by the spatially and tidally varying mean exposure time and mean depth in each compartment from the tracer simulations.
The unknown rates in the formulation above were phytoplankton mortality (), the nonlinear coefficient (), and clam grazing in the main channel () and side channels (). Each of these variables is assumed to be constant in time and space (or constant within a compartment in the case of clam grazing), leaving a total of four unconstrained degrees of freedom in the model. The closed-form phytoplankton model (Equation (5)) using exposure times and property tracking, given a set of model parameters, predicts chlorophyll at the time and location of each observation. Differential evolution [37], a robust stochastic optimization approach from the Python scipy [38] library, was then used to find parameter values that minimize root-mean-squared error (RMSE) in predicted chlorophyll compared to the observed chlorophyll, described in Section 2.7, at the four stations (Figure 1) at 15 min intervals during the simulation period. The evaluation of RMSE for a single set of parameters entails 4224 distinct chlorophyll predictions and requires approximately 0.3 s on a laptop computer. Similar results were obtained from faster, deterministic optimization methods, but the possibility of local minima motivated the use of the more robust differential evolution.
In order to quantify the role of each individual growth or loss term, the right-hand side of Equation (4) was decomposed into contributions from these terms, and each was integrated separately. The numerical integration was performed by the odeint ODE solver in Python’s scipy library [38].
2.7. Chlorophyll Observations
The UC Davis continuous monitoring data used in calibrating the model were collected from April to September 2018 at four stations (Figure 1; Sheldrake, First Mallard, Peytonia, and Hill Sloughs) located in channels of Suisun Marsh. At each station, a YSI EXO II sonde measured pressure, temperature, conductivity, chlorophyll fluorescence, turbidity, fluorescent dissolved organic matter (fDOM), pH, and dissolved oxygen. Sondes recorded data every 15 min and were serviced and calibrated approximately monthly. Calibrations for chlorophyll and turbidity were performed using standard solutions. Continuous chlorophyll data were corrected using simple multiple regression against values for chlorophyll concentration and turbidity obtained from whole-water grabs. Water grabs were analyzed in the UC Davis Geochemistry Lab using standard techniques [39]. Strong tidal variability was typically apparent in these data, with higher chlorophyll at low water suggesting higher phytoplankton biomass in low intertidal and marsh plain compartments than in channels.
A separate set of near-synoptic chlorophyll data [40] was collected underway from a high-speed boat on 27 July 2018 from 7:57 to 15:16 PST. The boat was fitted with a flow-through system equipped with an EXO v2 sonde (YSI, Yellow Springs, OH, USA) that was calibrated immediately prior to use [25]. These observations were collected at intervals of 1 s throughout the main channels of Suisun and Montezuma Sloughs while underway at speeds of up to 13 m s−1, providing a map of chlorophyll concentrations at spatial intervals of meters. In places where observations were dense, they were averaged within each hydrodynamic model grid cell (~10 m length) for comparison with predicted chlorophyll. These underway data were collected during the period of continuous data availability and were useful in examining spatial patterns in model accuracy due to large spatial extent.
Continuous monitoring data at each station were compared to the underway observations to assess biases between the two sets of observations. Continuous monitoring stations were located in smaller slough channels adjacent to Suisun Slough, while the underway data were collected in the main channels (Figure 1). To mitigate the effect of horizontal separation between a station and underway observations, station data at the time of high tide were compared to the underway data nearest to the station location, under the assumption that water in the channel (sampled by underway observations) would have advected to the station location during the flood tide. In these comparisons, continuous monitoring data were consistently lower than the underway data (Table 2). Possible reasons for the differences are different sensors deployed or differences in the calibration approach. The underway sensor data were calibrated to laboratory measurements on the day of the survey, while the continuous monitoring data were calibrated once per multiple-week deployment, so we assumed that the underway data gave more accurate estimates of chlorophyll concentrations. We used the calculated fixed offsets from the underway data to reduce chlorophyll in the continuous monitoring data (Table 2). Chlorophyll measured in underway surveys conducted outside our simulation period was also persistently higher than contemporaneous data from the continuous monitoring stations.
3. Results
3.1. Hydrodynamic Model Calibration
The hydrodynamic model predicted salinity and water level accurately during the portion of the hydrodynamic simulation period when the chlorophyll simulations were performed (Table 1). The model predicted water level particularly well, with a computed skill of 1.00, partially due to the limited spatial variability in water level in the small model domain. The model skill for salinity was 0.84, and predicted salinity was 0.35 lower than the observed salinity on average (Table 3). The range of observed salinity at the calibration stations during this period was 0.9 to 16.4 with a mean of 5.8.
Hydrodynamic conditions were generally vertically well mixed throughout the model domain during the simulation period. A small degree of stratification formed intermittently at some locations during ebb tides.
3.2. Age and Property Exposure Predictions
The tracer concentration and mean age corresponding to the transport of water from the Grizzly Bay boundary to the marsh were calculated on the three-dimensional model grid at 30 min time intervals. An example snapshot of the tracer fields shows that the Grizzly Bay tracer had filled most of the model domain (Figure 5) at the time of underway data collection. The mean exposure time was calculated for each of the four compartments (Figure 2) throughout the model grid and simulation. The calculated mean exposure times at each station varied tidally, as water with more exposure to low intertidal and marsh plain compartments and less exposure to the main channel passes by each station during the ebb tide. Exposure to the main channel was larger than exposure to other compartments at all stations (Figure 6A) because the tracer must pass through the main channel to arrive at the stations. At any location and point in time, the mean exposure times summed exactly to the mean age.
The chlorophyll simulation period of 23 June 2018 to 6 August 2018 was chosen as the period when the tracer concentration representing the fraction of water from Grizzly Bay that entered during the simulation period was continuously greater than 0.5 at each chlorophyll monitoring station. The end time of the simulation corresponds to the timing of a significant fraction of water reaching the stations from the eastern entrance of Montezuma Slough when SMSCG gates were opened during flood tides starting in early August [17].
The mean depth encountered by the tracer was extracted from the simulation for each combination of station, time, and compartment. The mean depths encountered by the tracer between the Grizzly Bay boundary and each station varied little among stations but greatly among compartments (Figure 6B). The mean depths encountered were typically less than 0.2 m in the marsh plain compartment, about 1 m in the low intertidal compartment, roughly 3 m in the side channel compartment, and approximately 7 m in the main channel compartment. Since more of the water column in shallow compartments was in the photic zone, these compartments had higher estimated phytoplankton growth rates.
3.3. Chlorophyll-a Predictions at Stations
The parameters for both grazing in the side channel and phytoplankton mortality derived in the optimization were estimated to be zero, and the other two parameters were non-zero. The chlorophyll simulation using the estimated parameters (Table 4) allowed the accurate prediction of chlorophyll, which generally increased with the predicted water age (Figure 7). Median chlorophyll was predicted well at all four stations (Figure 8), with both observed and predicted chlorophyll increasing with the distance from Grizzly Bay, where tidally averaged measured chlorophyll was roughly 2.5 mg L−1 (Figure 4) during the simulation period. The range of chlorophyll at each station was also predicted well by the model (Figure 8), except at Sheldrake Slough, where some observed values at high water were much higher than those predicted by the model. The tidal phase of variability in observed chlorophyll was predicted well by the model (Figure 9). The model predictions were largely unbiased, though the range of variability was underpredicted at the Sheldrake Slough station (Figure 8).
3.4. Chlorophyll Growth and Loss Terms
We calculated the relative rates of various processes that result in the estimated changes in chlorophyll between the Grizzly Bay boundary and sampling stations (Figure 10). As evident in Equation (6), the contribution to chlorophyll predictions from the time spent in each compartment depends both on the compartment-specific rate (Figure 10) and on the compartment exposure time (Figure 6). The calculated growth and loss rates varied across compartments and, to a lesser degree, sampling stations. The net rates were negative (loss) in the channel regardless of the sampling station, while all net rates were positive (growth) for the other compartments.
3.5. Phytoplankton Model Validation
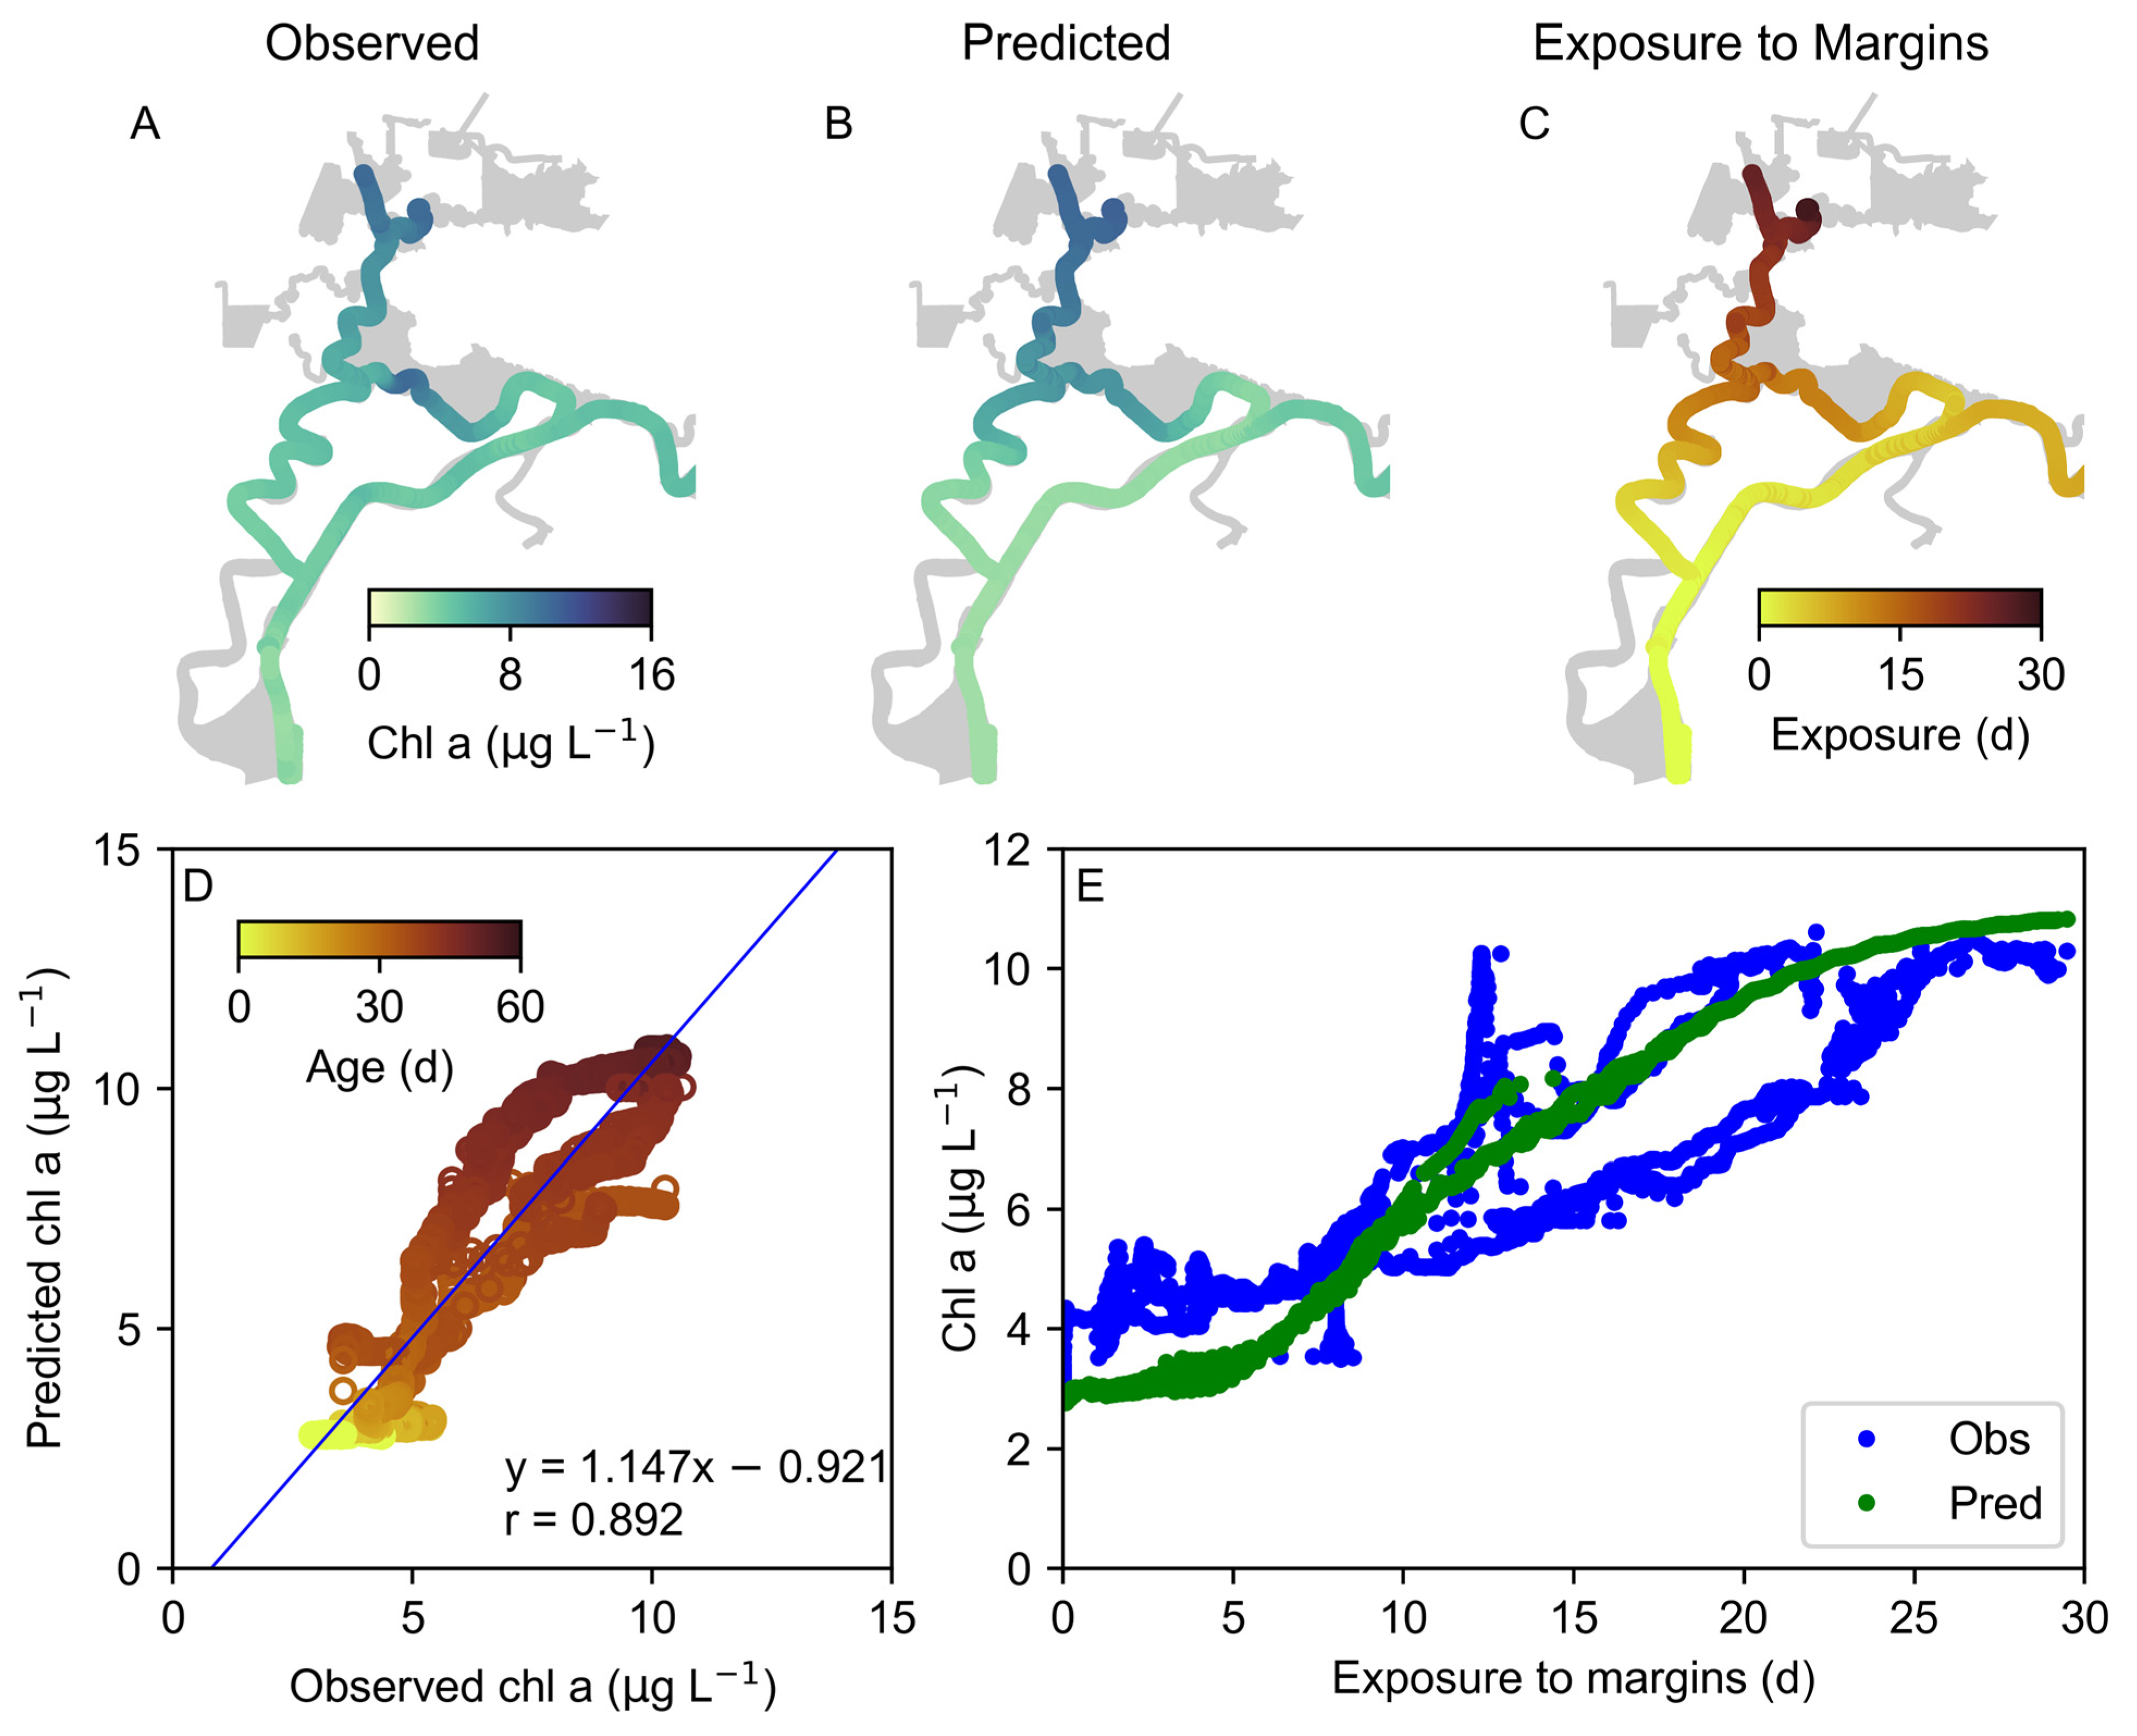
The underway chlorophyll data were not used for optimization but were saved for model validation. Chlorophyll was predicted by the model at the time and location of each of the 2369 thinned underway data points, and the two sets of data were compared (Figure 11A,B). Because the net production of chlorophyll was positive in the side channel, low intertidal, and marsh plain compartments (Figure 10), we explored the relationship of observed and predicted chlorophyll with the modeled mean exposure to these compartments (Figure 11C). Both observed and predicted chlorophyll show a clear increase with mean exposure to these “margin” compartments (Figure 11D).
4. Discussion
We developed a Lagrangian phytoplankton model, extending the methods of [6] to account for time spent in distinct spatial compartments with varying growth and loss rates. A property-tracking approach [9] provided estimates of the average depth encountered by the tracer in each spatial compartment. Growth and loss terms were parameterized using this depth information. We estimated growth rates over the travel time from the boundary by a light-limited growth formulation [14] and fit unknown loss rates to optimize the prediction of chlorophyll at fixed stations. Net flows during the study period were negligible, and hydrodynamic transport was dominated by tidal dispersion processes. Despite significant additional complexity relative to previous tracer-based Lagrangian models, such as [6], our approach maintained extremely high computational efficiency.
The Lagrangian model accurately predicted spatial and tidal chlorophyll variability across the four fixed stations by choosing optimal phytoplankton loss parameters representing clam grazing rates, general mortality, and a nonlinearity parameter representing increased losses with increased phytoplankton concentration. It underpredicted the observed peak chlorophyll at Sheldrake Slough, which occurred at low water and is possibly associated with unquantified discharges from managed wetlands. The predicted concentrations were all substantially larger than boundary concentrations, with predicted chlorophyll generally increasing with the distance from the boundary. The model accurately predicted an independent underway chlorophyll dataset, and both the observed and predicted chlorophyll increased with exposure to shallow “margin” compartments.
The calculated growth and loss rates (Figure 10) varied among compartments, primarily because the water depth varied among compartments, and clam grazing was specified to occur only in the main channel. The average rates also varied slightly by station because water in transit from the Grizzly Bay boundary encountered depth profiles that differed among stations. As evident in Equation (6), the contribution to chlorophyll predictions from time spent in each compartment depends both on the compartment-specific rate (Figure 10) and on the compartment exposure time (Figure 6). For example, the high rates predicted for the marsh plain compartment have a small net effect on predicted chlorophyll due to the relatively short exposure time of the tracer to the marsh plain compartment (Figure 6). Predicted net losses in the main channel were exceeded by net gains across the other compartments at all stations (Figure 10). For that reason, chlorophyll at the stations was roughly 0.5 to 7.5 mg L−1 higher than chlorophyll at the boundary (Figure 4D).
The robust optimization approach required 4100 biological simulations and 47.2 min on a laptop computer, corresponding to 0.69 s of computation for an individual chlorophyll model run. Most of this computational time is required for calculating the average growth rate for individual spatial compartments ( comprising time-averaged growth rates calculated using Equations (7)–(12) [14] and constant in time loss rates.
4.1. Suisun Marsh Phytoplankton Dynamics
Several aspects of our approach and conclusions are consistent with previous studies in Suisun Bay and Suisun Marsh. Consistent with [15], the parameter-fitting approach estimated non-zero clam grazing only in the main channel. Consistent with [36], we assumed no nutrient limitations and used their microzooplankton grazing approach. While [36] estimated net phytoplankton loss in channels and net gains in shoals in the low-salinity zone (salinity from 0.5 to 5), which often overlaps with Suisun Bay, we similarly estimated the net loss of chlorophyll in the main channels and net growth in the other spatial compartments of Suisun Marsh. Though the tracers spent most of the time in the main channel (Figure 6A), the strong positive production in margin compartments offsets the losses in the main channel, giving increased chlorophyll predictions at fixed stations (Figure 8) relative to the model boundary in Grizzly Bay (Figure 4). The attributes of the shallow compartments that enhance phytoplankton production in our model are shallow depth and a lack of clam grazing, conceptually consistent with [27]. For this reason, the exposure time to the other spatial compartments (“margins”) was predictive of observed and predicted chlorophyll (Figure 11). Though clam grazing occurred only in the main channel, it was the most important loss term due to the much larger main channel exposure compared to exposure times to other compartments (Figure 6). The predicted contribution of clam grazing to overall losses between the boundary and the four stations ranged from 51% at PT in Peytonia Slough (Figure 1) to 71% at SD in Sheldrake Slough (Figure 1).
We did not address several aspects of phytoplankton dynamics in Suisun Marsh, including seasonal variability in grazing and other loss parameters, but could do so with adequate data availability in other periods. Representing transport processes and phytoplankton dynamics in the wetter winter and spring conditions would also require consideration of incoming chlorophyll with freshwater inflows. These inflows may also cause some degree of salinity stratification, which would make our depth-averaged phytoplankton model less appropriate. We also did not account for phytoplankton biomass from managed wetland discharges. This could be challenging because chlorophyll concentrations in wetland discharges are generally not monitored.
4.2. General Applicability
Our model can readily be extended to solve the coupled equations of an NPZ model by utilizing an ordinary differential equation integration approach while maintaining the Lagrangian approach, which obviates the need to solve the equations on a computational grid. These ordinary differential equations could be integrated at orders of magnitude larger time steps than used in multi-dimensional hydrodynamic and tracer transport models. Multiple sources of water and chlorophyll can be added to our model by adding tracers to track these sources, including exposure to different compartments and the depth encountered in each. The model can also be applied to scenarios such as sea level rise using process rates determined from historical conditions. A Monte Carlo approach can be applied to account for uncertainty in rates and other model inputs.
The Lagrangian nature of the approach allows for high computational efficiency but also limits the applicability of the approach. To understand the strengths and limitations of the approach more generally, consider the examples of nutrient-limited phytoplankton production and light-limited phytoplankton production. The former is better suited to our approach than the latter. In a nutrient-limited phytoplankton model, the predicted phytoplankton biomass would evolve and interact with the nitrate and any additional nutrients in a coupled Lagrangian biogeochemical model using nutrient equations accounting for uptake by phytoplankton and other processes.
In contrast, light-limited phytoplankton modeling would be challenging. In many systems, including the SFE, turbidity is strongly variable in space and time and often covaries with depth. If the turbidity distribution is predicted by a sediment transport model or interpolated from observations, the tracer simulations can readily yield the average turbidity experienced but would not account for the covariability of turbidity, water depth, and incoming solar irradiation. This limitation can be partially addressed by tracking the exposure of a tracer to photosynthetically active radiation (PAR), resulting in the predicted average light exposure. However, typical light-limited growth equations are strongly nonlinear with light exposure and vary with temperature [14], such that aggregate light exposure may still be insufficient. To remedy that, one could instead calculate a light limitation factor in the transport model along with property-tracking tracers to track the average light limitation. Taking this approach a step further, the phytoplankton growth rate could be calculated in the hydrodynamic model, and a tracer could track the average growth rate experienced. At each step along this progression, more assumptions, formulations, and parameters are pushed into the hydrodynamic model tracer simulations, enabling complex dynamics but hindering subsequent exploration and optimization.
Given the limitations of age-tracer-based phytoplankton modeling, it should be considered a useful tool in conjunction with the Eulerian modeling of phytoplankton. For example, an age tracer approach could be utilized to estimate the values of several model parameters, which could then be incorporated into an Eulerian model that represents additional processes or more complex spatial variability in rates. The Lagrangian biogeochemical model is applicable to many waterbodies, provided that the simulations identify the provenance of nearly all water at the times and locations of biogeochemical predictions. For this reason, it would typically be more challenging to apply this approach in many oceanic and lake settings with high water ages. It is critical that transport processes are represented accurately by the hydrodynamic model used for tracer predictions. Biological rates can be estimated most reliably when the incoming constituent concentrations are known from observations or can reasonably be assumed to be constant and fit in the parameter optimization.
4.3. Management Implications
Several restoration projects have been planned or implemented for the San Francisco Estuary. Part of the motivation of these projects is to provide food for aquatic organisms [41]. Endangered and threatened fish populations have declined simultaneously with their food species [42]. Because our analysis supports the understanding that shallow regions of Suisun Marsh are more productive than deep regions, an increased area of the low intertidal area and marsh plain can be expected to increase primary productivity. Some of this primary production in shallow regions will subsidize adjacent deep regions. The currently abundant managed wetlands are also highly productive and likely contribute to the productivity of Suisun Marsh [43]. Our work suggests that productivity will be influenced by aspects of restoration design, including bed elevation and exchange between shallow habitats with channels, which can be influenced by breach and channel dimensions, among other factors.
Therefore, the benefits of restoration to open tidal habitats can be expected to vary among existing land uses. While the conversion of managed wetlands to open tidal habitats may not increase overall productivity, the restoration of currently dry areas is expected to benefit productivity. The benefits may decrease due to colonization by clams or aquatic vegetation, which may reduce productivity by shading out light to the water column [44]. In addition, note that the high predicted mean water age during summer conditions indicates the slow exchange with Suisun Bay and the low export of productivity from Suisun Marsh. Therefore, restoration in Suisun Marsh may have little influence on food resources in Suisun Bay during summer conditions. Subsidies of food resources might be increased by the management of tidal or freshwater flows to induce net transport through Suisun Marsh [17].
Due to the increased production predicted in shallower regions, Suisun Marsh phytoplankton dynamics may vary as the marsh depth evolves. With the sea level rise predicted to be as large as 2.7 m in the next 75 years [45] and low-sediment conditions in the San Francisco Estuary [46], which limit accretion, the drowning of marshes and a shift toward deeper water is likely. This is likely to lower the productivity of Suisun Marsh.
5. Conclusions
Our phytoplankton modeling approach generalizes the approach of [6] to allow distinct phytoplankton growth and loss rates to differ among spatial compartments. The net production in the main channel is negative (net loss), while the net production in other compartments is positive, showing the importance of distinguishing exposure to different compartments. The approach also allows for the rapid (~1 min) fitting of clam grazing rates and other parameters that produce chlorophyll predictions that are consistent with the observed chlorophyll. These predictions produced credible grazing rates. The Lagrangian approach described can be applied and extended substantially in future work to provide additional insight into the relative importance of different water sources and seasonal variability in loss rates.
Author Contributions
Conceptualization, E.G., R.H. and W.K.; Methodology, E.G. and R.H.; Software, E.G. and R.H.; Validation, E.G.; Investigation, E.G., R.H. and S.B.; Resources, J.D.; Data Curation, S.M. and J.D.; Writing—Original Draft Preparation, E.G.; Writing—Review and Editing, E.G., R.H., W.K., S.M. and J.D.; Visualization, E.G., S.B. and R.H.; Supervision, W.K. and R.H.; Project administration, W.K., R.H. and J.D.; Funding acquisition, W.K., R.H., J.D. and E.G. All authors have read and agreed to the published version of the manuscript.
Funding
This research was funded by the California Department of Fish and Wildlife (CDFW) and the Delta Stewardship Council (DSP) under Proposition 1—Delta Water Quality and Ecosystem Restoration Grant Program. Agreements that contributed to the work include DSP agreement number 18212 to San Francisco State University and CDFW agreement numbers Q1996064 and P1696010 to UC Davis.
Data Availability Statement
The datasets used during the current study are available from the corresponding author on reasonable request.
Acknowledgments
The authors thank Richard Rachiele for guidance and advice on model calibration and Stephen Andrews for leading the development of the RMA UnTRIM model interface, Eric Deleersnijder for useful advice on the use of constituent-based age and residence time theory, Lisa Lucas for suggesting an age-based phytoplankton modeling approach, and Brian Bergamaschi for discussing underway observations. Vincenzo Casulli developed the UnTRIM hydrodynamic model. The UC Davis Geochemistry Laboratory, under the direction of Randy Dahlgren, supported the water quality analysis. Matt Ferner at the San Francisco Bay National Estuarine Reserve supported sonde maintenance and data collection. Data collection was supported by Denise Colombano, Alex Wick, and Natasha Ekasumara.
Conflicts of Interest
The authors declare no conflict of interest.
Appendix A
An essential input to the Lagrangian tracer-based approach is the mean age of water since it was tagged at the model boundary (Grizzly Bay in our application). To estimate the mean age of a source of water, we simulated the transport of two conservative tracers in the hydrodynamic model [7]. The first tracer, representing the fraction of water that entered from the boundary, follows a three-dimensional advection–diffusion equation:
where is the tracer concentration with dimensions of mass per volume, is a three-dimensional velocity vector with the dimensions of length per time, and is the vertical eddy diffusivity with dimensions of length squared per time. Horizontal eddy diffusion was neglected. The scalar advection–diffusion equation was integrated at a time step equal to or less than the hydrodynamic time step of 30 s. When necessary, the scalar time step was reduced from 30 s by using multiple “substeps” of the advection–diffusion integration to meet a stability condition [47].
This equation was discretized with a conservative finite volume approach. The discretized equation can be represented as
where is the discrete advection–diffusion operator [8] representing a hydrodynamic model’s tracer transport solver, and superscripts denote the discrete-time level (i.e., is the spatial concentration distribution at time , and represents the evolution of that distribution by advection and diffusion from time to for a computational time step ).
A second equation is used to represent age–concentration, which characterizes the age content of a water parcel [7,8]. Age–concentration is conceptually equivalent to the product of age and concentration and is more practical to compute than the age itself. The governing equation of age–concentration is similar to Equation (3),
where is the age–concentration with dimensions of time-mass per volume. Using the notation in Equation (A2), its discretized form is written as
where is the computational time step. The mean age was calculated as the ratio of the age–concentration and the tracer concentration.
where has dimensions of time. The initial conditions of the scalar transport equations were 0 concentration and 0 age–concentration throughout the domain. The boundary conditions of were 1 at the Grizzly Bay boundary and 0 at other boundaries. The boundary conditions of age–concentration were 0 at all boundaries.
An analogous approach was applied for partial age [8], which we will refer to as exposure time. The exposure time quantified the time that the tracer spent in each non-contiguous spatial compartment. A unique tracer assigned to each compartment was incremented to accumulate partial age–concentration only within the assigned compartment. The partial age–concentration for compartment j in computational cell i was calculated as
where is 1 if cell i was in compartment j and 0 otherwise. Then, the exposure time (partial age) to compartment j was calculated as
To quantify the mean exposure of a tracer to a water property (depth in our application), we estimated the property–age–concentration with the equation
where is the instantaneous value of the property. Its discretized form can be written as
Then, the mean property encountered by the tracer can be estimated as the ratio of the property–age–concentration and age–concentration.
where b is the mean property encountered by the tracer. The initial condition and boundary conditions of were zero in the domain and at all boundaries.
By analogy to partial age–concentration, we estimated the partial property–age–concentration encountered in cell i for each compartment j as
where represents the property value in cell i. The partial property value for cell i indicating the mean property value encountered by the tracer in compartment j is then
We used this approach to estimate the depth encountered by the tracer in each compartment. In this case, in Equation (A12), the depth in cell i at the time, was updated at each time step and cell in the simulation. In our application, in Equation (A9) was the water-depth–age–concentration associated with the tracer C, and was an estimate of the mean depth that the tracer in cell i at time step n has encountered in compartment j since entering the domain.
References
- Liu, Q.; Chai, F.; Dugdale, R.; Chao, Y.; Xue, H.; Rao, S.; Wilkerson, F.; Farrara, J.; Zhang, H.; Wang, Z.; et al. San Francisco Bay Nutrients and Plankton Dynamics as Simulated by a Coupled Hydrodynamic-Ecosystem Model. Cont. Shelf Res. 2018, 161, 29–48. [Google Scholar] [CrossRef]
- Thompson, J.K.; Koseff, J.R.; Monismith, S.G.; Lucas, L.V. Shallow Water Processes Govern System-Wide Phytoplankton Bloom Dynamics: A Field Study. J. Mar. Syst. 2008, 74, 153–166. [Google Scholar] [CrossRef]
- Kimmerer, W.J.; Thompson, J.K. Phytoplankton Growth Balanced by Clam and Zooplankton Grazing and Net Transport into the Low-Salinity Zone of the San Francisco Estuary. Estuaries Coasts 2014, 37, 1202–1218. [Google Scholar] [CrossRef]
- Blauw, A.N.; Los, H.F.J.; Bokhorst, M.; Erftemeijer, P.L.A. GEM: A Generic Ecological Model for Estuaries and Coastal Waters. Hydrobiologia 2009, 618, 175. [Google Scholar] [CrossRef]
- Jassby, A.D. Phytoplankton in the Upper San Francisco Estuary: Recent Biomass Trends, Their Causes, and Their Trophic Significance. SFEWS 2008, 6, 2. [Google Scholar] [CrossRef]
- Wang, Z.; Wang, H.; Shen, J.; Ye, F.; Zhang, Y.; Chai, F.; Liu, Z.; Du, J. An Analytical Phytoplankton Model and Its Application in the Tidal Freshwater James River. Estuar. Coast. Shelf Sci. 2019, 224, 228–244. [Google Scholar] [CrossRef]
- Deleersnijder, E.; Campin, J.-M.; Delhez, E.J.M. The Concept of Age in Marine Modelling: I. Theory and Preliminary Model Results. J. Mar. Syst. 2001, 28, 229–267. [Google Scholar] [CrossRef]
- Mouchet, A.; Cornaton, F.; Deleersnijder, É.M.; Delhez, É.J. Partial Ages: Diagnosing Transport Processes by Means of Multiple Clocks. Ocean Dyn. 2016, 66, 367–386. [Google Scholar] [CrossRef]
- Gross, E.; Andrews, S.; Bergamaschi, B.; Downing, B.; Holleman, R.; Burdick, S.; Durand, J. The Use of Stable Isotope-Based Water Age to Evaluate a Hydrodynamic Model. Water 2019, 11, 2207. [Google Scholar] [CrossRef]
- Lucas, L.V.; Deleersnijder, E. Timescale Methods for Simplifying, Understanding and Modeling Biophysical and Water Quality Processes in Coastal Aquatic Ecosystems: A Review. Water 2020, 12, 2717. [Google Scholar] [CrossRef]
- Lopez, C.B.; Cloern, J.E.; Schraga, T.S.; Little, A.J.; Lucas, L.V.; Thompson, J.K.; Burau, J.R. Ecological Values of Shallow-Water Habitats: Implications for the Restoration of Disturbed Ecosystems. Ecosystems 2006, 9, 422–440. [Google Scholar] [CrossRef]
- Alpine, A.E.; Cloern, J.E. Trophic Interactions and Direct Physical Effects Control Phytoplankton Biomass and Production in an Estuary. Limnol. Oceanogr. 1992, 37, 946–955. [Google Scholar] [CrossRef]
- York, J.K.; McManus, G.B.; Kimmerer, W.J.; Slaughter, A.M.; Ignoffo, T.R. Trophic Links in the Plankton in the Low Salinity Zone of a Large Temperate Estuary: Top-down Effects of Introduced Copepods. Estuaries Coasts 2014, 37, 576–588. [Google Scholar] [CrossRef]
- Cloern, J.E. Habitat Connectivity and Ecosystem Productivity: Implications from a Simple Model. Am. Nat. 2007, 169, E21–E33. [Google Scholar] [CrossRef] [PubMed]
- Baumsteiger, J.; Schroeter, R.E.; O’Rear, T.; Cook, J.D.; Moyle, P.B. Long-Term Surveys Show Invasive Overbite Clams (Potamocorbula Amurensis) Are Spatially Limited in Suisun Marsh, California. SFEWS 2017, 15, 6. [Google Scholar] [CrossRef]
- Moyle, P.; Manfree, A.; Fiedler, P. The Future of Suisun Marsh: Balancing Policy with Change. SFEWS 2013, 11, 10. [Google Scholar] [CrossRef]
- Sommer, T.; Hartman, R.; Koller, M.; Koohafkan, M.; Conrad, J.L.; MacWilliams, M.; Bever, A.; Burdi, C.; Hennessy, A.; Beakes, M. Evaluation of a Large-Scale Flow Manipulation to the Upper San Francisco Estuary: Response of Habitat Conditions for an Endangered Native Fish. PLoS ONE 2020, 15, e0234673. [Google Scholar] [CrossRef]
- Moyle, P.B.; Baltz, D.M. Patterns in Distribution and Abundance of a Noncoevolved Assemblage of Estuarine Fishes in California. Fish. Bull. 1987, 84, 13. [Google Scholar]
- Sommer, T.; Mejia, F. A Place to Call Home: A Synthesis of Delta Smelt Habitat in the Upper San Francisco Estuary. SFEWS 2013, 11, 4. [Google Scholar] [CrossRef]
- Grimaldo, L.; Feyrer, F.; Burns, J.; Maniscalco, D. Sampling Uncharted Waters: Examining Rearing Habitat of Larval Longfin Smelt (Spirinchus Thaleichthys) in the Upper San Francisco Estuary. Estuaries Coasts 2017, 40, 1771–1784. [Google Scholar] [CrossRef]
- Feyrer, F.; Nobriga, M.L.; Sommer, T.R. Multidecadal Trends for Three Declining Fish Species: Habitat Patterns and Mechanisms in the San Francisco Estuary, California, USA. Can. J. Fish. Aquat. Sci. 2007, 64, 723–734. [Google Scholar] [CrossRef]
- Halverson, G.H.; Lee, C.M.; Hestir, E.L.; Hulley, G.C.; Cawse-Nicholson, K.; Hook, S.J.; Bergamaschi, B.A.; Acuña, S.; Tufillaro, N.B.; Radocinski, R.G.; et al. Decline in Thermal Habitat Conditions for the Endangered Delta Smelt as Seen from Landsat Satellites (1985–2019). Environ. Sci. Technol. 2022, 56, 185–193. [Google Scholar] [CrossRef] [PubMed]
- Davis, B.E.; Cocherell, D.E.; Sommer, T.; Baxter, R.D.; Hung, T.-C.; Todgham, A.E.; Fangue, N.A. Sensitivities of an Endemic, Endangered California Smelt and Two Non-Native Fishes to Serial Increases in Temperature and Salinity: Implications for Shifting Community Structure with Climate Change. Conserv. Physiol. 2019, 7, coy076. [Google Scholar] [CrossRef]
- Cloern, J.E. Patterns, Pace, and Processes of Water-quality Variability in a Long-studied Estuary. Limnol Ocean. 2019, 64. [Google Scholar] [CrossRef]
- Kimmerer, W.J.; Gartside, E.; Orsi, J.J. Predation by an Introduced Clam as the Likely Cause of Substantial Declines in Zooplankton of San Francisco Bay. Mar. Ecol. Prog. Ser. 1994, 113, 81–93. [Google Scholar] [CrossRef]
- Bork, K.; Moyle, P.; Durand, J.; Hung, T.-C.; Rypel, A.L. Small Populations in Jeopardy: A Delta Smelt Case Study. Envtl. L. Rep. 2020, 50, 10714. [Google Scholar]
- Lucas, L.V.; Thompson, J.K. Changing Restoration Rules: Exotic Bivalves Interact with Residence Time and Depth to Control Phytoplankton Productivity. Ecosphere 2012, 3, art117. [Google Scholar] [CrossRef]
- Montgomery, J. Foodweb Dynamics in Shallow Tidal Sloughs of the San Francisco Estuary; University Of California, Davis: Davis, CA, USA, 2017. [Google Scholar]
- Casulli, V.; Walters, R.A. An Unstructured Grid, Three-Dimensional Model Based on the Shallow Water Equations. Int. J. Numer. Methods Fluids 2000, 32, 331–348. [Google Scholar] [CrossRef]
- Casulli, V. A High-Resolution Wetting and Drying Algorithm for Free-Surface Hydrodynamics. Int. J. Numer. Meth. Fluids 2009, 60, 391–408. [Google Scholar] [CrossRef]
- Casulli, V.; Stelling, G.S. Semi-Implicit Subgrid Modelling of Three-Dimensional Free-Surface Flows. Int. J. Numer. Meth. Fluids 2011, 67, 441–449. [Google Scholar] [CrossRef]
- Willmott, C.J. On the Validation of Models. Phys. Geogr. 1981, 2, 184–194. [Google Scholar] [CrossRef]
- Delhez, E.J.M.; Deleersnijder, E. The Concept of Age in Marine Modelling: II. Concentration Distribution Function in the English Channel and the North Sea. J. Mar. Syst. 2001, 31, 279–297. [Google Scholar] [CrossRef]
- NOAA National Estuarine Research Reserve System (NERRS). System-Wide Monitoring Program; NOAA: Washington, DC, USA. Available online: https://coast.noaa.gov/digitalcoast/data/nerr.html (accessed on 12 April 2022).
- Stumpner, E.B.; Bergamaschi, B.A.; Kraus, T.E.C.; Parker, A.E.; Wilkerson, F.P.; Downing, B.D.; Dugdale, R.C.; Murrell, M.C.; Carpenter, K.D.; Orlando, J.L.; et al. Spatial Variability of Phytoplankton in a Shallow Tidal Freshwater System Reveals Complex Controls on Abundance and Community Structure. Sci. Total Environ. 2020, 700, 134392. [Google Scholar] [CrossRef] [PubMed]
- Kimmerer, W.; Wilkerson, F.; Downing, B.; Dugdale, R.; Gross, E.; Kayfetz, K.; Khanna, S.; Parker, A.; Thompson, J. Effects of Drought and the Emergency Drought Barrier on the Ecosystem of the California Delta. SFEWS 2019, 17, 2. [Google Scholar] [CrossRef]
- Storn, R.; Price, K. Differential Evolution—A Simple and Efficient Heuristic for Global Optimization over Continuous Spaces. J. Glob. Optim. 1997, 11, 341–359. [Google Scholar] [CrossRef]
- Virtanen, P.; Gommers, R.; Oliphant, T.E.; Haberland, M.; Reddy, T.; Cournapeau, D.; Burovski, E.; Peterson, P.; Weckesser, W.; Bright, J.; et al. SciPy 1.0: Fundamental Algorithms for Scientific Computing in Python. Nature Methods 2020, 17, 261–272. [Google Scholar] [CrossRef] [PubMed]
- Eaton, A.D.; Clescrei, L.S.; Greenberg, A.E. Standard Method for the Examination of Water and Wastewater; United Book Press, Inc.: Baltimore, MD, USA, 1995. [Google Scholar]
- Bergamaschi, B.; Stumpner, E.; O’Donnell, K.; Hansen, A.; Gelber, A.; Richardson, E.; Kraus, T.; Downing, B.; Senn, D. Spatial Assessment of Nutrients and Water-Quality Constituents in Suisun Marsh with the Salinity Control Gate Reoperation Experiment; a Delta Smelt Resiliency Strategy Experiment 2018. 2021. Available online: https://www.usgs.gov/data/spatial-assessment-nutrients-and-water-quality-constituents-suisun-marsh-salinity-control-gate (accessed on 9 April 2023).
- Durand, J. A Conceptual Model of the Aquatic Food Web of the Upper San Francisco Estuary. SFEWS 2015, 13, 5. [Google Scholar] [CrossRef]
- Mac Nally, R.; Thomson, J.R.; Kimmerer, W.J.; Feyrer, F.; Newman, K.B.; Sih, A.; Bennett, W.A.; Brown, L.; Fleishman, E.; Culberson, S.D.; et al. Analysis of Pelagic Species Decline in the Upper San Francisco Estuary Using Multivariate Autoregressive Modeling (MAR). Ecol. Appl. 2010, 20, 1417–1430. [Google Scholar] [CrossRef]
- Aha, N.M.; Moyle, P.B.; Fangue, N.A.; Rypel, A.L.; Durand, J.R. Managed Wetlands Can Benefit Juvenile Chinook Salmon in a Tidal Marsh. Estuaries Coasts 2021, 44, 1440–1453. [Google Scholar] [CrossRef]
- Christman, M.; Khanna, S.; Drexler, J.; Young, M. Ecology and Ecosystem Impacts of Submerged and Floating Aquatic Vegetation in the Sacramento–San Joaquin Delta. SFEWS 2023, 20, 3. [Google Scholar] [CrossRef]
- Dettinger, M.; Anderson, J.; Anderson, M.; Brown, L.; Cayan, D.; Maurer, E. Climate Change and the Delta. SFEWS 2016, 14, 5. [Google Scholar] [CrossRef]
- Schoellhamer, D.H. Sudden Clearing of Estuarine Waters upon Crossing the Threshold from Transport to Supply Regulation of Sediment Transport as an Erodible Sediment Pool Is Depleted: San Francisco Bay, 1999. Estuaries Coasts 2011, 34, 885–899. [Google Scholar] [CrossRef]
- Casulli, V.; Zanolli, P. High resolution methods for multidimensional advection–diffusion problems in free-surface hydrodynamics. Ocean Model. 2005, 10, 137–151. [Google Scholar] [CrossRef]
Figure 1.
Study area, Suisun Marsh model domain (heavy black outline), bathymetry, stations providing chlorophyll data (the four northernmost stations), and data for model boundary conditions. The red box in the inset indicates the location of the region in the figure.
Figure 1.
Study area, Suisun Marsh model domain (heavy black outline), bathymetry, stations providing chlorophyll data (the four northernmost stations), and data for model boundary conditions. The red box in the inset indicates the location of the region in the figure.
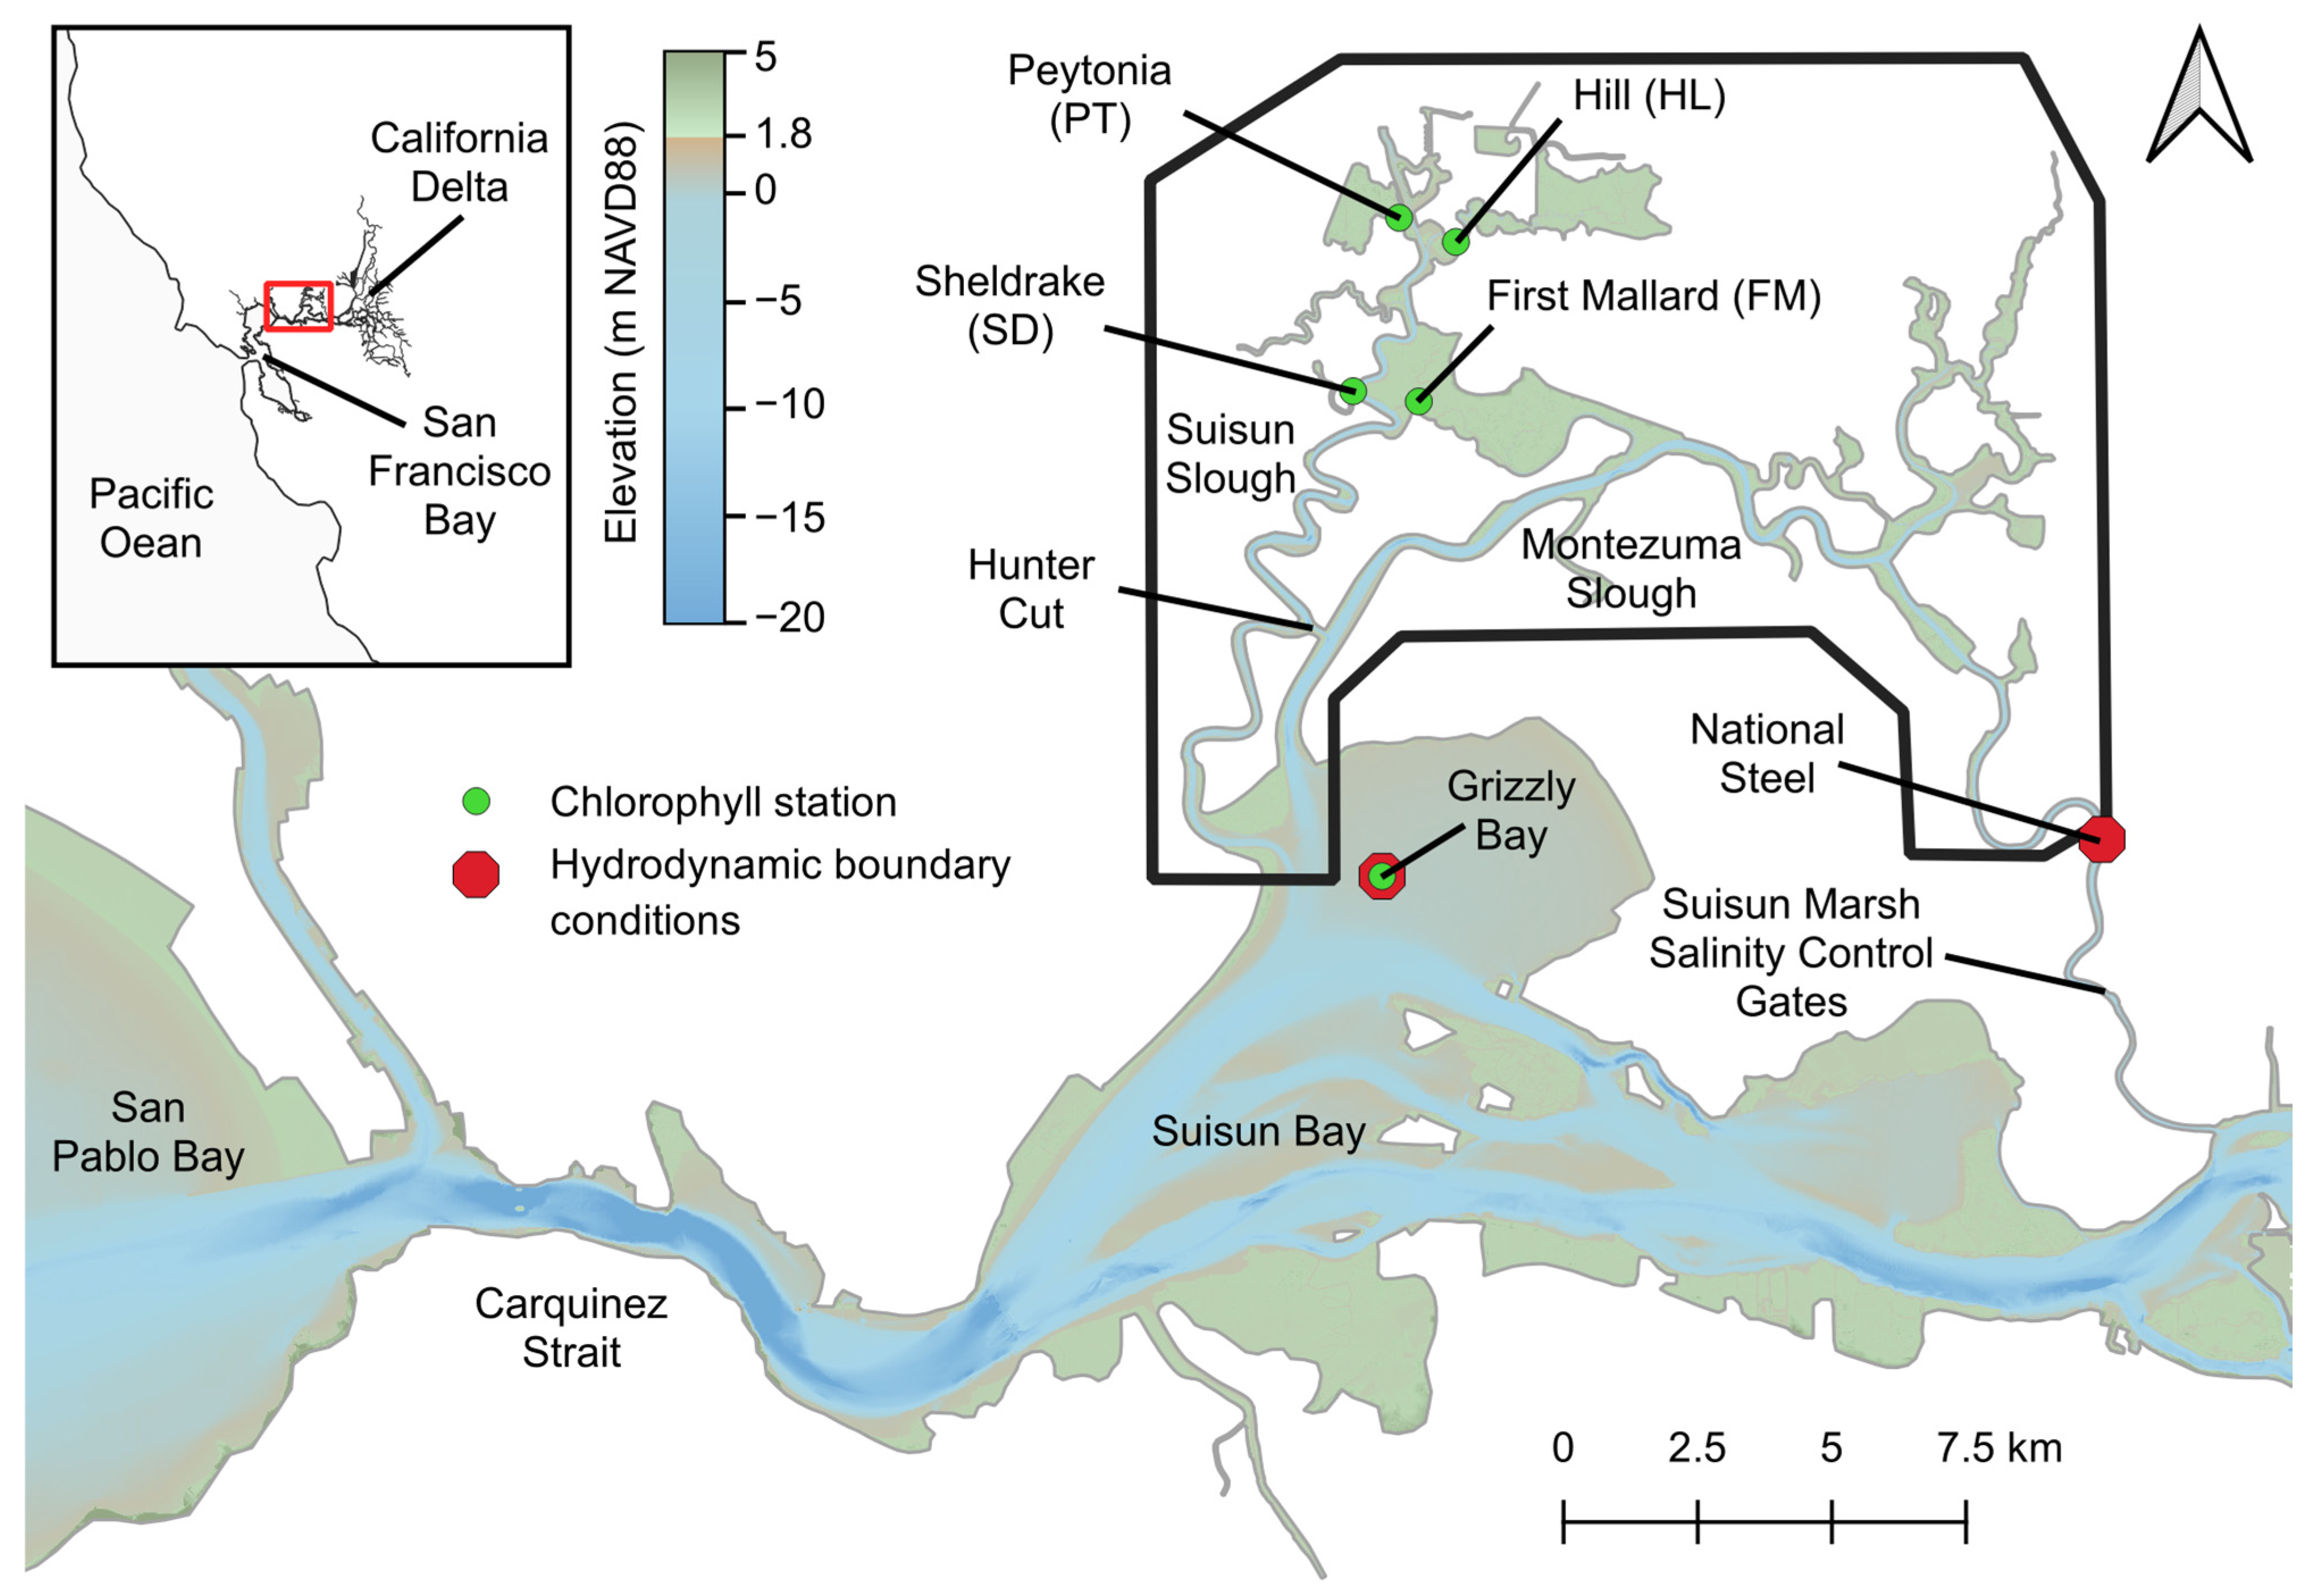
Figure 2.
Compartment classifications of each cell in the model domain.
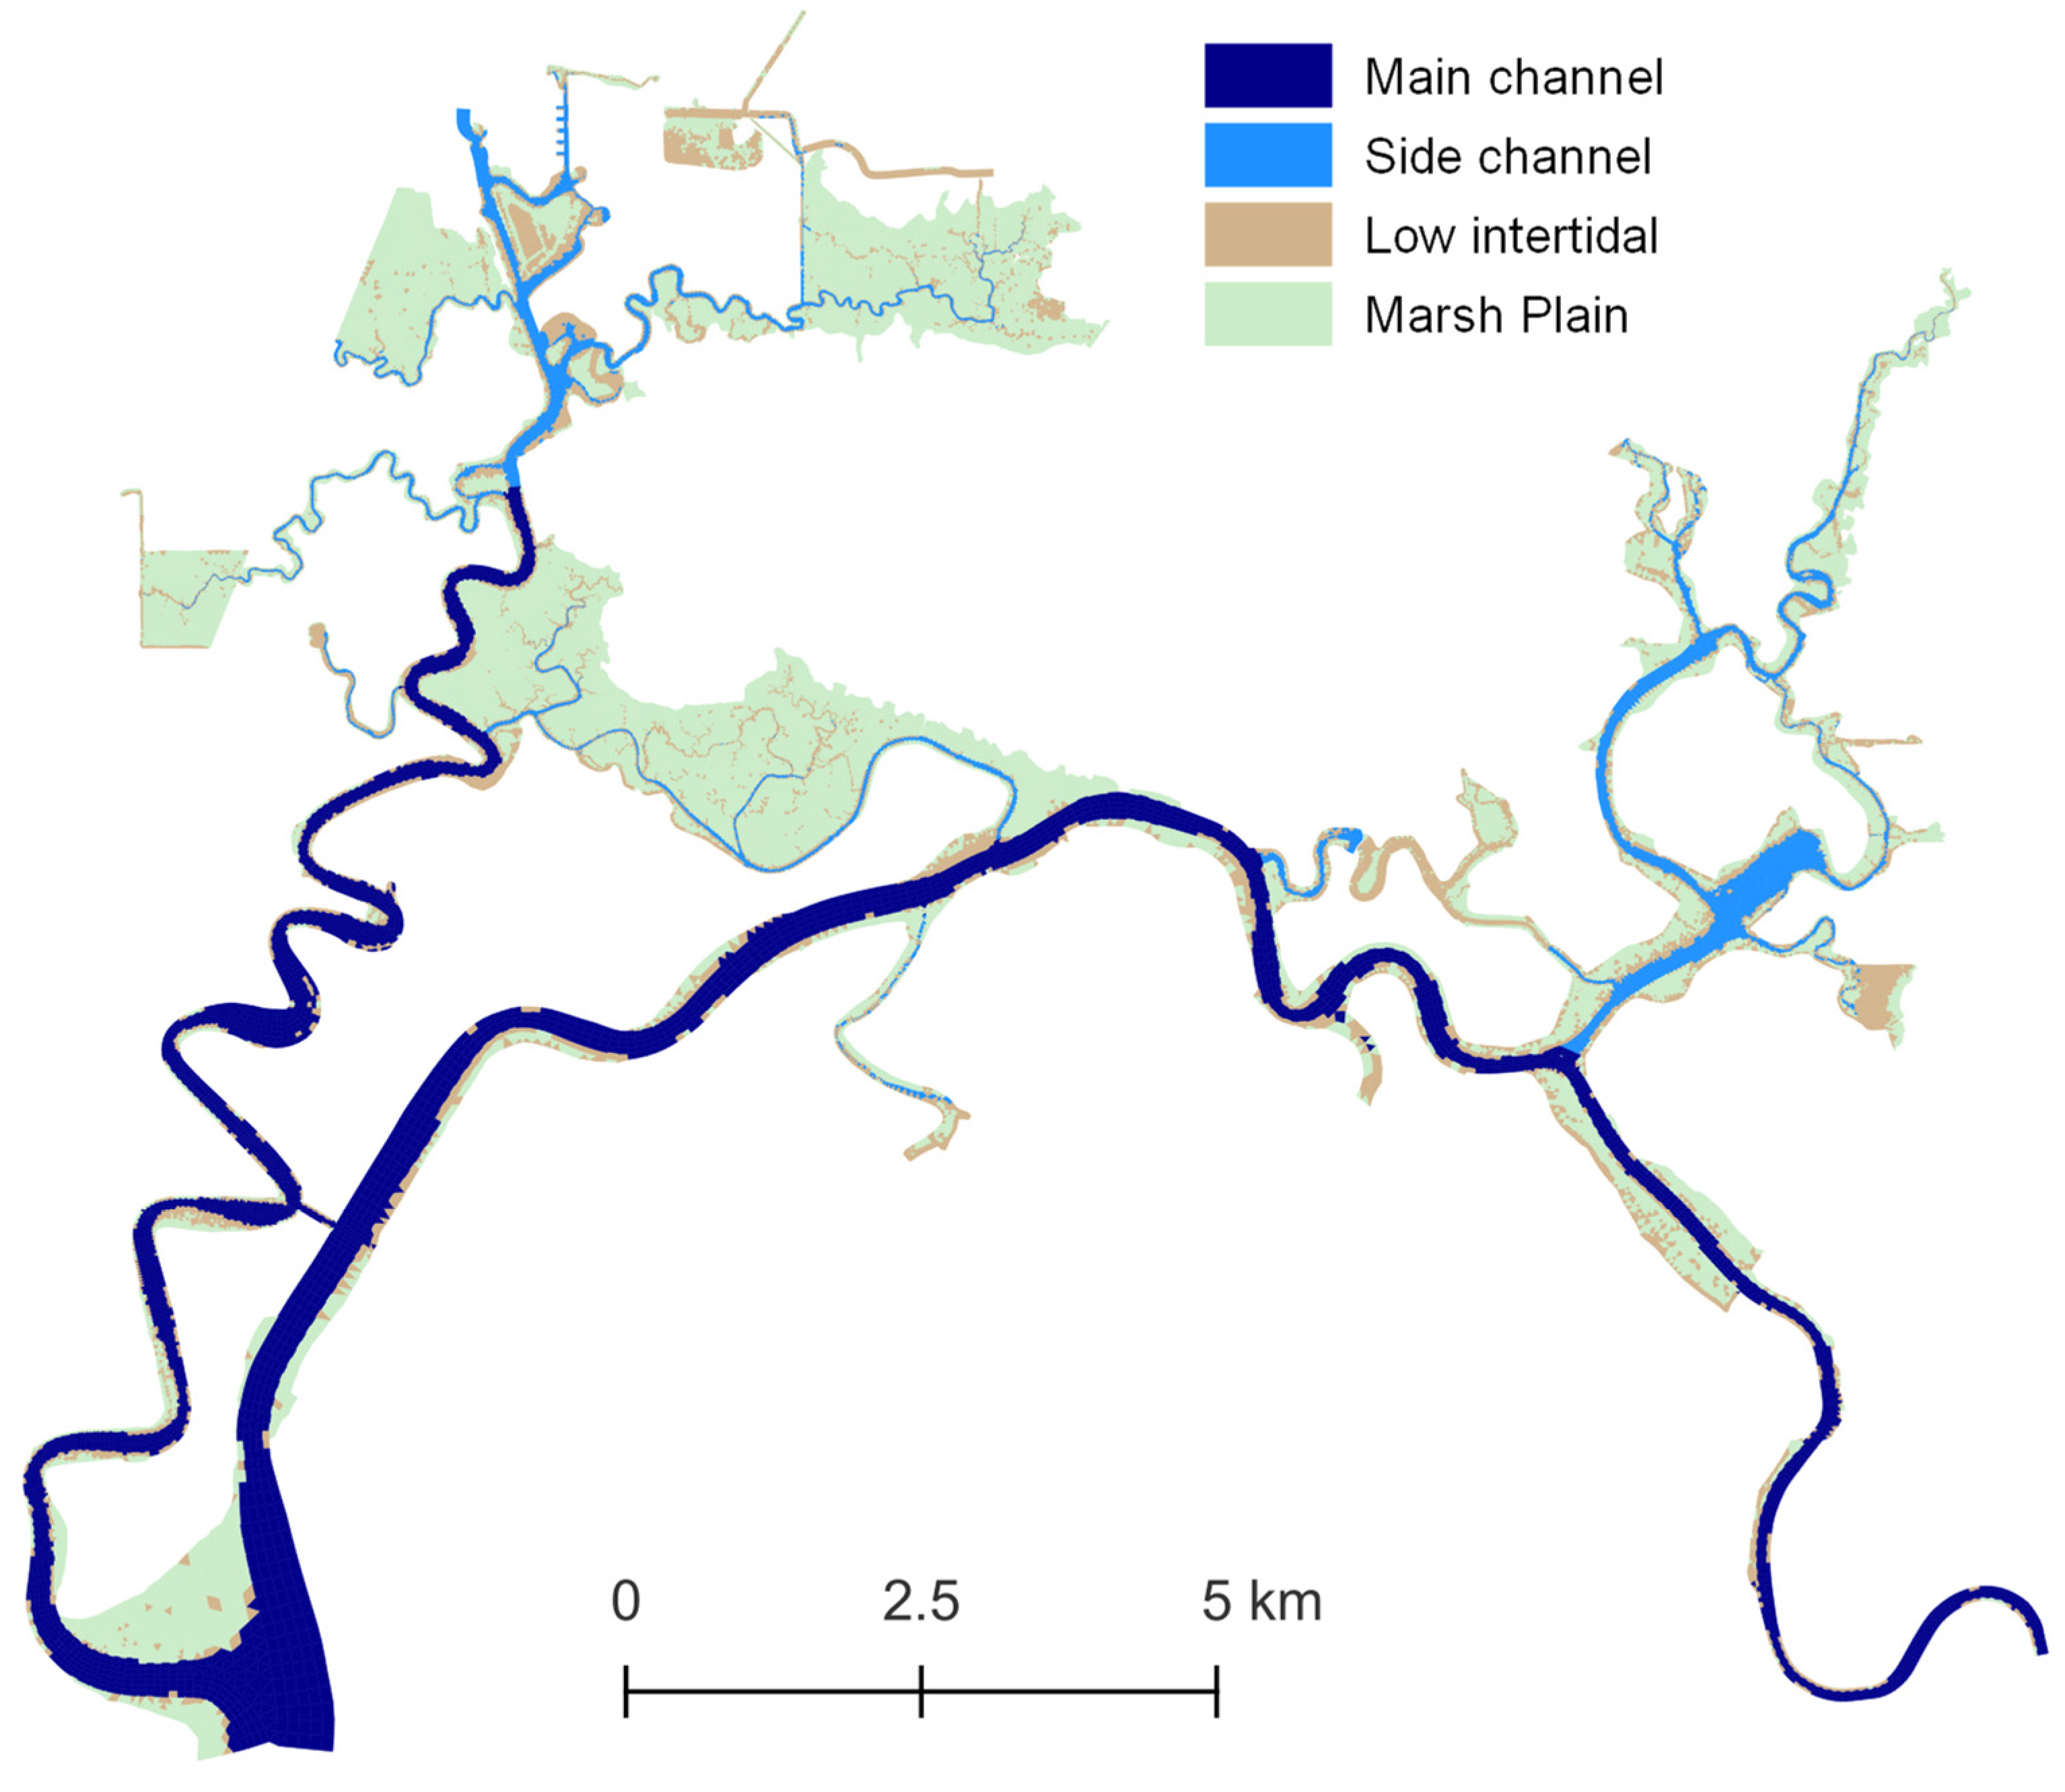
Figure 3.
Hydrodynamic model bathymetry and stations with salinity and water level calibration data.
Figure 3.
Hydrodynamic model bathymetry and stations with salinity and water level calibration data.
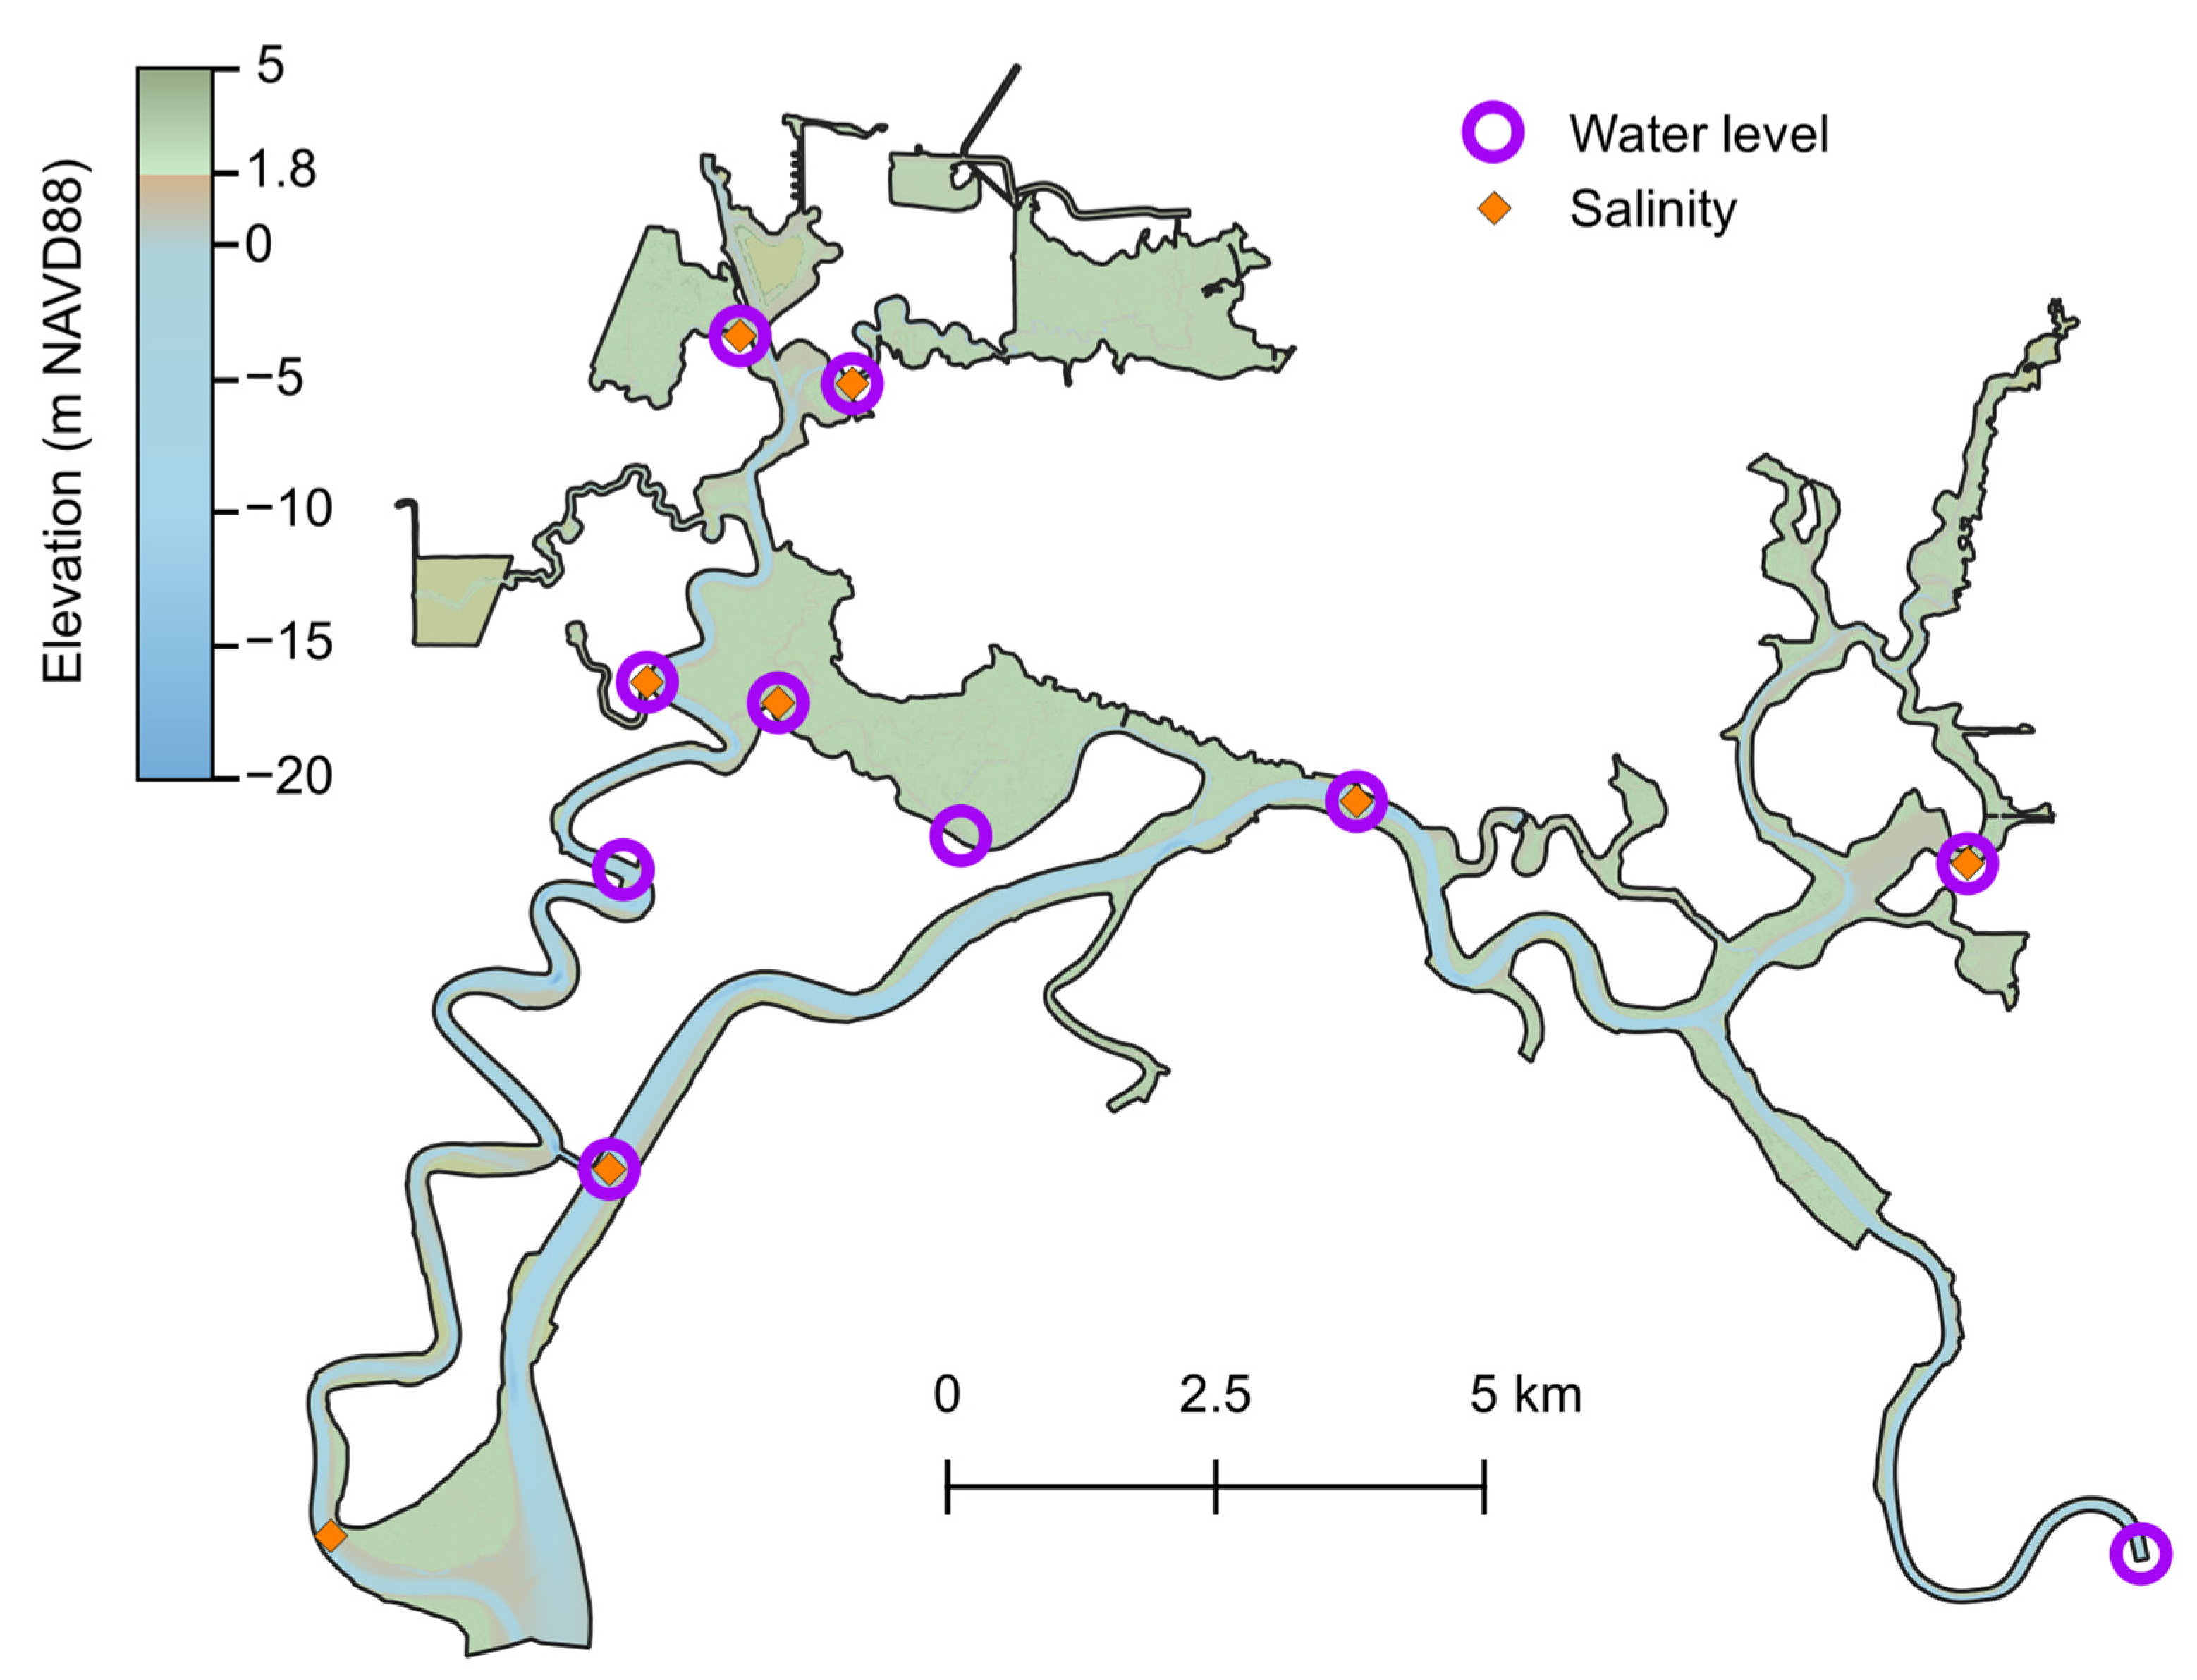
Figure 4.
Model input data for chlorophyll simulation. (A) Measured and low-pass-filtered chlorophyll at the model boundary in Grizzly Bay, (B) light attenuation calculated from continuous turbidity values in Suisun Marsh, (C) temperature from continuous values in Suisun Marsh, (D) measured photosynthetically available radiation (PAR) at First Mallard station. The light attenuation and temperature data in panels B and C were calculated as the median value across the four continuous monitoring stations in Suisun Marsh (Figure 1).

Figure 5.
Example depth-averaged predicted age tracer fields on 27 July 2018 at noon corresponding to the time of underway data collection. (A) Depth-averaged fraction of water that has entered the domain from the Grizzly Bay boundary during the model run. (B) Mean age of the tracer. (C) Mean exposure time to low intertidal compartment. (D) Mean depth encountered by the tracer in low intertidal compartment.

Figure 6.
Predictions for tracer traveling from the Grizzly Bay boundary to each station during the simulation period. (A) Mean exposure times to each compartment. (B) Mean depth encountered while in each compartment. Boxes indicate interquartile ranges, horizontal lines indicate medians, and whiskers indicate the range of 95% of predictions.

Figure 7.
Predicted vs. observed chlorophyll at the continuous monitoring stations. Each circle is colored by the predicted total age. A 1:1 line is shown in blue. Approximately five percent of the chlorophyll measurements at Sheldrake Slough were greater than 20 mg L−1 (not shown).
Figure 7.
Predicted vs. observed chlorophyll at the continuous monitoring stations. Each circle is colored by the predicted total age. A 1:1 line is shown in blue. Approximately five percent of the chlorophyll measurements at Sheldrake Slough were greater than 20 mg L−1 (not shown).
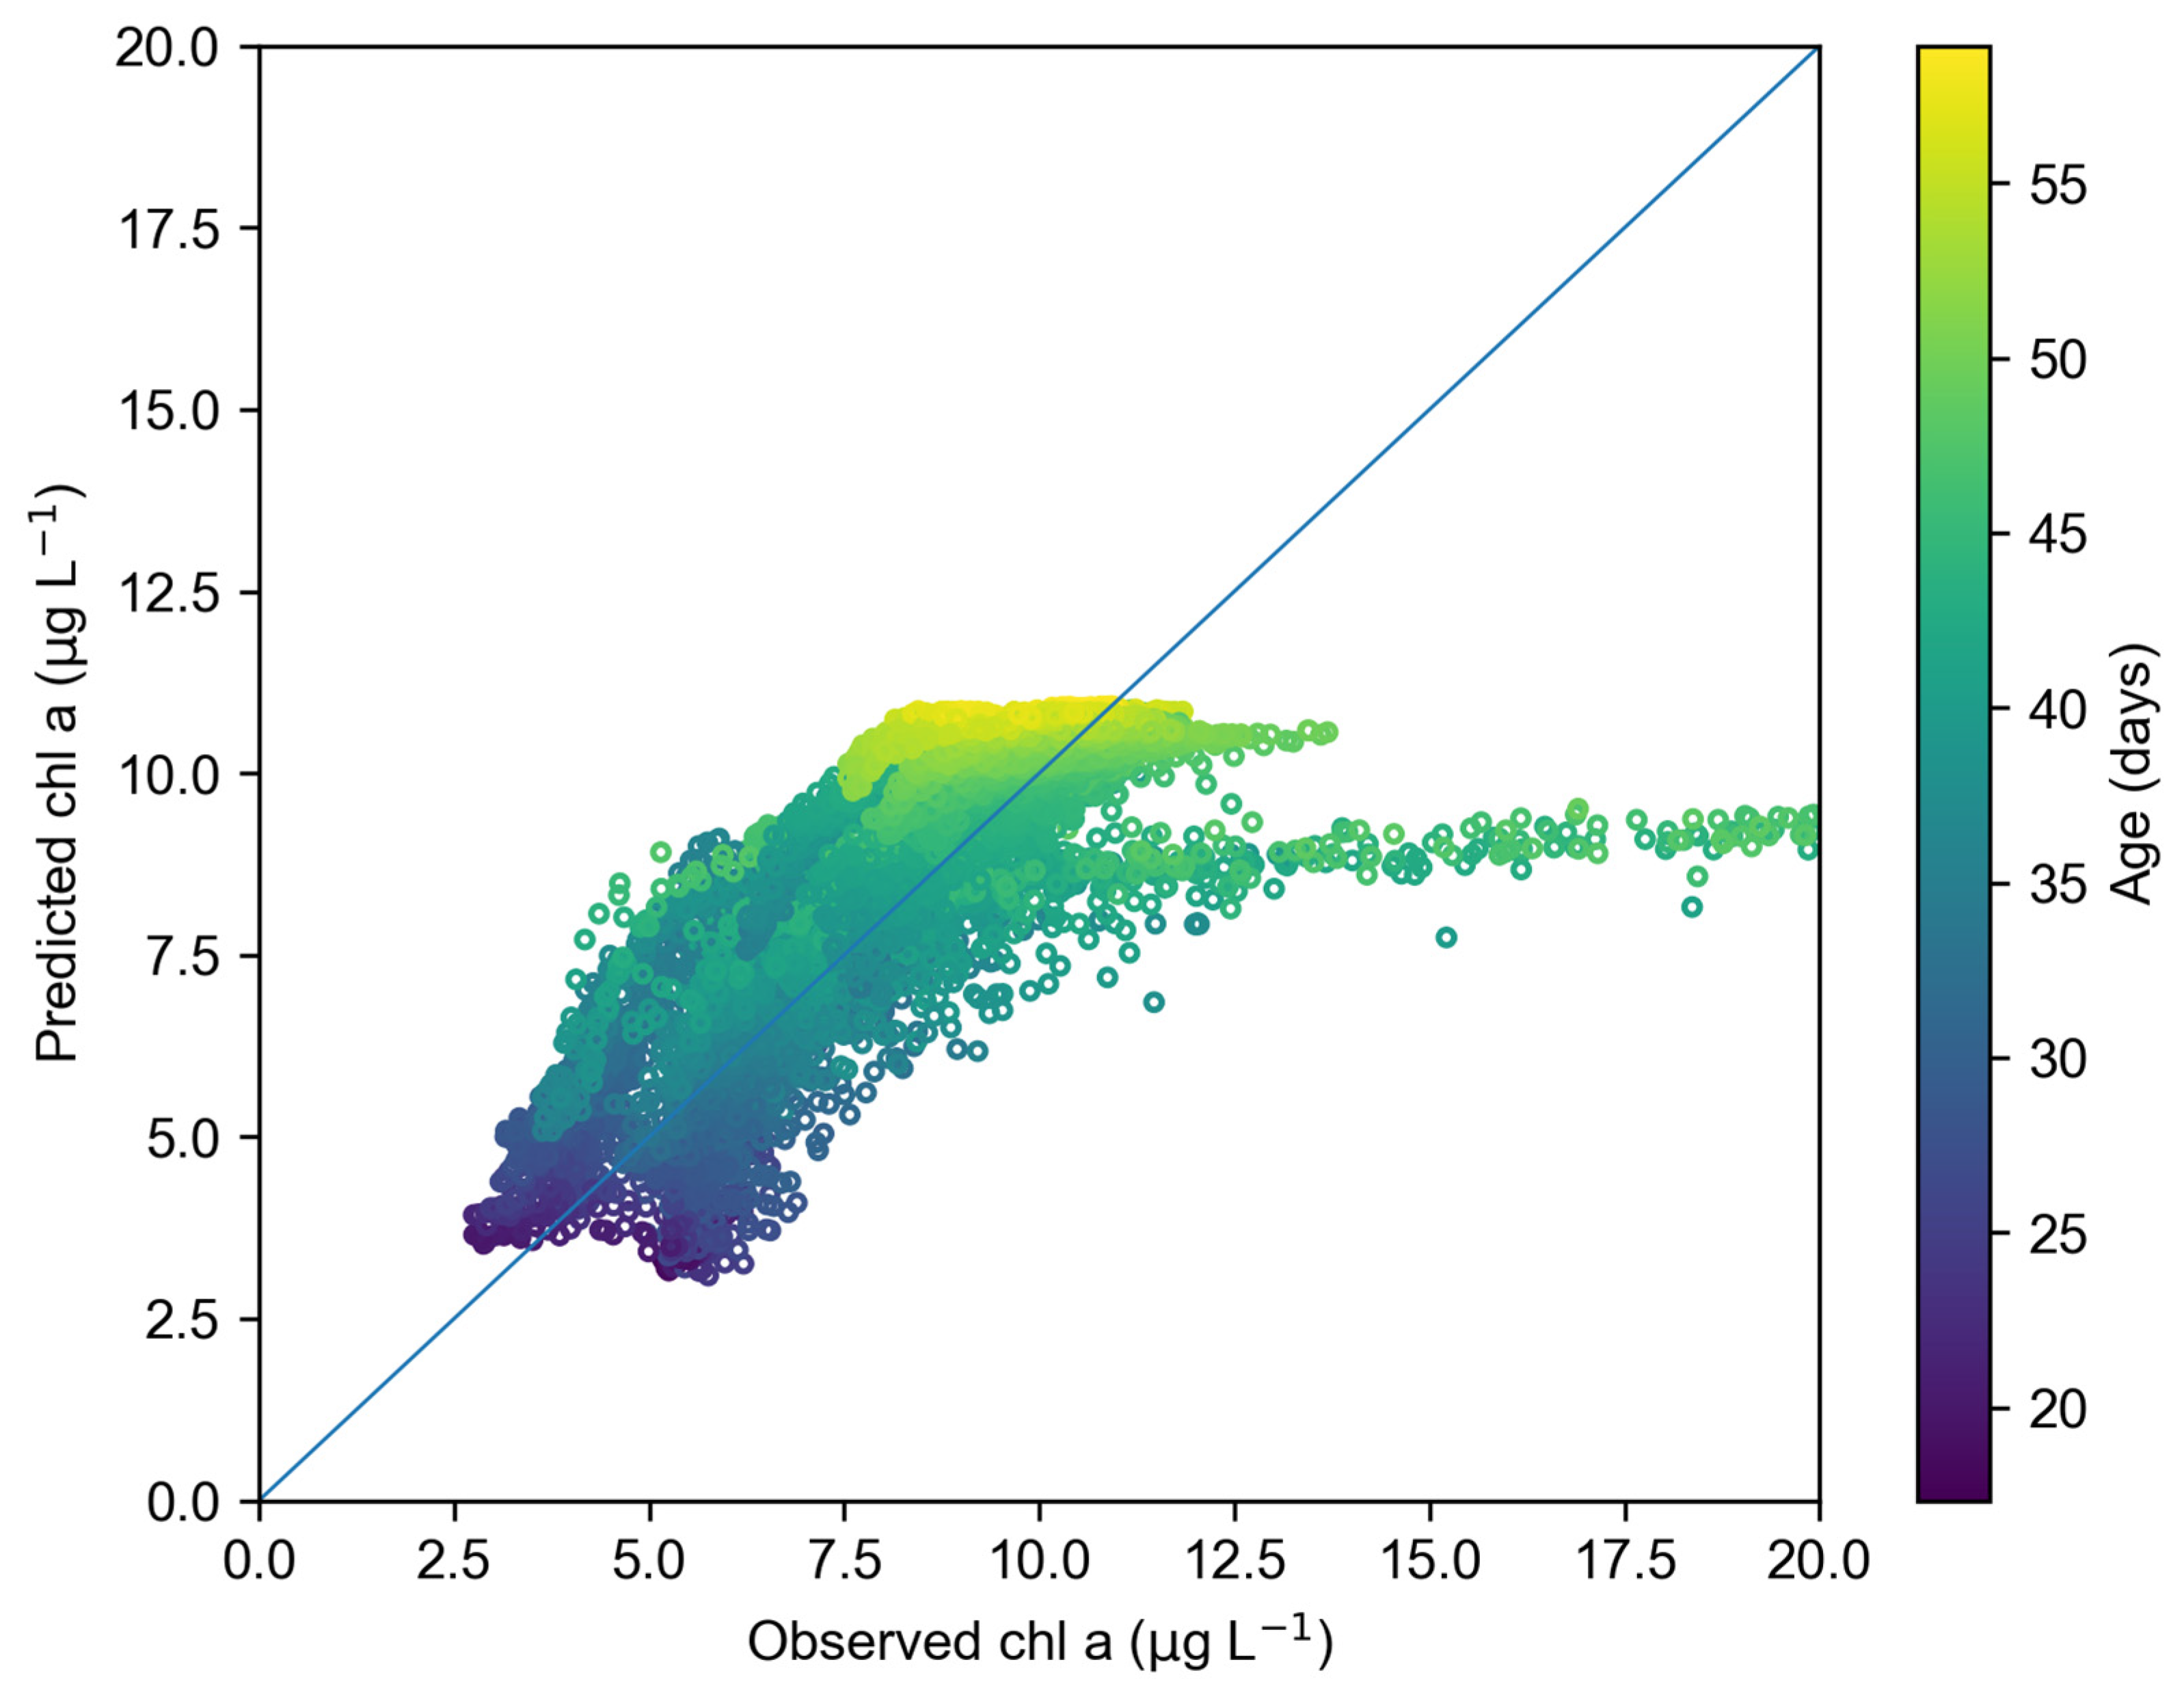
Figure 8.
Quantiles of observed and predicted chlorophyll. The box is the interquartile range, the horizontal line is the median value, and the whiskers give the 0.05 and 0.95 quantiles.
Figure 8.
Quantiles of observed and predicted chlorophyll. The box is the interquartile range, the horizontal line is the median value, and the whiskers give the 0.05 and 0.95 quantiles.
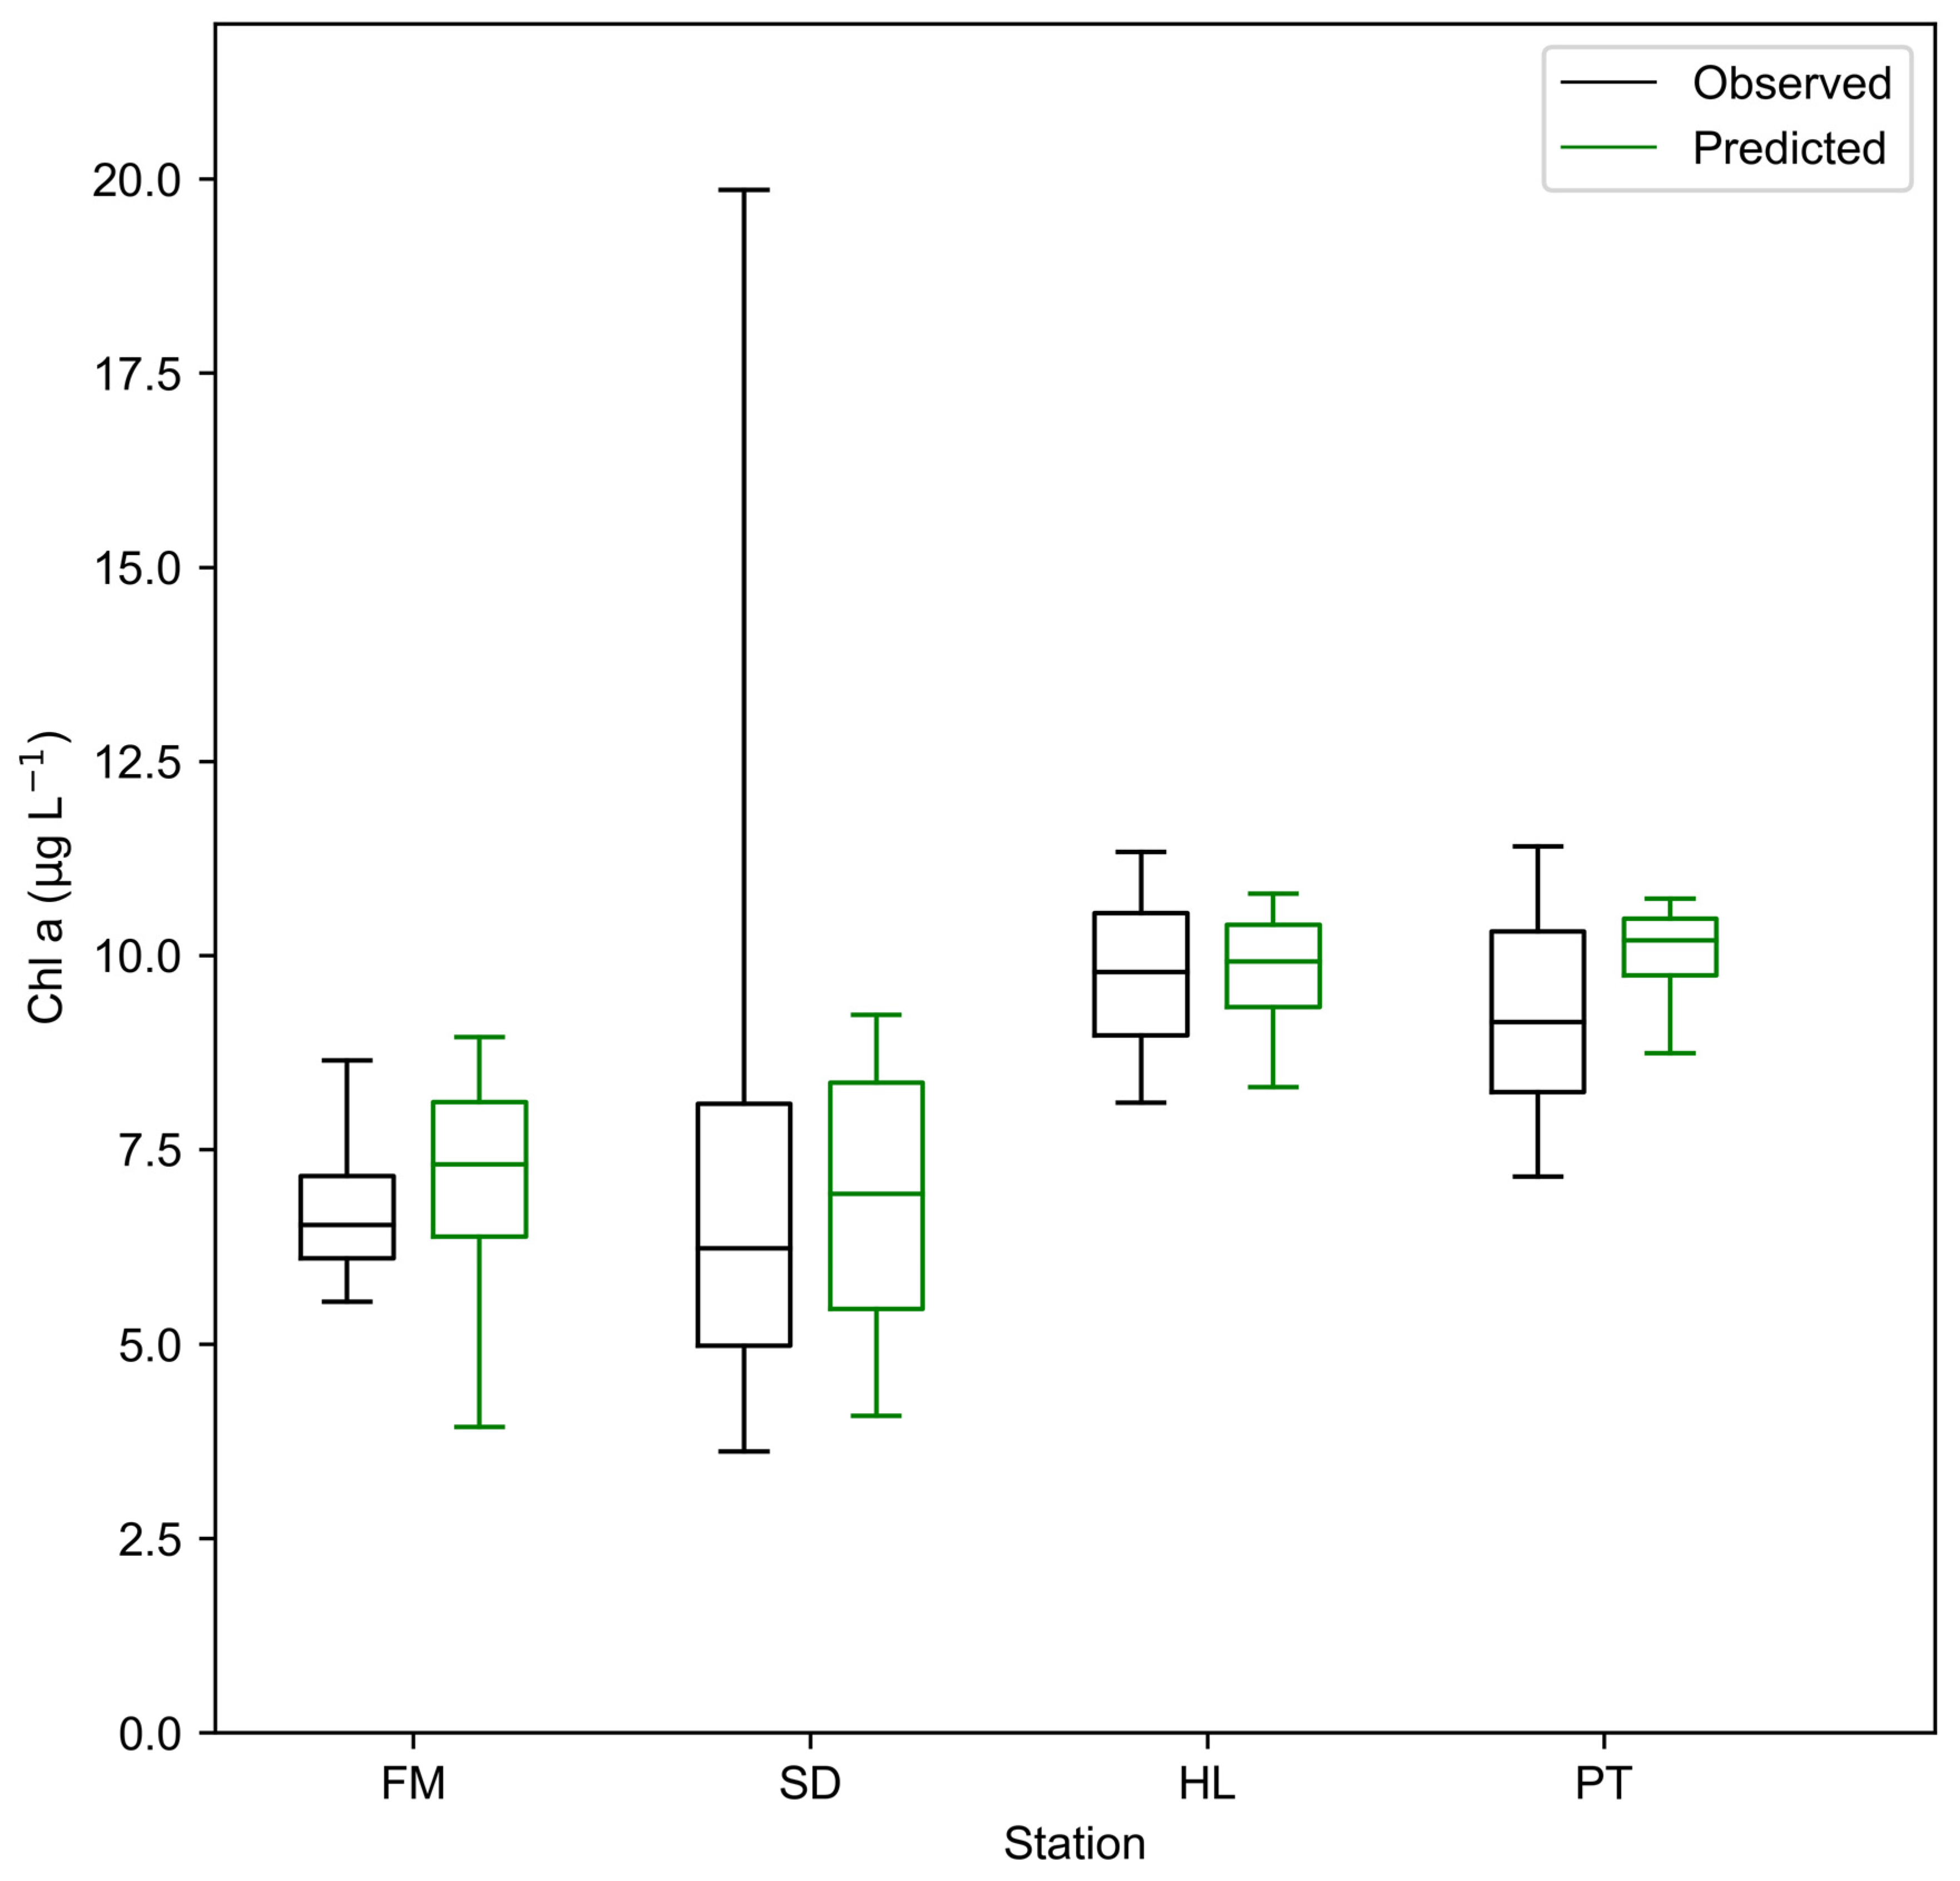
Figure 9.
Observed and predicted chlorophyll at each station during a two-week period centered on the time of underway data collection. (A) First Mallard Slough station. (B) Sheldrake Slough station. (C) Hill Slough station. (D) Peytonia Slough station.
Figure 9.
Observed and predicted chlorophyll at each station during a two-week period centered on the time of underway data collection. (A) First Mallard Slough station. (B) Sheldrake Slough station. (C) Hill Slough station. (D) Peytonia Slough station.

Figure 10.
Calculated phytoplankton growth and loss rates averaged over the simulation period for each compartment (x-axis) and station (letters above individual bars; see Figure 1). The black horizontal line across each bar indicates the net growth rate. Net growth rates were negative in the main channel and positive elsewhere.
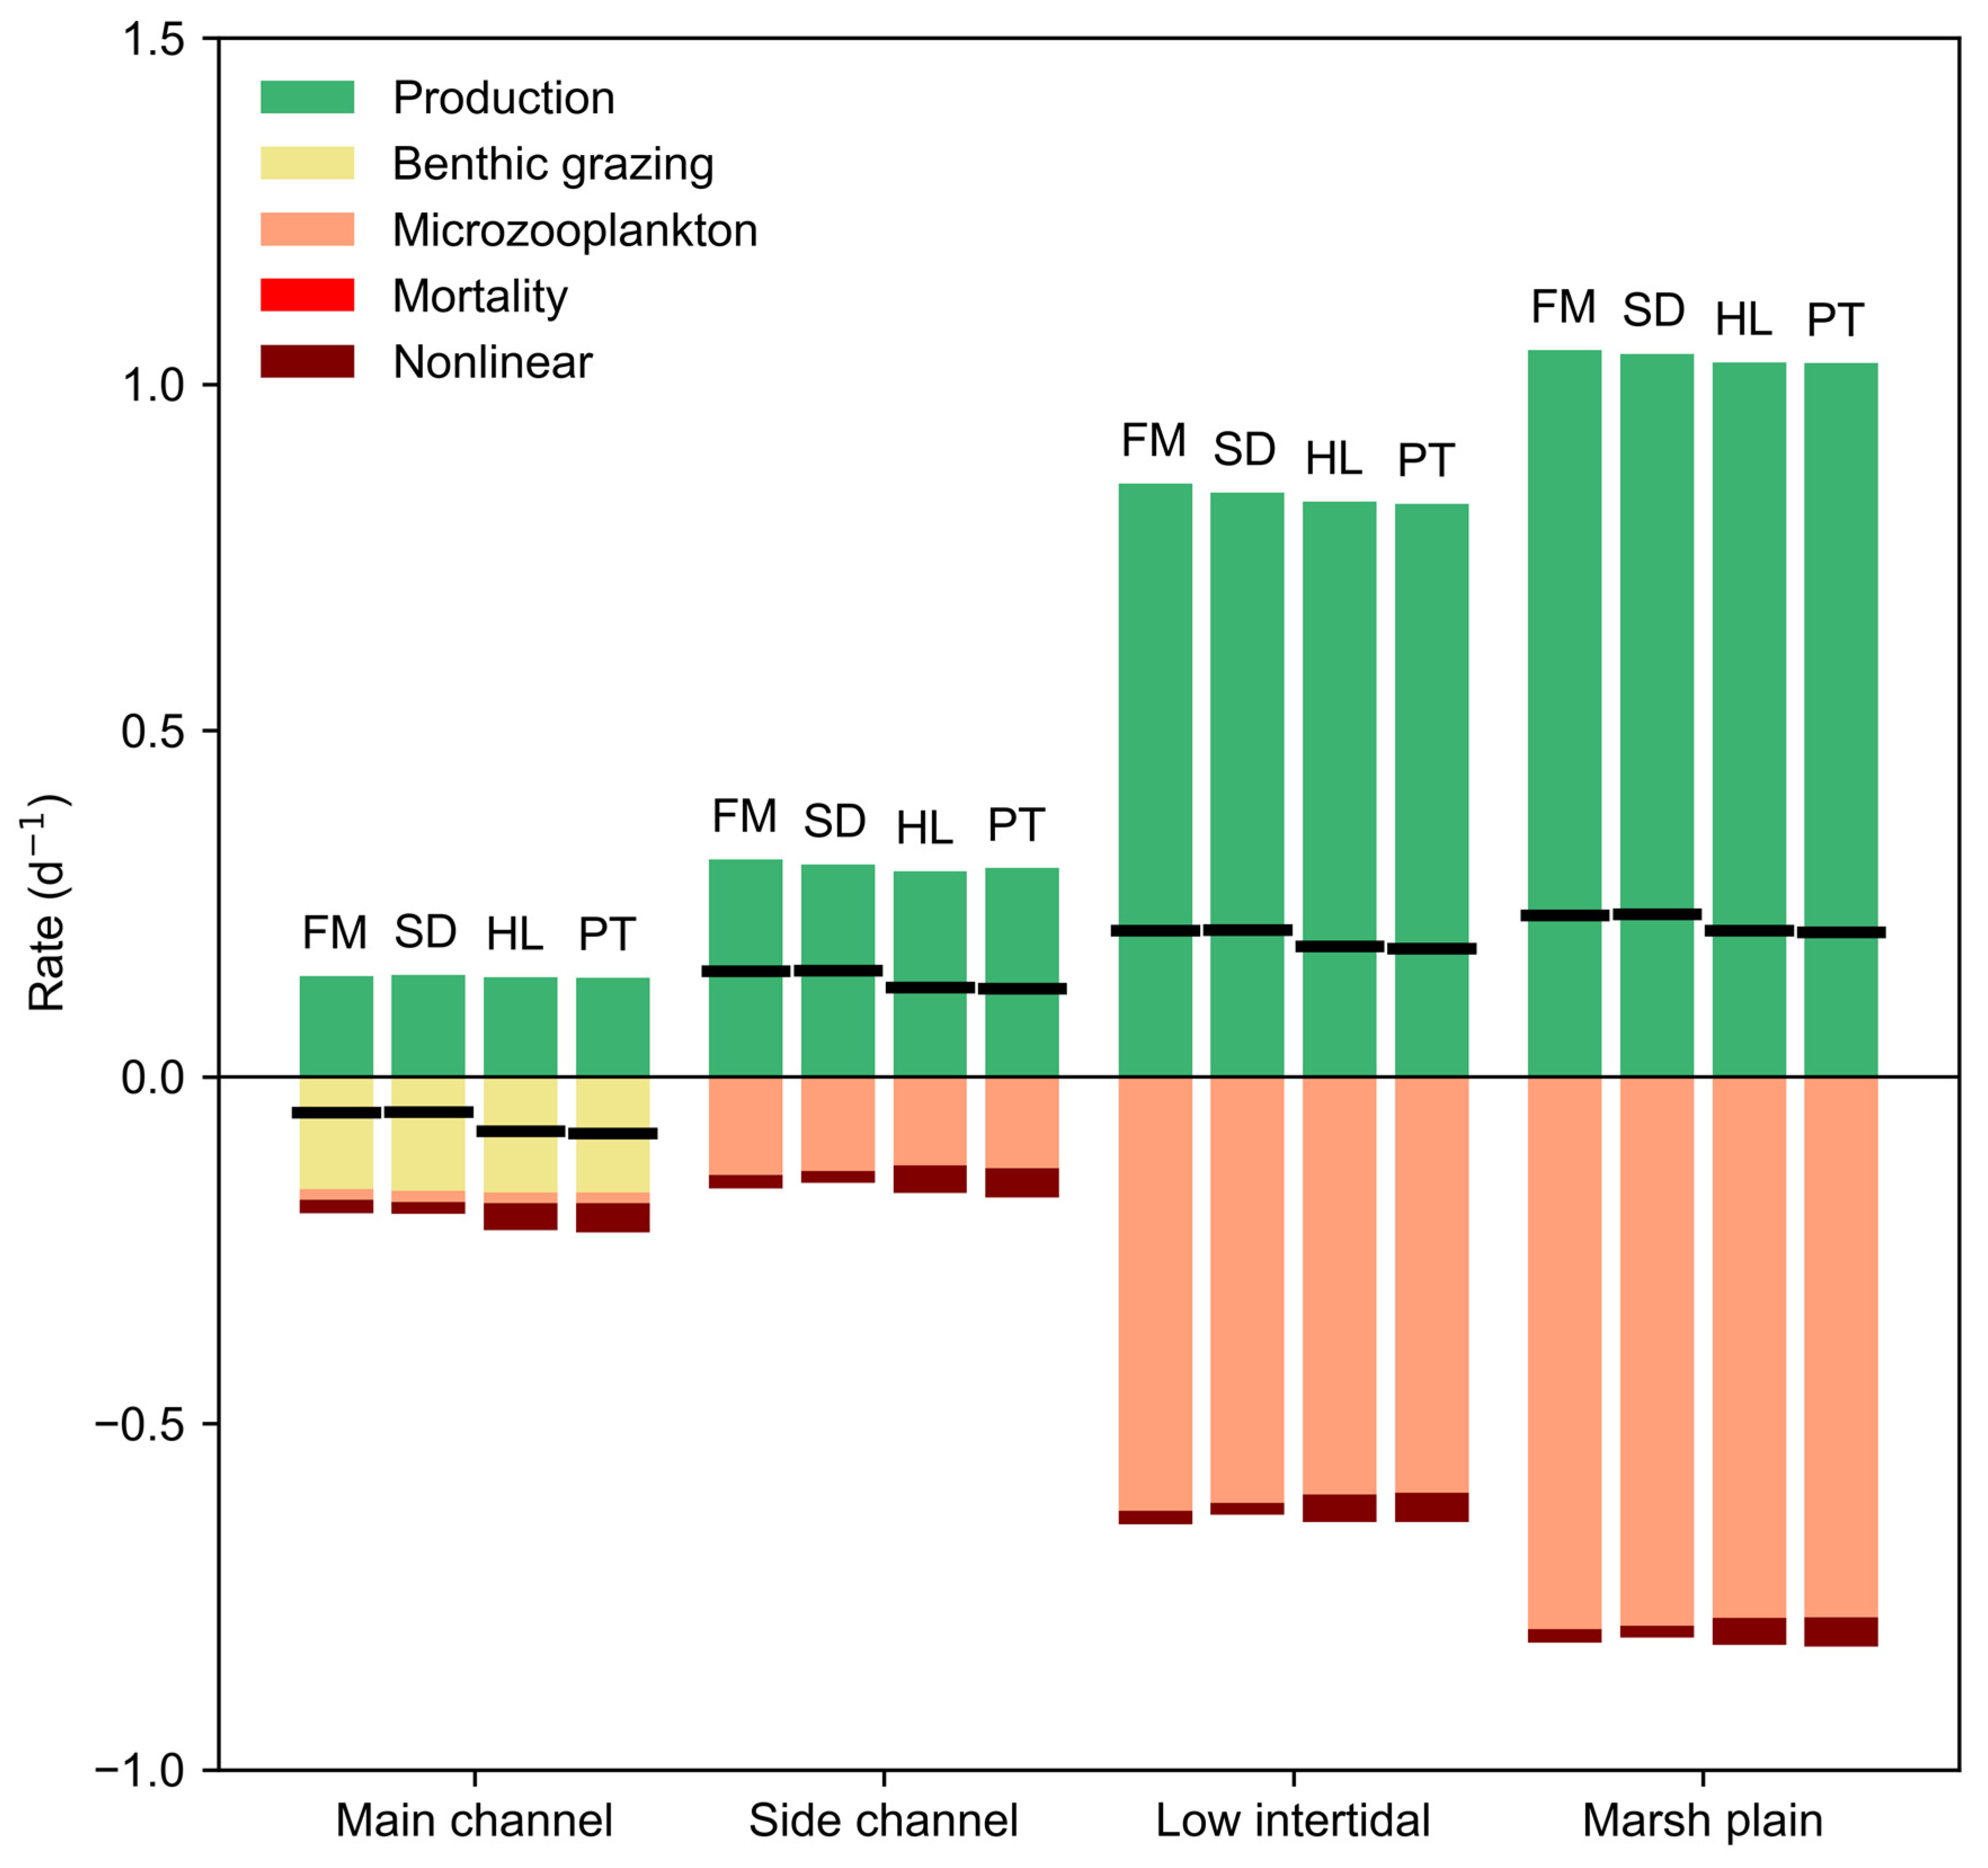
Figure 11.
(A) Observed underway chlorophyll. (B) Predicted chlorophyll. (C) Mean exposure time to margin (side channel, low intertidal, and marsh plain) compartments. (D) Observed vs. predicted chlorophyll with a best-fit line. (E) Relationship of predicted and observed chlorophyll with mean exposure time to margin compartments.

Table 1.
Definitions of variables in phytoplankton model and tracer simulations.
| Term | Definition |
|---|---|
| Chlorophyll concentration (μg L−1) | |
| Hydrodynamic velocity vector (m s−1) | |
| Phytoplankton growth rate (d−1) | |
| Phytoplankton loss rate (d−1) | |
| Net phytoplankton growth rate (d−1) | |
| Mean age (d) | |
| Phytoplankton density-dependent gain/loss term (-) | |
| Horizontal position vector (m) | |
| Boundary concentration of chlorophyll (μg L−1) | |
| Time-averaged net phytoplankton growth rate (d−1) | |
| Mean exposure time to compartment j (d) | |
| j | Compartment index (-) |
| Maximum growth rate at a given temperature (d−1) | |
| Temperature (degrees C) | |
| Light limitation factor (-) | |
| Water column depth (m) | |
| Water column mean photosynthetically active radiation (moles m−2 d−1) | |
| Irradiance supporting maximum water column growth (moles m−2 d−1) | |
| Light attenuation coefficient (m−1) | |
| Turbidity (FNU) | |
| Phytoplankton mortality rate (d−1) | |
| Microzooplankton grazing rate (d−1) | |
| Clam grazing rate (m d−1) | |
| Clam grazing rate in main channel (m d−1) | |
| Clam grazing rate in side channel (m d−1) |
Table 2.
Comparison of continuous monitoring station chlorophyll observations at high water to adjacent underway observations in the Suisun Slough channel, used to specify continuous data offsets.
Table 2.
Comparison of continuous monitoring station chlorophyll observations at high water to adjacent underway observations in the Suisun Slough channel, used to specify continuous data offsets.
| Station | Continuous (mg L−1) | Underway (mg L−1) |
|---|---|---|
| First Mallard | 2.08 | 6.49 |
| Sheldrake | 4.54 | 5.39 |
| Peytonia | 7.60 | 10.01 |
| Hill | 5.86 | 9.43 |
Table 3.
Model performance metrics averaged across continuous monitoring stations.
| Parameter | R2 | Bias | RMSE | Skill |
|---|---|---|---|---|
| Water level | 0.99 | 0.00 | 0.06 | 1.00 |
| Salinity | 0.81 | −0.35 | 0.72 | 0.84 |
Table 4.
Parameter values for clam grazing, density-dependent feedback parameter, and phytoplankton mortality estimated in optimization.
Table 4.
Parameter values for clam grazing, density-dependent feedback parameter, and phytoplankton mortality estimated in optimization.
| Parameter | Location | Value | Units |
|---|---|---|---|
| Cmain | Main channel | 1.13 | m d−1 |
| Cside | Side channel | 0.0 | m d−1 |
| kc | Global | −0.091 | L μg−1 |
| M | Global | 0.0 | d−1 |
Disclaimer/Publisher’s Note: The statements, opinions and data contained in all publications are solely those of the individual author(s) and contributor(s) and not of MDPI and/or the editor(s). MDPI and/or the editor(s) disclaim responsibility for any injury to people or property resulting from any ideas, methods, instructions or products referred to in the content. |
© 2023 by the authors. Licensee MDPI, Basel, Switzerland. This article is an open access article distributed under the terms and conditions of the Creative Commons Attribution (CC BY) license (https://creativecommons.org/licenses/by/4.0/).
Share and Cite
MDPI and ACS Style
Gross, E.; Holleman, R.; Kimmerer, W.; Munger, S.; Burdick, S.; Durand, J. Using Age Tracers to Estimate Ecological Rates in a Phytoplankton Model. Water 2023, 15, 2097. https://doi.org/10.3390/w15112097
AMA Style
Gross E, Holleman R, Kimmerer W, Munger S, Burdick S, Durand J. Using Age Tracers to Estimate Ecological Rates in a Phytoplankton Model. Water. 2023; 15(11):2097. https://doi.org/10.3390/w15112097
Chicago/Turabian StyleGross, Edward, Rusty Holleman, Wim Kimmerer, Sophie Munger, Scott Burdick, and John Durand. 2023. "Using Age Tracers to Estimate Ecological Rates in a Phytoplankton Model" Water 15, no. 11: 2097. https://doi.org/10.3390/w15112097
Note that from the first issue of 2016, this journal uses article numbers instead of page numbers. See further details here.