Article

Tomato Yield Responses to Deficit Irrigation and Partial Root Zone Drying Methods Using Biochar: A Greenhouse Experiment in a Loamy Sand Soil Using Fresh and Saline Irrigation Water

by
Abdulaziz G. Alghamdi
1,*,
Anwar A. Aly
2,
Abdulrasoul M. Al-Omran
1,
Ibrahim I. Louki
1 and
Arafat Alkhasha
1
1
Department of Soil Science, College of Food and Agricultural Sciences, King Saud University, P.O. Box 2460, Riyadh 11451, Saudi Arabia
2
Soil and Water Science Department, Faculty of Agriculture, Alexandria University, Alexandria 21545, Egypt
*
Author to whom correspondence should be addressed.
Water 2023, 15(15), 2797; https://doi.org/10.3390/w15152797
Submission received: 18 June 2023 / Revised: 21 July 2023 / Accepted: 31 July 2023 / Published: 2 August 2023
(This article belongs to the Special Issue Sustainable Management of Agricultural Water)

Abstract

:
The impacts of regulated deficit irrigation (RDI) and partial root zone drying irrigation (PRD) on water productivity (WP), crop water response factor (Ky), and yield of tomato crop (Solanum lycopersicum) were explored in this study using fresh (0.9 dS m−1) and saline (3.6 dS m−1) water under greenhouse conditions. RDI had four ETc (crop evapotranspiration) levels, i.e., 40, 60, 80, and 100%. PRD adopted 100% ETc for all treatments with changes in its application time (first, second, third, and fourth growth stages). Biochar pyrolyzed at 450–500 °C and added at rate of 4%. The results revealed that the Ky ranged between 0.21 and 0.37, indicating that tomato can tolerate a shortage of irrigation water. The highest value of WP (191 kg m−3) was found in 40% ETc using fresh water with biochar. The highest yield (20.0 kg m−2) was obtained with the application of 100% ETc with fresh water and biochar. Biochar application did not result in favorable yields with saline water due to its high salinity (7.8 dS m−1). The use of PRD in the fourth stage with biochar and fresh water led to the highest yield (20.6 kg m−2). Finally, this study recommends the application of biochar only when fresh irrigation water is available in adequate amounts.

1. Introduction

The Kingdom of Saudi Arabia (KSA) is situated in an arid environment, with limited renewable fresh water resources, and thus is mainly dependent on groundwater [1]. The agricultural sector consumes more than 80% of the water resources in the Kingdom of Saudi Arabia [2]. Consequently, research investigating agricultural water conservation is needed [3,4,5]. Practices which could decrease the amount of irrigation water, without reducing yield, are required, especially in arid environments [3,5]. Therefore, the partial root zone drying (PRD) method, regulated deficit irrigation (RDI), and the addition of soil conditioners, such as biochar, are considered important approaches that can conserve irrigation water and increase yields and water productivity (WP) [6,7,8,9,10].
Partial root zone drying is an irrigation method where one side of the root system of a plant is irrigated and the other side is exposed to drought. Repeated sequences of wet/dry sides of the root system are adopted. The PRD method is considered a useful practice to increase crop yields with minimum consumption of water [11]. Akhtar et al. [12] concluded that biochar application to soil caused an improvement in the soil water content and the final yield of tomato. In addition, they found that the adoption of PRD along with biochar improved the crop yield. In RDI, the plant is irrigated with less water than the calculated crop water requirement (CWR) without decrease in yield [3]. Numerous studies have been conducted to investigate the implementation of RDI and its effect on water conservation. Most of them have suggested that this method can be used in arid environments [8,13,14,15,16]. Alomran et al. [3] studied the impact of RDI on cucumber yield and found yield did not decrease with the 80% ETc (crop evapotranspiration under standard conditions) compared with full irrigation (100% ETc). Furthermore, a general increase in WP was recorded as a result of water stress. However, Amer et al. [17] reported that the yield of cucumber crop declined under water stress. Alghamdi et al. [14] found that date palm biochar, used in conjunction with PRD and RDI, improved the soil water content and allowed a good use of farm irrigation water. The yield response factor (Ky) to deficit irrigation (DI) has been well investigated in the past two decades [3,18,19]. If crops’ Ky values are less than 1, the crops are considered tolerant to water stress. Instead, when Ky values are more than 1, the crops are usually considered as sensitive to water stress [20]. The Ky values of the same crops are different according to the water stress given at different growth stage. For example, cucumber’s Ky ranges between 0.196 and 1.31. Moreover, Ky values of different crops are not alike. Tomato, green bean, safflower, and eggplant have Ky values equal to 0.99, 1.23, 0.97, and 1.37, respectively [17,19,21,22]. Alghamdi et al. [6] stated that the application of biochar with suitable application rates could improve the hydro-physical properties of soil in arid conditions.
Most research has focused on either the RDI or PRD technique individually for water conservation or on the application of soil conditioners such as biochar. Limited research has compared and integrated the impact of RDI and PRD in the presence of biochar on irrigation water conservation and the effects on yield and water productivity (WP). Moreover, it is known that most of the groundwater used for irrigation in arid environment is saline; thus, there is definitely a need for investigating the effect of biochar application when using saline water for irrigation [7,14]. Consequently, the main objectives of this investigation were to; (1) investigate the impacts of RDI and PRD systems, and date-palm-derived biochar on water productivity (WP), the crop water response factor (Ky), and the final yield of tomato (Solanum lycopersicum) using fresh and saline water; (2) investigate the impact of PRD at different growth stages on tomato yield using two types of irrigation water, i.e., fresh and saline.

2. Materials and Methods

2.1. Soil and Water Analysis

Greenhouse experiments were conducted at the Almohous Farm, northwest of Riyadh, Saudi Arabia (coordinates: 25°17′40″ N and 45°52′55″ E altitude: +722 m). Weather station equipment was fixed inside the greenhouse to control thermal and humidity conditions. The temperatures inside the greenhouse ranged between 20 °C and 25 °C; while the relative humidity ranged between 50% and 80% during the two seasons. The tomato crop (Solanum lycopersicum) was planted during two different seasons using two different types of irrigation water: fresh (EC 0.9 dS m−1) and saline (EC 3.61 dS m−1). The Ellen tomato seeds were produced by Seminis Seed Company, Greece, and purchased from the local agent in Saudi Arabia, the Star Agricultural Company. A composite sample of the soil used in the experiments was collected for physiochemical analyses before the start of the experiment. Likewise, the irrigation water samples were collected and analyzed for chemical properties [23]. The properties of soil and water are shown in Table 1.

2.2. Experimental Layout

The experimental layout was a completely randomized design with 4 replications. Three levels of RDI were adopted (40%, 60%, and 80% ETc), and 100% ETc was the control. The PRD was applied at different growth stages (1st stage, 2nd stage, 3rd stage, and 4th stage) using 100% ETc, while the traditional drip irrigation with 100% ETc was applied with untreated PRD growth stages (Table 2 and Table 3).
The experimental design for RDI was: 4 irrigation regimes × 4 replications × 2 soils × 2 irrigation water = 64 plots. However, for PRD it was: 5 PRD growth stages application × 4 replications × 2 soils × 2 irrigation water = 80 plots.
The RDI and PRD systems were studied by using a drip irrigation system. The diameter of the main irrigation pipeline was three inches (7.6 cm). The diameter of the submain line was one-half inch (1.4 cm), and the line was 17 m in length. Spaces between plants (emitters) were 0.5 m. The distance between rows was one meter. The area of each plot was 17 m2 (17 m length and 1.0 m width), and 32 plants were adopted for a single replication. Water meters connected to the irrigation pipes determined the amount of water for different treatments. The tomato crop was planted in two seasons (the first season was in mid-November, 2020) and harvested twice a week after three months of planting. The fruiting was continued for a period of three months and the season ended with the last harvesting date on 18 May 2021. However, the second season was started on 23 August 2021 and ended on 5 June 2022. For all treatments, the P2O5 was applied once before planting at a rate of 250 kg ha−1 using di-ammonium phosphate (46% P2O5). The recommended doses of nitrogen and potassium were applied depending on soil analyses before each season to prevent their deficiency.
A pan evaporation method was used for irrigation scheduling in the greenhouse [8,24,25,26]. The calculated crop evapotranspiration (ETc) was based on Equation (1):
ETc = Eo × Kp × Kc
where the ETc is the daily maximum crop evapotranspiration (mm); Eo is the class A pan evaporation (mm); Kp is the pan coefficient (its values range between 0.70 and 0.88); and Kc is the crop coefficient and its values depend up on the plant growth stage (values range between 0.6 and 1.2). The values of Kc used in this study were 0.6 for the vegetative growth stage, 1.0 for the blooming stage, 1.2 for fruit setting stage, and 0.7 for the final stage [20].
Crop water requirement (mm day−1) (CWR) was computed using the following equation [27]:
C W R = E T c 1 L R × E e f
C W R = K c × E o × K p 1 L R × E e f
where Eef is the efficiency of irrigation and LR is the leaching requirement, which is computed as follows [28]:
L R = E C w 2 × max E C e
where ECw is irrigation water salinity (dS m−1) and max ECe is the electrical conductivity of an extracted soil paste (dS m−1) that will reduce the tomato yield to zero (in this study, the max ECe =13 dS m−1). When irrigating with saline water, we usually take into consideration the leaching requirement (LR), which affects (increasing) the irrigation depth [20].
Equation (5) was employed to estimate the crop water productivity (CWP) [29,30]:
C W P = Y i e l d ( K g ) Volume   of   applied   water   ( m 3 )
Usually, the relationship between yield and applied water is called the crop water production function (CWPF). The CWPF becomes curvilinear when excess water is lost to drainage. The CWPF shows the relationship between the applied water quantity and yield. Helweg [31] developed the following quadratic polynomial function:
Ya = b0 + b1W + b2W2
where Ya is crop yield (ton ha−1), W is irrigation water (m3 ha−1), and b0, b1 and b2 are fitting coefficients. If the yield reaches its maximum value, the slope of the CWPF goes through 0; consequently, the maximum water applied (Wmax) can be computed through differentiating Equation 6 and putting it equal to 0. Thus, the predicted maximum yield (Ymax) can be computed by replacing Wmax in Equation (6) as follows:
∂Y/∂W = +b1 + 2b2W = 0
Wmax = −b1/2b2
Ymax = b0 + b1Wmax + b2W2max
The crop response factor (Ky) is the relationship between deficit evapotranspiration [1—(actual evapotranspiration (ETa)/crop evapotranspiration (ETc))] and yield reduction [1—(actual yield (Ya)/maximum yield (Ym))], which is usually linear. The slope of this relation is called Ky. The relationship is shown in Equation (10) [8,32,33]:
1 Y a Y m = K y 1 E T a E T m
where, if Ky < 1, crops are tolerant to water stress. If Ky > 1, crops are sensitive to water stress [3,20].
The actual evapotranspiration (ETa) was determined using the following equations [20]:
ETa = Ks × ETm
where ETa represents the actual evapotranspiration (mm day−1), while Ks stands for water stress coefficient and ETm represents the maximum evapotranspiration (mm day−1).
The Ks is calculated by Equation (12) [20]:
K s = T A W D r T A W R A W = T A W D r 1 p T A W
where Dr stands for the root zone water depletion (mm) and the total available soil water in the root zone (mm) is expressed by TAW. The RAW in the equation represents the readily available water in the root zone (mm), whereas p is that fraction of TAW which the crop can take up from the root zone without experiencing stress (0.36, as given by Allen et al. [20]).
The TAW was calculated according to the following equation [20]:
TAW = 1000(θFC − θPWP) Zr
where θFC in this equation represents the amount of water at field capacity [0.1525 m3 m−3], while the amount of water at wilting point is expressed as θPWP [0.0383 cm3 cm−3], and Zr stands for the rooting depth [0.8 m].

2.3. Preparation of Biochar

The biochar was prepared using date palm fronds without leaflets. The fronds were dried by sunlight. After that, the fronds were cut into small parts less than 30 cm in length. The small parts were packed tightly into a stainless-steel cylinder biochar kiln. The biochar kiln was covered tightly to make an approximately oxygen-free environment. Pyrolysis was carried out at 400–450 °C. The prepared biochar was ground using an electrical grinder to reduce particle size, and sieved using a 2 mm screen. The prepared and sieved biochar was subjected to further physio-chemical and proximate analyses. Biochar proximate analyses were conducted as described by SMCAWC [34], and results are shown in Table 4. The electrical conductivity (EC) and pH of the biochar was analyzed in a 1:10 (w/v) biochar /water extract using pH and EC meter (Hanna, HI 9811-5, Bedfordshire, UK). The elemental composition, such as Hydrogen (H), nitrogen (N), and carbon (C) contents, were estimated using an elemental analyzer (Series II; PerkinElmer, Waltham, MA, USA).
In this study, the biochar was added and mixed to the surface layer of the soil and its application rate was constant at 4% (w/w) for all treatments. This rate was recommended by Alghamdi et al. [4,14].

2.4. Statistical Analyses

The data of different parameters, such as yield of tomato and crop productivity were acquired, and means were calculated. The means were compared statistically using analysis of variance (ANOVA) with the help of SAS 9.4 software (SAS Inc., Cary, NC, USA). The significant differences among the means were estimated using least significant difference test (LSD test) [35].

3. Results

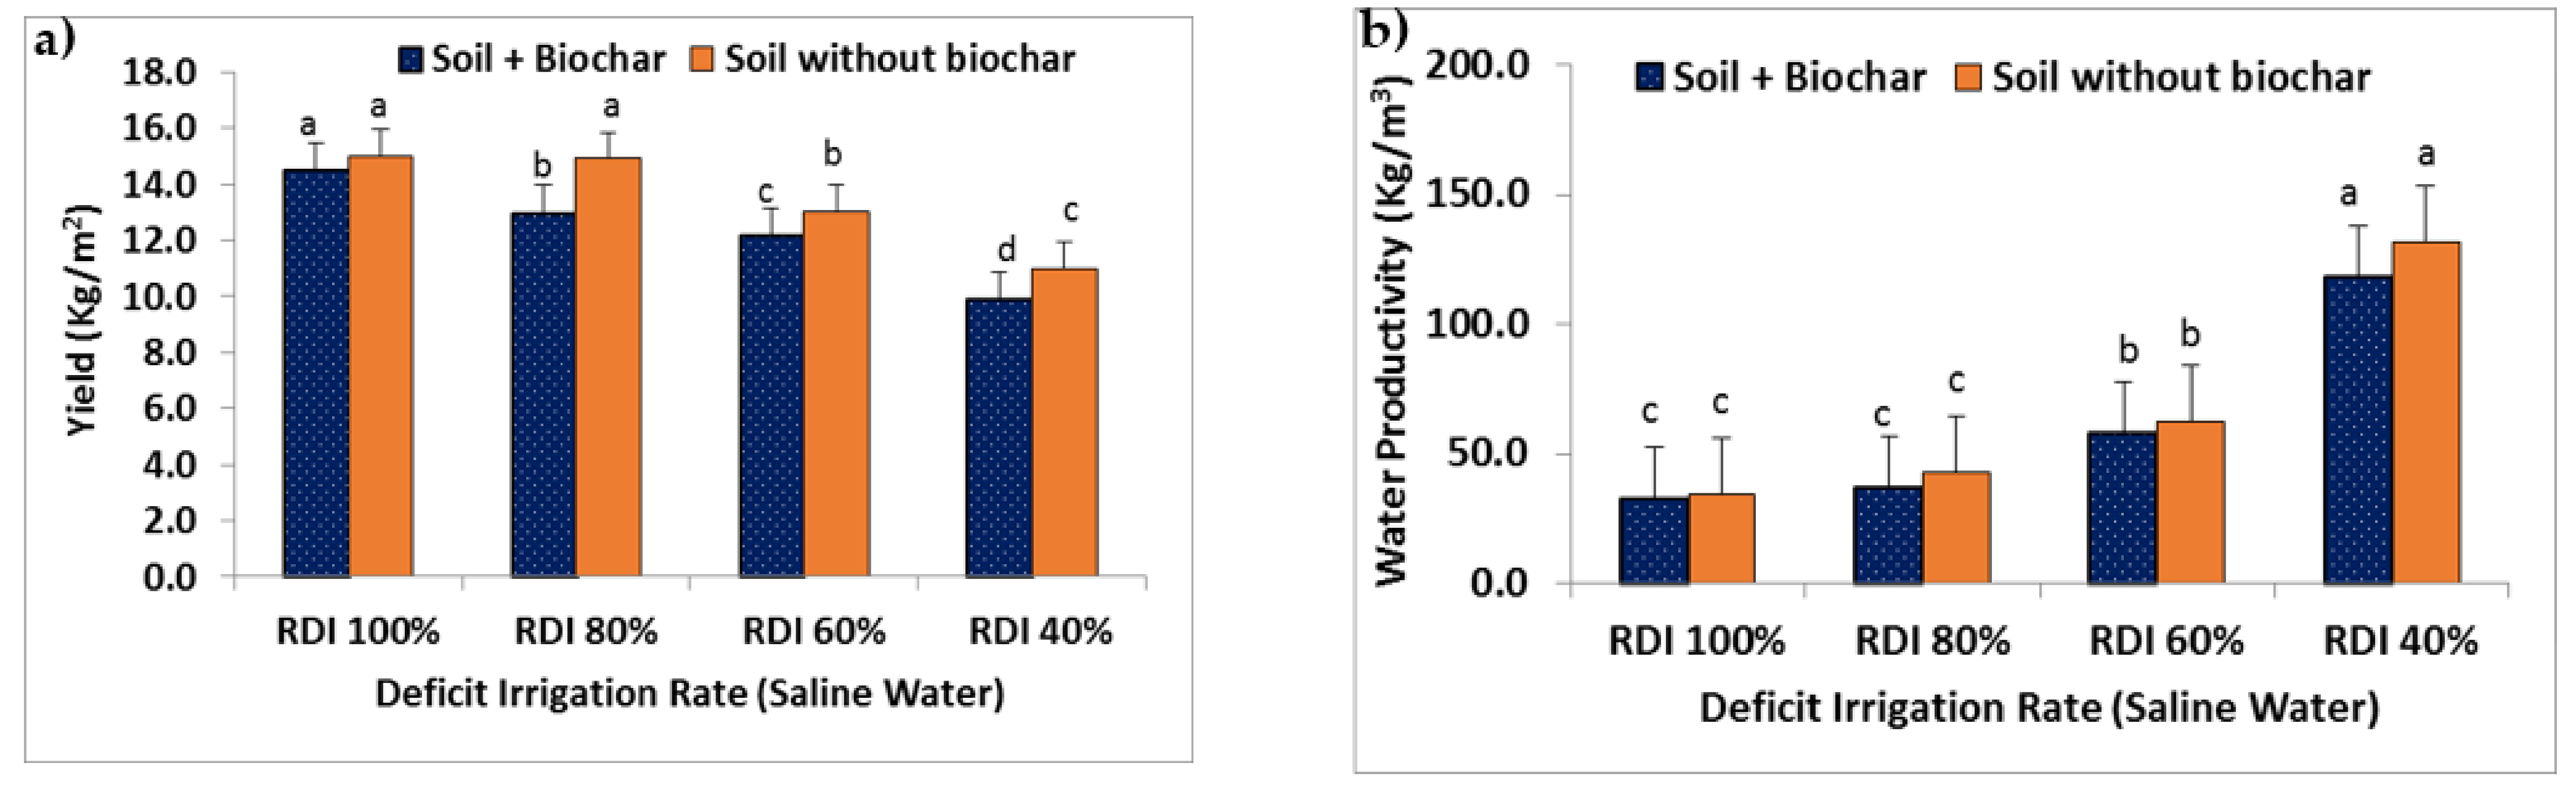
3.1. Regulated Deficit Irrigation (RDI)

3.1.1. Crop Water Productivity (CWP)

The crop water productivity of tomato crop was explored in this study. Decreasing amounts of irrigation water (to 40% ETc) resulted in a significantly high increase in water productivity. However, it decreased the final tomato yield (Table 5 and Figure 1, Figure 2 and Figure 3). Generally, the values of CWP increased with decreasing amounts of irrigation water. The maximum CWP value was 191 kg m−3 for RDI40 using fresh irrigation water; the lowest value was 33.3 kg m−3 for FI-B100 using saline irrigation water. Because biochar contains high amount of salts (7.8 dS m−1= 6240 mg L−1), it has a negative impact on the CWP and the final yield when either saline water is used for irrigation or the plant is subjected to water stress. This is due to the fact that irrigation with saline water and/or deficit irrigation led to an increase in soil salinity; consequently, there was a decrease in the CWP and final yield. However, an application of biochar with a full fresh water irrigation (FI100) resulted in a significant increase in final yield was recorded (Table 6). The results also showed that the application of biochar using saline water for irrigation led to a decrease in the CWP and the final tomato yield due to an increase in soil salinity. Furthermore, the high pH of the biochar may cause a decrease in nutrient availability to plants [36] (Table 5 and Figure 3).

3.1.2. Tomato Yield

The highest yield (20.0 kg m−3) was obtained with treatment FI100, which used fresh irrigation water, and the lowest yield (9.9 kg m−3) was with treatment RDI-B40, which used saline water (Table 6 and Figure 1, Figure 2 and Figure 3) [37]. Biochar significantly (p < 0.05) increased yield when fresh water was used with full irrigation (FI100); however, it decreased the yield when saline water and/or deficit irrigation were used due to its high salinity [3]. Furthermore, in the absence of biochar application, treatment RDI80 gave the same yield as FI100 for both saline and fresh irrigation water (Table 6).

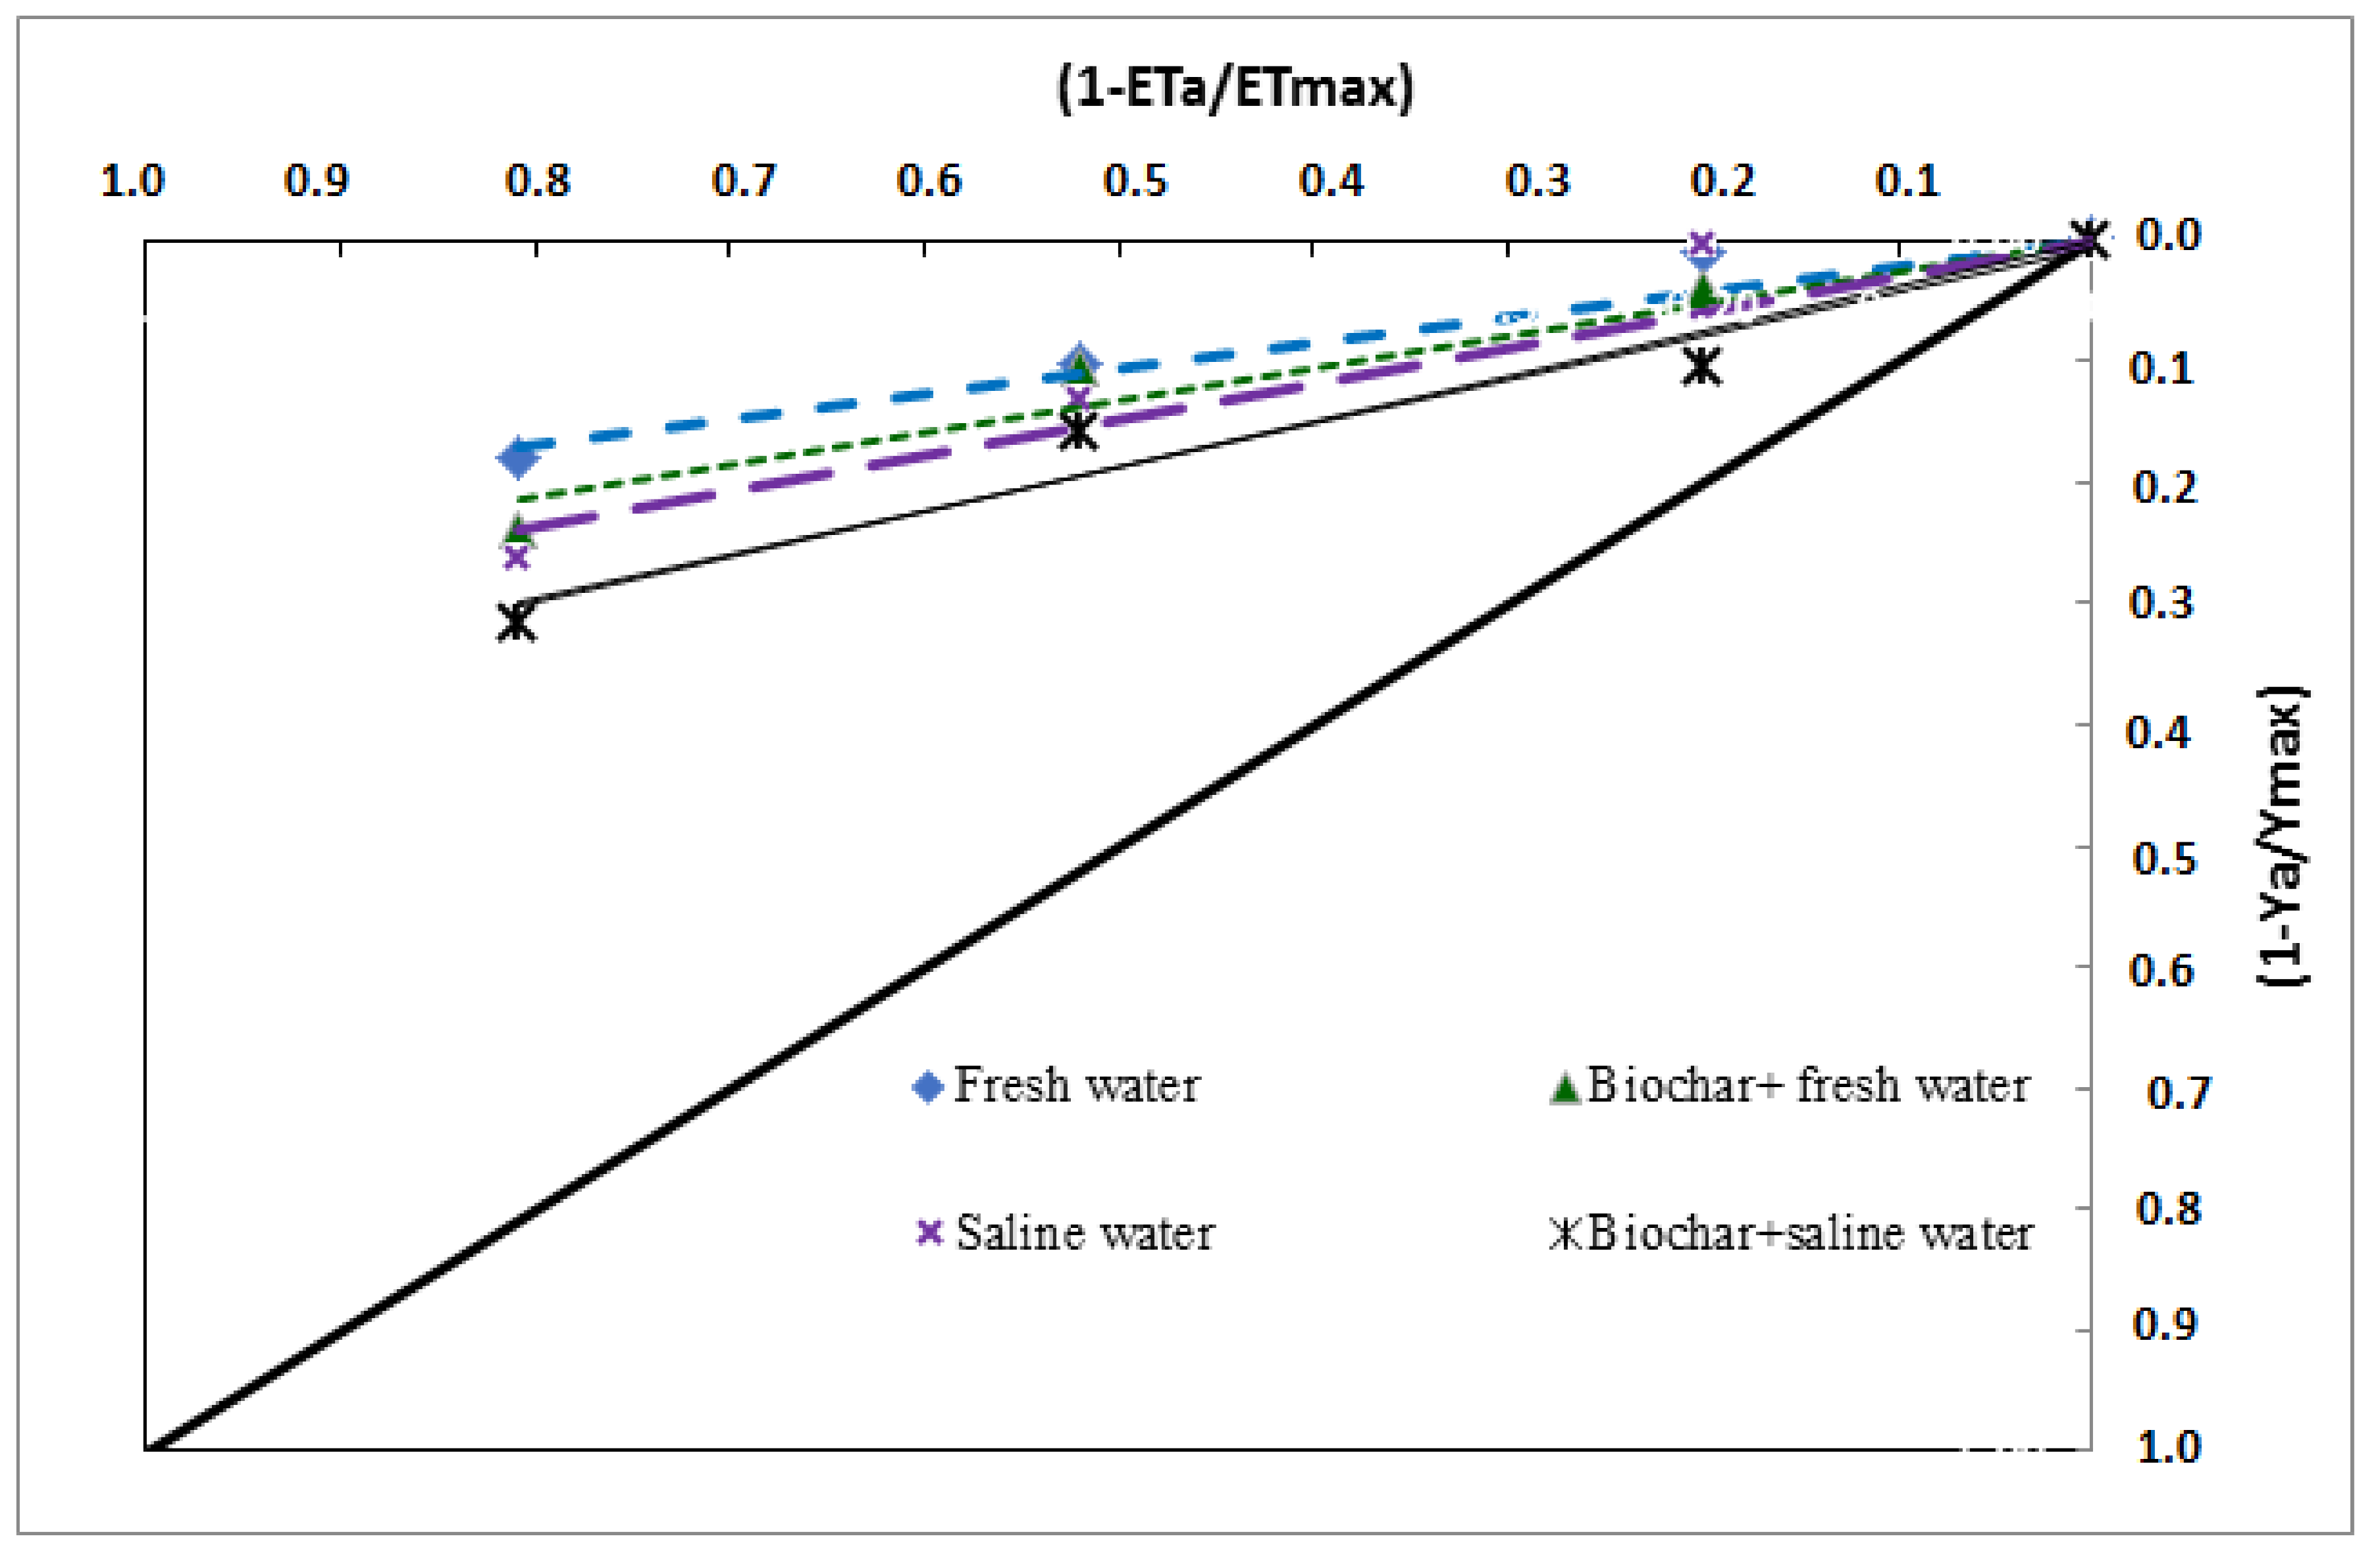
3.1.3. Crop Water Production Function (CWPF)

A polynomial function was observed to be suitable among the applied average values of the different treatments for the two seasons and the yield (Figure 1). The mathematical analysis showed the maximum predicted yields were 19.5, 20.0, 14.4, and 14.1 kg m−2, while the resultant contents of water applied were 391.7, 461.7, 426.7, and 860.0 mm for fresh water without biochar, saline water without biochar, fresh water with biochar, and saline water with biochar, respectively (Table 7).

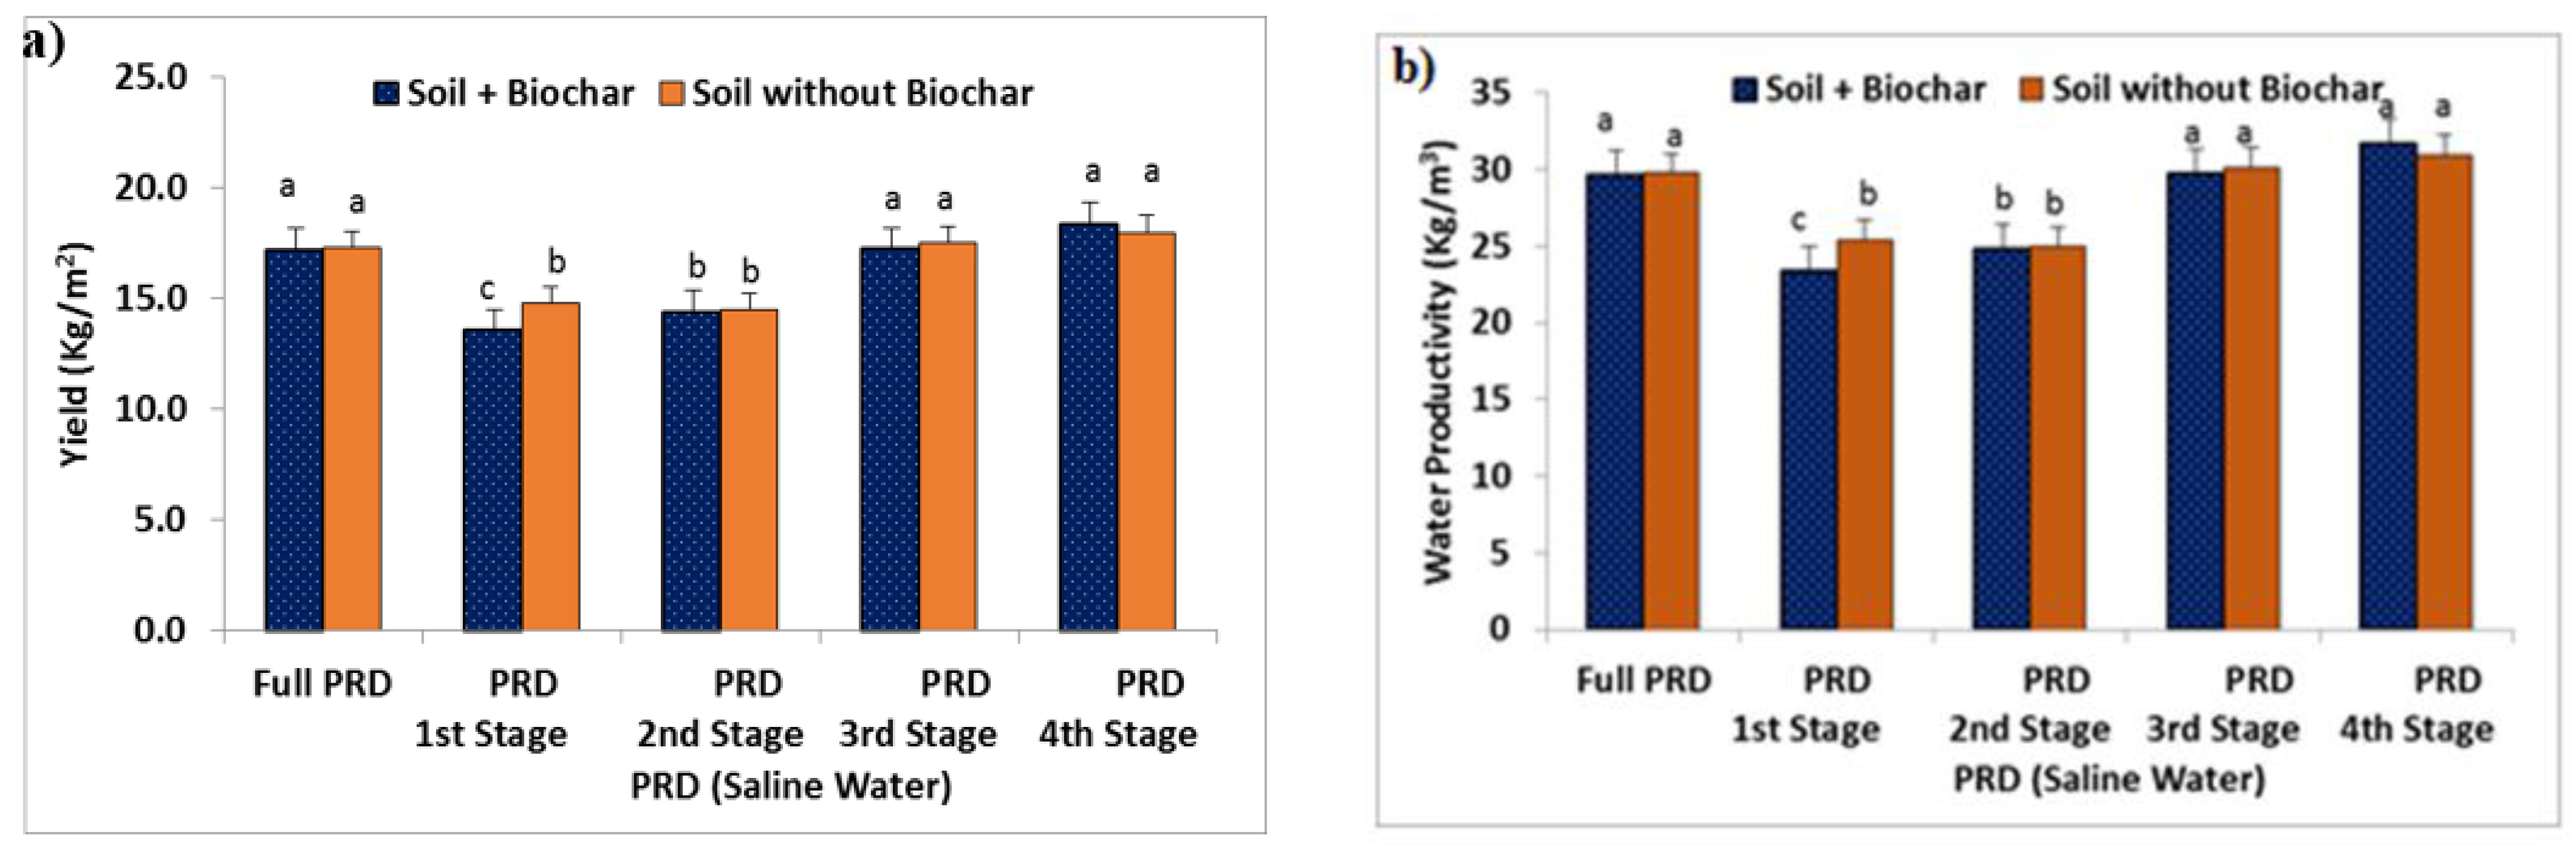
3.2. Partial Root Zone Drying Method (PRD) at Various Growth Stages

Figure 4 and Figure 5 revealed that the use of PRD at the first and second stages with biochar (PRD-B1 and PRD-B2) were the most sensitive stages for tomato when using the PRD irrigation method. The final yield was decreased, especially when saline water was used for irrigation. The yield decreased to 13.6 kg m−2 with the treatment PRD-B1 using saline water (Figure 5a). The application of PRD at the fourth stage led to a significant increase in the final yield when fresh or saline water was used. The yields were 20.6 and 20.4, and 18.4 and 18.0 kg m−2 for the PRD4 and PRD-B4 when using fresh and saline water, respectively. When PRD was adopted for all stages, the yields were 15.9 and 15.9, and 17.2 and 17.3 for PRDF and PRD-BF using fresh and saline water, respectively.

3.3. Crop Yield Response Factor (Ky)

The Ky was calculated for the RDI treatments to investigate the tolerance of tomatoes to water stress. The higher the value of Ky, the less tolerant to drought the tomato is [3,38]. Generally, Ky gives a linear relationship between consumed water and yield [8,21,39]. In this study, the Ky values of tomato irrigated with fresh water were 0.21 and 0.26 in the absence and presence of biochar, respectively. However, when tomato was irrigated with saline water, the Ky values increased and their values were 0.30 and 0.37 in the absence and presence of biochar, respectively (Figure 6 and Table 8) [40].

4. Discussion

This study found that increasing water stress for tomato plants led to a significant increase in CWP, yet reduced the final yield (Figure 1, Figure 2 and Figure 3). Furthermore, biochar has an undesirable effect on CWP and yield when used with deficit irrigation and saline water (Table 5 and Figure 3). Previously, various researchers have reported the similar findings [3,41,42,43]. There are several reasons for the increase in CWP with water stress. Some of them are as follows. The reduction in the applied water may result in an increment in the ratio of yield/consumption of water by decreasing the loss of water and increasing the biomass, preventing fertilizer loss, avoiding water logging with excess irrigation water, and reducing the spread of diseases [15,44,45].
This study also showed that irrigation using 80% ETc can be adopted for irrigating a tomato crop (Solanum lycopersicum) instead of using full irrigation, and, thus, 20% of the irrigation water can be conserved (Table 6). Previously, Alomran et al. [3] reported similar findings using cucumber crop. However, Hendy et al. [46] found a slight decrease in tomato yield (Lycopersicum esculentum) with 80% ETc compared to 100% Etc.
The water required to obtain maximum tomato yield was increased by 101.6% when biochar was applied using saline water compared to irrigation with saline water without biochar application due to high biochar salinity (Table 7). Previously, various researchers have shown a similar trend [3,47,48]. Furthermore, Trifunovic et al. [49] said that biochar application could decrease the soil pore size of soil and this may decrease the salt leaching efficiency of the soil.
Nonetheless, Jiang et al. [50] reported that the RDI improved the quality of tomato fruit, since it led to an increase in the concentration of soluble sugar, total soluble solids, and vitamin C; however, it decreased the lycopene and organic acids. Furthermore, Agius et al. [51] stated that salinity improves the quality of cherry tomato fruits.
In the fourth stage, PRD application resulted in a significant increase in the tomato yield compared to the other application stages (Figure 4 and Figure 5). These results are due to the fact that most of the crops are tolerant to salt at germination; however, they are sensitive to osmotic effects at the stages of emergence and development [1,52]. The CWP with the PRD are directly related to yield, because the amount of applied water is constant in the PRD study and the treatments differed only in time of application of PRD [3].
Under the conditions of these experiments, the Ky values of tomato revealed that the tomato can be classified as a crop that is tolerant to water shortage (Figure 6). These results are in agreement with the finding of Patanè et al. [53], who found two values of Ky, i.e., 0.728 and 0.309, for the two tomato cultivars ‘Solerosso‘ and ‘Season‘, respectively. Allen et al. [20], Etissa et al. [22], and Giardini et al. [40] found different Ky values for tomato cultivars, i.e., 1.05 and 0.99. It can be concluded that determining Ky values could be a good approach when investigating different crops varieties for water stress tolerance.

5. Conclusions

The effects of regulated deficit irrigation (RDI) and partial root zone drying irrigation (PRD) on crop water response factor (Ky), crop water productivity (CWP), water productivity (WP), and tomato yield were investigated using biochar and saline water. The results showed that the irrigation with 40% ETc led to a significant increase in CWP; yet, it decreased the final yield. A negative impact of the biochar on CWP and final yield was recorded when saline water was used for irrigation or adopting deficit irrigation. Nevertheless, the biochar increased the final tomato yield when fresh water at the full irrigation rate (FI100) was used. The highest tomato yield, 20.0 kg m−2, and lowest yield, 9.9 kg m−2, were obtained for FI100 using fresh irrigation water and RDI-B40 using saline irrigation water, respectively.
It was noticed that, with no biochar treatment, the RDI80 gave a same yield of FI100 for the two types of irrigation water used. Therefore, this study recommends using 80% ETc irrigation deficit for tomato plants under greenhouse conditions in arid environments. This can conserve water without a reduction in yield. The CWPF analysis concluded that biochar application led to a significant increase in the amount of irrigation water required to obtain the maximum yield, especially when using saline water. This is due to the fact that more water is needed with highly saline biochar treatments to leach salts from the plant rhizosphere.
This study also recommends the application of the PRD irrigation method at the fourth stage; however, its application should be avoided in the first and second stages. The tomato plant was found to be sensitive to the PRD at the first and second growth stages; on the other hand, its application in the fourth stage led to a significant increase in the final yield. The Ky calculation revealed that the tomato crop (Solanum lycopersicum) can be classified as a crop that is tolerant to water stress under the experimental conditions.

Author Contributions

Conceptualization, A.G.A., A.A.A. and A.M.A.-O. methodology, A.G.A., A.A.A., A.M.A.-O., I.I.L. and A.A.; software, A.G.A. and A.A.A.; validation, A.G.A., A.A.A. and A.M.A.-O.; formal analysis A.G.A., A.A.A. and A.M.A.-O. and A.A.; investigation, A.G.A., A.A.A., A.M.A.-O. and A.A.; resources, A.G.A. and A.A.A.; data curation, A.G.A., A.A.A. and A.M.A.-O.; writing—original draft preparation, A.G.A. and A.A.A.; writing—review and editing, A.G.A. and A.A.A.; visualization, A.G.A., A.A.A. and A.M.A.-O.; supervision, A.G.A., A.A.A. and A.M.A.-O.; funding acquisition, A.G.A. All authors have read and agreed to the published version of the manuscript.

Funding

This project was funded by the National Plan for Science, Technology and Innovation (MAARIFAH), King Abdulaziz City for Science and Technology, Kingdom of Saudi Arabia, Award Number (15-AGR4704-02).

Acknowledgments

The authors would like to thank the National Plan for Science, Technology and Innovation (MAARIFAH), King Abdulaziz City for Science and Technology, Kingdom of Saudi Arabia, Award Number (15-AGR4704-02) for supporting this work.

Conflicts of Interest

The authors declare no conflict of interest.

References

  1. Alghamdi, A.G.; Aly, A.A.; Majrashi, M.A.; Ibrahim, H.M. Impact of climate change on hydrochemical properties and quality of groundwater for domestic and irrigation purposes in arid environment: A case study of Al Baha region, Saudi Arabia. Environ. Earth Sci. 2023, 82, 39. [Google Scholar] [CrossRef]
  2. Al-Omran, A.M.; Al-Harbi, A.R.; Wahb-Allah, M.A.; Nadeem, M.; Eleter, A. Impact of irrigation water quality, irrigation systems, irrigation rates and soil amendments on tomato production in sandy calcareous soil. Turk. J. Agric. For. 2010, 34, 59–73. [Google Scholar] [CrossRef]
  3. Alomran, M.; Louki, I.I.; Aly, A.A.; Nadeem, M.E. Impact of Deficit Irrigation on Soil Salinity and Cucumber Yield under greenhouse condition in arid environment. J. Agric. Sci. Technol. 2013, 15, 1247–1259. [Google Scholar]
  4. Alghamdi, A.G.; Aly, A.A.; Ibrahim, H.M. Effect of Climate Change on the Quality of Soil, Groundwater, and Pomegranate Fruit Production in Al-Baha Region, Saudi Arabia: A Modeling Study Using SALTMED. Sustainability 2022, 14, 13275. [Google Scholar] [CrossRef]
  5. Costa, J.M.; Ortuno, M.F.; Chaves, M.M. Deficit irrigation as a strategy to save water: Physiology and potential application to horticulture. J. Integr. Plant Biol. 2007, 49, 1421–1434. [Google Scholar] [CrossRef]
  6. Alghamdi, A.G.; Al-Omran, A.; Alkhasha, A.; Alasmary, Z.; Aly, A.A. Significance of Pyrolytic Temperature, Particle Size, and Application Rate of Biochar in Improving Hydro-Physical Properties of Calcareous Sandy Soil. Agriculture 2021, 11, 1293. [Google Scholar] [CrossRef]
  7. Alghamdi, A.G.; Aljohani, B.H.; Aly, A.A. Impacts of Olive Waste-derived Biochar on Hydro-Physical Properties of Sandy Soil. Sustainability 2021, 13, 5493. [Google Scholar] [CrossRef]
  8. Kirda, C.; Cetin, M.; Dasgan, Y.; Topcu, S.; Kaman, H.; Ekici, B.; Derici, M.R.; Ozguven, A.I. Yield response of greenhouse grown tomato to partial root drying and conventional deficit irrigation. Agric. Water Manag. 2004, 69, 191–201. [Google Scholar] [CrossRef]
  9. Patanè, C.; Cosentino, S.L. Effects of soil water deficit on yield and quality of processing tomato under a Mediterranean climate. Agric. Water Manag. 2009, 97, 131–138. [Google Scholar] [CrossRef]
  10. Topcu, S.; Kirda, C.; Dasgan, Y.; Kaman, H.; Cetin, M.; Yazici, A.; Bacon, M.A. Yield response and N-fertiliser recovery of tomato grown under deficit irrigation. Eur. J. Agron. 2007, 26, 64–70. [Google Scholar] [CrossRef]
  11. Sepaskhah, A.R.; Ahmadi, S.H. A review on partial rootzone drying irrigation. Int. J. Plant Prod. 2012, 4, 241–258. [Google Scholar]
  12. Akhtar, S.S.; Li, G.; Andersen, M.N.; Liu, F. Biochar enhances yield and quality of tomato under reduced irrigation. Agric. Water Manag. 2014, 138, 37–44. [Google Scholar] [CrossRef]
  13. Zegbe-Domìnguez, J.A.; Behboudian, M.H.; Lang, A.; Clothier, B.E. Deficit irrigation and partial rootzone drying maintain fruit dry mass and enhance fruit quality in ‘Petopride’ processing tomato (Lycopersicon esculentum Mill.). Sci. Hortic. 2003, 98, 505–510. [Google Scholar] [CrossRef]
  14. Alghamdi, A.G.; Al-Omran, A.; Alkhasha, A.; Alharbi, A.R. Impacts of Biochar on Hydro-Physical Properties of Sandy Soil under Different Irrigation Regimes for Enhanced Tomato Growth. Agronomy 2022, 12, 1762. [Google Scholar] [CrossRef]
  15. Pereira, L.S.; Oweis, T.; Zairi, A. Irrigation management under water scarcity. Agric. Water Manag. 2002, 57, 175–206. [Google Scholar] [CrossRef]
  16. Potop, V. Assessment of Water Deficit and Surplus during Growing Period of Vegetable Crops in Polabi. Skaln. Mlyn 2011, 2, 4.2. Available online: http://www.cbks.cz/SbornikSMlyn11/Potop2.pdf (accessed on 2 April 2023).
  17. Amer, K.H.; Sally, A.M.; Jerry, L.H. Effect of Deficit Irrigation and Fertilization on Cucumber. Agron. J. 2009, 101, 1556–1564. [Google Scholar] [CrossRef] [Green Version]
  18. Kirda, C. Deficit irrigation scheduling based on plant growth stages showing water stress tolerance. In Deficit Irrigation Practices; Kirda, C., Moutonnet, P., Hera, C., Nielsen, D.R., Eds.; Water Report #22; FAO: Rome, Italy, 2000. [Google Scholar]
  19. Ayas, S.; Demirta, C. Deficit irrigation effects on onion (Allium cepa L. E.T. Grano 502) yield in unheated greenhouse condition. J. Food Agric. Environ. 2009, 7, 239–243. [Google Scholar]
  20. Allen, R.G.; Pereira, L.S.; Raes, D.; Smith, M. Crop Evapotranspiration—Guidelines for Computing Crop Water Requirements—Part C—Crop Evapotranspiration under Non-Standard Conditions, Chapter 8—ETc under Soil Water Stress Conditions. FAO—Food and Agriculture Organization of the United Nations. Irrigation and Drainage Paper 56. Rome. 1998. Available online: https://www.fao.org/3/x0490e/x0490e0e.htm (accessed on 20 March 2023).
  21. Lovelli, S.; Perniola, M.; Ferrara, A.; Tammaso, T.D. Yield response factor to water (Ky) and water use effeicincy of Carthamus tinctorius L. and Solaum melongeual. Agric. Water Manag. 2007, 92, 73–80. [Google Scholar] [CrossRef]
  22. Etissa, E. Estimation of Yield Response (Ky) and Validation of CropWat for Tomato under Different Irrigation Regimes. Ethiop. J. Crop Sci. 2017, 5, 103–115. [Google Scholar]
  23. Sparks, D.L. Methods of Soil Analysis; Soil Society of American, ASA: Madison, WI, USA, 1996. [Google Scholar]
  24. Simsek, M.; Tonkaz, T.; Kacira, M.; Comlekcioglu, N.; Dogan, Z. The Effects of Different Irrigation Regimes on Cucumber (Cucumbis sativus L.) Yield and Yield Characteristics under Open Field Conditions. Agric. Water Manag. 2005, 73, 173–191. [Google Scholar] [CrossRef]
  25. Mahajan, G.; Singh, K.G. Response of Greenhouse tomato to irrigation and fertigation. Agric. Water Manag. 2006, 84, 202–206. [Google Scholar] [CrossRef]
  26. Harmanto, V.; Babel, M.S.; Tantau, H.J. Water Requirement of Drip Irrigated Tomatoes Grown in Greenhouse in Tropical Environment. Agric. Water Manag. 2004, 71, 225–242. [Google Scholar] [CrossRef]
  27. Cuenca, R.H. Irrigation System Design: An Engineering Approach; Prentice Hall, Inc.: Englewood Cliffs, NJ, USA, 1989. [Google Scholar]
  28. Ayers, R.S.; Westcot, D.W. Water Quality for Agriculture; FAO Irrigation and Drainage Paper, No. 29; FAO: Rome, Italy, 1985. [Google Scholar]
  29. Kijne, J.W.; Barker, R.; Molden, D. Improving water productivity in agriculture: Editor’s overview. In Water Productivity in Agriculture: Limits and Opportunities for Improvement; Kijne, J.W., Barker, R.M.D., Eds.; International Water Management Institute: Colombo, Sri Lanka, 2003; pp. xi–xix. [Google Scholar]
  30. Letseku, V.; Grové, B. Crop Water Productivity, Applied Water Productivity and Economic Decision Making. Water 2022, 14, 1598. [Google Scholar] [CrossRef]
  31. Helweg, O.J. Functions of crop yield from applied water. Agron. J. 1991, 83, 769–773. [Google Scholar] [CrossRef]
  32. Doorenbos, J.; Kassam, A.H. Yield Response to Water; FAO Irrigation and Drainage Paper No. 33; FAO: Rome, Italy, 1986; p. 193. [Google Scholar]
  33. Moutonnet, P. Yield Response to Field Crops to Deficit Irrigation. In Deficit Irrigation Practices; Kirda, C., Moutonnet, P., Hera, C., Nielsen, D.R., Eds.; Water Report #22; FAO: Rome, Italy, 2000. [Google Scholar]
  34. ASTM D1762-84; Standard Methods for Chemical Analysis of Wood Charcoal (SMCAWC). American Society for Testing and Materials (ASTM): Philadelphia, PA, USA, 1989.
  35. Sendecor, G.W.; Cohran, W.G. Statistical Method, 7th ed.; The Iowa State University Press: Ames, IA, USA, 1980. [Google Scholar]
  36. Prasad, M.; Chrysargyris, A.; McDaniel, N.; Kavanagh, A.; Gruda, N.S.; Tzortzakis, N. Plant Nutrient Availability and pH of Biochars and Their Fractions, with the Possible Use as a Component in a Growing Media. Agronomy 2020, 10, 10. [Google Scholar] [CrossRef] [Green Version]
  37. Mao, X.; Liu, M.; Wang, X.; Hou, C.Z.; Shi, J. Effects of deficit irrigation on yield and water use of greenhouse grown cucumber in the North China Plain. Agric. Water Manag. 2003, 61, 219–228. [Google Scholar] [CrossRef]
  38. Studento, P.; Hsiao, T.C.; Fereres, E.; Raes, D. Crop Yield Response to Water; FAO: Rome, Italy, 2012. [Google Scholar]
  39. Giannakoula, A.E.; Ilias, I.F. The effect of water stress and salinity on growth and physiology of tomato (Lycopersicon esculentum mill). Arch. Biol. Sci. 2013, 65, 611–620. [Google Scholar] [CrossRef]
  40. Giardini, L.; Giovanardi, R.; Borin, M. Water consumption and yield response of tomato in relation to water availability at different soil depths. Acta Hortic. 1988, 228, 119–126. [Google Scholar] [CrossRef]
  41. Ali, M.A.; Hoque, M.R.; Hassan, A.A.; Khair, A. Effects of deficit irrigation on yield, water productivity, and economic. Agric. Water Manag. 2007, 92, 151–161. [Google Scholar] [CrossRef]
  42. Oweis, T.; Hachum, A. Water harvesting and supplemental irrigation for improved water productivity of dry farming system in west Asia and North Africa. In Proceedings of the 4th International Crop Science Congress on the Theme “Crop Science for Diversified Planet”, Brisbane, Australia, 26 September–1 October 2004. [Google Scholar]
  43. Zhang, Y.; Kendy, E.; Qiang, Y.; Changming, L.; Yanjun, S.; Hongyong, S. Effect of soil water deficit on evapotranspiration, crop yield, and water use efficiency in the North China Plain. Agric. Water Manag. 2004, 64, 107–122. [Google Scholar] [CrossRef]
  44. Geerts, S.; Raes, D. Deficit irrigation as an on-farm strategy to maximize crop water productivity in dry areas. Agric. Water Manag. 2009, 96, 1275–1284. [Google Scholar] [CrossRef] [Green Version]
  45. Steduto, P.; Albrizio, R. Resource use efficiency of field-grown sunflower, sorghum, wheat and chickpea. II. Water use efficiency and comparison with radiation use efficiency. Agric. For. Meteorol. 2005, 130, 269–281. [Google Scholar] [CrossRef]
  46. Hendy, Z.M.; Attaher, S.M.; Abdelhady, S.A.; Abdel-Aziz, A.A.; El-Gindy, A.M. Simulation of the effect of deficit irrigation schemes on tomato crop production using aquacrop model. Misr J. Agric. Eng. 2019, 36, 175–194. [Google Scholar] [CrossRef]
  47. Al-Harbi, A.R.; Al-Omran, A.M.; El-Adgham, F.I. Effect of drip Irrigation Levels and Emitters Depth on (Abelmoschus esculentus) Growth. J. Appl. Sci. 2008, 8, 2764–2769. [Google Scholar] [CrossRef] [Green Version]
  48. Zhang, H.; Oweis, T. Water-yield relations and optimal irrigation scheduling of wheat in the Mediterranean region. Agric. Water Manag. 1999, 38, 195–211. [Google Scholar] [CrossRef]
  49. Trifunovic, B.; Gonzales, H.B.; Ravi, S.; Sharratt, B.S.; Mohanty, S.K. Dynamic effects of biochar concentration and particle size on hydraulic properties of sand. Land Degrad. Dev. 2018, 29, 884–893. [Google Scholar]
  50. Jiang, X.; Zhao, Y.; Tong, L.; Wang, R.; Zhao, S. Quantitative Analysis of Tomato Yield and Comprehensive Fruit Quality in Response to Deficit Irrigation at Different Growth Stages. HortScience 2019, 54, 1409–1417. [Google Scholar] [CrossRef] [Green Version]
  51. Agius, C.; von Tucher, S.; Rozhon, W. The Effect of Salinity on Fruit Quality and Yield of Cherry Tomatoes. Horticulturae 2022, 8, 59. [Google Scholar] [CrossRef]
  52. Lauchli, A.; Grattan, S.R. Plant growth and development under salinity stress. In Advances in Molecular Breeding toward Drought and Salt Tolerant Crops; Jenks, M.A., Hasegawa, P.M., Jain, S.M., Eds.; Springer: Berlin/Heidelberg, Germany, 2007; pp. 1–32. [Google Scholar]
  53. Patanè, C.; Alessandra, P.; Sortino, O.; Saita, A. Water Productivity and Yield Response Factor in Two Cultivars of Processing Tomato as Affected by Deficit Irrigation under Semi-Arid Climate Conditions. Acta Hortic. 2014, 1038, 454–459. [Google Scholar] [CrossRef]
Figure 1. The relationship between average marketable total tomato yield and applied water (average of two seasons).
Water 15 02797 g001
Figure 2. Effect of RDI irrigation on (a) tomato yield and (b) crop water productivity using fresh irrigation water. (All treatments in same figure marked with the same letters are not significant using LSD Test at 0.05 level).
Water 15 02797 g002
Figure 3. Effect of RDI irrigation on (a) tomato yield and (b) crop water productivity using saline irrigation water. (Treatments with the same alphabetical letters represent no significant difference by using LSD at 0.05 level).
Water 15 02797 g003
Figure 4. Changes in tomato yields under the partial root zone drying irrigation systems on (a) tomato yield and (b) crop water productivity when applied at different growth stages using fresh water. (Treatments with the same alphabetical letters represent no significant difference by using LSD at 0.05 level).
Water 15 02797 g004
Figure 5. The impacts of partial root zone drying irrigation method on (a) tomato yield and (b) crop water productivity when applied at different growth stages using saline water. (Treatments with the same alphabetical letters represent no significant difference by using LSD at 0.05 level).
Water 15 02797 g005
Figure 6. Changes in the tomato yield as a result of any change in the evapotranspiration rate.
Water 15 02797 g006
Table 1. Soil texture and chemical properties of soil and irrigation water.
pHEC (dS m−1)SAR *Soil Texture
Fresh Water7.10.94.0-
Saline Water7.53.620.1-
Soil (0–20 cm)7.52.80.78Loamy sand
Note(s): * SAR (sodium adsorption ratio) = [Na+]/(([Ca++] + [Mg++])/2)1/2, where all cations concentrations are expressed in milliequivalents/liter.
Table 2. Application time of PRD at different stages.
Tomato’s StagesDays from Germination
1st StageInitial stage35
2nd StageGrowth and development stage45
3rd StageMid-season stage70
4th StageLate stage100
Table 3. Description of treatments and abbreviations used in this study.
TreatmentsDescription
FI100Full irrigation used where 100% ETc was adopted using fresh or saline water without biochar application
FI-B100Full irrigation used where 100% ETc was adopted using fresh or saline water with biochar application
RDI80Regulated deficit irrigation used where 80% ETc was adopted using fresh or saline water without biochar application
RDI-B80Regulated deficit irrigation used where 80% ETc was adopted using fresh or saline water with biochar application
RDI60Regulated deficit irrigation used where 60% ETc was adopted using fresh or saline water without biochar application
RDI-B60Regulated deficit irrigation used where 60% ETc was adopted using fresh or saline water with biochar application
RDI40Regulated deficit irrigation used where 40% ETc was adopted using fresh or saline water without biochar application
RDI-B40Regulated deficit irrigation used where 40% ETc was adopted using fresh or saline water with biochar application
PRDFPartial root zone drying method was adopted over all the experimental period using fresh or saline water without biochar application
PRD-BFPartial root zone drying method was adopted over all the experimental period using fresh or saline water with biochar application
PRD1Partial root zone drying method was adopted at 1st stage of plant germination using fresh or saline water without biochar application
PRD-B1Partial root zone drying method was adopted at 1st stage after plant germination using fresh or saline water with biochar application
PRD2Partial root zone drying method was adopted at 2nd stage after plant germination using fresh or saline water without biochar application
PRD-B2Partial root zone drying method was adopted at 2nd stage after plant germination using fresh or saline water with biochar application
PRD3Partial root zone drying method was adopted at 3rd stage after plant germination using fresh or saline water without biochar application
PRD-B3Partial root zone drying method was adopted at 3rd stage after plant germination using fresh or saline water with biochar application
PRD4Partial root zone drying method was adopted at 4th stage after plant germination using fresh or saline water without biochar application
PRD-B4Partial root zone drying method was adopted at 4th stage after plant germination using fresh or saline water with biochar application
Table 4. Chemical analysis of biochar used in this study.
pHEC (1:10)CHNKCa
(dS m−1)%
8.97.8603.40.20.95.6
Table 5. Crop water productivity (kg m−3) using saline and fresh water in the presence and absence of the biochar (two seasons’ average).
Saline Irrigation WaterFresh Irrigation Water
Soil with BiocharSoil without BiocharSoil with BiocharSoil without Biochar
FI10033.3 d *34.4 d45.9 c33.3 d
RDI8037.3 c42.8 c55.3 c55.3 c
RDI6058.4 b62.2 b85.6 b83.6 b
RDI40118.4 a131.6 a182.4 a191.0 a
Note(s): * Treatments with the same alphabetical letters represent no significant difference by using LSD at 0.05 level.
Table 6. Tomato yield (kg m−3) using saline and fresh water in the presence and absence of the biochar (two seasons’ average).
Saline Irrigation WaterFresh Irrigation Water
Soil with BiocharSoil without BiocharSoil with BiocharSoil without Biochar
FI10014.5 a15.0 a20.0 a18.9 a
RDI8013.0 b14.9 a19.3 b19.3 a
RDI6012.2 c13.0 b17.9 c17.5 b
RDI409.9 d11.0 c15.3 d16.0 c
Note(s): Treatments with the same alphabetical letters represent no significant difference by using LSD at 0.05 level.
Table 7. The impacts of applied irrigation water on the Tomato water production traits.
TreatmentIrrigation WaterCrop Water Production FunctionR2Maximum Yield
(kg m−2)
Applied Water
(mm)
WP (kg m−2)
ControlFreshYield = −3 × 10⁻⁵ (AW)2 + 0.0235 (AW) + 14.0910.958319.5391.749.78
BiocharYield = −3 × 10⁻⁵ (AW)2 + 0.0277 (AW) + 13.1770.99620.0461.750.04
ControlSalineYield = −3 × 10⁻⁵ (AW)2 + 0.0256 (AW) + 8.98570.99114.4426.736.76
BiocharYield = −1 × 10⁻⁵ (AW)2 + 0.0172 (AW) + 8.65410.96314.1860.036.00
Table 8. Crop response factor of tomato in the presence of biochar using fresh and saline water.
TreatmentIrrigation WaterKyR2
ControlFresh0.21130.9525
Biochar0.26410.9448
ControlSaline0.2970.9172
Biochar0.37320.9557
Disclaimer/Publisher’s Note: The statements, opinions and data contained in all publications are solely those of the individual author(s) and contributor(s) and not of MDPI and/or the editor(s). MDPI and/or the editor(s) disclaim responsibility for any injury to people or property resulting from any ideas, methods, instructions or products referred to in the content.

