
Quantifying the Impact of Organic Fertilizers on Soil Quality under Varied Irrigation Water Sources
by
 ,
,
Shudong Lin
,
Qingyuan Lei
,
Yun Liu
,
Yimei Zhao
,
Lijun Su
,
Quanjiu Wang
*,
Wanghai Tao
* and
Mingjiang Deng
State Key Laboratory of Eco-Hydraulics in Northwest Arid Region, Xi’an University of Technology, Xi’an 710048, China
*
Authors to whom correspondence should be addressed.
Water 2023, 15(20), 3618; https://doi.org/10.3390/w15203618
Submission received: 30 August 2023
/
Revised: 4 October 2023
/
Accepted: 13 October 2023
/
Published: 16 October 2023
(This article belongs to the Special Issue Sustainable Management of Agricultural Water)
Abstract
:The issues of limited water availability and excessive fertilizer utilization, both of which negatively impact soil health and crop productivity, are key focal points in the pursuit of sustainable agricultural progress. Given these crucial obstacles, it is crucial to utilize accurate methods of irrigation and fertilization in order to improve the condition of the soil and promote the progress of sustainable farming. The objective of this research is to determine the optimal indicators for creating a minimal data set (MDS) that can assess the influence of organic fertilizers on the quality of pakchoi soil in varying irrigation water sources. Principal component analysis and norm values were utilized to create the MDS, and its accuracy was confirmed by examining coefficients of Nash efficiency and relative deviation. The results of our study showed that there was not much difference in soil bulk density (BD), but there was moderate variation in soil water content (SWC), soil salt content (SSC), alkali-hydrolyzed nitrogen (AN), available phosphorus (AP), available potassium (AK), and organic matter (OM). The selected MDS indicators included BD, AN, and OM. The soil quality index (SQI) achieved a high R2 value of 0.952, indicating a strong correlation. Furthermore, the nonlinear evaluation model showed a high level of effectiveness and efficiency, with Ef and Er values of 0.899 and 0.046, respectively. The effectiveness of this model in evaluating soil quality under different irrigation water conditions is evident. Notably, treatments involving magnetized–ionized brackish water (average SQI = 0.524) and the application of 20 kg/ha organic fertilizer (average SQI = 0.719) demonstrate the capacity to enhance soil quality. The present study presents a pragmatic, productive, and economical quantitative evaluation approach that can be used for worldwide vegetable farming with the utilization of clean water, saline water, magnetized–ionized saline water, and organic manure. Thus, we encourage vegetable growers to consider adopting both magnetized–ionized brackish water and organic fertilizers, and the utilization of the nonlinear soil quality index evaluation model is recommended as it offers a sensitive and effective approach to assessing soil quality across various irrigation and organic fertilizer schemes.
1. Introduction
Soil is an invaluable resource as it plays a crucial part in the formation and historical importance of terrestrial life [1]. The health and development of animals and plants are sustained by its vital function in supplying nutrients and water, and promoting plant growth and productivity [2].
The fertility of soil is intricately linked to food security, the welfare of individuals, and the sustainable advancement of the ecological ecosystem. It encompasses the comprehensive capabilities of soil, including its capacity to maintain productive potential, preserve environmental integrity, and enhance the health of plants and animals. As a delicate gauge, it reveals alterations in soil conditions and the implementation of management techniques. A thorough evaluation requires taking into account physical, chemical, and biological attributes [2,3]. Soil environments are complex and diverse due to the heterogeneity and variability of soil properties across different regions and land use practices. Balancing the need for comprehensive evaluation without being overly time-consuming or labor-intensive poses a challenge in soil quality assessment [4,5,6]. Furthermore, the presence of pesticides and fertilizers complicates the evaluation process. The versatility, simplicity, and alignment with soil management practices have made the soil quality index (SQI) popular in addressing these challenges [1]. Consequently, the SQI has been successfully employed in soil quality assessment at various scales and locations. Over the past few years, there has been significant research conducted, both nationally and globally, to extensively investigate the evaluation of soil quality using diverse approaches. The methods used to calculate the SQI [7,8] involve the application of techniques such as principal component analysis (PCA) in conjunction with norm values to determine a minimum data set (MDS). The MDS method fulfills the objective of choosing indicators and tracking modifications in soil quality caused by changes in land utilization, farming methods, fertilization techniques, and planting arrangements. This approach not only enhances evaluation efficiency but also minimizes subjective biases. Numerous studies have illustrated the effectiveness of the MDS approach in soil quality assessments [9,10,11].
Global water scarcity presents a significant challenge to sustainable development, stemming from the mismatch between natural water resources and demand. This challenge is exacerbated by global warming and population growth, with potential implications for social conflicts. Unfortunately, only 2.5 percent of the world’s water resources are fresh, while the remaining 97.5 percent is seawater [12]. The scarcity of fresh water is projected to affect 180 million people by 2025, leading to a global water shortage crisis [13,14]. Traditional irrigation methods, coupled with fertilizer usage, have resulted in water resource wastage, soil salinization, reduced land fertility, and environmental pollution. In particular, brackish water, which is a poor water source used for irrigating farmland, presents the potential danger of causing soil salinization, leading to a decline in both soil quality and land utilization rates. Scholars conduct thorough investigations with the goal of enhancing the effectiveness of utilizing water resources in agriculture and mitigating soil salinization. Among the various water treatment methods, using magnetized and ionized treatments for irrigation water has shown promising outcomes. Magnetized and ionized water enhances its physicochemical properties, reducing surface tension and viscosity while improving density, wettability, conductivity, pH, osmotic pressure, dissolved oxygen content, salt solution capacity, and the solid particle deposition ratio [15,16,17,18]. These properties effectively enhance soil structure and properties, improve irrigation water utilization efficiency, and can be applied to agricultural production, promoting crop growth, and increasing yield.
Moreover, employing organic fertilizer provides numerous benefits for the management of both soil and crops. On the one hand, organic fertilizer enhances soil properties and fosters crop growth. This is accomplished by enhancing the content of organic matter in the soil, decreasing the ratio of micro-aggregates and promoting the creation of bigger aggregates [19]. At the same time, it reduces the environmental hazards linked to nitrate nitrogen, decomposes insoluble compounds of phosphorus and potassium in the ground, restrains the leaching loss of nitrogen, phosphorus, and potassium, and enhances the uptake of vital nutrient elements. Consequently, it leads to improved agricultural product yields and quality [20,21]. Conversely, organic fertilizer has a crucial function in controlling plant growth and advancement, strengthening plant immunity to diseases and pests, improving the nutrient environment of the plant’s roots, increasing the variety of crop yield, and improving the efficiency of fertilizer utilization [22,23].
The accurate assessment of soil quality is vital for understanding soil conditions, designing effective cropping systems, and implementing efficient agricultural management practices. Despite these advances, there is still a research gap in evaluating soil quality under irrigation and the application of organic fertilizers in response to challenges such as water scarcity and soil quality degradation caused by agricultural irrigation and chemical fertilizer application. Hence, the primary goals of this study are to examine the variations and associations of soil parameters under different irrigation water sources and the simultaneous use of organic fertilizer, and to establish an MDS model for different irrigation water sources and organic fertilizer applications, creating reliable and precise tools for evaluating the SQI.
2. Materials and Methods
2.1. Experimental Site and Description
Figure 1 shows that the research took place at the Bazhou Irrigation Experiment Station, located in Korla City, Xinjiang, China (N 41°45′20.24″, E 86°8′51.16″, 901 m). The area is situated in a typical warm temperate zone known for its continental arid climate. The study was conducted from May to June in the years 2022 and 2023, considering the unique weather conditions of the region. The location where the study was conducted enjoys a period without frost for a total of 175 to 200 days and receives an annual amount of 2173 to 3059 h of sunshine. Table 1 displays the initial physical and chemical characteristics of the soil before the experiment began, aiming to offer a thorough comprehension of the soil.
2.2. Experimental Design and Field Management
Pakchoi without heading formation was selected for the study, which is known for its fast growth, short cycle, and rich nutritional content in all four seasons. The experiment involved using approximately 450 m3/ha of traditional irrigation, which was determined based on the pakchoi’s annual water requirement in the region. We utilized a bio-organic fertilizer that was soluble in water, comprising of organic substances (≥40%), N + P2O5 + K2O (≥5%), amino acid (≥10%), and fulvic acid (≥5%). The live bacterial count was 525 million/g, with Bacillus amyloliquefaciens at 420 million/g, Bacillus subtilis at 100 million/g, and Bacillus mucilaginosus at 4.7 million/g. The pH level was 5.5, while the total lead content was 5.2 mg/kg and the total chromium content was 2.7 mg/kg. During the growth period, the organic fertilizer was applied in conjunction with water for a total of eight irrigations. During the entire growth phase of pakchoi, we regularly watered and fertilized every five days as part of this research. The trials employed a flood irrigation method and comprised five different levels of organic fertilizer application rates (0, 20, 40, 60, and 80 kg/ha) along with three sources of irrigation water (fresh water, F; brackish water, B; and magnetized–ionized brackish water, MIB). As a consequence, the treatments were designated as F0, F1, F2, F3, and F4; B0, B1, B2, B3, and B4; and MIB0, MIB1, MIB2, MIB3, and MIB4.
The seeds were sown on May 7th and 5th in 2022 and 2023, respectively. The harvest dates in 2022 and 2023 were June 30th and 28th, respectively. For the cultivation of pakchoi, we utilized the conventional sowing technique in this research. The seeds were planted directly in the field where the primary experiment took place. Before planting, the recommended amount of compound fertilizer (tert.-ammonium, N-P2O5-K2O, 19%-19%-19%) at a rate of 300 kg/ha was applied following local customs, and no extra fertilizer was utilized throughout the trial. A high-grade, thickened, waterproof sheet, measuring 2 m in depth, enclosed every experimental plot. The plot for applying fertilizer was maintained for a duration of 2 years and replicated 3 times using a randomized block design. The size of the experimental plot was 3 m2, and the pakchoi plants were spaced approximately 20 cm apart, with rows approximately 40 cm apart. The planting density was approximately 2.5 × 10⁵ plants per hectare. Local practices were followed for field management, including activities such as removing weeds and controlling pests and diseases.
2.3. Soil Sampling and Laboratory Analysis
Once all experimental plots were set up, three soil samples were randomly and repeatedly gathered from the 20–40 cm soil layer (0.4 m × 0.4 m) of each plot one week before the pakchoi reached the end of its growth period. The soil samples that were gathered were allowed to dry in the open air and then passed through a soil screen three times to evaluate their physical and chemical characteristics. Soil bulk density (BD, g/cm3) was determined using the ring knife method.
The soil samples were first measured in the laboratory and then dried in a fan-assisted oven at a temperature of 105 °C for a duration of 12 h. Subsequently, the desiccated specimens were weighed again in order to ascertain the gravimetric moisture content of the soil. The volumetric soil water content (SWC, cm3/cm3) was calculated by multiplying the gravimetric water content with the bulk density. To evaluate the electrical conductivity of the soil, a DDS-307 conductivity meter was used to measure the EC1:5 of a 1:5 soil water extract at a temperature of 25 °C. The soil salt content (SSC, g/kg) was calculated using the obtained EC1:5 values for each soil sample, utilizing a linear relationship (SSC = 3.946 × EC1:5, R2 = 0.995, n = 30). The alkali diffusion method was used to determine the content of alkali-hydrolyzed nitrogen (AN, mg/kg), the molybdenum-antimony resistance colorimetric method was used to determine the content of available phosphorus (AP, mg/kg), flame photometry was used to determine the content of available potassium (AK, mg/kg), and the potassium dichromate volumetric method was used to determine the content of organic matter (OM, g/kg) [24].
2.4. SQI Evaluation Method
The determination of the SQI was a three-step process:
(1) PCA was used to select the MDS that best represented soil function and process indicators.
(2) The performance of the MDS was scored using both linear and nonlinear functions.
(3) The weighted simple addition method was used to integrate the index scores into the SQI.
We utilized PCA to categorize the indicators, choosing solely the components with eigenvalues greater than or equal to 1. Indicators that had loadings greater than or equal to 0.5 within the same component were consolidated. Indices with loadings of less than 0.5 were assigned to the group with the highest load value. After classifying the data, a standard value was calculated for every assessment criterion. A greater norm value signifies a larger composite load for the index across all principal components, indicating a higher ability to represent comprehensive information. The formula below can be used to determine the norm value [25,26,27]:
The comprehensive loading of indicator i in all components with eigenvalues greater than or equal to 1 is represented by Nik, while Uik represents the loading of indicator i in component k, and represents the eigenvalue of component k.
For this research, we utilized a linear scoring assessment model to transform every indicator into a dimension value that fell between 0 and 1. Both “more is better” and “less is better” were used for this purpose. The equations used are as follows:
where Sl represents the soil index score that ranges from 0 to 1. X represents the measured value of the index, Xmin represents the minimum value, and Xmax represents the maximum value. Equation (2) is used for indices where higher values are better, while Equation (3) is used for indices where lower values are better [28].
Using a nonlinear scoring evaluation model, the soil parameters’ measured values were converted into scores ranging from 0 to 1. This model was computed through the following formula:
In the scoring evaluation model, the soil index score (Snl) was calculated using the formula provided. The score had a range of 0 to 1, with a maximum score of 1. The soil index (X) was compared to its average value (Xmean), and the parameter ‘b’ represented the slope rate of the equation. Indicators categorized as ‘more is better’ were assigned a value of −2.5, whereas indicators categorized as ‘less is better’ were assigned a value of 2.5. These values were determined based on previous studies [29,30].
The weighting factor (Wi) derived from factor analysis was applied to calculate the SQI by combining the linear or nonlinear scores (SQIL or SQINL), as indicated in the equation. The use of weighting factors was optional, as it allowed for the examination of the relative importance of scored values for each indicator. This step helped to consider the varying significance of different soil properties in determining the overall soil quality.
To assess the accuracy of the MDS, the Nash–Sutcliffe efficiency coefficient (Ef) and the relative deviation coefficient (Er) were employed, following the methodology outlined by Nash and Lin [31,32]. The formulas for these calculations are as follows:
The and value and mean value of the SQI were determined using the total data set (TDS). The value was determined by calculating it using the MDS. values close to 1 indicated a high accuracy of the calculated result based on the MDS, while values close to 0 indicated a small deviation of the SQI.
2.5. Data Processing Method
Data processing and plotting were performed using Microsoft Office Excel (2016, Microsoft Corporation, Seattle, WA, USA), SPSS 25.0 (2017, IBM, Crop. Armonk, NY, USA) and Origin, correspondingly. The model was established and solved using MATLAB (2014, MathWorks Inc., Natick, MA, USA) programming. Soil indexes were tested for the effects of various irrigation and fertilization methods using one-way analysis of variance (ANOVA).
3. Results
3.1. Statistical Characteristics of Soil Property Indexes
According to the statistical properties of the evaluation indicators for soil quality (Table 2), the mean values for BD, SWC, SSC, AN, AP, AK, and OM were 1.365 g/cm3, 0.120 cm3/cm3, 4.614 g/kg, 5.759 g/kg, 18.332 mg/kg, 10.455 mg/kg, and 270.733 mg/kg, respectively. The soil was categorized as mildly saline soil, with a generally limited amount of nutrients. The coefficient of variation for BD was 0.008, indicating a relatively low level of variation and limited differentiation (Cv < 0.1), which could be attributed to the uniform soil type. The other soil indicators exhibited moderate variation (0.1 < Cv < 1). External factors such as extended farming, watering, fertilizing, and other outside influences can partially counterbalance the effects of inherent factors like soil origin and weather conditions on soil characteristics. As a result, there is typically a moderate level of variation in the majority of the indicators. AK had the largest variation coefficient at 0.829, while SWC, SSC, OM, AN, and AP had variation coefficients of 0.284, 0.408, 0.202, 0.260, and 0.777, respectively, which were associated with the level of irrigation and fertilization in the study area. A test was performed to assess the normal distribution of all indexes, revealing that BD and OM closely resembled a normal distribution (p > 0.05 for K-S test).
3.2. Establishment and Accuracy Verification of MDS Indexes
The evaluation indicators chosen for this study to assess soil quality and form a TDS included BD, SWC, SSC, AN, AP, AK, and OM. In order to decrease the quantity of indicators and tackle data duplication caused by intercorrelation among the evaluation indicators, a PCA was conducted on the seven indicators. The Kaiser–Meyer–Olkin (KMO) test was performed on the evaluation indicator data, resulting in a test value of 0.605. A higher KMO score suggests a more robust correlation between the indicators and a higher level of suitability for principal component and factor analysis. Based on the KMO value, it can be inferred that the data is appropriate for PCA. Three principal components were identified, with eigenvalues greater than or equal to 1, and they accounted for a cumulative contribution rate of 88.713% (Table 3).
Based on the PCA findings, the first group comprises SSC, SWC, AK, and OM, while AN and AP are part of the second group, and BD represents the third group (Figure 2). It was observed that SWC, SSC, OM, and AK exhibited strong correlations (Figure 3), with OM showing the highest norm value among them. Therefore, OM was selected as part of the MDS. AN and AP were placed in the second category due to their notable correlation, and subsequently, AN was selected for inclusion in the MDS. The MDS directly selected BD as the sole indicator in the third group. Consequently, the MDS comprised three indicators: BD, AN, and OM.
In general, the TDS encompasses the comprehensive and extensive coverage of indicators. Validating the MDS assessment index system is an essential stage in evaluating soil quality. The rational selection of indicators for the MDS has a direct impact on the precision of soil quality assessment. PCA was employed to evaluate the common factor variance of each indicator in the TDS, enabling the calculation of weights assigned to individual indicators. Following that, the assessment index was utilized to carry out the soil quality analysis.
The calculation findings show that the SQI values acquired via the linear MDS evaluation method (SQIL-MDS) varied between 0.13 and 0.83, averaging at 0.567 with a moderate degree of variation (Cv = 0.377). Conversely, the range of SQI values acquired through the nonlinear MDS assessment technique (SQINL-MDS) was between 0.280 and 0.610, with an average of 0.490 and a variation coefficient of 0.190, suggesting a moderate degree of variability. Significantly, the SQIL-MDS method displayed a broader range and coefficient of variation in comparison to the SQINL-MDS approach.
The diagram in Figure 4 clearly shows a strong positive relationship between the TDS and MDS when utilizing both the SQIL (Figure 4A) and SQINL (Figure 4B) assessment techniques. The obtained R2 values were 0.924 and 0.952, respectively, indicating that the MDS indicators are appropriate substitutes for the TDS indicators in assessing soil quality. Moreover, it was noted that the fitting outcome attained using the SQINL technique surpassed that of the SQIL approach. Moreover, the Ef values for the SQI derived from the TDS and MDS, as assessed by the SQIL and SQINL evaluation techniques, were 0.636 and 0.899, correspondingly. The values of Er were 0.154 and 0.046, respectively. The findings suggest that the MDS and SQINL methods are effective in accurately assessing soil quality when organic fertilizer is used with various irrigation water sources. Hence, the MDS is deemed appropriate for substituting the TDS in assessing the soil condition when organic fertilizer is utilized with various irrigation water sources.
3.3. Evaluation of SQI for Irrigation and Fertilization
This study determined that SWC, OM, AN, AP, and AK were found to be suitable for the “more is better” type of equation. The enhancement of soil moisture and nutrient levels resulted in a notable reduction in soil erosion and a boost in soil productivity, consequently enhancing soil quality. However, BD and SSC were found to be suitable for the “less is better” type of equation. Increasing BD and SSC can negatively affect soil permeability and crop root penetration. Enhancing soil permeability by reducing BD and SSC leads to improved crop growth, increased soil productivity, and a higher crop yield.
As shown in Figure 4, the average SQI (SQIa) for different irrigation water sources based on TDS and MDS follows the pattern: SQIa-MIB > SQIa-F > SQIa-B (Figure 5A). Specifically, under fresh water irrigation, the ranking is SQINL-MDS > SQIL-MDS > SQIL-TDS > SQINL-TDS. Under brackish water irrigation, the ranking is SQINL-MDS > SQINL-TDS > SQIL-TDS > SQIL-MDS. The order of ranking under the irrigation of magnetized–ionized brackish water is SQIL-MDS > SQIL-TDS > SQINL-MDS > SQINL-TDS. The MDS linear model yields a maximum SQI of 0.558 when the irrigation water is magnetized–ionized brackish water. The SQI follows a pattern of different levels of organic fertilizer application based on the TDS and MDS, with SQIa-20 kg/ha being greater than SQIa-80 kg/ha, which is greater than SQIa-40 kg/ha, followed by SQIa-60 kg/ha, and finally SQIa-0 kg/ha (refer to Figure 5B). The MDS linear model yields a maximum SQI of 0.936 when applying 20 kg/ha of organic fertilizer.
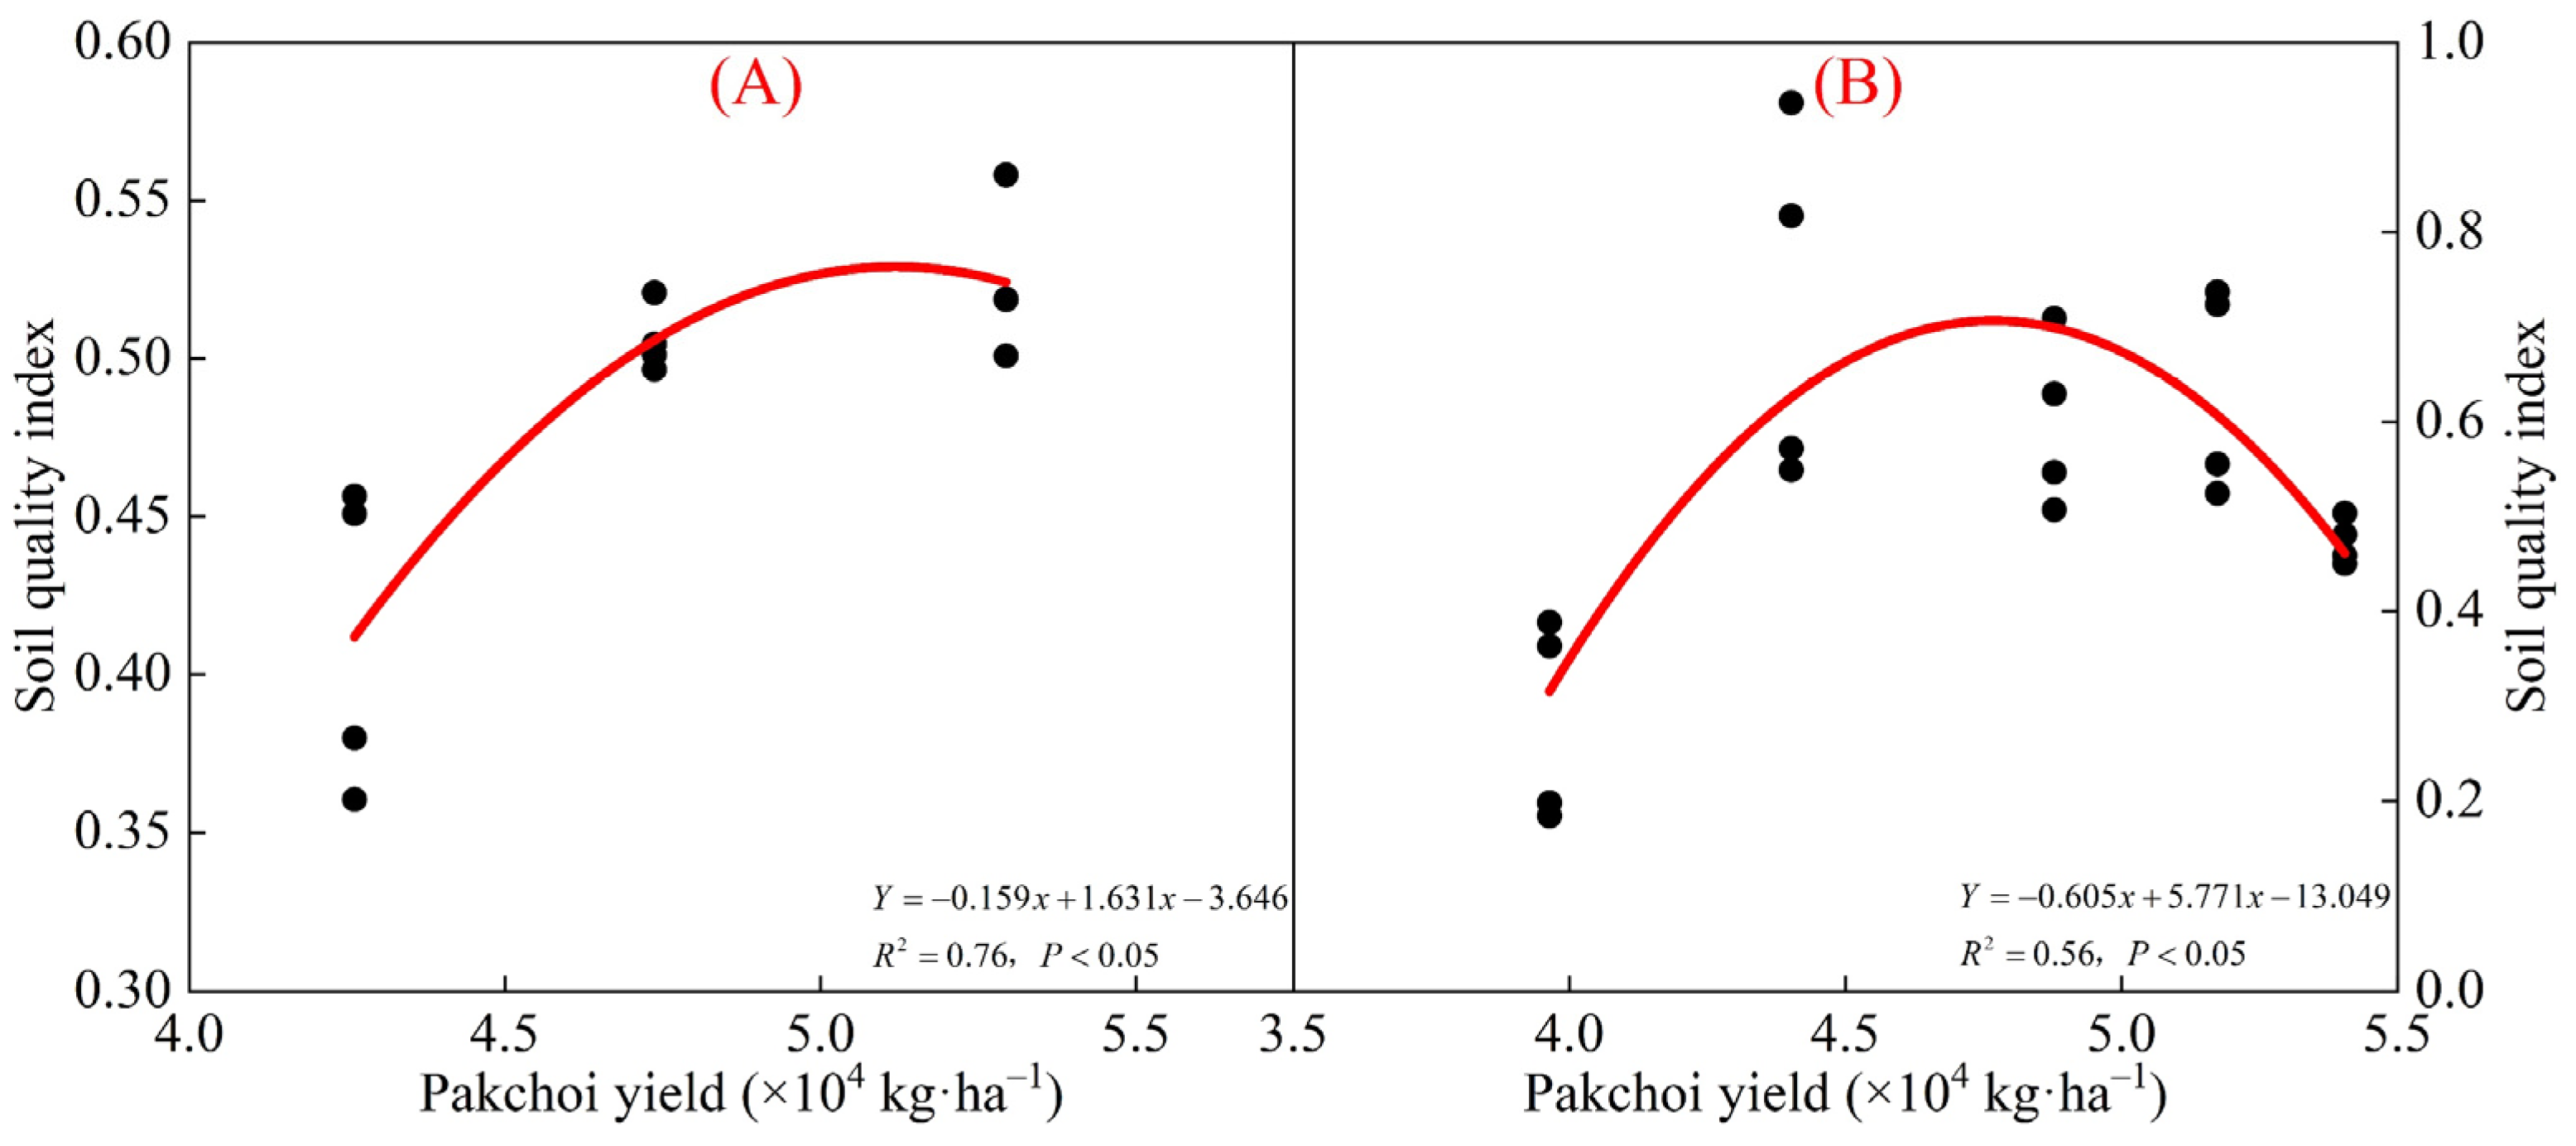
Furthermore, when combining SQI with cabbage yield, a noteworthy trend emerged in the SQI, indicating an initial increase followed by a subsequent decline as cabbage yield increased (Figure 6). This suggests that soil quality improvement can positively influence yield within a specific range. However, when striving for significantly higher yields, there is a risk of compromising soil quality due to intensive production methods.
4. Discussion
4.1. Soil Quality Evaluation Methods
Soil plays a pivotal role in various functions, encompassing agricultural production, environmental regulation, and buffering capacities. Soil quality is a comprehensive measure of its ability to sustain crop productivity, uphold environmental health, and support the well-being of plant and animal life within an ecosystem [33,34]. When it comes to crop yield, soil quality translates into soil productivity, indicating the soil’s capacity to support crop growth without causing harm to the environment or leading to land degradation. From an ecosystem standpoint, soil quality is characterized by its “capacity associated with specific soil functions”, encompassing its ability to maintain and enhance water and air quality, support plant and animal production, and safeguard human and habitat health [33]. To quantitatively assess soil quality, numerous methods have been proposed by researchers globally, including the Nemerow comprehensive index method [35], the grey correlation analysis method [36], TOPSIS [37], and the SQI method [1,28,38]. Among these, the SQI method offers distinct advantages as it considers the combined influence of the measured values, weights, and interactions of evaluation indicators on the overall assessment results [8].
Because of the natural variation in space and time of soil characteristics and the expensive nature of gathering data, the MDS method has become widely accepted for assessing soil quality [39,40]. Various methods have been employed to construct the MDS, including PCA, canonical correspondence analysis, cluster analysis, and step-up regression analysis [10,41,42]. Larson [43] first suggested the idea of utilizing the MDS to observe alterations in soil quality caused by agricultural management techniques. According to Jin [10] and Lima [44], creating a soil quality assessment MDS that includes important soil functions like water infiltration, storage and availability, nutrient storage, availability and recycling, and continuous biological activity showed comparable patterns to the TDS, offering valuable insights for land management. The effectiveness of the MDS-based SQI in replacing the TDS is shown by our research. The fitting accuracy of both the MDS and TDS was remarkably high. Specifically, the R2 coefficients for the linear and nonlinear scoring assessment models were 0.924 and 0.952, whereas the Ef coefficients were 0.636 and 0.899, and the Er coefficients were 0.154 and 0.046, respectively. These results underscore the MDS-based SQINL capacity to provide a precise assessment of soil quality under varying conditions of irrigation and organic fertilizer application (Figure 4). To enhance soil quality in agricultural production, it is crucial to highlight the impacts of tillage techniques and nutrient utilization by considering the three MDS screening assessment criteria alongside real-life farming practices. This aligns with the findings of Mei [8], who also demonstrated the efficacy of the MDS in replacing the TDS for evaluating soil quality in black topsoil.
4.2. Effects of Irrigation and Fertilization on Soil Quality
Soil serves as a fundamental resource for achieving sustainable economic and social development. The well-being of both animals and humans in nature is intricately linked to soil quality and the establishment of an ecological civilization. Soil water contains a diverse range of inorganic and organic substances, and water quality plays a crucial role in shaping the physical, chemical, and biological properties of soil. In the realm of agricultural production, practices such as irrigation, fertilization, pesticide application, and mulching significantly impact soil quality. It is essential to implement these activities judiciously to minimize any potential adverse effects on soil health. Specific irrigation methods, such as continuous flooding, can result in lower surface soil density, increased overall soil porosity (including capillary porosity), improved soil structure, and a better ability to retain water [45]. Conversely, the reduced irrigation of the surface soil increases its bulk density, decreases the total porosity and capillary porosity, weakens the water-holding capacity, reduces the field water-holding capacity, and causes a deterioration in the soil’s physical and chemical characteristics, which hampers water retention according to reference [46]. Peng [47] analyzed the leaching of nitrogen and phosphorus in the paddy fields of the Taihu Lake Basin under flood irrigation and controlled irrigation and found that controlled irrigation reduced nitrogen and phosphorus leaching compared to flood irrigation. Despite the significant contribution of irrigation to increased food production, the pursuit of high yields in some regions, coupled with the continuous irrigation of groundwater, led to ecological and soil-related issues. This imbalance between food production and the regional water resource carrying capacity resulted in challenges within the soil ecosystem [48].
It is now crucial to reduce irrigation water consumption and explore new water sources. Brackish water resources are considered one such alternative, and their exploitation and utilization hold great significance for ensuring sustainable agricultural development [49]. Several studies have demonstrated that brackish water irrigation can alleviate agricultural drought and increase crop yield to some extent [50,51]. This study reveals that, under brackish water irrigation, the SQI is 0.412, whereas under fresh water irrigation, the SQI is 0.506. The difference occurs because when brackish water is used for irrigation in addition to fresh water, it introduces soluble salt ions into the soil. Furthermore, as the salinity of irrigation water increases, there is an initial increase in soil infiltration capacity followed by a subsequent decrease [52,53]. Consequently, soil quality is diminished, leading to various impacts on soil physical and chemical properties as well as crop growth and development [49]. Additionally, brackish water irrigation has been associated with increased greenhouse gas emissions, particularly N2O [54], contributing to the deterioration of soil physical and chemical properties [55], and ultimately resulting in a decline in the quality of cultivated land. Current research on magnetized and ionized treatment technology for irrigation water indicates that magnetized and ionized water irrigation can accelerate soil water infiltration, increase the water retention capacity of the upper soil, facilitate the downward migration of upper soil salt, enhance salt leaching efficiency, and improve the growth environment for soil and crops [56,57,58]. When comparing brackish water irrigation to magnetized–ionized brackish water irrigation, we noticed that the SQI, which was determined by considering both the MDS and TDS, achieved a value of 0.524. This finding strongly suggests that magnetized–ionized brackish water irrigation holds significant promise for enhancing soil quality.
The excessive utilization of chemical fertilizers can have adverse repercussions on soil structure, leading to issues like soil compaction, nutrient imbalances, and environmental contamination [59,60]. Multiple studies have consistently verified that extended dependence on chemical fertilizers can lead to the exhaustion of nutrients, the deterioration of soil quality, disturbances in the cycling of soil nutrients, and a diminished ability to store carbon in the soil, ultimately affecting the productivity of crops [61,62]. For instance, Reardon [63] demonstrated that continued nitrogen fertilizer application could diminish soil quality, influence the soil microbial community, and disrupt soil nutrient cycling. In contrast, organic fertilizer presents several advantages, including its comprehensive nutrient content and long-lasting fertilization effects. Using organic fertilizer has numerous advantages, such as augmenting soil enzyme function, enhancing soil quality, improving crop excellence, increasing water and nutrient retention in the soil, and fostering the growth of beneficial microorganisms [64]. The enhancement of soil quality is greatly influenced by the rise in populations of soil microorganisms and nutrient levels, which is of the utmost importance [65]. Multiple research studies consistently affirm the notion that the utilization of organic fertilizer stimulates the transformation of soil nutrients and enhances the accessibility of nutrients within the soil [66,67,68]. In turn, this leads to a tangible improvement in soil quality. During the two-year study period, we documented variations in soil quality resulting from diverse irrigation and fertilization practices. The initial findings suggest that the greatest SQI values were noted with the utilization of organic fertilizer at a rate of 20 kg/ha, succeeded by 80 kg/ha, 40 kg/ha, and 60 kg/ha. Conversely, the SQI was measured at 0.283 in instances where no organic fertilizer was applied. Furthermore, within the context of the MDS, we observed that the maximum SQIL was achieved when the organic fertilizer application rate was 20 kg/ha, reaching 0.936. Conversely, the minimum SQIL based on the MDS was recorded at 0.184 when no organic fertilizer was applied. The results emphasize the significance of continuous monitoring and offer valuable observations on the temporal variations in soil quality under the specified circumstances.
In summary, one of the central goals in soil quality research is the enhancement and sustainable maintenance of soil productivity. The established correlation between the soil quality index and pakchoi yield serves as compelling evidence for the importance and scientific rigor of soil quality assessment (Figure 6). The prudent use of magnetized–ionized brackish water resources and the integrated application of organic fertilizer present significant advantages. These advantages encompass the mitigation of water resource scarcity, the enhancement of water and fertilizer utilization efficiency, and the improvement of soil quality. Consequently, it is of paramount importance to discern the optimal irrigation and fertilization system, taking into account regional farmland irrigation practices, soil conditions, cultivated crops, and appropriate fertilization rates, all of which collectively contribute to the effective enhancement of soil quality. Embracing such tailored approaches not only fosters sustainable agricultural practices but also concurrently elevates soil health and productivity.
5. Conclusions
This study showed that different levels of irrigation and fertilization have significant impacts on soil quality. The application of the MDS approach enabled the identification of BD, AN, and OM as key indicators for assessing soil quality. The evaluation method based on the SQI, particularly the nonlinear scoring evaluation model (SQINL), demonstrated superior performance in distinguishing the effects of irrigation and fertilization on soil quality. The high coefficient of determination (R2) values of 0.924 and 0.952 for SQI-MDS and SQI-TDS, respectively, underscored their robust predictive capabilities. The significant differences in Ef values (0.636, 0.899) and Er values (0.154, 0.046) between the linear and nonlinear scoring evaluation models further confirmed the accuracy and reliability of the MDS method in assessing soil quality. The magnetized–ionized brackish water irrigation treatment demonstrated the highest SQI value, while the lowest value was recorded under the brackish water irrigation treatment. Among the organic fertilizer gradients, the 20 kg/ha treatment yielded the highest SQI value, whereas the lowest SQI was observed under the 0 kg/ha treatment. Hence, using magnetized–ionized brackish water and organic fertilizer reasonably is a sustainable solution that combines high vegetable yields with the long-term maintenance of soil quality. Nevertheless, some limitations remained in this study. Notably, the absence of biological indicators among the preselected metrics rendered the indicator system incomplete, warranting enhancement. The subsequent phase of this research will focus on investigating optimal land resource allocation across varying soil quality grades through the integration of ecological environmental characteristics and land use statuses.
Author Contributions
S.L.: Conceptualization, Formal analysis, Investigation, Resources, Writing—original draft; Q.L.: Data curation, Formal analysis, Methodology; Y.L.: Formal analysis, Resources; Y.Z.: Data curation, Resources; L.S.: Software, Formal analysis; Q.W.: Conceptualization, Methodology, Visualization, Supervision, Writing—review and editing; W.T.: Methodology, Software, Supervision; M.D.: Methodology, Supervision. All authors have read and agreed to the published version of the manuscript.
Funding
This study was jointly supported by the National Natural Science Foundation of China (No. 52339003, 41830754, 51679190), the Shaanxi Province Youth Science and Technology New Star Project (2021KJXX-29), and the Doctoral Dissertation Innovation Fund of the Xi’an University of Technology.
Data Availability Statement
The data that support the findings of this study are available from the corresponding author upon reasonable request.
Conflicts of Interest
The authors declare that they have no known competing financial interests or personal relationships that could have appeared to influence the work reported in this paper.
References
- Obade, V.; Lal, R. A standardized soil quality index for diverse field conditions. Sci. Total Environ. 2015, 541, 424–434. [Google Scholar] [CrossRef] [PubMed]
- Wu, C.S.; Liu, G.H.; Huang, C.; Liu, Q.S. Soil quality assessment in Yellow River Delta: Establishing a minimum data set and fuzzy logic model. Geoderma 2019, 334, 82–89. [Google Scholar] [CrossRef]
- Chen, C.; Yang, F.; Zhao, L.L.; Yao, H.Y.; Wang, J.L.; Liu, H.L. Influences of different land use types on soil characteristics and availability in Karst Area, Guizhou Province. Acta Agrestia Sin. 2014, 22, 1007–1013. (In Chinese) [Google Scholar]
- Arslan, S. Assessment of groundwater and soil quality for agricultural purposes in kopruoren basin, Kutahya, Turkey. J. Afr. Earth Sci. 2017, 131, 1–13. [Google Scholar] [CrossRef]
- Cheng, J.; Ding, C.; Li, X.; Zhang, T.; Wang, X. Soil quality evaluation for navel orange production systems in central subtropical China. Soil Tillage Res. 2016, 155, 225–232. [Google Scholar] [CrossRef]
- Lin, Y.M.; Deng, H.J.; Du, K.; Li, J.; Lin, H.; Chen, C.; Fisher, L.; Wu, C.Z.; Hong, T.; Zhang, G.S. Soil quality assessment in different climate zones of China’s Wenchuan earthquake affected region. Soil Tillage Res. 2017, 165, 315–324. [Google Scholar] [CrossRef]
- Wang, Z.J.; Jia, L.Z.; Yang, L.Y.; Guo, Z.H.; Sang, W.G.; Lu, L.; Xiao, C.W. Assessment of the effects of fencing enclosure on soil quality based on minimum data set in Biru County of the Qinghai-Tibet Plateau, China. Agronomy 2023, 13, 1558. [Google Scholar] [CrossRef]
- Mei, N.; Gu, Y.; Li, D.Z.; Liang, Y.; Yuan, J.C.; Liu, J.Z.; Ren, J.; Cai, H.G. Soil quality evaluation in topsoil layer of black soil in Jilin Province based on minimum data set. Trans. Chin. Soc. Agric. Eng. 2021, 37, 91–98. (In Chinese) [Google Scholar]
- Rahmanipour, F.; Marzaioli, R.; Bahrami, H.A.; Fereidouni, Z.; Bandarabadi, S.R. Assessment of soil quality indices in agricultural lands of Qazvin Province, Iran. Ecol. Indic. 2014, 40, 19–26. [Google Scholar] [CrossRef]
- Jin, H.F.; Shi, D.M.; Lou, Y.B.; Zhang, J.L.; Ye, Q.; Jiang, N. Evaluation of the quality of cultivated-layer soil based on different degrees of erosion in sloping farmland with purple soil in China. Catena 2020, 198, 105048. [Google Scholar] [CrossRef]
- Yu, L.; Xu, H.N.; Xiao, F.M. Grey relation analysis of soil quality of Phyllostachys edulis stands at different fertilization. South China For. Sci. 2018, 46, 1–4. (In Chinese) [Google Scholar]
- Shiklomanov, I.A. Appraisal and assessment of world water resources. Water Int. 2000, 25, 11–32. [Google Scholar] [CrossRef]
- Kang, S.Z. Towards water and food security in China. Chin. J. Eco-Agric. 2014, 8, 880–885. (In Chinese) [Google Scholar]
- Yermiyahu, U.; Tal, A.; Ben-Gal, A.; Tarchitzky, J.; Lahav, O. Rethinking desalinated water quality and agriculture. Science 2007, 318, 920–921. [Google Scholar] [CrossRef] [PubMed]
- Amiri, M.C.; Dadkhah, A.A. On reduction in the surface tension of water due to magnetic treatment. Colloids Surf. A Physicochem. Eng. Asp. 2006, 278, 252–255. [Google Scholar] [CrossRef]
- Ding, Z.R.; Zhao, Y.J.; Chen, F.L.; Chen, J.Z.; Duan, S.X. Magnetization mechanism of magnetized water. Acta Phys. Sin. 2011, 60, 432–439. (In Chinese) [Google Scholar]
- Esmaeilnezhad, E.; Choi, H.J.; Schaffie, M.; Gholizadeh, M.; Ranjbar, M. Characteristics and applications of magnetized water as a green technology. J. Clean. Prod. 2017, 161, 908–921. [Google Scholar] [CrossRef]
- Hilal, M.H.; El Fakhrani, Y.M.; Mabrouk, S.S.; Ebead, B.M. Effect of magnetic treated irrigation water on salt removal from a sandy soil and on the availability of certain nutrients. Int. J. Eng. 2013, 2, 36–44. [Google Scholar]
- Karami, A.; Homaee, M.; Afzalinia, S.; Ruhipour, H.; Basirat, S. Organic resource management: Impacts on soil aggregate stability and other soil physico-chemical properties. Agric. Ecosyst. Environ. 2012, 148, 22–28. [Google Scholar] [CrossRef]
- Wan, L.J.; Tian, Y.; He, M.; Zheng, Y.Q.; Lyu, Q.; Xie, R.J.; Ma, Y.Y.; Deng, L.; Yi, S.L. Effects of chemical fertilizer combined with organic fertilizer application on soil properties, citrus growth physiology, and yield. Agriculture 2021, 11, 1207. [Google Scholar] [CrossRef]
- Fan, H.L.; Zhang, Y.S.; Li, J.C.; Jiang, J.J.; Waheed, A.; Wang, S.G.; Rasheed, S.M.; Zhang, L.; Zhang, R.P. Effects of organic fertilizer supply on soil properties, tomato yield, and fruit quality: A Global Meta-Analysis. Sustainability 2023, 15, 2556. [Google Scholar] [CrossRef]
- Liu, Q.; Yu, Z.Y.; Wang, X.M.; Zhao, S.L. Organic fertilizer increases soil organic carbon and crop yield in four-year tillage and crop rotations on the loess plateau, China. Appl. Ecol. Environ. Res. 2022, 20, 4271–4282. [Google Scholar] [CrossRef]
- Wang, B.S.; Wang, Y.; Sun, Y.; Yu, L.R.; Lou, Y.S.; Fan, X.R.; Ren, L.X.; Xu, G.H. Watermelon responds to organic fertilizer by enhancing root-associated acid phosphatase activity to improve organic phosphorus utilization. J. Plant Physiol. 2022, 279, 153838. [Google Scholar] [CrossRef] [PubMed]
- Bao, S.D. Soil and Agricultural Chemistry Analysis; China Agricultural Press: Beijing, China, 2000. [Google Scholar]
- Jimenez, L.C.Z.; Queiroz, H.M.; Cherubin, M.R.; Ferreira, T.O. Applying the soil management assessment framework (SMAF) to assess mangrove soil quality. Sustainability 2022, 14, 3085. [Google Scholar] [CrossRef]
- Andrews, S.S.; Karlen, D.L.; Mitchell, J.P. A comparison of soil quality indexing methods for vegetable production systems in northern California. Agric. Ecosyst. Environ. 2002, 90, 25–45. [Google Scholar] [CrossRef]
- Li, P.; Li, Y.B.; Xu, L.Y.; Zhang, H.J.; Shen, X.S.; Xu, H.F.; Jiao, J.G.; Li, H.X.; Hu, F. Crop yield-soil quality balance in double cropping in China’s upland by organic amendments: A meta-analysis. Geoderma 2021, 403, 115197. [Google Scholar] [CrossRef]
- Askari, M.S.; Holden, N.M. Indices for quantitative evaluation of soil quality under grassland management. Geoderma 2014, 230, 131–142. [Google Scholar] [CrossRef]
- Bastida, F.; Moreno, J.L.; Hernández, T.; García, C. Microbiological degradation index of soils in a semiarid climate. Soil Biol. Biochem. 2006, 38, 3463–3473. [Google Scholar] [CrossRef]
- Zhang, C.; Xue, S.; Liu, G.B. A comparison of soil qualities of different revegetation types in the Loess Plateau, China. Plant Soil 2011, 347, 163–178. [Google Scholar] [CrossRef]
- Nash, J.E.; Sutcliffe, J.V. River flow forecasting through conceptual models. Part 1: A discussion of principles. J. Hydrol. 1970, 10, 282–290. [Google Scholar] [CrossRef]
- Lin, F.; Chen, X.W.; Yao, H.X. Evaluating the use of nash-sutcliffe efficiency coefficient in goodness-of-fit measures for daily runoff simulation with SWAT. J. Hydrol. Eng. 2017, 22, 05017023.1–05017023.9. [Google Scholar] [CrossRef]
- Karlen, D.L.; Veum, K.S.; Sudduth, K.A.; Obrycki, J.F. Soil health assessment: Past accomplishments, current activities, and future opportunities. Soil Tillage Res. 2019, 195, 104365. [Google Scholar] [CrossRef]
- Yang, Q.J.; Wu, K.N.; Feng, Z.; Zhao, R.; Zhang, X.D.; Li, X.L. Advancement and revelation of the research on soil quality assessment on large spatial scales. Acta Pedol. Sin. 2020, 57, 565–578. (In Chinese) [Google Scholar]
- Ye, J.H.; Yu, T.; Xu, Z.T.; Liu, H.Y.; Cai, Q.R. Distribution and probabilistic integrated ecological risk assessment of heavy metals in the surface water of Poyang Lake, China. Chin. J. Anal. Chem. 2021, 49, 29–34. [Google Scholar] [CrossRef]
- Yu, P.J.; Han, D.L.; Liu, S.W.; Wen, X.; Huang, Y.X.; Jia, H.T. Soil quality assessment under different land uses in an alpine grassland. Catena 2018, 171, 280–287. [Google Scholar] [CrossRef]
- Xie, X.F.; Pu, L.J.; Zhu, M.; Tao, W.U.; Yan, X.U. Assessment of soil quality in coastal tidal flat reclamation areas based on MDS-TOPSIS model. Environ. Sci. 2019, 40, 5484–5492. [Google Scholar]
- Mei, N.; Yang, B.; Tian, P.; Jiang, Y.; Sui, P.X.; Sun, D.Q.; Zhang, Z.P.; Qi, H. Using a modified soil quality index to evaluate densely tilled soils with different yields in Northeast China. Environ. Sci. Pollut. Res. 2019, 26, 13867–13877. [Google Scholar] [CrossRef]
- Kim, S.W.; Nam, S.H.; Il Kwak, J.; Chae, Y.; Kim, D.; Jeong, S.W.; An, Y.J. In situ determination of crop productivity in metal- contaminated, remediated, and reclaimed soils: Significance of ecotoxicological data on assessing soil quality. Environ. Eng. Res. 2023, 28, 220785. [Google Scholar] [CrossRef]
- Zhang, G.; Bai, J.; Xi, M.; Zhao, Q.; Lu, Q.; Jia, J. Soil quality assessment of coastal wetlands in the Yellow River Delta of China based on the minimum data set. Ecol. Indic. 2016, 66, 458–466. [Google Scholar] [CrossRef]
- Mohammad, S.A.; Nicholas, M.H. Quantitative soil quality indexing of temperate arable management systems. Soil Tillage Res. 2015, 150, 57–67. [Google Scholar]
- Zeraatpisheh, M.; Bakhshandeh, E.; Hosseini, M.; Alavi, S.M. Assessing the effects of deforestation and intensive agriculture on the soil quality through digital soil mapping. Geoderma 2020, 363, 114139. [Google Scholar] [CrossRef]
- Larson, W.; Pierce, F.J. The dynamics of soil quality as a measure of sustainable management. In Defining Soil Quality for Sustainable Environment; Doran, J.W., Coleman, D.C., Bezedick, D.F., Stewart, B.A., Eds.; Soil Science Society of America and American Society of Agronomy: Madison, WI, USA, 1994; pp. 37–51. [Google Scholar]
- Lima, A.C.R.; Brussaard, L.; Totola, M.R.; Hoogmoed, W.B.; Goede, R.G.M.D. A functional evaluation of three indicator sets for assessing soil quality. Appl. Soil Ecol. 2013, 64, 194–200. [Google Scholar] [CrossRef]
- Xiong, Y.N.; Feng, T.J.; Wang, P.; Wu, X.D. Effects of long-term artificial forest restoration on soil moisture and nutrient characteristics in the Loess Area of Western Shanxi Province, China. J. Soil Water Conserv. 2022, 36, 228–237. (In Chinese) [Google Scholar]
- Liu, X.G.; Zhang, Y.Y.; Jiang, Z.Y.; Yue, X.L.; Liang, J.P.; Yang, Q.L.; Li, J.; Li, N. Micro-moistening irrigation combined with bio-organic fertilizer: An adaptive irrigation and fertilization strategy to improve soil environment, edible Rose yield, and nutritional quality. Ind. Crops Prod. 2023, 196, 116487. [Google Scholar] [CrossRef]
- Peng, S.Z.; Yang, S.H.; Xu, J.Z.; Luo, Y.F.; Hou, H.J. Nitrogen and phosphorus leaching losses from paddy fields with different water and nitrogen managements. Paddy Water Environ. 2011, 9, 333–342. [Google Scholar] [CrossRef]
- Kang, S.Z. Store grain in water and technology-development of highly-efficient agricultural water use for ensuring national food security. China Water Resour. 2022, 13, 1–5. (In Chinese) [Google Scholar]
- Sun, H.Y.; Zhang, X.J.; Tian, L.; Lou, B.Y.; Liu, T.; Wang, J.T.; Dong, X.L.; Guo, K.; Liu, X.J. Effects of saline water irrigation on soil quality and crop production: A review. Chin. J. Eco Agric. 2023, 31, 354–363. (In Chinese) [Google Scholar]
- Li, J.; Cao, C.Y.; Zheng, C.L.; Dang, H.K.; Guo, L.; Ma, J.Y. Salinity threshold of long-term saline water irrigation for winter wheat in Hebei Lowland Plain. Chin. J. Eco Agric. 2016, 24, 643–651. (In Chinese) [Google Scholar]
- Su, H.; Sun, H.Y.; Dong, X.L.; Chen, P.; Zhang, X.J.; Tian, L.; Liu, X.J.; Wang, J.T. Did manure improve saline water irrigation threshold of winter wheat? A 3-year field investigation. Agric. Water Manag. 2021, 258, 107203. [Google Scholar] [CrossRef]
- Cai, D.W.; Kong, S.Q.; Liu, R.Q. A review of brackish water for agricultural safe irrigation. Water Sav. Irrig. 2020, 10, 91–95. (In Chinese) [Google Scholar]
- Tang, S.Q.; She, D.L. Influence of water quality on soil saturated hydraulic conductivity and infiltration properties. Trans. Chin. Soc. Agric. Mach. 2016, 47, 108–114. (In Chinese) [Google Scholar]
- Li, S.N.; Hou, Z.A. Effect of drip irrigation with saline water on soil nitrous oxide emissions in cotton field. J. Shihezi Univ. Nat. Sci. 2016, 34, 301–308. (In Chinese) [Google Scholar]
- Yin, C.Y.; Zhao, J.; Chen, X.B.; Li, L.J.; Liu, H.; Hu, Q.L. Desalination characteristics and efficiency of high saline soil leached by brackish water and Yellow River water. Agric. Water Manag. 2022, 263, 107461. [Google Scholar] [CrossRef]
- Mu, Y.; Zhao, G.Q.; Zhao, Q.Q.; Liu, H.; Wang, Q.J. Advances in the application of activated water irrigation. J. Agric. Resour. Environ. 2019, 36, 403–411. (In Chinese) [Google Scholar]
- Wang, Q.J.; Sun, Y.; Ning, S.R.; Zhang, J.H.; Zhou, B.B.; Su, L.J.; Shan, Y.Y. Effects of activated irrigation water on soil physicochemical properties and crop growth and analysis of the probable pathway. Adv. Earth Sci. 2019, 34, 660–670. (In Chinese) [Google Scholar]
- Wang, Q.J.; Xie, J.B.; Zhang, J.H.; Wei, K.; Sun, Y.; Li, Z.Y. Effects of magnetic field strength on magnetized water infiltration and soil water and salt movement. Trans. Chin. Soc. Agric. Mach. 2020, 51, 292–298. (In Chinese) [Google Scholar]
- Su, S.Y.; Zhou, Y.X.; Zhou, X. Spatio-temporal evolution and influencing factors of chemical fertilizer application intensity of vegetable planting in China. J. China Agric. Univ. 2022, 27, 248–263. (In Chinese) [Google Scholar]
- Xie, Y.L.; Wang, J.P.; Su, T.M.; Li, H.G.; Tan, B.S.; Yang, W.J. Effects of partial substitution of chemical fertilizers by organic fertilizers on lettuce growth and soil environment. J. Southwest Univ. (Nat. Sci. Ed.) 2022, 44, 41–49. (In Chinese) [Google Scholar]
- Xing, L.; Zhang, Y.M.; Hu, C.S.; Dong, W.X.; Li, X.X.; Liu, X.P.; Zhang, L.J.; Wen, H.D. Effects of long-term nutrient recycling pathways on soil nutrient dynamics and fertility effect in farmland. J. China Ecol. Agric. 2022, 30, 937–951. (In Chinese) [Google Scholar]
- Jiang, L.W.; Xie, Y.H.; Li, T.L.; Liu, K.; Zhang, Q.R.; Cao, J.; Shao, J.L. Effects of different organic substitutes on soil organic carbon and nitrogen fractions and winter wheat yield in dryland of loess plateau. J. Soil Water Conserv. 2022, 36, 286–293. (In Chinese) [Google Scholar]
- Reardon, C.L.; Klein, A.M.; Melle, C.J.; Hagerty, C.H.; Klarer, E.R.; Machado, S.; Paulitz, T.; Pritchett, L.; Schlatter, D.; Smith, S.F.; et al. Enzyme activities distinguish long-term fertilizer effects under different soil storage methods. Appl. Soil Ecol. 2022, 177, 104518. [Google Scholar] [CrossRef]
- Wen, Y.C.; Zhang, Y.D.; Yuan, L.; Li, W.; Li, Y.Q.; Lin, Z.A.; Zhao, B.Q. Crop yield and soil fertility response to commercial organic fertilizer substituting chemical fertilizer. Sci. Agric. Sin. 2018, 51, 2136–2142. (In Chinese) [Google Scholar]
- Xiao, R.; Zhang, Y.L.; Zhao, Y.C.; Guo, A.Q.; Cui, Z.T.; Shi, W.J. Effects of chemical fertilizer reduction and organic fertilizer application on soil quality, eggplant yield and quality in solar greenhouse. Acta Agric. Boreali-Sin. 2023, 38, 188–198. (In Chinese) [Google Scholar]
- Jin, L.; Jin, N.; Wang, S.Y.; Li, J.W.; Meng, X.; Xie, Y.D.; Wu, Y.; Luo, S.L.; Lyu, J.; Yu, J.H. Changes in the microbial structure of the root soil and the yield of Chinese Baby Cabbage by chemical fertilizer reduction with bio-organic fertilizer application. Microbiol. Spectr. 2022, 10, e01215-22. [Google Scholar] [CrossRef] [PubMed]
- Tang, Z.X.; Feng, J.N.; Chen, L.L.; Chen, Z.B.; Shao, X.D.; Xia, T.Y. Coupling amendment of microbial and compound fertilizers increases fungal necromass carbon and soil organic carbon by regulating microbial activity in flue-cured tobacco-planted field. Eur. J. Soil Biol. 2023, 117, 103518. [Google Scholar] [CrossRef]
- Ma, X.; Jia, Z.F.; Zhang, Y.C.; Zhang, R. Effects of bio-organic fertilizers on oat production and soil fertility in alpine region of Qinghai-Tibet plateau. Acta Agrestia Sin. 2019, 27, 1759–1765. (In Chinese) [Google Scholar]
Figure 1.
Location of the experimental site.

Figure 2.
Results of principal component grouping for soil property indexes. Note: F1, F2, and F3 are the first, second, and third principal components, respectively.
Figure 2.
Results of principal component grouping for soil property indexes. Note: F1, F2, and F3 are the first, second, and third principal components, respectively.
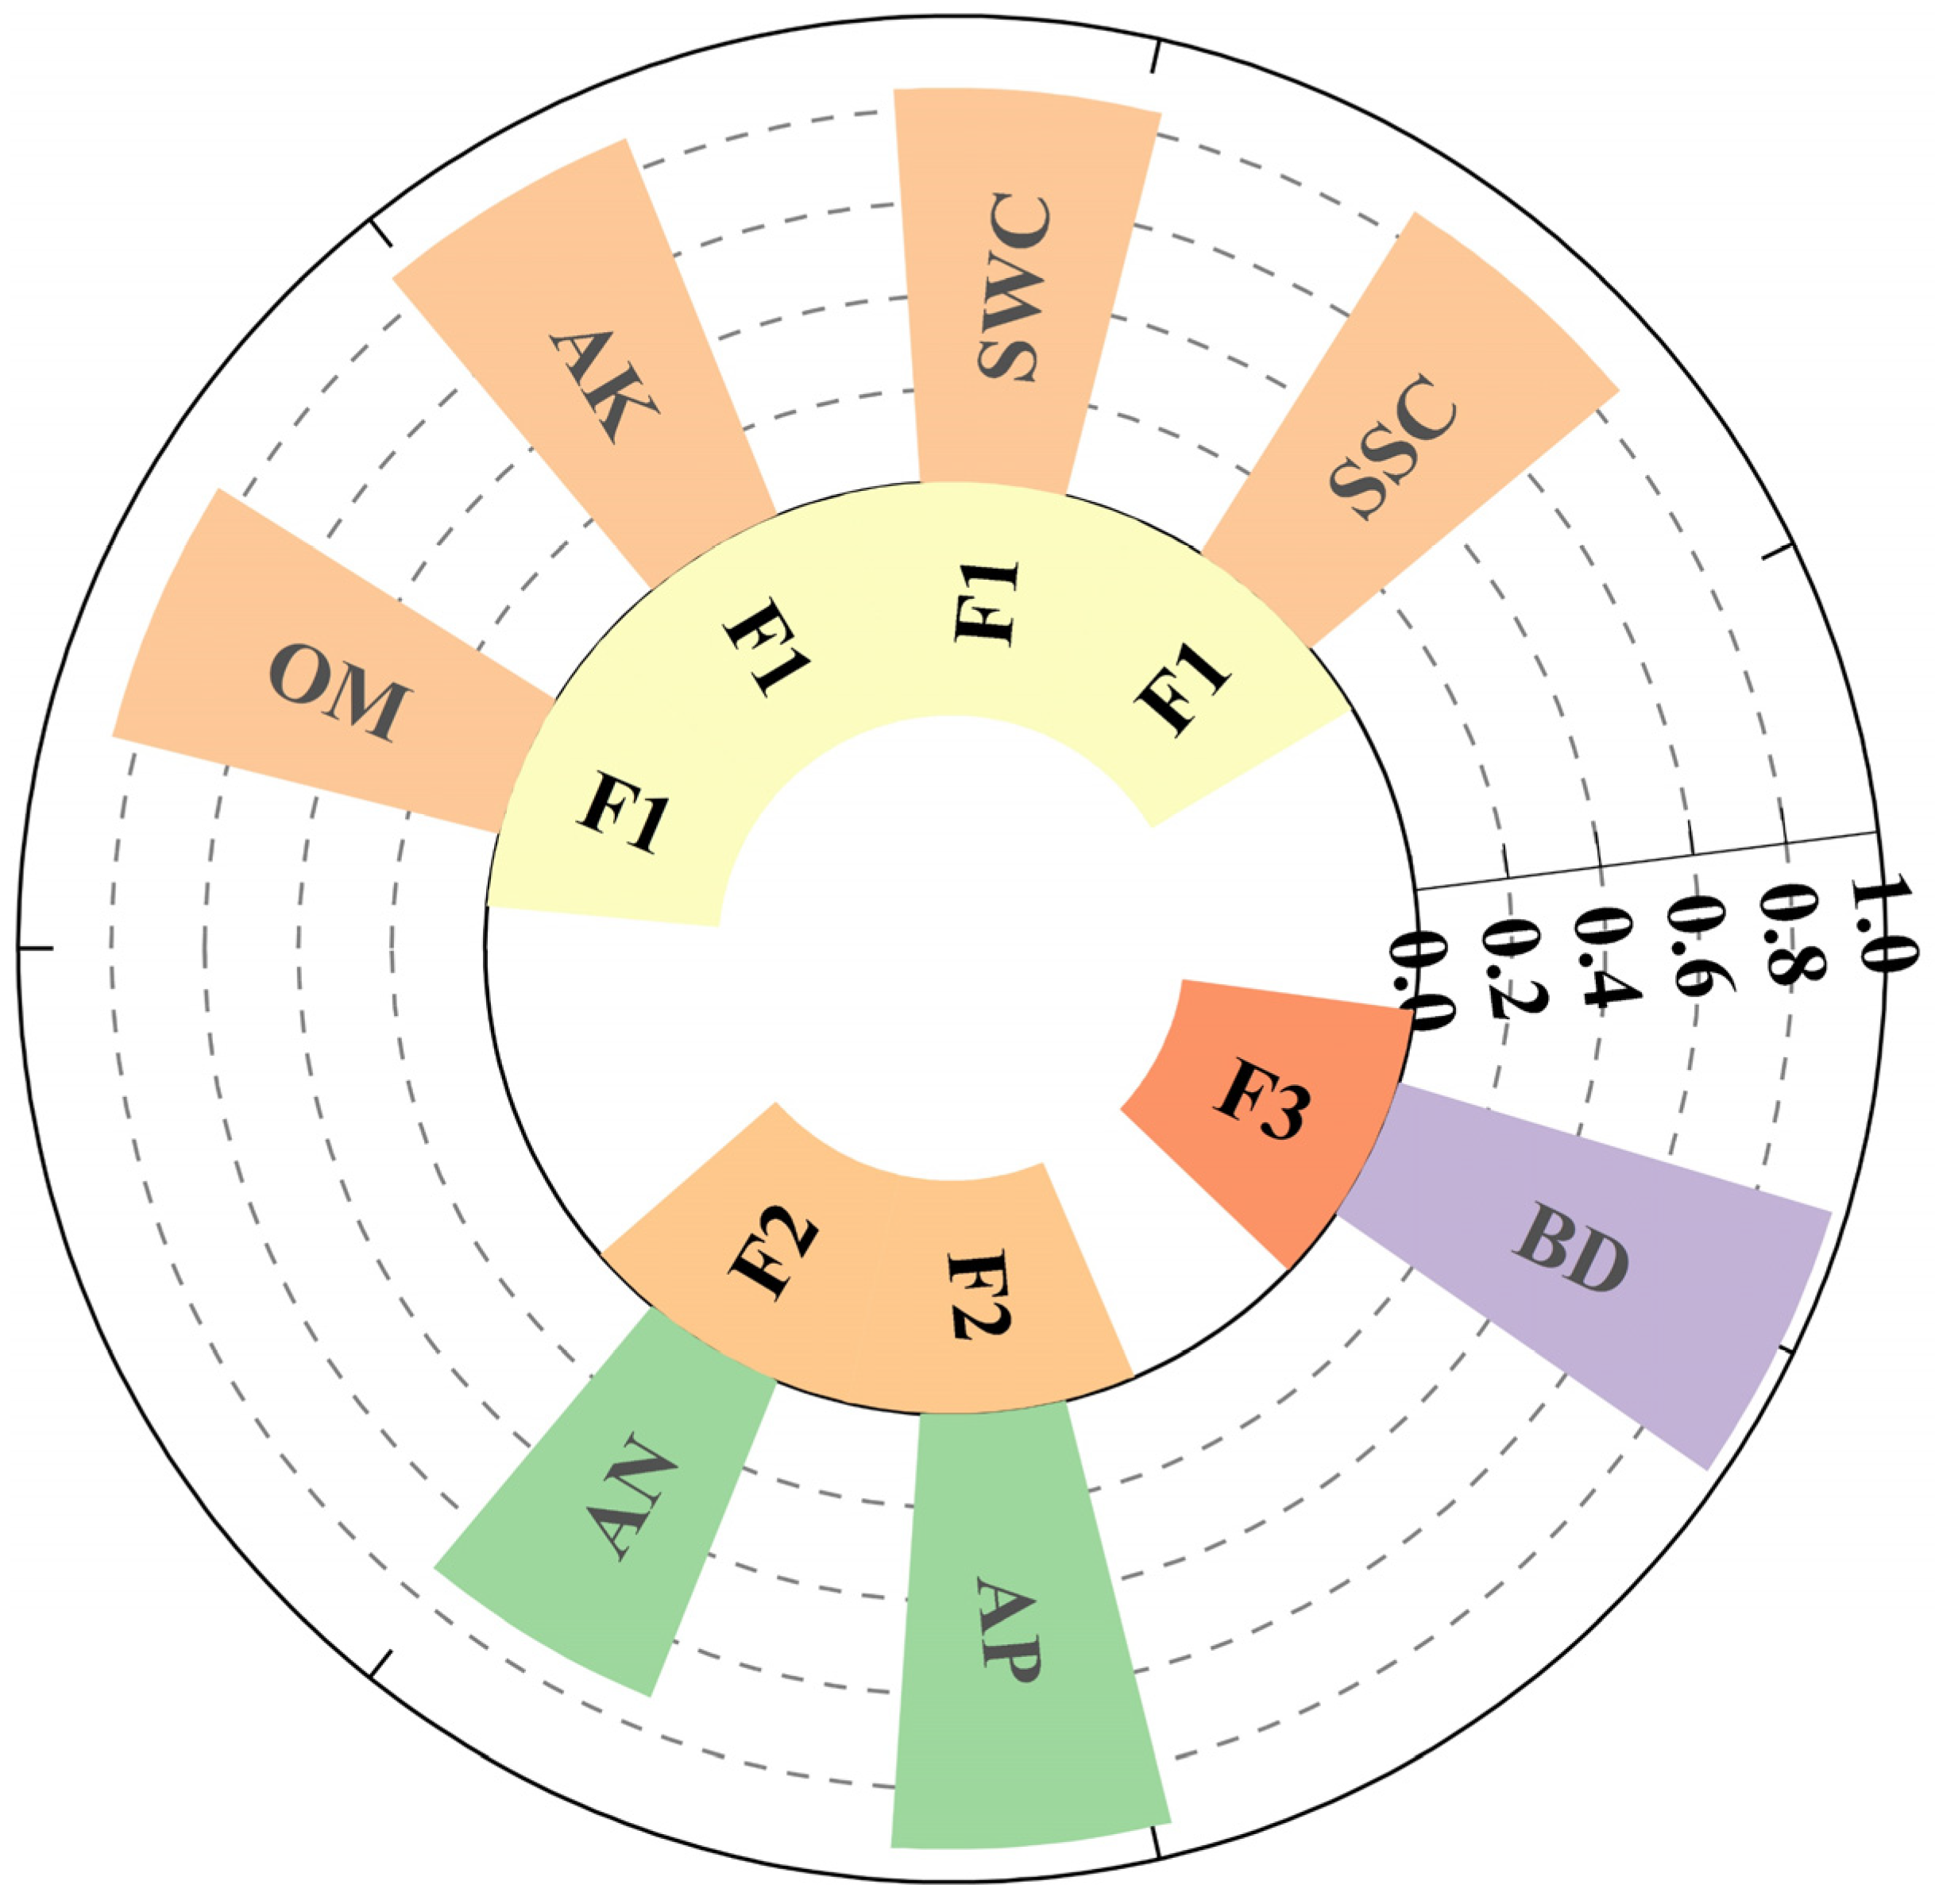
Figure 3.
Soil property index correlation coefficient (p < 0.05). Note: BD, SWC, SSC, OM, AN, AP, and AK are soil bulk density, soil water content, soil salt content, organic matter, alkali-hydrolyzed nitrogen, available phosphorus, and available potassium, respectively. The thickness of the line represents the size of the correlation.

Figure 4.
Correlations of the SQI based on the MDS and TDS; SQI linear model (A), SQI nonlinear model (B). Note: SQIL represents the linear scoring evaluation model, SQINL represents the nonlinear scoring evaluation model.
Figure 4.
Correlations of the SQI based on the MDS and TDS; SQI linear model (A), SQI nonlinear model (B). Note: SQIL represents the linear scoring evaluation model, SQINL represents the nonlinear scoring evaluation model.

Figure 5.
The SQI based on the TDS and MDS and scoring model. Varied Irrigation Water Sources (A). Varied organic fertilizer gradients (B). Note: SQIa represents average SQI, SQIL represents the linear scoring evaluation model, and SQINL represents the nonlinear scoring evaluation model.
Figure 5.
The SQI based on the TDS and MDS and scoring model. Varied Irrigation Water Sources (A). Varied organic fertilizer gradients (B). Note: SQIa represents average SQI, SQIL represents the linear scoring evaluation model, and SQINL represents the nonlinear scoring evaluation model.

Figure 6.
Fitting diagram of SQI and pakchoi yield. (A) Under different irrigation water sources. (B) Under different organic fertilizer gradients.
Figure 6.
Fitting diagram of SQI and pakchoi yield. (A) Under different irrigation water sources. (B) Under different organic fertilizer gradients.

Table 1.
Initial physical and chemical properties of soil.
| Depth (cm) | Bulk Density (g/cm3) | Mechanical Composition (%) | Alkali-Hydrolyzed Nitrogen (mg/kg) | Available Phosphorus (mg/kg) | Available Potassium (mg/kg) | Organic Matter (g/kg) | ||
|---|---|---|---|---|---|---|---|---|
| Clay | Silt | Sand | ||||||
| 0–20 | 1.45 | 5.3 | 52.5 | 42.2 | 24.34 | 41.37 | 240 | 8.10 |
| 20–40 | 1.37 | 3.3 | 32.9 | 63.8 | 13.83 | 8.79 | 144 | 5.10 |
Table 2.
Statistical analysis results of the characteristic soil property indexes. Different letters indicate significance at p < 0.05.
Table 2.
Statistical analysis results of the characteristic soil property indexes. Different letters indicate significance at p < 0.05.
| Soil Index | Max | Min | Mean | SD | Cv | Skewness | Kurtosis | K-S |
|---|---|---|---|---|---|---|---|---|
| BD (g/cm3) | 1.385 a | 1.345 c | 1.365 b | 0.011 | 0.008 | −0.116 | −0.663 | 0.998 |
| SWC (cm3/cm3) | 0.213 a | 0.064 b | 0.120 ab | 0.034 | 0.284 | 1.191 | 2.657 | 0.565 |
| SSC (g/kg) | 8.622 a | 2.357 a | 4.614 a | 1.883 | 0.408 | 1.074 | 0.120 | 0.309 |
| AN (mg/kg) | 24.898 a | 9.406 c | 18.332 b | 4.765 | 0.260 | −0.237 | −1.292 | 0.720 |
| AP (mg/kg) | 30.085 a | 2.834 b | 10.455 ab | 8.125 | 0.777 | 1.522 | 1.694 | 0.503 |
| AK (mg/kg) | 786.000 a | 98.000 a | 270.733 a | 224.342 | 0.829 | 1.500 | 0.793 | 0.072 |
| OM (g/kg) | 7.276 a | 3.374 b | 5.759 a | 1.163 | 0.202 | −0.240 | −0.863 | 0.863 |
Table 3.
Load matrix and norm values of evaluation indicators.
| Soil Index | PCA | Norm Value | Weight | |||
|---|---|---|---|---|---|---|
| 1 | 2 | 3 | TDS | MDS | ||
| BD (g/cm3) | −0.081 | −0.184 | 0.970 | 0.416 | 0.063 | 0.302 |
| SWC (cm3/cm3) | 0.846 | −0.192 | −0.102 | 2.310 | 0.122 | |
| SSC (g/kg) | 0.866 | −0.293 | −0.089 | 2.200 | 0.113 | |
| AN (mg/kg) | 0.565 | 0.731 | 0.167 | 3.398 | 0.231 | 0.326 |
| AP (mg/kg) | 0.057 | 0.932 | −0.105 | 1.819 | 0.133 | |
| AK (mg/kg) | 0.871 | −0.426 | −0.056 | 2.003 | 0.098 | |
| OM (g/kg) | 0.854 | 0.358 | 0.236 | 3.722 | 0.240 | 0.372 |
| Principal component eigenvalue | 3.282 | 1.870 | 1.058 | – | – | – |
| Contribution rate (%) | 46.886 | 26.715 | 15.112 | – | – | – |
| Accumulating contribution rate (%) | 43.826 | 73.293 | 88.713 | – | – | – |
Disclaimer/Publisher’s Note: The statements, opinions and data contained in all publications are solely those of the individual author(s) and contributor(s) and not of MDPI and/or the editor(s). MDPI and/or the editor(s) disclaim responsibility for any injury to people or property resulting from any ideas, methods, instructions or products referred to in the content. |
© 2023 by the authors. Licensee MDPI, Basel, Switzerland. This article is an open access article distributed under the terms and conditions of the Creative Commons Attribution (CC BY) license (https://creativecommons.org/licenses/by/4.0/).
Share and Cite
MDPI and ACS Style
Lin, S.; Lei, Q.; Liu, Y.; Zhao, Y.; Su, L.; Wang, Q.; Tao, W.; Deng, M. Quantifying the Impact of Organic Fertilizers on Soil Quality under Varied Irrigation Water Sources. Water 2023, 15, 3618. https://doi.org/10.3390/w15203618
AMA Style
Lin S, Lei Q, Liu Y, Zhao Y, Su L, Wang Q, Tao W, Deng M. Quantifying the Impact of Organic Fertilizers on Soil Quality under Varied Irrigation Water Sources. Water. 2023; 15(20):3618. https://doi.org/10.3390/w15203618
Chicago/Turabian StyleLin, Shudong, Qingyuan Lei, Yun Liu, Yimei Zhao, Lijun Su, Quanjiu Wang, Wanghai Tao, and Mingjiang Deng. 2023. "Quantifying the Impact of Organic Fertilizers on Soil Quality under Varied Irrigation Water Sources" Water 15, no. 20: 3618. https://doi.org/10.3390/w15203618
Note that from the first issue of 2016, this journal uses article numbers instead of page numbers. See further details here.