
Spatiotemporal Variation Characteristics and Driving Force Analysis of Precipitation Use Efficiency at the North Foot of Yinshan Mountain
1
Yinshanbeilu Grassland Eco-Hydrology National Observation and Research Station, China Institute of Water Resources and Hydropower Research, Hohhot 010020, China
2
School of Horticulture, Anhui Agricultural University, Hefei 230036, China
3
State Key Laboratory of Eco-Hydraulics in Northwest Arid Region, Xi’an University of Technology, Xi’an 710048, China
*
Author to whom correspondence should be addressed.
Water 2024, 16(1), 99; https://doi.org/10.3390/w16010099
Submission received: 16 November 2023
/
Revised: 19 December 2023
/
Accepted: 22 December 2023
/
Published: 27 December 2023
(This article belongs to the Special Issue Sustainable Management of Agricultural Water)
Abstract
:The northern foothills of Yinshan Mountain are situated in northern China’s agricultural and pastoral ecotone, serving as a crucial ecological barrier. To comprehensively assess the impact of grassland resource restoration in this region since the initiation of the Grain-for-Green conversion project in 2000, this study analyzes the spatiotemporal characteristics of precipitation use efficiency (PUE) and investigates climate-driven factors during 2001–2021. The results showed that the grassland types at the north foot of Yinshan could be divided into four categories: warm-arid, warm subtropical semidesert (WSS), warm temperate-arid, warm temperate zonal semidesert (WZS), warm temperate-semiarid, warm temperate typical steppe (WTS), and warm temperate-subhumid forest steppe (WFT). The NPP of the four grassland species were 151.34 (WSS), 196.72 (WZS), 283.33 (WTS), and 118.06 gC·m−2 (WFT), and correspondingly, the PUE of the four grassland species were 0.66 (WSS), 0.66 (WZS), 0.80 (WTS), and 0.57 gC·m−2·mm−1 (WFT). From 2001 to 2021, PUE in grassland showed an overall upward trend, rising from 0.57 to 0.99 gC·m−2·mm−1. The trend analysis found that the vegetation ecological area of the northern foot of Yinshan became better, of which 54.36% was improved and 15.72% was degraded. It is worth pointing out that WSS had the highest degree of improvement, while WFT was in a degraded state. The climate driving force analysis shows that the regional contribution of precipitation is 19.57%, temperature is 28.33%, potential evapotranspiration is 13.65%, wind speed is 10.79%, and saturated vapor pressure is 27.66%.
1. Introduction
The response of terrestrial ecosystems’ carbon and water cycles to climate change is increasingly becoming a global issue in ecology and global change science [1]. In recent decades, the extent and severity of arid areas have been expanding, posing a growing threat to ecological security and the sustainable development of grasslands [2]. How grassland ecosystems in arid and semi-arid areas respond to climate change has become the focus of research in related fields. In addition, with the rapid development of the economy and society, the interference of human activities on the grassland ecosystem is also increasing, and it is also the main driving force for the degradation or restoration of the grassland ecosystem [3].
Precipitation use efficiency (PUE) refers to the ratio of net primary productivity (NPP) of vegetation to precipitation, which is an effective index to describe the relationship between precipitation and NPP of vegetation, reflecting the utilization level of precipitation by vegetation [4]. At the same time, PUE is also an important index to reflect the carbon cycle and water cycle of the vegetation ecosystem [5]. Therefore, it is necessary to elucidate the driving mechanisms of climate change and human activities on the PUE of natural grassland to assess the functional security and stability of the grassland ecosystem [6]. In the northwest arid regions of China, precipitation is the primary direct water source for the growth of natural grassland. Using PUE to assess the health state of the regional grassland ecosystem and reveal the impact of climate change and human activities on the PUE of natural grassland in arid and semi-arid regions is one of the research hotspots to ensure the functional stability and sustainable development of the regional ecosystem [7,8].
It is generally believed that with the increase in drought degree and potential evapotranspiration, the percentage of precipitation variability and ineffective precipitation increases, while the vegetation PUE tends to decrease [9]. The response of PUE to precipitation change varies significantly among different regions and types of vegetation. For example, forest ecosystems are usually higher than grassland [10]. The PUE of vegetation in extraordinarily arid and humid areas may be lower, and the PUE of vegetation in areas with annual precipitation of 475 mm may be higher [11]. The temporal and spatial distribution of PUE was also significantly correlated with some biological characteristics of vegetation, such as vegetation coverage and leaf area index. For every 1% increase in vegetation coverage, vegetation PUE may increase by 1~2% [12]. Vegetation coverage and leaf area index had a linear relationship with PUE [13,14]. FVC could explain 20% of PUE’s spatial variation, while the LAI interpretation rate was only 7%.
The northern foot of Yinshan Mountain in Inner Mongolia has become an essential ecological barrier in northern China due to its unique geographical location and the interlocking production and lifestyle of agriculture and animal husbandry [15]. In the 1990s, ecological and environmental protection were neglected to develop the economy. Unreasonable land development and overgrazing led to soil erosion and desertification. However, since 2000, the ecological environment has been significantly improved with the implementation of the Grain-for-Green project [16]. This study mainly analyzed the change in characteristics of grassland precipitation use efficiency and the main climate-driving factors at the north foot of Yinshan Mountain since the implementation of the project. This will help to deepen the understanding of the formation process of vegetation productivity in arid regions and provide a theoretical basis for the balance of supply and demand for grass and livestock and the sustainable development of animal husbandry.
2. Materials and Methods
2.1. Study Area
The northern foot of the Yinshan Mountain agricultural and pastoral ecotone is located in the middle of Inner Mongolia, bordering the Yinshan Mountain Range to the south and the Mongolian Plateau pastoral area to the north. It spans east longitude 107°15′–116°55′ and north latitude 40°44′~43°22′, with a total area of about 96,000 km2. It includes Hude County of Wulanqab League, Chahar Right Wing Rear Banner, Chahar Right Wing Middle Banner, Chahar Right Wing Front Banner, Xinghe County, Jining City, Shangdu County, the south of Siziwang Banner, Wuchuan County of Hohhot City, Guyang County of Baotou City, and the south of Damao Banner [17]. The geomorphic features are mainly high plains, low hills, and basins, showing the structure of high in the south and low in the north. The main soil types are chestnut soil and brown calcium soil, and the soil texture is mainly sandy chestnut soil [18]. The climate is a semi-arid continental monsoon climate in the middle and temperate zone, with high wind and little rainfall throughout the year. The average annual rainfall is 200~400 mm, and most of it is concentrated in the summer. The average annual temperature is about 1.5~3.7 °C, and the wind direction is northeast [19]. Grassland types can be divided into four main categories: warm-arid, warm subtropical semidesert (WSS), warm temperate-arid, warm temperate zonal semidesert (WZS), warm temperate-semiarid, warm temperate typical steppe (WTS), and warm temperate-subhumid forest steppe (WFT). The distribution of administrative districts and grasslands at the northern foot of Yinshan Mountain is shown in Figure 1.
2.2. Research Methods
2.2.1. Primary Productivity
Based on the Carnegie–Ames–Stanford Approach (CASA) model, remote sensing, meteorological, and field survey data were used to estimate the NPP in the study area. The calculation method is as follows [20]:
where NPP(x,t) is x point t monthly net primary productivity (gC·m−2); APAR(x,t) is the photosynthetically active radiation absorbed by x point t month, MJ·m−2 month−1; ξ(x,t) refers to the actual light energy utilization rate of t month at x point, gC·MJ−1; PAR(x,t) is the photosynthetically active radiation of x point t month, which can be 50% of the total solar radiation, MJ·m−2·month−1; FPAR(x,t) is the ratio of moonlight to effective radiation absorption at x point t, %; ft(t) and fw(t) are the air temperature stress factor and water stress factor of t month in the study area, respectively, %; and ξmax is the maximum utilization rate of light energy of vegetation, g·C·MJ−1.
2.2.2. Precipitation Utilization Efficiency
The ratio of grassland net primary productivity to annual precipitation was used to calculate the precipitation utilization rate of grassland in the study area. The calculation formula was as follows [21]:
where PUE is the annual precipitation utilization efficiency (gC·m−2·mm−1) and P is the average annual precipitation (mm).
2.2.3. Trend Analysis
Theil Sen and Mann–Kendall is a non-parametric method that is usually used to detect the trend of vegetation change in a long time series. It has strong applicability to studying vegetation variability in arid and semi-arid areas. The calculation formula is as follows [22]:
where θ is the change rate of PUE and is measured in g C·m−2·mm−1, θ > 0 indicates that PUE shows an increasing trend and vice versa, and i and j represent the year. The Sen trend was tested by the Mann–Kendall test (confidence = 0.05).
2.2.4. Gray Correlation Analysis
According to the similarity degree of the geometric shape of the change curve of each factor, the correlation degree between the factors is called gray correlation analysis. Compared with regression and correlation analyses, the sample size can be as small as 4, which applies to whether the data are regular. Through the quantitative analysis of the development trend of the dynamic process, the gray correlation degree (denoted as the correlation degree) between the reference series and each comparison series is realized. The greater the correlation degree, the closer the relationship between the factors, and the smaller the vice versa [23].
Take the PUE from 2001 to 2021 as the reference sequence, denoting X0 as:
The five climate change factors (precipitation, air temperature, potential evapotranspiration, wind speed, and vapor pressure deficit) corresponding to the sequence are taken as the comparison sequence. k is the year sequence, and n is the total number of years. Remember:
Dimensionless variables:
where i is the sequence of variables and m is the total number of variables. The processing process is as follows: select the indicators of the first year as the base and divide all the indicators of subsequent years by the first year’s data.
Calculate the correlation coefficient between xi(k) and x(k):
where is the resolution coefficient. The smaller the , the greater the resolution. The general value is (0,1); when ≤0.5463, the resolution is the best, usually = 0.5.
Calculate the correlation degree:
2.2.5. Data Sources
In order to expedite the preprocessing of extensive remote sensing images spanning from 2001 to 2021 within the study area, we opted for Google Earth Engine (GEE) as our primary research platform. The utilized datasets in this study encompassed normalized difference vegetation index (NDVI), meteorological data, and land-cover data, detailed in Table 1.
3. Results and Discussion
3.1. Spatiotemporal Characteristics of PUE
3.1.1. Spatial Pattern of NPP and PUE
The NPP of the grassland at the north foot of Yinshan was calculated according to Equations (1)–(3), and the PUE of the grassland at the north foot of Yinshan was calculated according to Equation (4). The calculation results are shown in Figure 2. The NPP range of the grassland at the north foot of Yinshan Mountain was 43.46~527.30 gC·m−2, and the overall average was 165.16 gC·m−2, among which the four types of grassland WSS, WZS, WTS, and WFT were 151.34, 196.72, 283.33, and 118.06 gC·m−2, respectively. The PUE ranges from 0.27 to 1.59 gC·m−2·mm−1, and the mean value is 0.68 gC·m−2·mm−1, among which WSS, WZS, WTS, and WFT are 0.66, 0.66, 0.80, and 0.57 gC·m−2·mm−1, respectively. This finding closely aligns with the results reported by Mu et al., who determined that the mean PUE of grassland vegetation in northwest China was 0.68 gC·m−2·mm−1 [24].
The areas with large PUE were distributed in the southern part of Wuchuan County, the central part of Siziwang Banner, the southern part of Chahar Right Wing Middle Banner, Taiwusi County, Duolun County, etc. Figure 3 shows the four grassland types at the north foot of Yinshan Mountain and their overall PUE distribution. The PUE of WTS was higher than that of other types, and the WFT was lower than that of other types.
3.1.2. Interannual Variation of PUE in Grassland
Figure 4 shows the interannual variation characteristics of PUE in grassland from 2001 to 2021 at the northern foot of Yinshan Mountain. PUE showed an upward trend from 0.57 to 0.99 gC·m−2·mm−1. WSS increased from 0.49 to 0.91, WZS from 0.58 to 0.91, WTS from 0.54 to 1.01, and WFT from 0.65 to 0.97. The PUE change rates of the four types of grassland were 0.020, 0.019, 0.022, and 0.015 gC·m−2·mm−1·yr−1, respectively. It can be seen that since the national implementation of the project of returning farmland to forest and grassland in 2000, grassland resources have been effectively restored, precipitation utilization efficiency has been increased, and the project has effectively improved the ecological environment.
3.1.3. Spatial Variation Trend of PUE in Grassland
According to Equation (5), the PUE variation trend of the north foot of Yinshan Mountain from 2001 to 2021 was calculated. The results are shown in Figure 5. The average θ value of the whole north foot of Yinshan is 0.24, which tends to be slightly improved. Specifically, 54.36% of the areas were improved, of which 17.83% were significantly improved and 36.53% were slightly improved. 15.72% of the areas were degraded, of which 6.16% were significantly degraded and 9.56% were slightly degraded. At the same time, 29.92% of the regions had no noticeable change trend. The areas tending to improve were mainly distributed in the west at the northern foot of Yinshan Mountain, while the areas of regional degradation were mainly in the east. Analysis of the four grassland types showed that WZS was 0.30, WTS was 0.26, WFT was −0.02, and WSS was 0.42.
3.2. Response of PUE to Climate Factors
3.2.1. Spatial Distribution of Climate Factors
The spatial distribution of mean precipitation, temperature, potential evapotranspiration, wind speed, and saturated water vapor pressure at the northern foot of Yinshan Mountain from 2001 to 2021 is shown in Figure 6. The results show that the average annual precipitation in this region is 104.19~423.33 mm, and the spatial trend is low in the north and high in the south. The areas with large precipitation are mainly distributed in Taiwusi Banner and Duolun County. The annual average temperature ranges from 2.90 °C to 10.07 °C, with high temperatures mainly in the northern desert area and low temperatures mainly in the southern mountain area. During 2001–2021, the regional mean precipitation decreased by 10.77 mm and the regional mean temperature increased by 1.01 °C. Therefore, the climate in this region tends to be warmer and drier. The annual average evapotranspiration is 809.70–1269.46 mm, which has increased by 53.01mm in the past 20 years. The regional annual average wind speed is 2.75–4.11 m/s, which has increased by 0.24 m/s in the past 20 years. From the spatial distribution, the potential evapotranspiration and wind speed are high in the north and low in the south. In addition, the average regional saturated water vapor pressure increased from 4.95 to 5.03 hPa.
3.2.2. Correlation
In order to analyze the correlation between precipitation use efficiency and various climatic factors (precipitation, temperature, evapotranspiration, wind speed, and saturated water vapor pressure) during 2001–2021. In this study, the average value of each grid point was statistically analyzed. The results are shown in Figure 7. The results showed that precipitation use efficiency is positively correlated with precipitation, wind speed, and saturated vapor pressure but negatively correlated with air temperature and potential evapotranspiration. The factor with strong correlation is potential evapotranspiration, which presents a power function relationship, and the correlation coefficient reaches 0.51. The second is temperature, which presents an exponential function relationship with a correlation coefficient of 0.44. The correlation between precipitation, saturated vapor pressure, and wind speed is not obvious, and the correlation coefficients are 0.22, 0.13, and 0.02, respectively.
In theory, the PUE should exhibit an inverse relationship with the severity of drought, as the proportion of ineffective precipitation tends to increase in drier climates [25]. However, the association between PUE and precipitation varies across different regions and ecosystems. Research indicated that PUE rises with increasing precipitation in arid areas characterized by annual rainfall below 600 mm and dominated by desert or steppe vegetation types [26]. This is consistent with the results of this study. Conversely, in regions where annual precipitation is less than 1500 mm and tropical savannas dominate the vegetation type, vegetation NPP demonstrates a linear growth pattern with precipitation while PUE remains relatively constant [27]. Moreover, extremely arid areas receiving less than 100 mm of annual rainfall and humid areas experiencing over 650 mm of annual rainfall show a declining trend in PUE as precipitation increases [28].
The air temperature is a crucial meteorological factor that influences grassland PUE by regulating photosynthesis, evapotranspiration, and the water balance of plants. On one hand, an increase in temperature can enhance the atmospheric water vapor pressure difference, thereby accelerating plant evapotranspiration and increasing grassland water consumption, ultimately reducing PUE. This effect is particularly pronounced in arid or semi-arid grasslands due to their limited access to water and heightened sensitivity to changes in vapor pressure [29,30]. Conversely, higher temperatures can stimulate plant photosynthesis and boost grassland productivity, leading to an increase in PUE. This effect is more prominent in temperate or alpine regions where grasslands are highly responsive to temperature variations as they are constrained by thermal conditions [31]. Temperature elevation can also alter the phenology of grasslands by advancing the growing season and prolonging the growth period. Consequently, this enhances primary productivity and improves PUE. Such effects are especially noticeable in areas with distinct seasons since these grasslands have limited phenological flexibility and are sensitive to changes in phenology. Therefore, it is essential to comprehensively consider the complex interaction between air temperature and other meteorological factors (such as precipitation, solar radiation, and wind speed) when studying their impact on PUE.
3.2.3. Controlling Factors
The correlation between PUE and precipitation, air temperature, potential evapotranspiration, wind speed, and saturated vapor pressure was calculated according to Equations (6)–(11). Each grid point’s most important control factors were obtained by comparing the spatial correlation, and their spatial distribution characteristics are shown in Figure 8. The results show that the area with the greatest correlation with precipitation (Guyang County) accounts for 19.57%, the area with the most remarkable correlation with air temperature (Wuchuan County, the Middle Banner of the Right Wing of Chahar, the south of the Late Banner of the Right Wing of Chahar, and the east of Taiwusi Banner) accounts for 28.33%, and the area with the most significant correlation with potential evapotranspiration (Damao Banner and the east of Siziwang Banner) accounts for 13.65%. The area with the greatest correlation with wind speed (east of Damao Banner) accounts for 10.79%, and the area with the most excellent correlation with saturated water vapor pressure (west of Damao Banner, west of Siziwang Banner, middle of Chahar Right Wing, and north of Late Chahar Right Wing, Shangdu County, Huad County, and Duolun County) accounts for 27.66%.
3.3. The Effect of Terrain on PUE
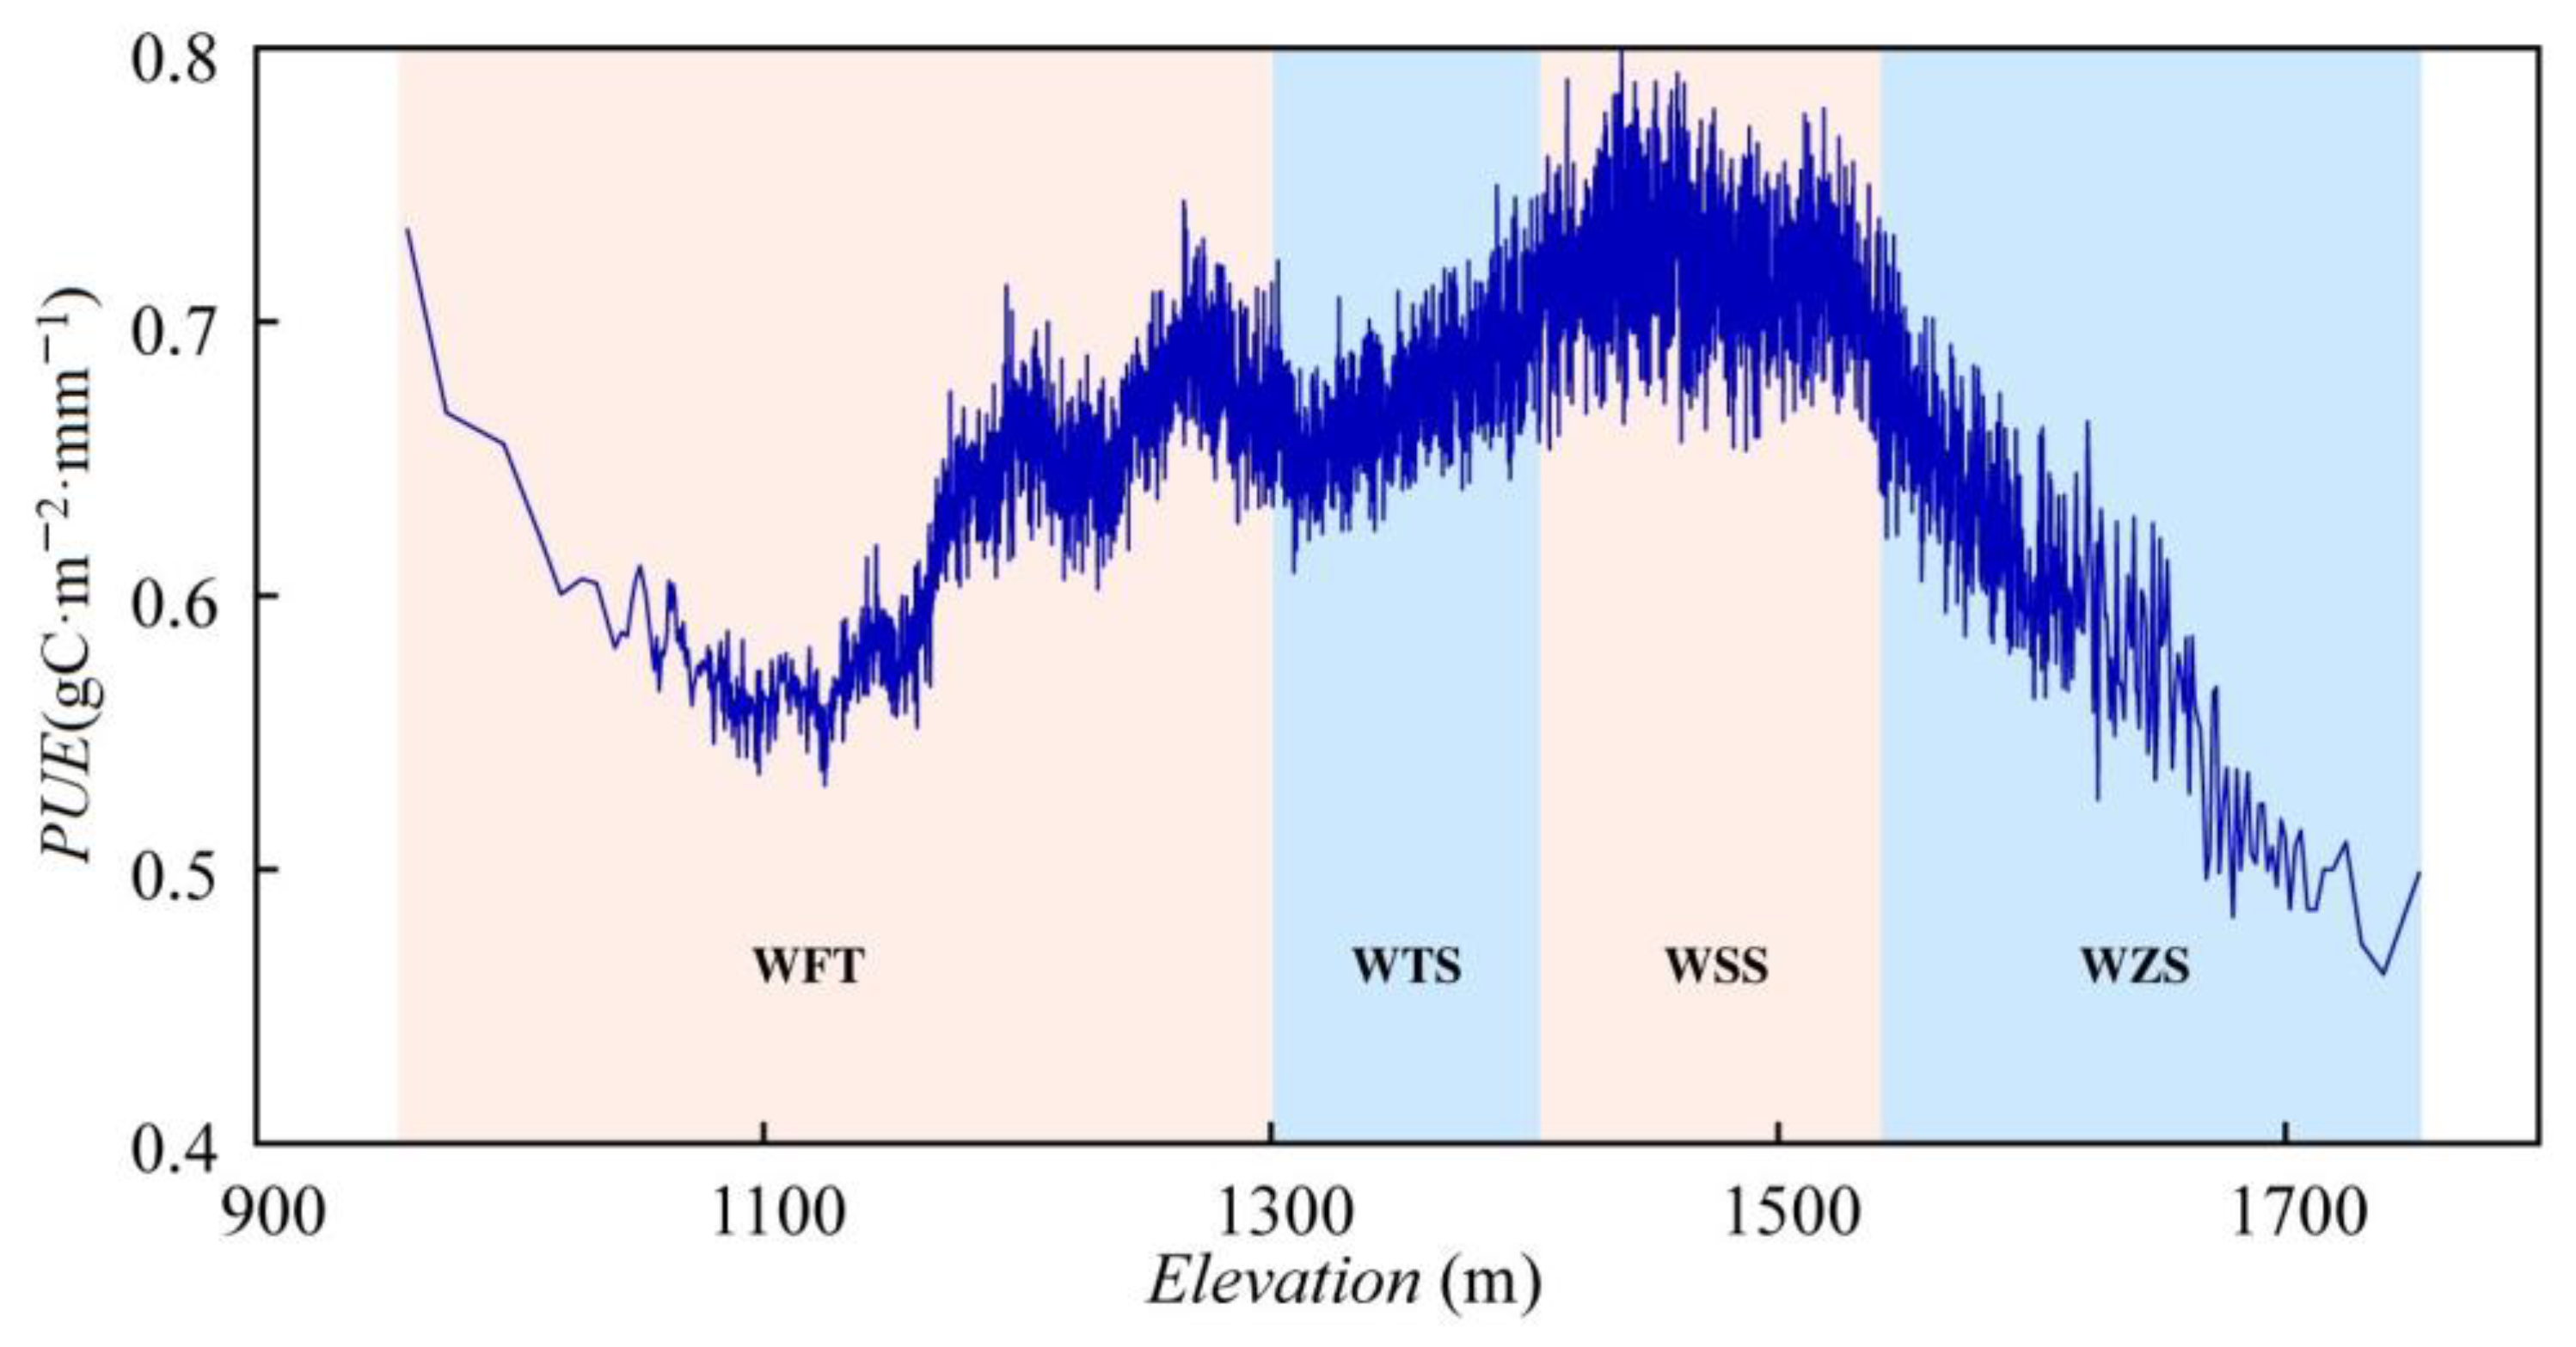
The altitude has a significant effect on grassland type and climate conditions. The characteristics of water use efficiency at different altitudes are shown in Figure 9. The grassland types, namely WSS, WZS, WTS, and WFT, were distributed at elevations ranging from 1400 to 1550 m, 1550 to 1760 m, 1300 to 1400 m, and 950 to 1300 m, respectively. Overall, there was an altitude-dependent trend observed in the photosynthetic use efficiency (PUE), with a peak value occurring around an elevation of approximately 1450 m, which corresponds to the primary growth zone of the WSS grassland type. The higher elevation region represents a mountainous area with an average altitude of about 1700 m where PUE remains below the threshold of 0.5 gC·m−2·mm−1; this area is recognized as the predominant habitat for the growth of WZS grassland types. Furthermore, PUE exhibits relatively lower values in areas situated around an altitude of approximately 1100 m above sea level due to their desert-like characteristics characterized by high evaporation rates and significant soil water loss.
Changes in elevation result in decreased temperatures, increased precipitation, and reduced solar radiation, all of which influence photosynthesis and evapotranspiration processes in grasslands, consequently impacting PUE. Generally speaking, elevated regions tend to have lower PUE values in grasslands since productivity is limited by photosynthesis while water consumption is influenced by evapotranspiration. Alterations in elevation can also lead to shifts in species composition and functional traits within grasslands that further affect PUE. Alpine grassland species typically exhibit lower PUE due to their reduced photosynthetic capacity and higher water requirements compared to their low-elevation counterparts with higher photosynthetic capacity and lower water demands. Additionally, changes in elevation affect soil properties and microbial activity within the grassland ecosystem, which subsequently influence PUE. Typically, high-altitude grasslands possess a higher soil moisture content, favoring efficient water utilization, whereas low-altitude ones have a lower soil moisture content, hindering optimal water use efficiency. Moreover, high-altitude grasslands exhibit a low carbon-to-nitrogen ratio, promoting enhanced decomposition by soil microorganisms, while low-altitude ones display a high carbon-to-nitrogen ratio, impeding decomposition rates by these organisms. These factors collectively impact the carbon cycle and nitrogen cycle within the grassland system, thus influencing the overall PUE [32,33].
3.4. Strategies for Improving PUE
3.4.1. Rainwater Harvesting
Rainwater harvesting is a technique for the collection and storage of rainwater to be utilized at a later time. This approach can effectively facilitate grassland irrigation during periods of drought, thereby enhancing precipitation utilization efficiency. Various methods can be employed to implement rainwater harvesting, including the utilization of rain barrels, cisterns, and rain gardens. Rain barrels are receptacles positioned beneath downspouts to accumulate rainwater from rooftops. The collected water can subsequently be employed for grassland irrigation during dry spells. Cisterns, on the other hand, are larger containers capable of storing greater volumes of water compared to rain barrels. Typically situated underground, they serve as reservoirs for substantial quantities of harvested rainfall. Rain gardens encompass designated areas within the grassland that are specifically designed to collect and absorb rainwater. These regions are typically planted with indigenous flora possessing high water absorption capacities. In arid regions, rainwater harvesting represents an effective means by which precipitation utilization efficiency in grasslands is enhanced. By collecting and storing rainfall, it becomes possible to irrigate the grassland during dry periods while concurrently optimizing precipitation usage efficiency.
3.4.2. Drought-Tolerant Grass
Planting drought-tolerant grass is an effective strategy to enhance the precipitation utilization efficiency of grassland, thereby reducing water evaporation, increasing soil moisture content, improving soil structure, and enhancing both the productivity and ecological function of grasslands. The selection of suitable varieties is crucial, considering different regions and conditions. Generally, drought-tolerant grasses possess the following characteristics:
- -
- Well-developed roots that can penetrate deep into the soil for efficient water uptake.
- -
- Smaller leaves with reduced surface area to minimize water loss.
- -
- Thick cuticles on leaves with more stomata in epidermal cells regulate stomatal opening and closing in response to arid environments.
- -
- Ability to synthesize and accumulate osmotic regulatory substances like proline and trehalose, which improve cell osmotic potential and maintain cellular hydration.
- -
- Activation of antioxidant enzyme systems that eliminate reactive oxygen species and mitigate oxidative damage caused by drought stress.
Based on these characteristics, some common drought-tolerant grasses suitable for cultivation in arid grassland zones include yellow clover, sweet clover, Sandawang, fescue, bluegrass, and Artemisia sinensis. For wind-sand semi-arid areas, suitable plants for planting are Artemisia alba, Artemisia oleifera, Caragana caragana, Helianthus annuus, and Muhlenbergia capillaris. In desert dune areas, suitable plants for cultivation are Artemisia annua and Caragana species, along with Haloxylon species and Tamarindus indica. Additionally, prickly thorn plants and shrubs such as Salix Draco and Populus euphratica can also be cultivated.
3.4.3. Grazing Management
Grazing intensity has a significant impact on grassland resources, so it is very important to adopt a scientific and reasonable grazing strategy. Continuous grazing (CG) is a low-intensity grazing strategy that enables unrestricted livestock grazing on grassland throughout the entire season. CG tends to decrease PUE by reducing NPP and increasing soil compaction and runoff. Rotational grazing (RG), a moderate-intensity strategy, involves dividing the grassland into multiple pastures and rotating livestock among them for weeks or months. RG can enhance PUE by promoting NPP, facilitating grass recovery, and restoring soil health. Management-intensive grazing (MIG), a high-intensity strategy, utilizes more paddocks per herd with shorter grazing periods of days or hours. MIG can optimize PUE by maximizing NPP while minimizing soil disturbance and water loss. Therefore, to enhance grassland PUE, it is recommended to adopt a grazing strategy that balances intensity with an adequate grass recovery period, such as RG or MIG. However, determining the optimal grazing strategy may also depend on other factors, including grassland type, climate conditions, livestock species, and management objectives.
4. Conclusions
In this study, the NPP of the northern foot of Yinshan was obtained through CASA calculation, and the spatiotemporal variation characteristics of PUE during 2001–2021 were analyzed in conjunction with precipitation data. The main findings are as follows:
- (1)
- NPP and PUE have obvious spatial differentiation at the north foot of Yinshan Mountain. The average NPP and PUE at the northern foot of Yinshan Mountain are 165.16 gC·m−2 and 0.68 gC·m−2·mm−1, respectively. Among the four types of grassland resources, WTS exhibited the highest precipitation use efficiency, while WFT showed the lowest efficiency. Areas with higher PUE values are predominantly located in southern regions such as Wuchuan County, Siziwang Banner, Chahar Right Wing Middle Banner, Taiwusi County, and Duolun County.
- (2)
- From 2001 to 2021, the PUE at the northern foot of Yinshan showed an overall increasing trend. The mean PUE increased from 0.57 to 0.99 gC·m−2·mm−1, with WTS showing a significant increase (almost doubling), which indicated that vegetation restoration had been effectively achieved since the implementation of the project for returning farmland to forest and grassland in 2000.
- (3)
- There is an obvious correlation between PUE and climate factors. Precipitation contributed to a rise in PUE by approximately 19.57%, followed by air temperature (28.33%) and saturated water vapor pressure (27.66%) at the northern foot of Yinshan Mountain during this period. Potential evapotranspiration and wind speed had relatively smaller contributions at around 10.79% and 13.65%, respectively.
Author Contributions
Conceptualization, W.T. and Y.Y.; methodology, Y.Y. and W.T.; software, W.T. and Y.S.; validation, H.L., Y.Y. and W.T.; formal analysis, Y.Y.; writing—original draft preparation, Y.Y.; writing—review and editing, W.T. and H.L.; visualization, Y.Y., Y.S. and H.L; funding acquisition, W.T. All authors have read and agreed to the published version of the manuscript.
Funding
This research was funded by the Yinshanbeilu Grassland Eco-hydrology National Observation and Research Station, China Institute of Water Resources and Hydropower Research, Beijing 100038, China, Grant No. YSS2022010; and “Light of the West” Young Scholar Program of the Chinese Academy of Science, Grant No. MK0143A022022.
Data Availability Statement
The data supporting this study’s findings are available from the corresponding author upon reasonable request.
Conflicts of Interest
The authors declare no conflict of interest.
References
- Stewart, R.I.A.; Dossena, M.; Bohan, D.A.; Jeppesen, E.; Kordas, R.L.; Ledger, M.E.; Meerhoff, M.; Moss, B.; Mulder, C.; Shurin, J.B.; et al. Mesocosm Experiments as a Tool for Ecological Climate-Change Research. Adv. Ecol. Res. 2013, 48, 71–181. [Google Scholar]
- Wang, L.; Anna, H.; Zhang, L.; Xiao, Y.; Wang, Y.; Xiao, Y.; Liu, J.; Ouyang, Z. Spatial and Temporal Changes of Arable Land Driven by Urbanization and Ecological Restoration in China. Chin. Geogr. Sci. 2019, 29, 809–819. [Google Scholar] [CrossRef]
- Han, Z.; Song, W.; Deng, X.; Xu, X. Grassland Ecosystem Responses to Climate Change and Human Activities within the Three-River Headwaters Region of China. Sci. Rep. 2018, 8, 9079. [Google Scholar] [CrossRef] [PubMed]
- Zeng, X. Water and Nutrient Use Efficiencies of Stipa Purpurea Griseb. along a Precipitation Gradient of the Tibetan Plateau. Plant Soil Environ. 2023, 69, 230–237. [Google Scholar] [CrossRef]
- Ito, A.; Inatomi, M. Water-Use Efficiency of the Terrestrial Biosphere: A Model Analysis Focusing on Interactions between the Global Carbon and Water Cycles. J. Hydrometeorol. 2012, 13, 681–694. [Google Scholar] [CrossRef]
- Yu, H.; Ding, Q.; Meng, B.; Lv, Y.; Liu, C.; Zhang, X.; Sun, Y.; Li, M.; Yi, S. The Relative Contributions of Climate and Grazing on the Dynamics of Grassland NPP and PUE on the Qinghai-Tibet Plateau. Remote Sens. 2021, 13, 3424. [Google Scholar] [CrossRef]
- Zhou, T.; Liu, M.; Sun, J.; Li, Y.; Shi, P.; Tsunekawa, A.; Zhou, H.; Yi, S.; Xue, X. The Patterns and Mechanisms of Precipitation Use Efficiency in Alpine Grasslands on the Tibetan Plateau. Agric. Ecosyst. Environ. 2020, 292, 106833. [Google Scholar] [CrossRef]
- Zhao, Y.; Wang, X.; Vázquez-Jiménez, R. Evaluating the Performance of Remote Sensed Rain-Use Efficiency as an Indicator of Ecosystem Functioning in Semi-Arid Ecosystems. Int. J. Remote Sens. 2018, 39, 3344–3362. [Google Scholar] [CrossRef]
- Mousavi-Baygi, M.; Bannayan, M.; Ashraf, B.; AsadiOskuei, E. Assessment of Climatic Indices Limiting Rainfed Wheat Yield. Ecol. Indic. 2016, 62, 298–305. [Google Scholar] [CrossRef]
- Holzman, M.E.; Carmona, F.; Rivas, R.; Niclòs, R. Early Assessment of Crop Yield from Remotely Sensed Water Stress and Solar Radiation Data. ISPRS J. Photogramm. Remote Sens. 2018, 145, 297–308. [Google Scholar] [CrossRef]
- Liu, X.; Lai, Q.; Yin, S.; Bao, Y.; Qing, S.; Bayarsaikhan, S.; Bu, L.; Mei, L.; Li, Z.; Niu, J.; et al. Exploring Grassland Ecosystem Water Use Efficiency Using Indicators of Precipitation and Soil Moisture across the Mongolian Plateau. Ecol. Indic. 2022, 142, 109207. [Google Scholar] [CrossRef]
- Ren, Z.; Qiao, H.; Xiong, P.; Peng, J.; Wang, B.; Wang, K. Characteristics and Driving Factors of Precipitation-Use Efficiency across Diverse Grasslands in Chinese Loess Plateau. Agronomy 2023, 13, 2296. [Google Scholar] [CrossRef]
- Zhao, J.; Li, J.; Liu, Q.; Xu, B.; Yu, W.; Lin, S.; Hu, Z. Estimating Fractional Vegetation Cover from Leaf Area Index and Clumping Index Based on the Gap Probability Theory. Int. J. Appl. Earth Obs. Geoinf. 2020, 90, 102112. [Google Scholar] [CrossRef]
- Paruelo, J.M.; Lauenroth, W.K.; Burke, I.C.; Sala, O.E. Grassland Precipitation-Use Efficiency Varies Across a Resource Gradient. Ecosystems 1999, 2, 64–68. [Google Scholar] [CrossRef]
- Li, S.; An, P.; Pan, Z.; Wang, F.; Li, X.; Liu, Y. Farmers’ Initiative on Adaptation to Climate Change in the Northern Agro-Pastoral Ecotone. Int. J. Disaster Risk Reduct. 2015, 12, 278–284. [Google Scholar] [CrossRef]
- He, J.; Jiang, X.; Lei, Y.; Cai, W.; Zhang, J. Temporal and Spatial Variation and Driving Forces of Soil Erosion on the Loess Plateau before and after the Implementation of the Grain-for-Green Project: A Case Study in the Yanhe River Basin, China. Int. J. Environ. Res. Public Health 2022, 19, 8446. [Google Scholar] [CrossRef] [PubMed]
- Guo, X.-Y.; Li, J.; Jia, Y.-H.; Yuan, G.-L.; Zheng, J.-L.; Liu, Z.-J. Geochemistry Process from Weathering Rocks to Soils: Perspective of an Ecological Geology Survey in China. Sustainability 2023, 15, 1002. [Google Scholar] [CrossRef]
- Wuyun, D.; Sun, L.; Chen, Z.; Hou, A.; Crusiol, L.G.T.; Yu, L.; Chen, R.; Sun, Z. The Spatiotemporal Change of Cropland and Its Impact on Vegetation Dynamics in the Farming-Pastoral Ecotone of Northern China. Sci. Total Environ. 2022, 805, 150286. [Google Scholar] [CrossRef]
- Wang, S.; Wang, W.; Wu, Y.; Li, W.; Zhao, S.; Chen, Z. Effects of a Changing Climate and Anthropogenic Impacts on Net Primary Production in Yinshanbeilu, Inner Mongolia, China. Environ. Impact Assess. Rev. 2023, 102, 107185. [Google Scholar] [CrossRef]
- Wu, C.; Chen, K.; Chongyi, E.; You, X.; He, D.; Hu, L.; Liu, B.; Wang, R.; Shi, Y.; Li, C.; et al. Improved CASA Model Based on Satellite Remote Sensing Data: Simulating Net Primary Productivity of Qinghai Lake Basin Alpine Grassland. Geosci. Model Dev. 2022, 15, 6919–6933. [Google Scholar] [CrossRef]
- Jiang, T.; Wang, X.; Afzal, M.M.; Sun, L.; Luo, Y. Vegetation Productivity and Precipitation Use Efficiency across the Yellow River Basin: Spatial Patterns and Controls. Remote Sens. 2022, 14, 5074. [Google Scholar] [CrossRef]
- Zhou, J.; Deitch, M.J.; Grunwald, S.; Screaton, E. Do the Mann-Kendall Test and Theil-Sen Slope Fail to Inform Trend Significance and Magnitude in Hydrology? Hydrol. Sci. J. 2023, 68, 1241–1249. [Google Scholar] [CrossRef]
- Sun, Y.; Liu, S.; Li, L. Grey Correlation Analysis of Transportation Carbon Emissions under the Background of Carbon Peak and Carbon Neutrality. Energies 2022, 15, 3064. [Google Scholar] [CrossRef]
- Mu, S.; You, Y.; Zhu, C.; Zhou, K. Spatio-Temporal Patterns of Precipitation-Use Efficiency of Grassland in Northwestern China. Acta Ecol. Sin. 2017, 37, 1458–1471. [Google Scholar]
- Zhang, X.; Susan Moran, M.; Zhao, X.; Liu, S.; Zhou, T.; Ponce-Campos, G.E.; Liu, F. Impact of Prolonged Drought on Rainfall Use Efficiency Using MODIS Data across China in the Early 21st Century. Remote Sens. Environ. 2014, 150, 188–197. [Google Scholar] [CrossRef]
- Yang, Y.; Fang, J.; Fay, P.A.; Bell, J.E.; Ji, C. Rain Use Efficiency across a Precipitation Gradient on the Tibetan Plateau. Geophys. Res. Lett. 2010, 37, L15702. [Google Scholar] [CrossRef]
- Lauenroth, W.K.; Burke, I.C.; Paruelo, J.M. Patterns of Production and Precipitation-Use Efficiency of Winter Wheat and Native Grasslands in the Central Great Plains of the United States. Ecosystems 2000, 3, 344–351. [Google Scholar] [CrossRef]
- Bai, Y.; Wu, J.; Xing, Q.; Pan, Q.; Huang, J.; Yang, D.; Han, X. Primary Production and Rain Use Efficiency across a Precipitation Gradient on the Mongolia Plateau. Ecology 2008, 89, 2140–2153. [Google Scholar] [CrossRef] [PubMed]
- Hua, Y.; Ma, X.; Siqin, B. Spatial and Temporal Characteristics of Precipitation Utilization Efficiency of Desert Steppe Vegetation in Inner Mongolia. J. Desert Res. 2021, 41, 51–58. [Google Scholar]
- Ye, H.; Wang, J.; Huang, M.; Qi, S. Spatial Pattern of Vegetation Precipitation Use Efficiency and Its Response to Precipitation and Temperature on the Qinghai-Xizang Plateau of China. Chin. J. Plant Ecol. 2012, 36, 1237–1247. [Google Scholar] [CrossRef]
- Han, D.; Zhang, F.; Chen, J.; Li, Y.; Lu, Q. Characteristics of Grassland Evapotranspiration in Semi-Arid Area and Its Responses to Meteorological Factors and Vegetation. Acta Agrestia Sin. 2021, 29, 166–173. [Google Scholar]
- Du, X.; Zhao, X.; Wang, H.; He, B. Responses of Terrestrial Ecosystem Water Use Efficiency to Climate Change: A Review. Acta Ecol. Sin. 2018, 38, 8296–8305. [Google Scholar]
- Wang, Y.; Lv, W.; Xue, K.; Wang, S.; Zhang, L.; Hu, R.; Zeng, H.; Xu, X.; Li, Y.; Jiang, L.; et al. Grassland Changes and Adaptive Management on the Qinghai–Tibetan Plateau. Nat. Rev. Earth Environ. 2022, 3, 668–683. [Google Scholar] [CrossRef]
Figure 1.
Distribution of grassland resources at the north foot of Yinshan Mountain.

Figure 2.
Annual average (a) NPP and (b) PUE spatial distribution of grassland at the north foot of Yinshan.
Figure 2.
Annual average (a) NPP and (b) PUE spatial distribution of grassland at the north foot of Yinshan.

Figure 3.
PUE probability distribution at the north foot of Yinshan Mountain. WSS represents warm-arid, warm subtropical semidesert, WZS represents warm temperate-arid, warm temperate zonal semidesert, WTS represents warm temperate-semiarid, warm temperate typical steppe, WFT represents warm temperate-subhumid forest steppe, and NPYM represents the mean PUE of north foot of Yinshan Mountain.
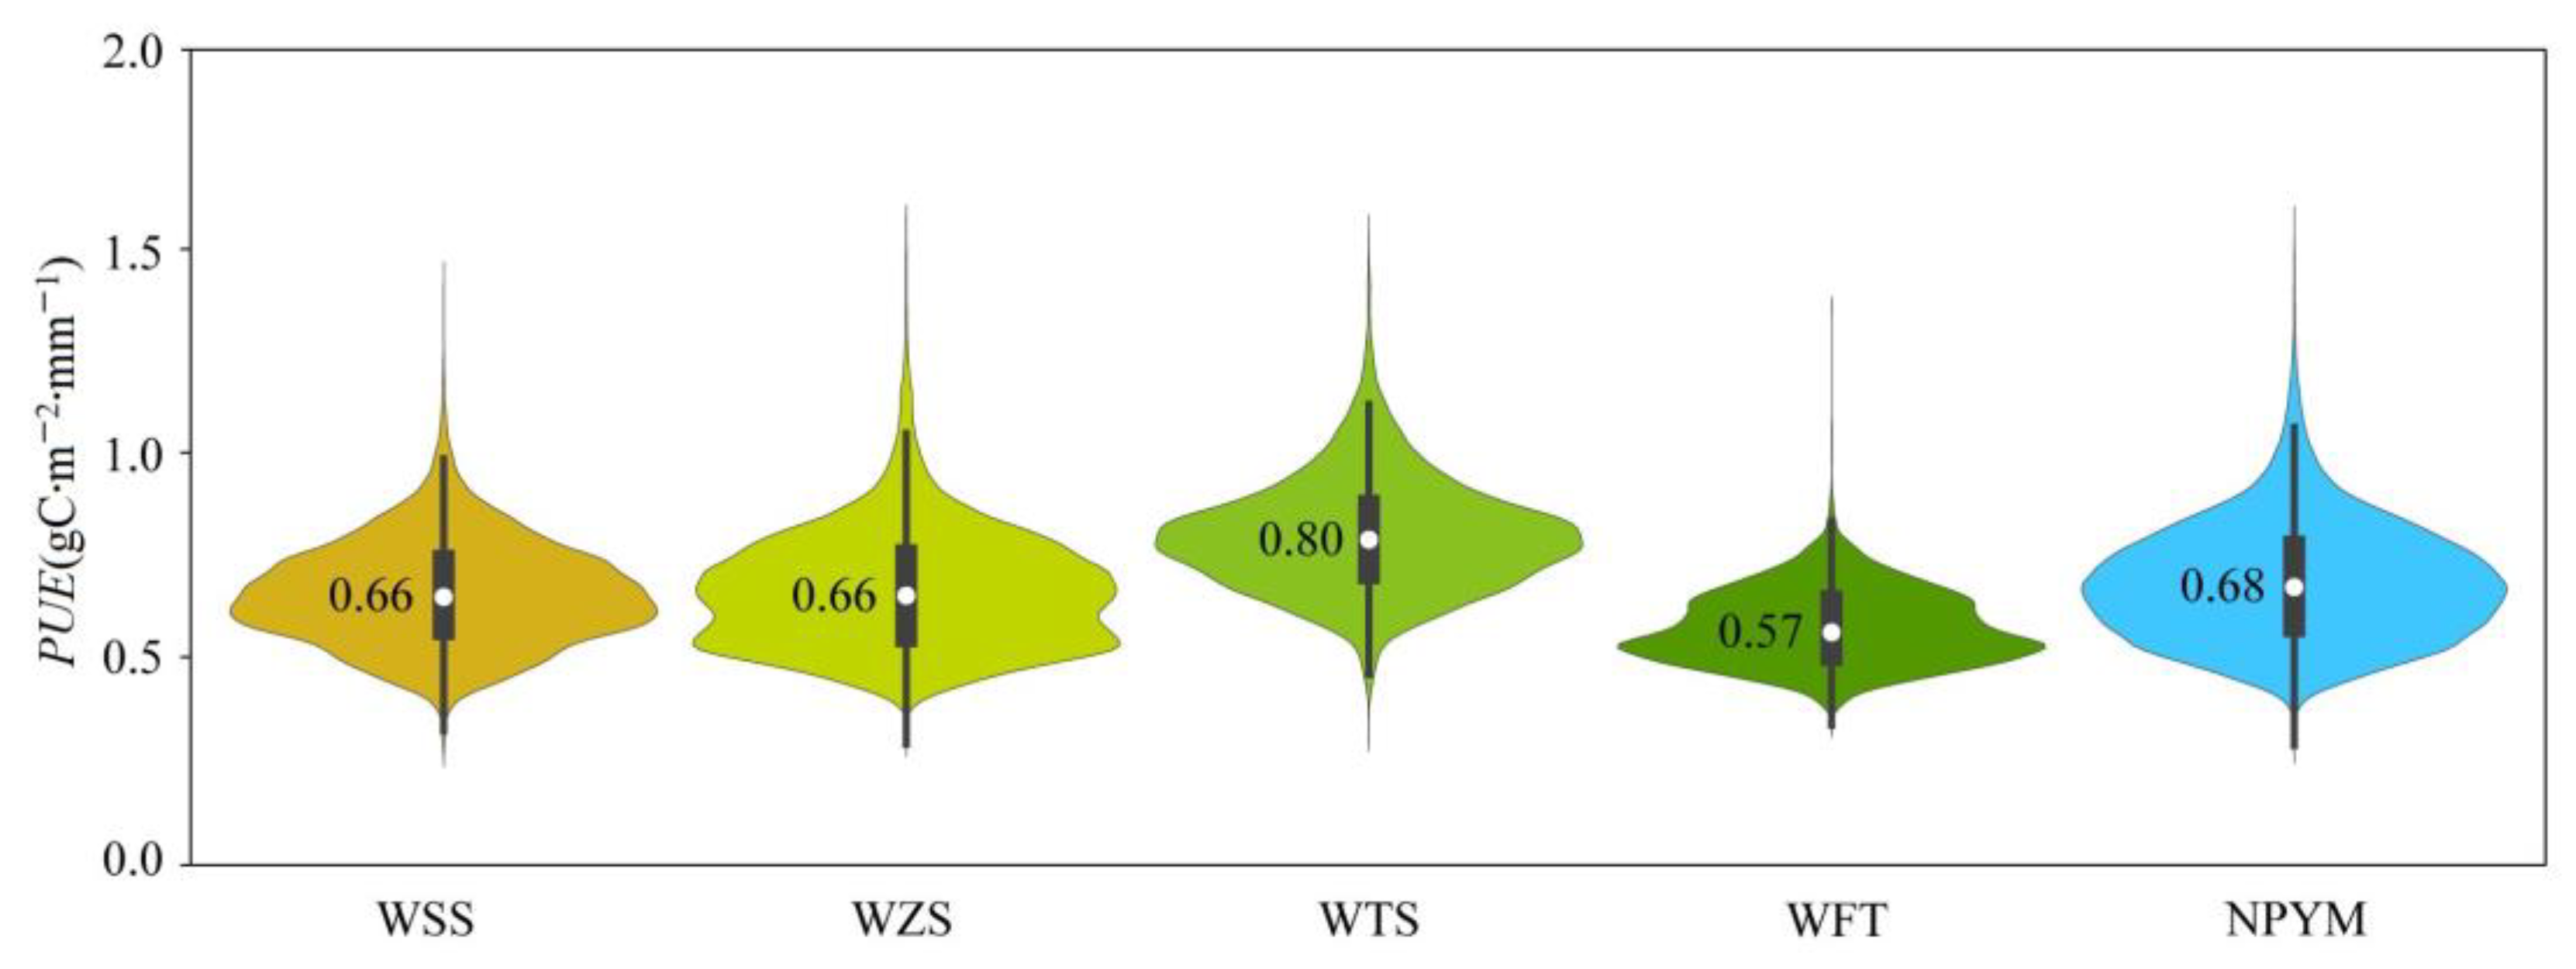
Figure 4.
Interannual changes of PUE in grassland at the north foot of Yinshan Mountain.
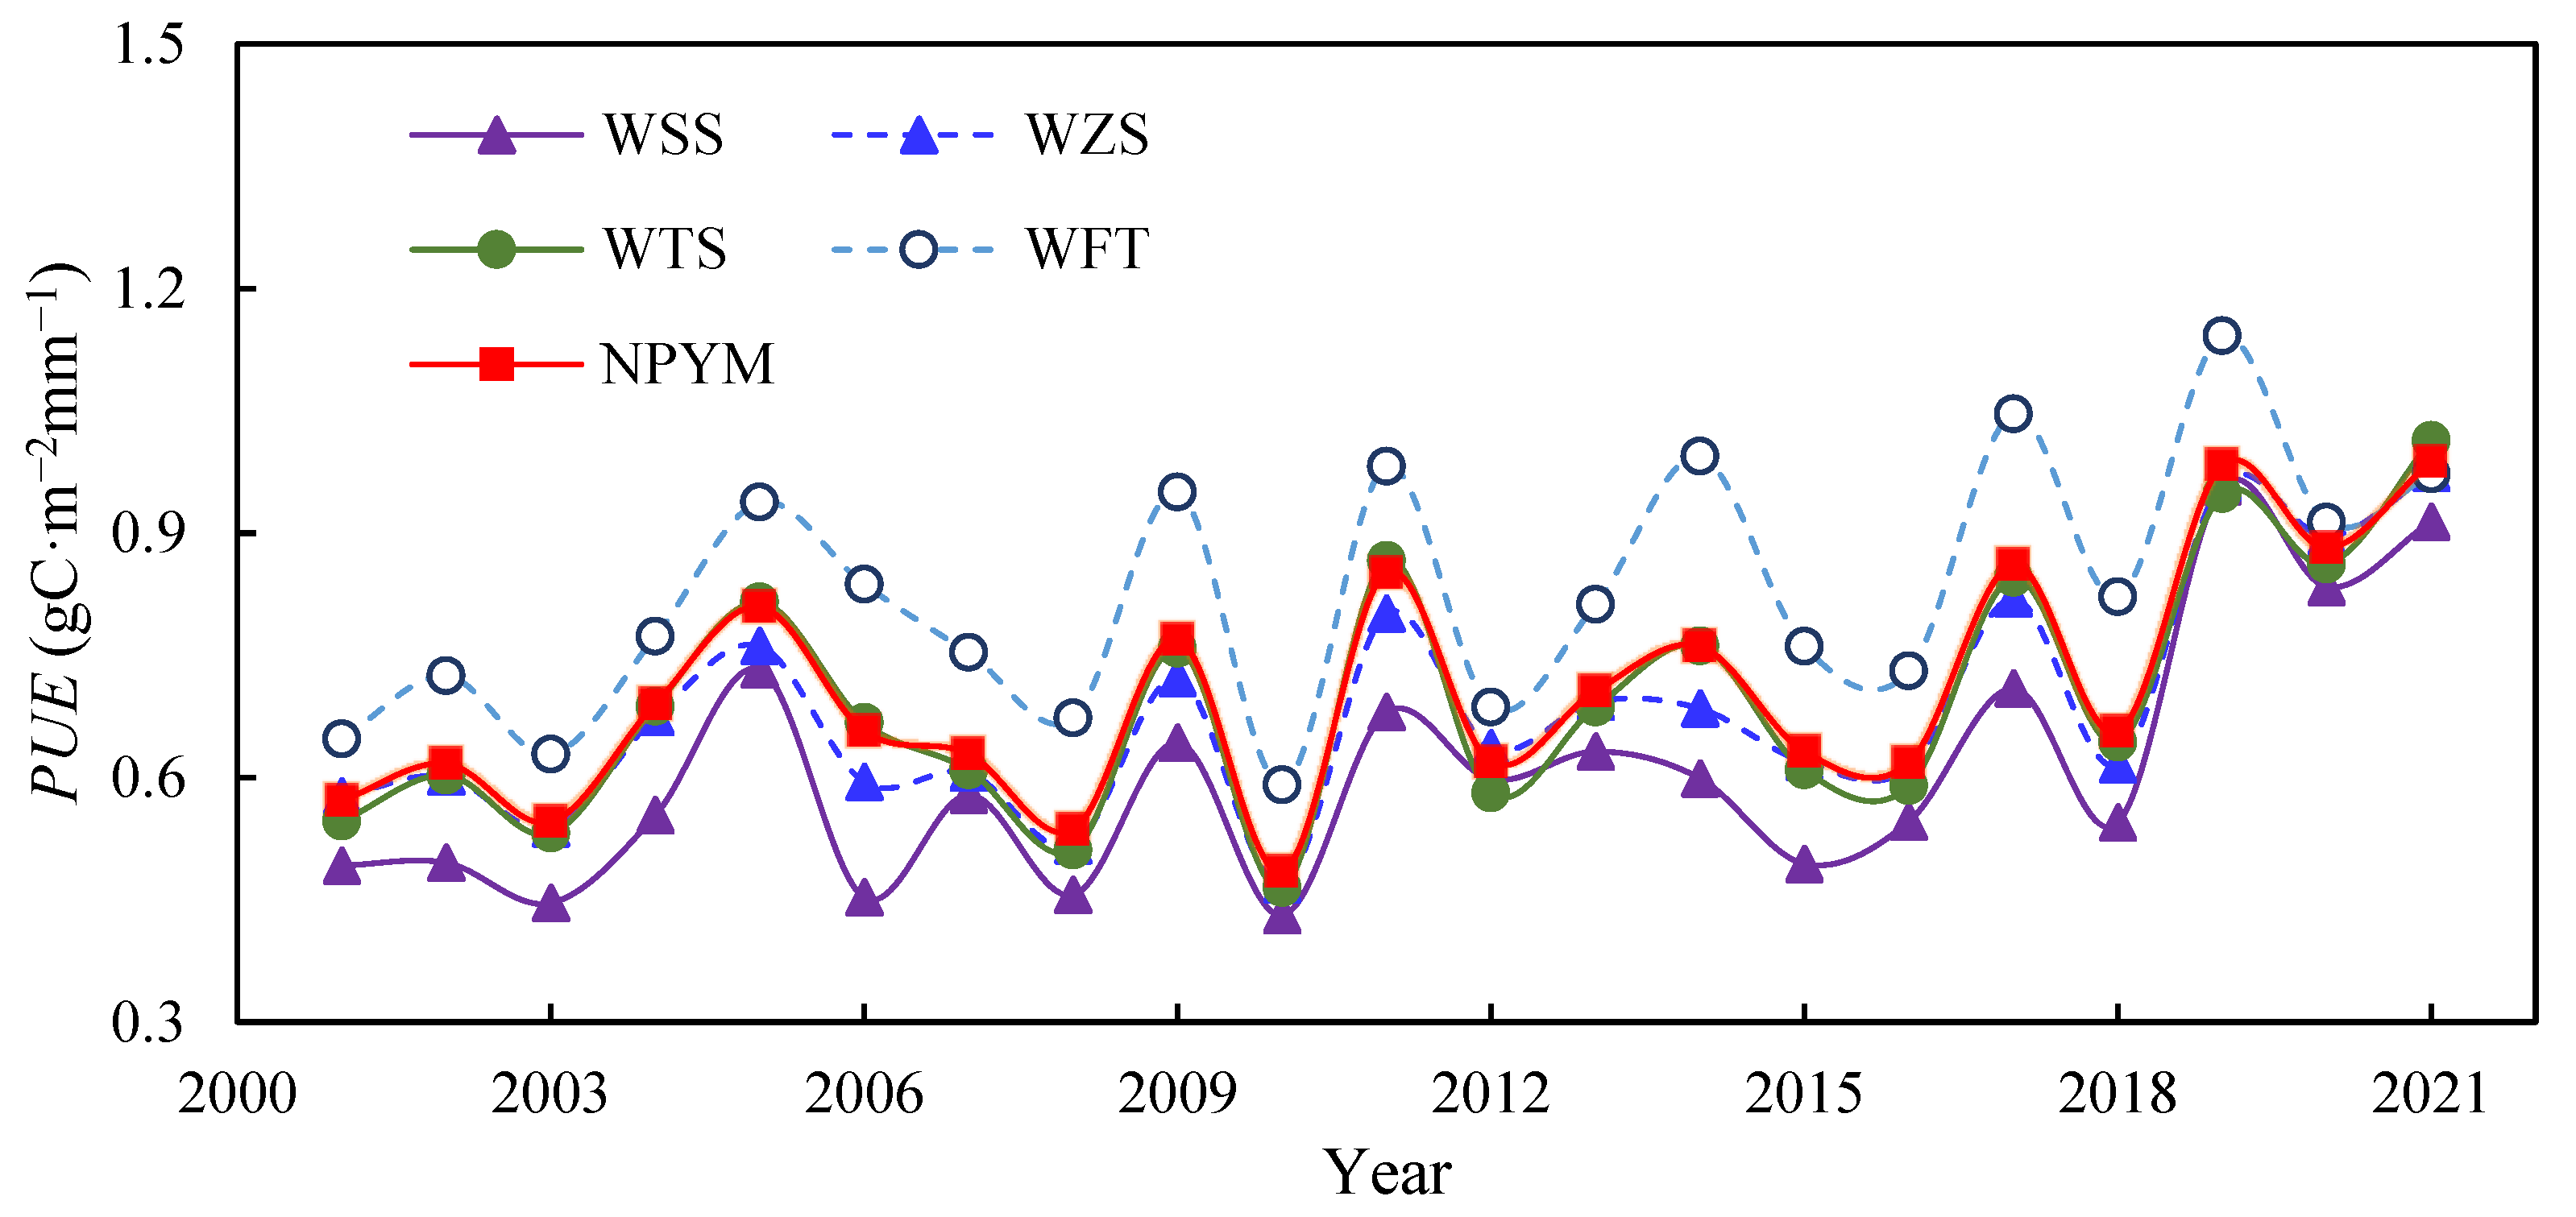
Figure 5.
Spatial distribution of the PUE variation trend.

Figure 6.
Spatial distribution of climate factors. (a–e) are the annual mean precipitation, temperature, potential evapotranspiration, wind speed, and vapor pressure deficit, especially.
Figure 6.
Spatial distribution of climate factors. (a–e) are the annual mean precipitation, temperature, potential evapotranspiration, wind speed, and vapor pressure deficit, especially.

Figure 7.
Correlation of climate factors and PUE. (a–e) are the annual mean precipitation, temperature, potential evapotranspiration, wind speed, and vapor pressure deficit, especially.
Figure 7.
Correlation of climate factors and PUE. (a–e) are the annual mean precipitation, temperature, potential evapotranspiration, wind speed, and vapor pressure deficit, especially.
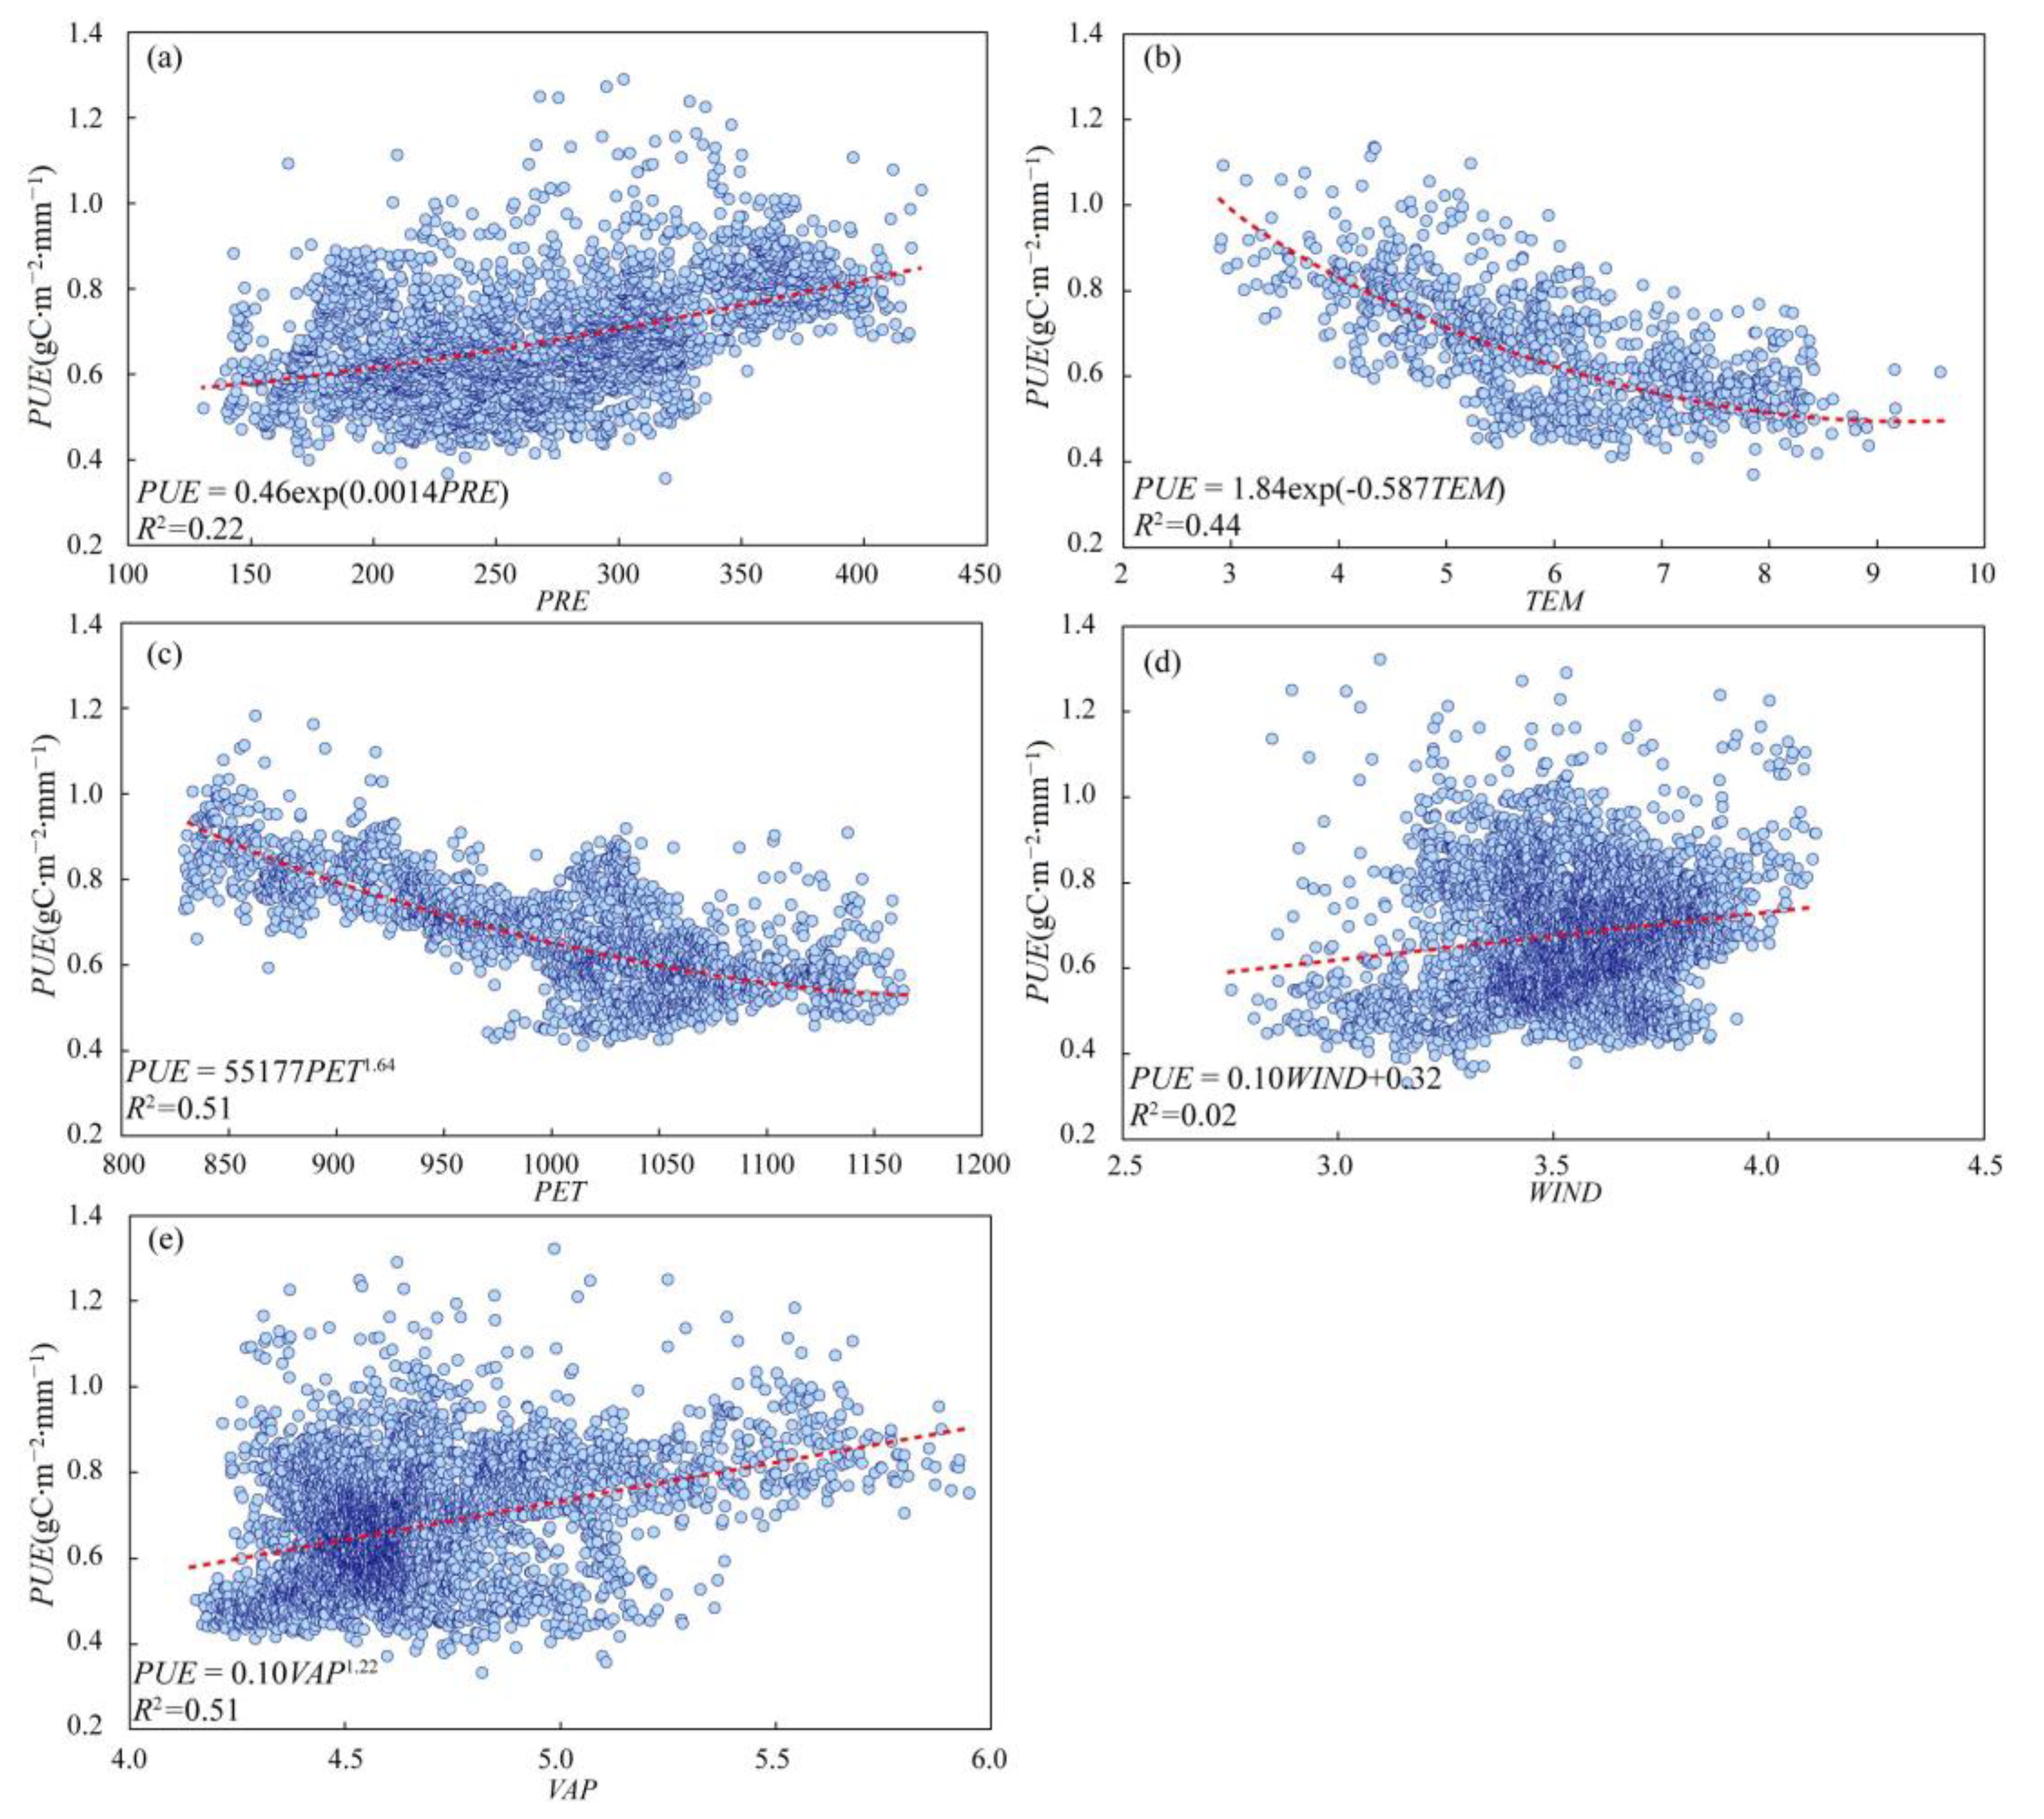
Figure 8.
Spatial distribution of controlling factors of PUE variation. PRE, TEP, PET, WIND, and VAP represent precipitation, temperature, potential evapotranspiration, and wind speed, respectively.
Figure 8.
Spatial distribution of controlling factors of PUE variation. PRE, TEP, PET, WIND, and VAP represent precipitation, temperature, potential evapotranspiration, and wind speed, respectively.
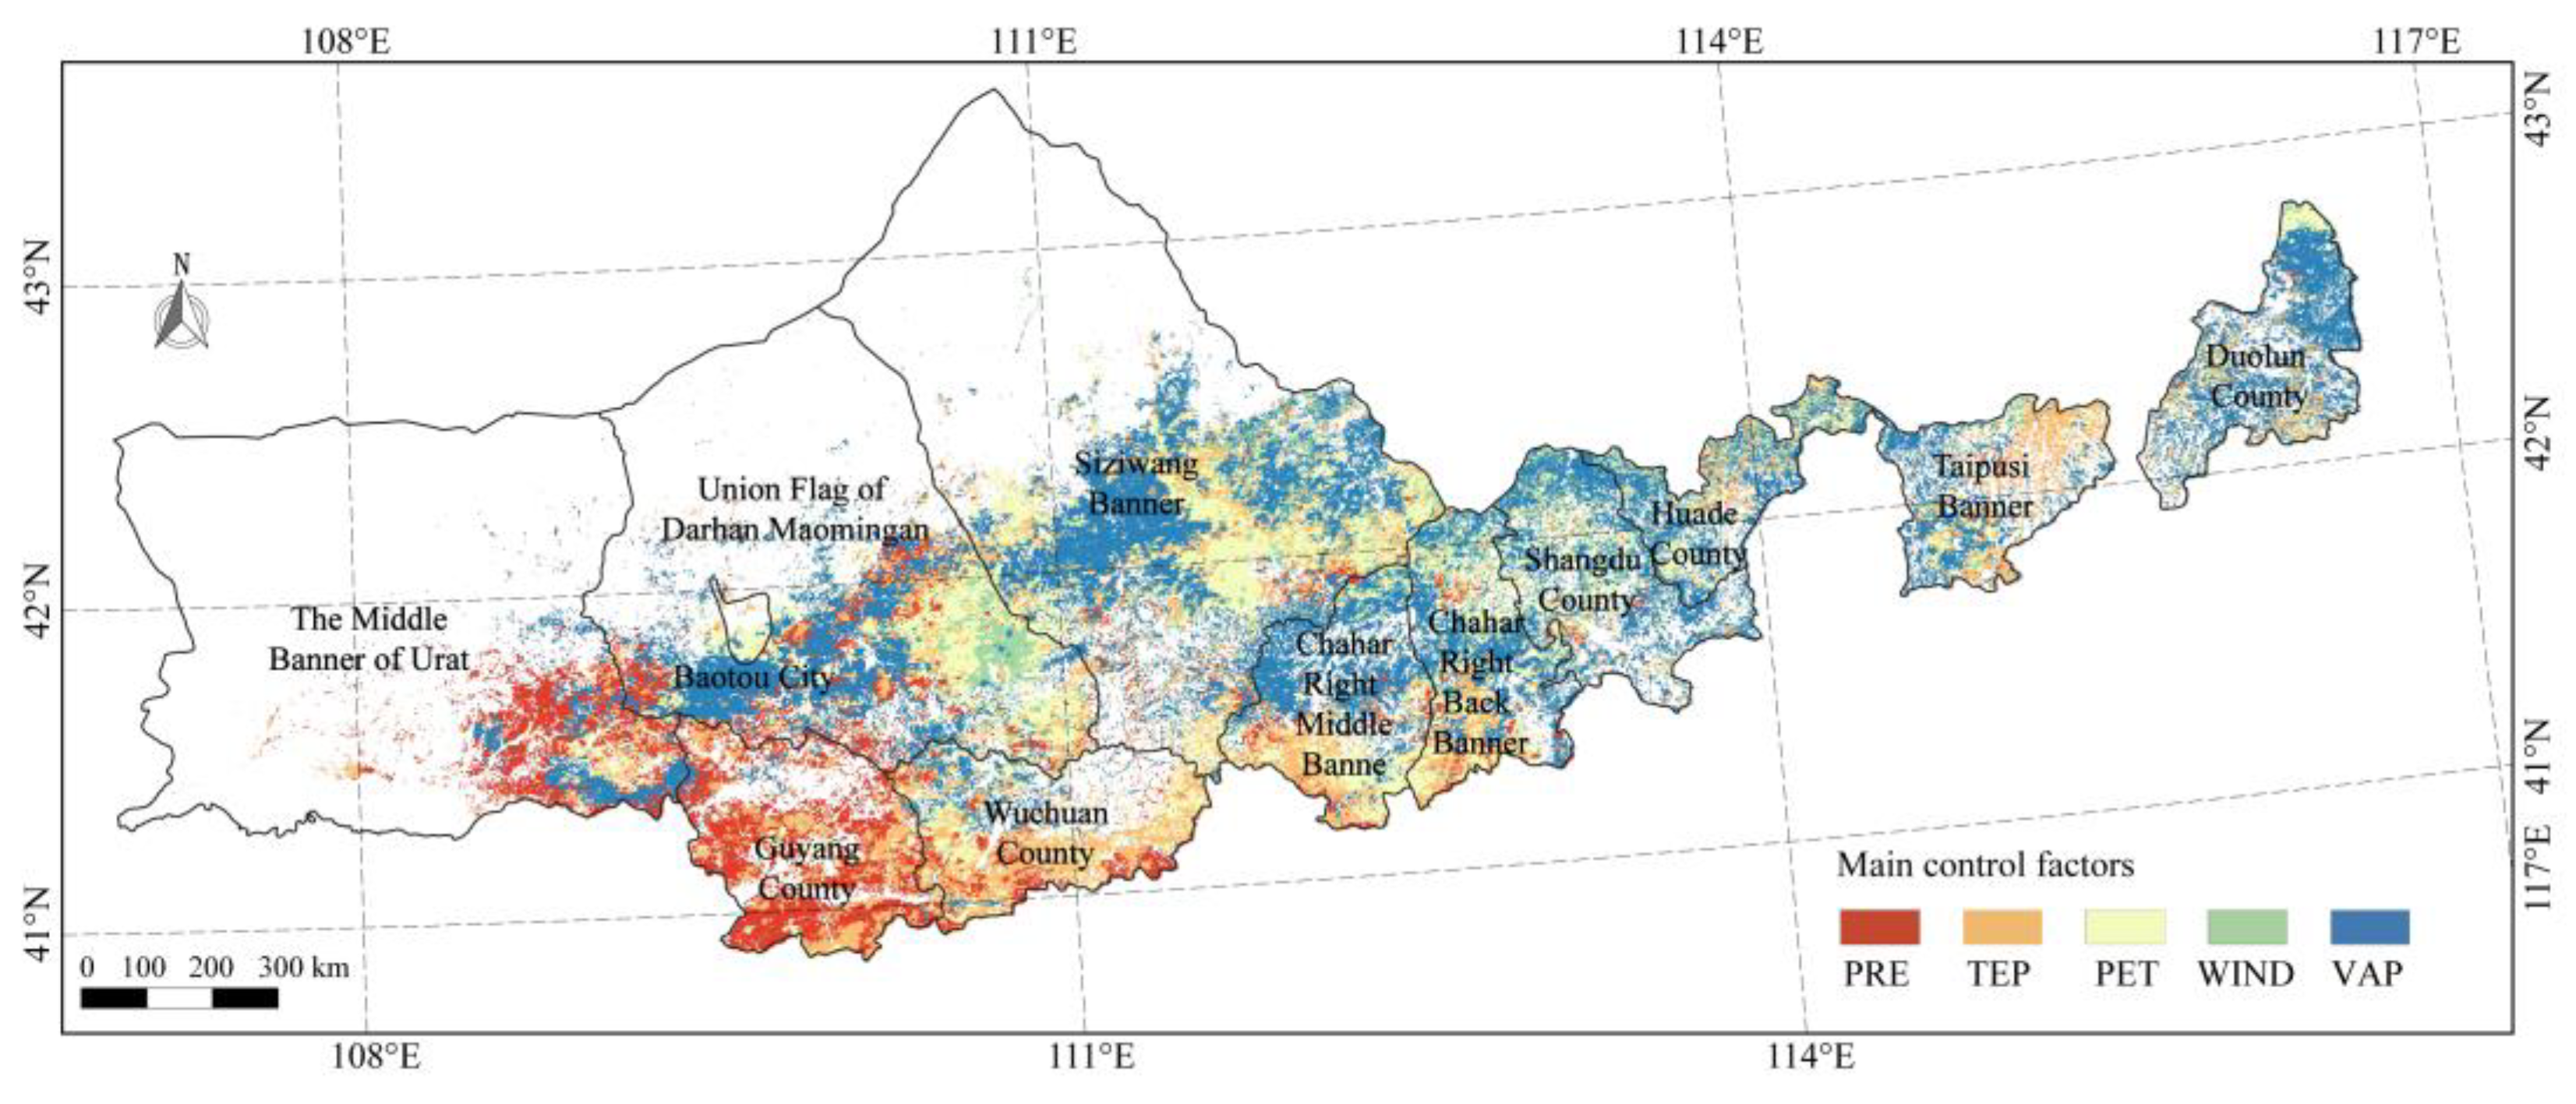
Figure 9.
Characteristics of PUE variation with elevation.

Table 1.
Description of the data used in this study.
| Data Type | Dataset | Provider |
|---|---|---|
| NDVI | MOD13Q1 | Google Earth Engine by NASA LP DAAC at the GSGS EROS Center |
| Meteorological | Temperature | China Meteorological Data Service Center |
| Land cover | GlobeLand30 | China National Geomatics Center |
Disclaimer/Publisher’s Note: The statements, opinions and data contained in all publications are solely those of the individual author(s) and contributor(s) and not of MDPI and/or the editor(s). MDPI and/or the editor(s) disclaim responsibility for any injury to people or property resulting from any ideas, methods, instructions or products referred to in the content. |
© 2023 by the authors. Licensee MDPI, Basel, Switzerland. This article is an open access article distributed under the terms and conditions of the Creative Commons Attribution (CC BY) license (https://creativecommons.org/licenses/by/4.0/).
Share and Cite
MDPI and ACS Style
Yang, Y.; Liu, H.; Tao, W.; Shan, Y. Spatiotemporal Variation Characteristics and Driving Force Analysis of Precipitation Use Efficiency at the North Foot of Yinshan Mountain. Water 2024, 16, 99. https://doi.org/10.3390/w16010099
AMA Style
Yang Y, Liu H, Tao W, Shan Y. Spatiotemporal Variation Characteristics and Driving Force Analysis of Precipitation Use Efficiency at the North Foot of Yinshan Mountain. Water. 2024; 16(1):99. https://doi.org/10.3390/w16010099
Chicago/Turabian StyleYang, Yi, Hu Liu, Wanghai Tao, and Yuyang Shan. 2024. "Spatiotemporal Variation Characteristics and Driving Force Analysis of Precipitation Use Efficiency at the North Foot of Yinshan Mountain" Water 16, no. 1: 99. https://doi.org/10.3390/w16010099
Note that from the first issue of 2016, this journal uses article numbers instead of page numbers. See further details here.