
A Study on the Evolution of Urban Underlying Surfaces and Extreme Rainfall in the Pearl River Delta


1
Department of Water Resources, China Institute of Water Resources and Hydropower Research, Beijing 100038, China
2
Faculty of Architecture, Civil and Transportation Engineering, Beijing University of Technology, Beijing 100124, China
*
Authors to whom correspondence should be addressed.
Water 2024, 16(2), 267; https://doi.org/10.3390/w16020267
Submission received: 28 November 2023
/
Revised: 20 December 2023
/
Accepted: 9 January 2024
/
Published: 12 January 2024
(This article belongs to the Special Issue Urban Flood Mitigation and Sustainable Stormwater Management)
Abstract
:Problems such as the expansion of impervious areas and changes in underlying surfaces have occurred in cities due to rapid urbanization, along with an increasing probability of extreme rainfall. Based on the normalized building index (NDBI) of underlying surfaces, calculated from remote sensing images in the Pearl River Delta from 1990 to 2020, this study determines the underlying surface changes in the Pearl River Delta. Based on the hourly rainfall data of meteorological stations in the Pearl River Delta region from 1990 to 2020, the extreme rainfall indexes are calculated to analyze the changes in extreme rainfall in the Pearl River Delta. Based on the NDBI of underlying surfaces and extreme rainfall calculated in the Pearl River Delta, the evolution of underlying surfaces and extreme rainfall is analyzed, as is the correlation between them, and the main conclusions are as follows: (1) From 1990 to 2020, the NDBI in highly urbanized areas in the Pearl River Delta was higher than that in non-highly urbanized areas. The NDBI in highly urbanized areas showed an increasing trend, and the growth rate tended to slow down; (2) From 1990 to 2020, extreme rainfall in highly urbanized areas of the Pearl River Delta was higher than in non-highly urbanized areas. Extreme rainfall in both highly urbanized areas and non-highly urbanized areas showed an increasing trend, with that in highly urbanized areas increasing faster; (3) The positive correlation between the NDBI and extreme rainfall indicators in highly urbanized areas is more significant than that in non-highly urbanized areas.
1. Introduction
The urbanization process has been accelerating around the world in recent years, especially in China, where the urbanization rate has increased rapidly since the reform and opening up. The urbanization rate in China has surged to 63.89% in 2020 from 17.92% in 1978 [1].
The process of urbanization transforms the ground, destroys the original natural surface vegetation coverage, and replaces it with hardened roads and buildings, which reduces the water and heat exchange and the connection between the atmosphere and soil in urban areas [2,3]. This changes the physical and chemical properties of the underlying surface, changes the flow generation and confluence characteristics in urbanized areas, reduces soil infiltration and evapotranspiration, and changes the original water and heat balance on the surface [4].
Rapid urbanization development has also brought many problems to cities, including changes in the underlying surface, increases in urban impermeable areas, heat island effects and rain island effects caused by the changing of natural conditions, as well as common urban problems such as urban waterlogging and environmental pollution caused by the failure of rapid renovation of urban facilities [5]. The main characteristic of the urbanization process is that the natural land surface is covered by impervious surfaces [6]. The process of urbanization transforms the ground, destroys the original natural surface vegetation coverage, and replaces it with hardened roads and buildings, which reduces the water and heat exchange and the connection between the atmosphere and soil in urban areas [7,8]. This changes the physical and chemical properties of the underlying surface, changes the flow generation and confluence characteristics in urbanized areas, reduces soil infiltration and evapotranspiration, and changes the original water and heat balance on the surface [9].
Extreme rainfall has been evident over the past decades. China has seen a significant increase in regional extreme rainfall events since the middle of the last century [10,11,12]. Globally, DONAT et al. [13] pointed out that global extreme precipitation will continue to intensify in the 21st century; JUNG et al. studied the precipitation in South Korea from 1973 to 2005 and found that the local extreme rainfall in summer has a significant increasing trend [14]; KARAGIANNIDIS [15] studied the daily rainfall data of 280 meteorological stations in Europe from 1958 to 2000, calculated local extreme rainfall indicators, and pointed out that the probability of extreme rainfall has decreased. Ren Zhengguo et al. [16] studied the changing patterns of multiple extreme rainfall indicators in southern China and pointed out that indicators such as rainfall intensity and maximum five-day precipitation showed an increasing trend, while the number of consecutive rainfall days showed a decreasing trend; Zhu Xiudi et al. [17] used Beijing’s global analysis of hourly rainfall data from 20 automatic weather stations in the district from 2011 to 2015 and found that there are large differences in rain patterns and rainfall days between urban and suburban areas. The high-value centers of rainfall intensity and rainfall duration are mainly in urban areas. Wu Xiaoqing et al. [18] chose the daily rainfall data of 43 stations in the Pearl River Delta and found that the patterns of the extreme rainfall showed an upward trend from the west to the east in the Pearl River Delta. And over the past fifty years, the trend of areas with large changes in extreme rainfall has gradually weakened, while the trend of areas with smaller changes has increased.
The earliest study on the relationship between urban underlying surface changes and rainfall came from Horton’s 1921 study on the frequency of heavy rainfall in urban areas and suburbs of several large cities in the United States, which showed that the frequency of thunderstorms is higher in urban areas than that in suburban areas [12]. In the 1970s, Changnon (1971) carried out the meteorological observation experiment program METROMEX in the St. Louis area of the United States and found that rainfall is significantly enhanced at 25 to 75 km downwind from the city center, and this enhancement effect is most obvious in summer [19]. Changnon (1992) found that the impact of urban underlying surfaces on rainfall is positively correlated with the urban coverage area [20]. Chen Xiuhong et al. [12] studied hourly rainfall data in Guangzhou from 1984 to 2015, analyzing the impact of urbanization on rainfall, and found that urbanization has a significant impact on rainfall in urban areas and downwind areas of Guangzhou. And the rainfall duration becomes shorter with the rainfall intensity increasing. Rupa et al. [20] studied the extreme daily rainfall in the suburbs of Berlin and pointed out that the relationship between extreme daily rainfall and the city gradually increases from the suburbs to the urban areas. At present, the academic community has not clarified the reasons why the underlying surface affects extreme rainfall in urban areas, but there are three main theories [21]: the urban heat island effect enhances the convection in the atmospheric boundary layer, forming a water vapor convergence zone in urbanized areas; the urban surface is rough, and the increase in temperature is conducive to the formation of water vapor convergence centers; aerosols in urban areas change the composition of atmospheric pollutants and provide sufficient condensation nuclei for the occurrence of rainfall [22,23]. However, the impact mechanisms in different regions are also expressed in different ways, and a specific analysis needs to be carried out according to the actual region [24,25].
2. Materials and Methods
2.1. Study Area
The study area selected in this paper, as shown in Figure 1, is in the Pearl River Delta region in the central and southern parts of Guangdong Province, including nine cities: Guangzhou, Foshan, Zhaoqing, Shenzhen, Dongguan, Huizhou, Zhuhai, Zhongshan, and Jiangmen. The latitudinal and longitudinal extension is from 21°27′ N (Jiangmen City) to 24°24′ N (Zhaoqing City) and from 111°21′ E (Zhaoqing City) to 115°28′ E (Huizhou City), respectively, covering a total area of 55,368.7 square kilometers, which accounts for less than one-third of the land area of Guangdong Province, but is home to 53.35% of its population and generates 79.67% of its economic output.
The Pearl River Delta region has a subtropical monsoon climate, with an average annual temperature of 21–23 °C and an average annual rainfall of over 1500 mm, with the rainy season occurring from April to October. The Pearl River Delta urban agglomeration is one of the three super-city clusters in China and has experienced rapid urban expansion. The permanent population of the Pearl River Delta urban agglomeration has grown from 17.974 million in 1980 to 64.469 million in 2019, and the urbanization rate has increased from 28.4% in 1980 to 86.3% in 2019. The rapid urbanization process has brought economic benefits but also many problems, such as changes in underlying surfaces due to urbanization, affecting the surface heat balance and water balance and influencing extreme precipitation events [26].
There are significant intercity differences in the level of urbanization in the Pearl River Delta urban agglomeration, with the total population showing a concentrated distribution. As of 2012, the urbanization rates of Shenzhen, Guangzhou, Dongguan, Foshan, Zhuhai, and Zhongshan were all above 85%, gathering more than 75% of the population in the Pearl River Delta region. The urbanization rates in other areas were all below 70%, with some areas not exceeding 50% [27]. To explore the evolution of the underlying surface and extreme rainfall in the Pearl River Delta cities, the region was divided into highly urbanized areas and non-highly urbanized areas based on factors such as population density, Gross Domestic Product (GDP), and urbanization rate. Representative meteorological stations were selected from the highly urbanized areas including Guangzhou—with Zengcheng and Conghua District excluded—Shenzhen, Dongguan, Foshan—with Gaoming and Sanshui district excluded—Zhongshan, and Xiangzhou District in Zhuhai, while for non-highly urbanized areas, representative meteorological stations were selected from Zhaoqing, Zengcheng District in Guangzhou, Huizhou, and Jiangmen, as shown in Table 1. The focus was on comparing the differences in the evolution of underlying surfaces and extreme rainfall characteristics between the highly urbanized areas centered around Guangzhou and Shenzhen and the surrounding areas, to some extent reflecting the impact of underlying surfaces and extreme rainfall in the Pearl River Delta region. The division of highly urbanized areas and non-highly urbanized areas is shown in Figure 1.
2.2. Materials
- (1)
- Normalized Difference Built-up Index (NDBI)
The Landsat 5 and Landsat 7 data (courtesy of the U.S. Geological Survey) from Google Earth Engine (GEE) website (https://earthengine.google.com (accessed on 15 October 2023)) were used. Landsat 5 satellite imagery (TM sensor) and Landsat 7 (ETM+ sensor) were used. The Landsat series images, including visible, infrared, and thermal bands, were used to estimate the spectral indices and to calculate the NDBI in the GEE. The specifications of the bands are shown in Table 2. The selection of satellite images was based on the availability of images from January 1990 to December 2020. The spatial resolution is 30 m. The temporal resolution is monthly. There is one set of image data per month and 12 sets per year, with a coverage area of the world. For this study, five sets of image data covering each period within the administrative divisions of the nine cities in the Pearl River Delta were selected.
Google Earth Engine and ArcGIS 10.6 were used to calculate and analyze the data and obtain the results for underlying surfaces.
- (2)
- Precipitation data
Considering the location of the stations, the time span, and the completeness of the data quality, a total of 12 meteorological stations in the region are selected to collect the hourly rainfall data. The spatial distribution and information of the stations are shown in Figure 1 and Table 1. The hourly rainfall data at the 12 stations are provided by the National Meteorological Information Center, from the Chinese surface climate data daily value dataset (V3.0), and the selected time series is from 1990 to 2020. Among all 12 stations, missing data are within 1%. The missing data are estimated by linear interpolation in the flood months (April–October), while they are recorded as 0 mm in the non-flood months (November–March). Also, there is no relocation for all 12 selected meteorological stations.
2.3. Methods
- (1)
- Calculation of Normalized Difference Built-up Index (NDBI)
NDBI (Zha, Gao, & Ni, 2003) was applied in this study to detect the built-up areas in the study area. Different bands of Landsat 5 and Landsat 7 satellite remote sensing data were used to calculate NDBI in the study areas, and the formula is as follows [28]:
NDBI = (SWIR1 − NIR)/(SWIR1 + NIR) = (Band5 − Band4)/(Band5 + Band4)
In the Formula (1), SWIR1 and Band5 represent the mid-infrared band value in Table 2, and NIR and Band4 represent the near-infrared band value in Table 2. The value of NDBI ranges from −1 to 1. When calculating NDBI, the data will have some outliers, that is, the NDBI value is greater than 1 or less than −1. For data greater than 1, the value is considered to be 1, and for data less than −1, the value is considered to be −1 [29].
The NDBI data were calculated, and the yearly data were represented by the maximum of the year in each grid. In each region of interest, the yearly data were averaged spatially to represent the yearly value of that region.
- (2)
- Determination of extreme precipitation data
There are three primary methods that are used to identify extreme precipitation events: (i) the fixed threshold method; (ii) the standard deviation method; and (iii) the percentile threshold method, with the latter currently being the most widely employed. The percentile threshold method defines a specific percentile value as the threshold for extreme values, offering a more accurate reflection of the variability in extreme rainfall within each region and across regions. Given the relatively high urbanization rate in the regions that are represented by each station in the Pearl River Delta, significant disparities exist in extreme rainfall. A single absolute threshold fails to capture these differences among regions with varying degrees of urbanization. Consequently, this study employs the percentile threshold method to analyze distinctions among subregions. Specifically, two distinct percentile thresholds of 95% and 99% were selected. The 95th and 99th percentile precipitation values, arranged in ascending order for hourly precipitation exceeding 0.1 mm, serve as the extreme precipitation thresholds at each station. Here, extreme precipitation is deemed to have occurred when hourly precipitation surpasses these defined thresholds. This paper adopts R99p and R95p as indices for extreme precipitation analysis, representing the sum of hourly rainfall over the 99th and 95th percentile thresholds, respectively, within a year.
- (3)
- Trend analysis
The Mann–Kendall test (MK trend test) is a non-parametric test. Its advantage lies in not requiring the sample to adhere to a specific distribution and being resilient to a few outliers. The test aims to identify a trend within a series without specifying whether the trend is linear or non-linear. This method assesses the trend profile of the series using the statistical variable Z. In typical scenarios, a significance level of α = 0.05 and critical value of U0.05 = ±1.96 are utilized. A Z value greater than 1.96 (or smaller than −1.96) indicates a statistically significant upward (or downward) trend within the series at a 0.05 significance level.
- (4)
- Correlation analysis
In this study, the Pearson correlation analysis was used to analyze the correlation of the evolution of underlying surfaces and extreme precipitation. The Pearson correlation coefficient is used to measure the correlation between two variables (linear correlation) with a value between −1 and 1. And 1 means a complete positive correlation, while a complete negative correlation is indicated by −1. The p-value is the significance level, known as the significance base and the first type of error (α-alpha). If the relationship results are less than 5%, then the probability of this relationship is very low, and the relationship is significant. If it is more than 5%, then the relationship of variable means is not. When the results are less than 1%, it can be concluded that the relationship is very significant (Kakavand et al. 2017; Kafy et al. 2021) [30,31].
3. Results
3.1. The Evolution of Urban Underlying Surfaces
The NDBI in highly urbanized areas in the Pearl River Delta is significantly higher than that in non-highly urbanized areas, as shown in Figure 2a. The NDBI in highly urbanized areas ranges from −0.05 to −0.01 in most years except in 1990, and the NDBI in non-highly urbanized areas ranges from −0.13 to −0.06.
To compare adjacent areas, Guangzhou and Nanhai as highly urbanized areas and Zengcheng and Gaoyao as non-highly urbanized areas were selected, as shown in Figure 2b,c. Being adjacent to each other, Guangzhou and Zengcheng are distinguished in terms of the NDBI, and the NDBI in Guangzhou is significantly higher than that in Zengcheng. The NDBI in Guangzhou grew significantly after 1990, before reaching a plateau around 1997, and declined gradually since 2001, showing a gradually increasing trend in the 30-year period. The NDBI in Zengcheng has declined since 1991, showing a decreasing trend in the period. With the closest gap in 1991, the gap between the NDBI in Guangzhou and Zengcheng has grown since. The adjacent of Nanhai and Gaoyao also show different values and trends in terms of the NDBI. The NDBI in Nanhai is significantly higher than that in Gaoyao, except in 1990, and it grew significantly before reaching a plateau in 1993, showing an increasing trend in the 30-year period. Fluctuating before reaching a maximum in 2000 and decreasing since, the NDBI in Gaoyao shows a decreasing trend in the period. The gap between the NDBI in Nanhai and Gaoyao narrowed before 2000 and gradually increased in the following period.
The MK trend test analysis was performed on the interannual changes in NDBI in each study area, and the results are shown in Table 3. The NDBI change rate in highly urbanized areas ranges from −0.0016 to 0.0010/a, with an average value of 0.0000/a. Dongguan, Nanhai, and Shunde have all increased significantly. Among them, the NDBI growth significance level is 0.01 in Dongguan and Nanhai and 0.05 in Shunde, and the decrease is significant in Zhuhai. The change rate of the NDBI in non-highly urbanized areas ranges from −0.0022 to −0.0011/a, with an average value of −0.0014/a. The NDBI has significantly reduced, with significance level of 0.05.
Specific to space, looking at the overall time span from 1990 to 2020, the NDBI of highly urbanized areas represented by southern Guangzhou, Dongguan, eastern Foshan, northern Zhongshan, and Zhuhai all showed a growth trend, but not the highly urbanized area Jiangmen. The NDBI has declined in most areas of cities such as Huizhou, Huizhou, and Zhaoqing, as shown in Figure 3a. Based on the growth trend results, the changes in the NDBI are divided into two intervals: 1990–2003 and 2003–2020, as shown in Figure 3b,c. From 1990 to 2003, the NDBI showed an increasing trend in most regions of the Pearl River Delta. Among them, the highly urbanized areas of Guangzhou, Foshan, Zhuhai, Dongguan, and Shenzhen experienced the most obvious growth. From 2003 to 2020, except for Foshan, northern Zhongshan, and Dongguan, the NDBI in other regions in the Pearl River Delta showed a downward trend.
3.2. The Evolution of Extreme Precipitation
The extreme rainfall R99p and R95p in highly urbanized areas are significantly higher than those in non-highly urbanized areas. Both R99p and R95p in highly urbanized areas and non-highly urbanized areas show an increasing trend. The growth rate in highly urbanized areas is greater than that in non-highly urbanized areas.
To compare adjacent areas, R99p and R95p in Guangzhou and Nanhai as highly urbanized areas and Zengcheng and Gaoyao as non-highly urbanized areas were selected, as shown in Figure 4c–f. The R99p and R95p in Guangzhou were lower than those in Zengcheng before 2000, and then became higher than in Zengcheng around 2010 after fluctuation. The increasing trend is more significant for R99p and R95p in Guangzhou than for those in Zengcheng. Meanwhile, for Nanhai and Gaoyao, in most of the 30-year period, the R99p and R95p in Nanhai were higher than those in Gaoyao, and the gap between Nanhai and Gaoyao grew. The increasing trend of R99p and R95p in Gaoyao is insignificant, while that in Nanhai is rather more significant.
According to the MK trend test results, as shown in Table 4, the extreme rainfall indicators in non-highly urbanized areas all showed growth, with the R99p growth rate ranging from 0.37 mm/a to 2.92 mm/a. Among them, Huiyang exhibited a significant growth trend, with a confidence level of 95% and R95p growth. The rate was between 1.18 mm/a and 7.15 mm/a, among which Huiyang exhibited a significant growth trend, with a confidence level of 95%. The extreme rainfall indicators in highly urbanized areas showed an increase, except for in Shenzhen and Zhuhai. The R99p growth rate ranged from 0.29 mm/a to 3.97 mm/a, except for in Shenzhen and Zhuhai. Among them, Guangzhou and Dongguan exhibited a significant growth trend. The confidence level in Guangzhou reached the 99% level, and the confidence level in Dongguan reached the 95% level. The R95p growth rate ranged from 2.57 mm/a to 11.27 mm/a, except for in Shenzhen and Zhuhai. Among them, the growth trend in Guangzhou and Dongguan was significant, and the confidence level in Guangzhou reached the 99% level. Dongguan’s confidence level reached the 95% level. In addition, in highly urbanized areas, Guangzhou’s annual rainfall showed a significant growth trend.
3.3. The Relationship between Extreme Precipitation and Underlying Surfaces
Pearson’s correlation coefficients between the NDBI and extreme precipitation are shown in Table 5. In non-highly urbanized areas, except for the negative correlation between Huiyang’s NDBI and R99p changes, there are no obvious correlations in the rest. In highly urbanized areas, there is a positive correlation between the NDBI and rainfall indicators in Shenzhen, Dongguan, Nanhai, and Shunde. Among them, the confidence level of the correlation between the NDBI in Nanhai and R95p reaches 99%. The NDBI in Guangzhou, Zhongshan, and Zhuhai have no significant relationship with their extreme rainfall indicators.
4. Discussion
The NDBI in highly urbanized areas is generally higher than that in non-highly urbanized areas, which is in line with the characteristics of highly urbanized areas with a high density of buildings and a high artificial ground coverage. The growth trend of the NDBI in highly urbanized areas is consistent with the trend of increasing urbanization and increasing building coverage in the core areas of the Pearl River Delta since 1990. The gradual slowdown in NDBI growth is consistent with the slowdown in growth in the highly urbanized areas of the Pearl River Delta after urbanization reached a higher level. The NDBI in non-highly urbanized areas showed an increasing trend between 1990 and 2000, which is consistent with the increasing trend of urbanization in non-highly urbanized areas in the Pearl River Delta. It has shown a slow downward trend since 2000. This may be due to the strengthening of environmental protection and the increase in vegetation coverage in the mountainous areas of the Pearl River Delta in recent years. The NDBI in adjacent highly urbanized areas and non-highly urbanized areas like Guangzhou and Zengcheng and Nanhai and Gaoyao shows different characteristics, and the gap between highly urbanized areas and non-highly urbanized areas increased through the 30-year period from 1990 to 2020.
The extreme rainfall in highly urbanized areas is greater than that in non-highly urbanized areas, which is consistent with the characteristics of high urbanization in highly urbanized areas, resulting in the urban rain island effect. The extreme rainfall in both highly urbanized areas and non-highly urbanized areas shows an increasing trend, which is in line with the increasing urbanization in the Pearl River Delta in recent years and the increasing trend of extreme rainfall in urban areas. Among them, the growth rate of extreme rainfall in highly urbanized areas is higher than that in non-highly urbanized areas, which is consistent with the characteristics of concentrated cities and high urbanization levels in highly urbanized areas, which lead to concentrated extreme rainfall and are more likely to exceed the thresholds. The extreme rainfall in adjacent highly urbanized areas and non-highly urbanized areas like Guangzhou and Zengcheng and Nanhai and Gaoyao shows different characteristics, and the extreme precipitation in highly urbanized areas gradually exceeded that in non-highly urbanized areas through the 30-year period from 1990 to 2020, sharing this trend with the NDBI in adjacent highly urbanized areas and non-highly urbanized areas, which may reflect that the impact of extreme rainfall on artificial underlying surfaces in highly urbanized areas exists.
In contrast, the positive correlation between the NDBI and extreme rainfall indicators in highly urbanized areas is more significant than that in non-highly urbanized areas, which can reflect the impact of building density and impervious area on extreme rainfall in highly urbanized areas. In Shenzhen and Zhuhai, which are close to the sea, the relationship between the underlying surface and extreme rainfall may not be obvious, because rainfall is greatly affected by the ocean.
To elaborate on the mechanism of impact by the evolution of underlying surfaces in urbanized areas on extreme precipitation, Chen et al. [12] studied the impact brought on by urbanization on rainfall in the summer in Guangzhou. The results show that there is a significant impact to the downwind side of the city. The reasons behind the impact could lie in the thermal and dynamic condition difference in the underlying surface between urban areas and suburb areas, caused by a rapid urbanization process [32]. This difference affects the transport and spatial distribution of water vapor in the region, enhances the convective activity in the urban area and downwind area of the urban area, and slows down the movement of the precipitation system, thus increasing the ratio of heavy rain and rainstorm events in the urban area. The METROMEX experiment in the United States found that urbanization has a triggering effect on convective systems and pointed out that the influence of urbanization on precipitation is more obvious in the warm season, when mesoscale convective forcing is dominant [33].
5. Conclusions
Based on the changes in underlying surfaces and extreme rainfall in the Pearl River Delta, the correlation between underlying surfaces and extreme rainfall changes is analyzed, and the main conclusions are as follows:
- (1)
- From 1990 to 2020, the NDBI in highly urbanized areas in the Pearl River Delta was higher than that in non-highly urbanized areas. The NDBI in highly urbanized areas showed an increasing trend, and the growth rate tended to slow down;
- (2)
- From 1990 to 2020, extreme rainfall in highly urbanized areas of the Pearl River Delta was higher than in non-highly urbanized areas. Extreme rainfall in both highly urbanized areas and non-highly urbanized areas showed an increasing trend, with that in highly urbanized areas increasing faster;
- (3)
- The positive correlation between the NDBI and extreme rainfall indicators in highly urbanized areas is more significant than that in non-highly urbanized areas.
Author Contributions
Conceptualization, Z.Y., X.G. and J.Z.; Methodology, T.X.; Formal analysis, T.X.; Investigation, T.X.; Writing—original draft, T.X.; Writing—review & editing, X.G.; Supervision, Z.Y., X.G. and J.Z. All authors have read and agreed to the published version of the manuscript.
Funding
This research was funded by the National Key R&D Program of China (2022YFC3090603-01); the National Natural Science Foundation of China (52209044); and the Beijing Natural Science Foundation (8242003).
Data Availability Statement
Data are contained within the article.
Conflicts of Interest
The authors declare no conflicts of interest. The funders had no role in the design of the study; in the collection, analyses, or interpretation of data; in the writing of the manuscript; or in the decision to publish the results.
References
- National Bureau of Statistics of China. China Statistical Yearbook 2021; China Statistics Press: Beijing, China, 2021; pp. 97–98.
- Purevdorj, T.S.; Tateishi, R.; Ishiyama, T.; Honda, Y. Relationships between percent vegetation cover and vegetation indices. Int. J. Remote Sens. 1998, 19, 3519–3535. [Google Scholar] [CrossRef]
- Tucker, C.J. Red and photographic infrared linear combinations for monitoring vegetation. Remote Sens. Environ. 1979, 8, 127–150. [Google Scholar] [CrossRef]
- Zha, Y.; Gao, J.; Ni, S. Use of normalized difference built-up index in automatically mapping urban areas from TM imagery. Int. J. Remote Sens. 2003, 24, 583–594. [Google Scholar] [CrossRef]
- Intergovernmental Panel on Climate Change. Climate Change 2013—The Physical Science Basis; Cambridge University Press: Cambridge, UK, 2014. [Google Scholar]
- Min, S.-K.; Zhang, X.; Zwiers, F.W.; Hegerl, G.C. Correction: Corrigendum: Human contribution to more-intense precipitation extremes. Nat. Int. Wkly. J. Sci. 2013, 498, 378–381. [Google Scholar]
- Gao, L.; Huang, J.; Chen, X.; Chen, Y.; Liu, M. Contributions of natural climate changes and human activities to the trend of extreme precipitation. Atmos. Res. 2018, 205, 60–69. [Google Scholar] [CrossRef]
- Donat, M.G.; Lowry, A.L.; Alexander, L.V.; O’Gorman, P.A.; Maher, N. Addendum: More extreme precipitation in the world’s dry and wet regions. Nat. Clim. Chang. 2017, 7, 508–513. [Google Scholar] [CrossRef]
- Jung, I.W.; Bae, D.H.; Kim, G. Recent trends of mean and extreme precipitation in Korea. Int. J. Climatol. 2011, 31, 359–370. [Google Scholar] [CrossRef]
- Karagiannidis, A.F.; Karacostas, T.; Maheras, P.; Makrogiannis, T. Climatological aspects of extreme precipitation in Europe, related to mid-latitude cyclonic systems. Theor. Appl. Climatol. 2012, 107, 165–174. [Google Scholar] [CrossRef]
- Rupa, C.; Mujumdar, P.P. Dependence structure of urban precipitation extremes. Adv. Water Resour. 2018, 121, 206–218. [Google Scholar]
- Horton, R.E. Thunderstorm-breeding spots. Mon. Weather Rev. 1921, 49, 193. [Google Scholar] [CrossRef]
- Changnon, S.A., Jr. METROMEX: An investigation of inadvertent weather modification. Bull. Am. Meteorol. Soc. 1971, 52, 958–968. [Google Scholar] [CrossRef]
- Changnon, S.A. Inadvertent Weather Modification in Urban Areas: Lessons for Global Climate Change. Bull. Am. Meteorol. Soc. 1992, 73, 619–627. [Google Scholar] [CrossRef]
- Shepherd, J.M. A review of the current investigations of urban induced rainfall and recommendations for the future. Earth Interact Actions 2005, 9, 1–27. [Google Scholar] [CrossRef]
- Lowry, W.P. Urban effects on precipitation amount. Prog. Phys. Geogr. 1998, 22, 477–520. [Google Scholar] [CrossRef]
- Shepherd, J.M.; Carter, M. The Impact of Urbanization on Current and Future Coastal Precipitation: A Case Study for Houston. Environ. Plan. B Plan. Des. 2010, 37, 284–304. [Google Scholar] [CrossRef]
- Subhanil, G.; Himanshu, G.; Neetu, G.; Anindita, D. A long-term seasonal analysis on the relationship between LST and NDBI using Landsat data. Quat. Int. 2020, prepublish. [Google Scholar]
- Xu, Q.; Gao, Q.; Hu, J.; Hu, X. Homogeneity Test and Analysis of Meteorological Data before and after Qianjiang Station Moving. Plateau Meteorol. 2011, 30, 1709–1715. [Google Scholar]
- Zou, S.; Abuduwaili, J.; Duan, W.; Ding, J.; De Maeyer, P.; Van De Voorde, T.; Ma, L. Attribution of changes in the trend and temporal non-uniformity of extreme precipitation events in Central Asia. Sci. Rep. 2021, 11, 1. [Google Scholar] [CrossRef]
- Ren, G. Urbanization as a major driver of urban climate change. Adv. Clim. Change Res. 2015, 6, 1–6. [Google Scholar] [CrossRef]
- Ding, Y. Climate change and urbanization effects on extreme rainstorms in Chinese mega-cities. China Food Drought Manag. 2018, 28, 1–2. [Google Scholar]
- Liu, J.; Luo, Z.; Zhang, Y.; Zhou, J.; Shao, W. Influence of urbanization on spatial distribution of extreme precipitation in Henan Province. Water Resour. Prot. 2022, 38, 6. [Google Scholar]
- Wei, F. Modern Climate Statistical Diagnosis and Prediction Technology; China Meteorological Press: Beijing, China, 2007.
- Zhao, N.; Jiao, Y.; Ma, T.; Zhao, M.; Fan, Z.; Yin, X.; Liu, Y.; Yue, T. Estimating the effect of urbanization on extreme climate events in the Beijing-Tianjin-Hebei region, China. Sci. Total Environ. 2019, 688, 1005–1015. [Google Scholar] [CrossRef]
- Miao, Z.; Li, N.; Lu, M.; Xu, L. Variation characteristics of extreme precipitation event in Beijing-Tianjin-Hebei region during 1961–2017. Water Resour. Hydropower Eng. 2019, 50, 34–44. [Google Scholar]
- Ren, G.; Liu, Y.; Sun, X.; Zhang, L.; Ren, Y.; Zhang, H.; Zhan, Y.; Wang, T.; Guo, Y.; Chen, Y.; et al. Spatial and temporal patterns of precipitation variability over mainland China: III: Causes for recent trends. Adv. Water Resour. 2016, 27, 327–348. [Google Scholar] [CrossRef]
- Zhou, B.; Shi, J.; Li, S.; Chen, T.; Ma, L. Spatio-temporal variations of extreme precipitation in the Yangtze River Delta during 1960–2012. J. Yangtze River Sci. Res. Inst. 2016, 33, 5–9. [Google Scholar]
- Gu, X.; Zhang, Q.; Chen, X. The spatiotemporal rates of heavy precipitation occurrence at difference scales in China. J. Hydraul. Eng. 2017, 48, 505–515. [Google Scholar]
- Kakavand, A.; Nikakhtar, S.; Sardaripour, M. Prediction of internet addiction, based on perceived social support, loneliness and social phobia. J. Sch. Psychol. 2017, 6, 81–98. [Google Scholar]
- Kafy, A.-A.; Dey, N.N.; Al Rakib, A.; Rahaman, Z.A.; Nasher, N.R.; Bhatt, A. Modeling the relationship between land use/land cover and land surface temperature in Dhaka Bangladesh Using CA-ANN Algorithm. Environ. Chall. 2021, 4, 100190. [Google Scholar] [CrossRef]
- Tang, C.; Chen, T.; Cai, B.; Yu, K. Process of the annual mean surface air temperature of Guangzhou (Tianhe) over the last 100 years. Trop. Geogr. 2014, 6, 729–736. [Google Scholar]
- Changnon, S.A., Jr. Urban effects on severe local storms at St Louis. J. Appl. Meteorol. 1978, 17, 578–586. [Google Scholar] [CrossRef]
Figure 1.
Study areas and meteorological stations.
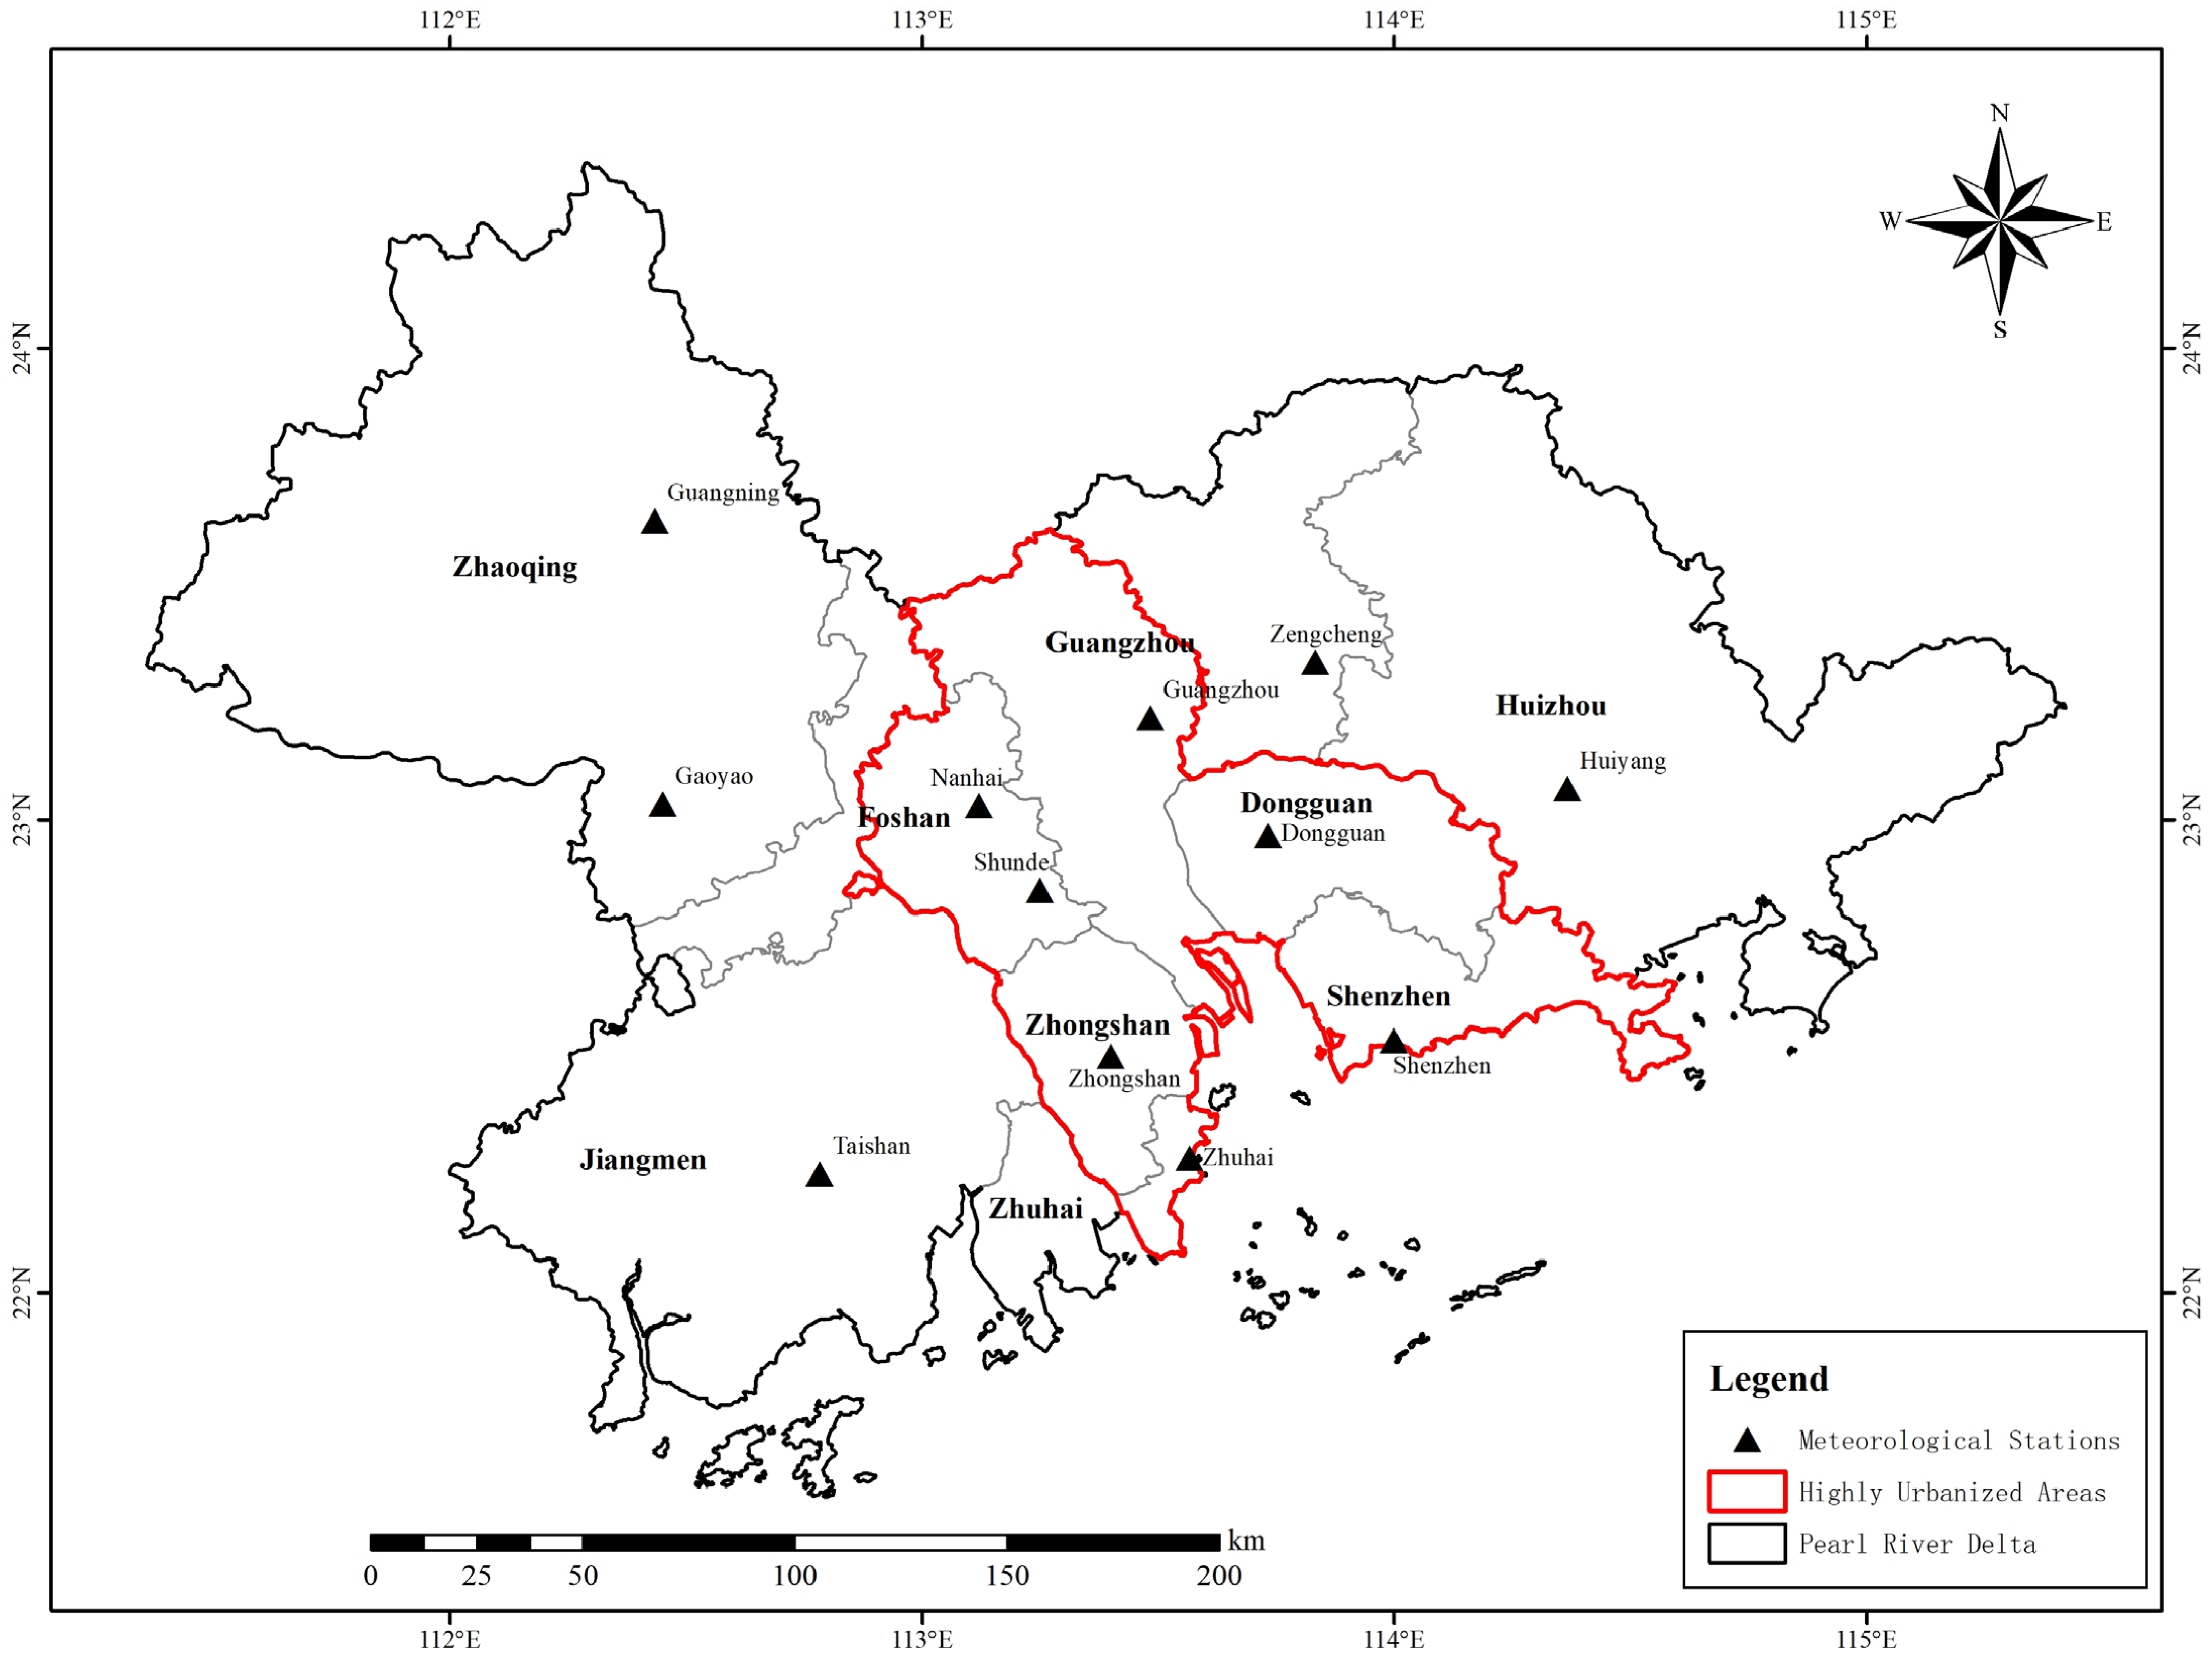
Figure 2.
(a) Trends of NDBI in highly urbanized areas and non-highly urbanized areas; (b) trends of NDBI in Guangzhou and Zengcheng; (c) trends of NDBI in Nanhai and Gaoyao.
Figure 2.
(a) Trends of NDBI in highly urbanized areas and non-highly urbanized areas; (b) trends of NDBI in Guangzhou and Zengcheng; (c) trends of NDBI in Nanhai and Gaoyao.

Figure 3.
Slopes of NDBI: (a) slope of NDBI between 1990 and 2020; (b) slope of NDBI between 1990 and 2003; (c) slope of NDBI between 2003 and 2020.
Figure 3.
Slopes of NDBI: (a) slope of NDBI between 1990 and 2020; (b) slope of NDBI between 1990 and 2003; (c) slope of NDBI between 2003 and 2020.
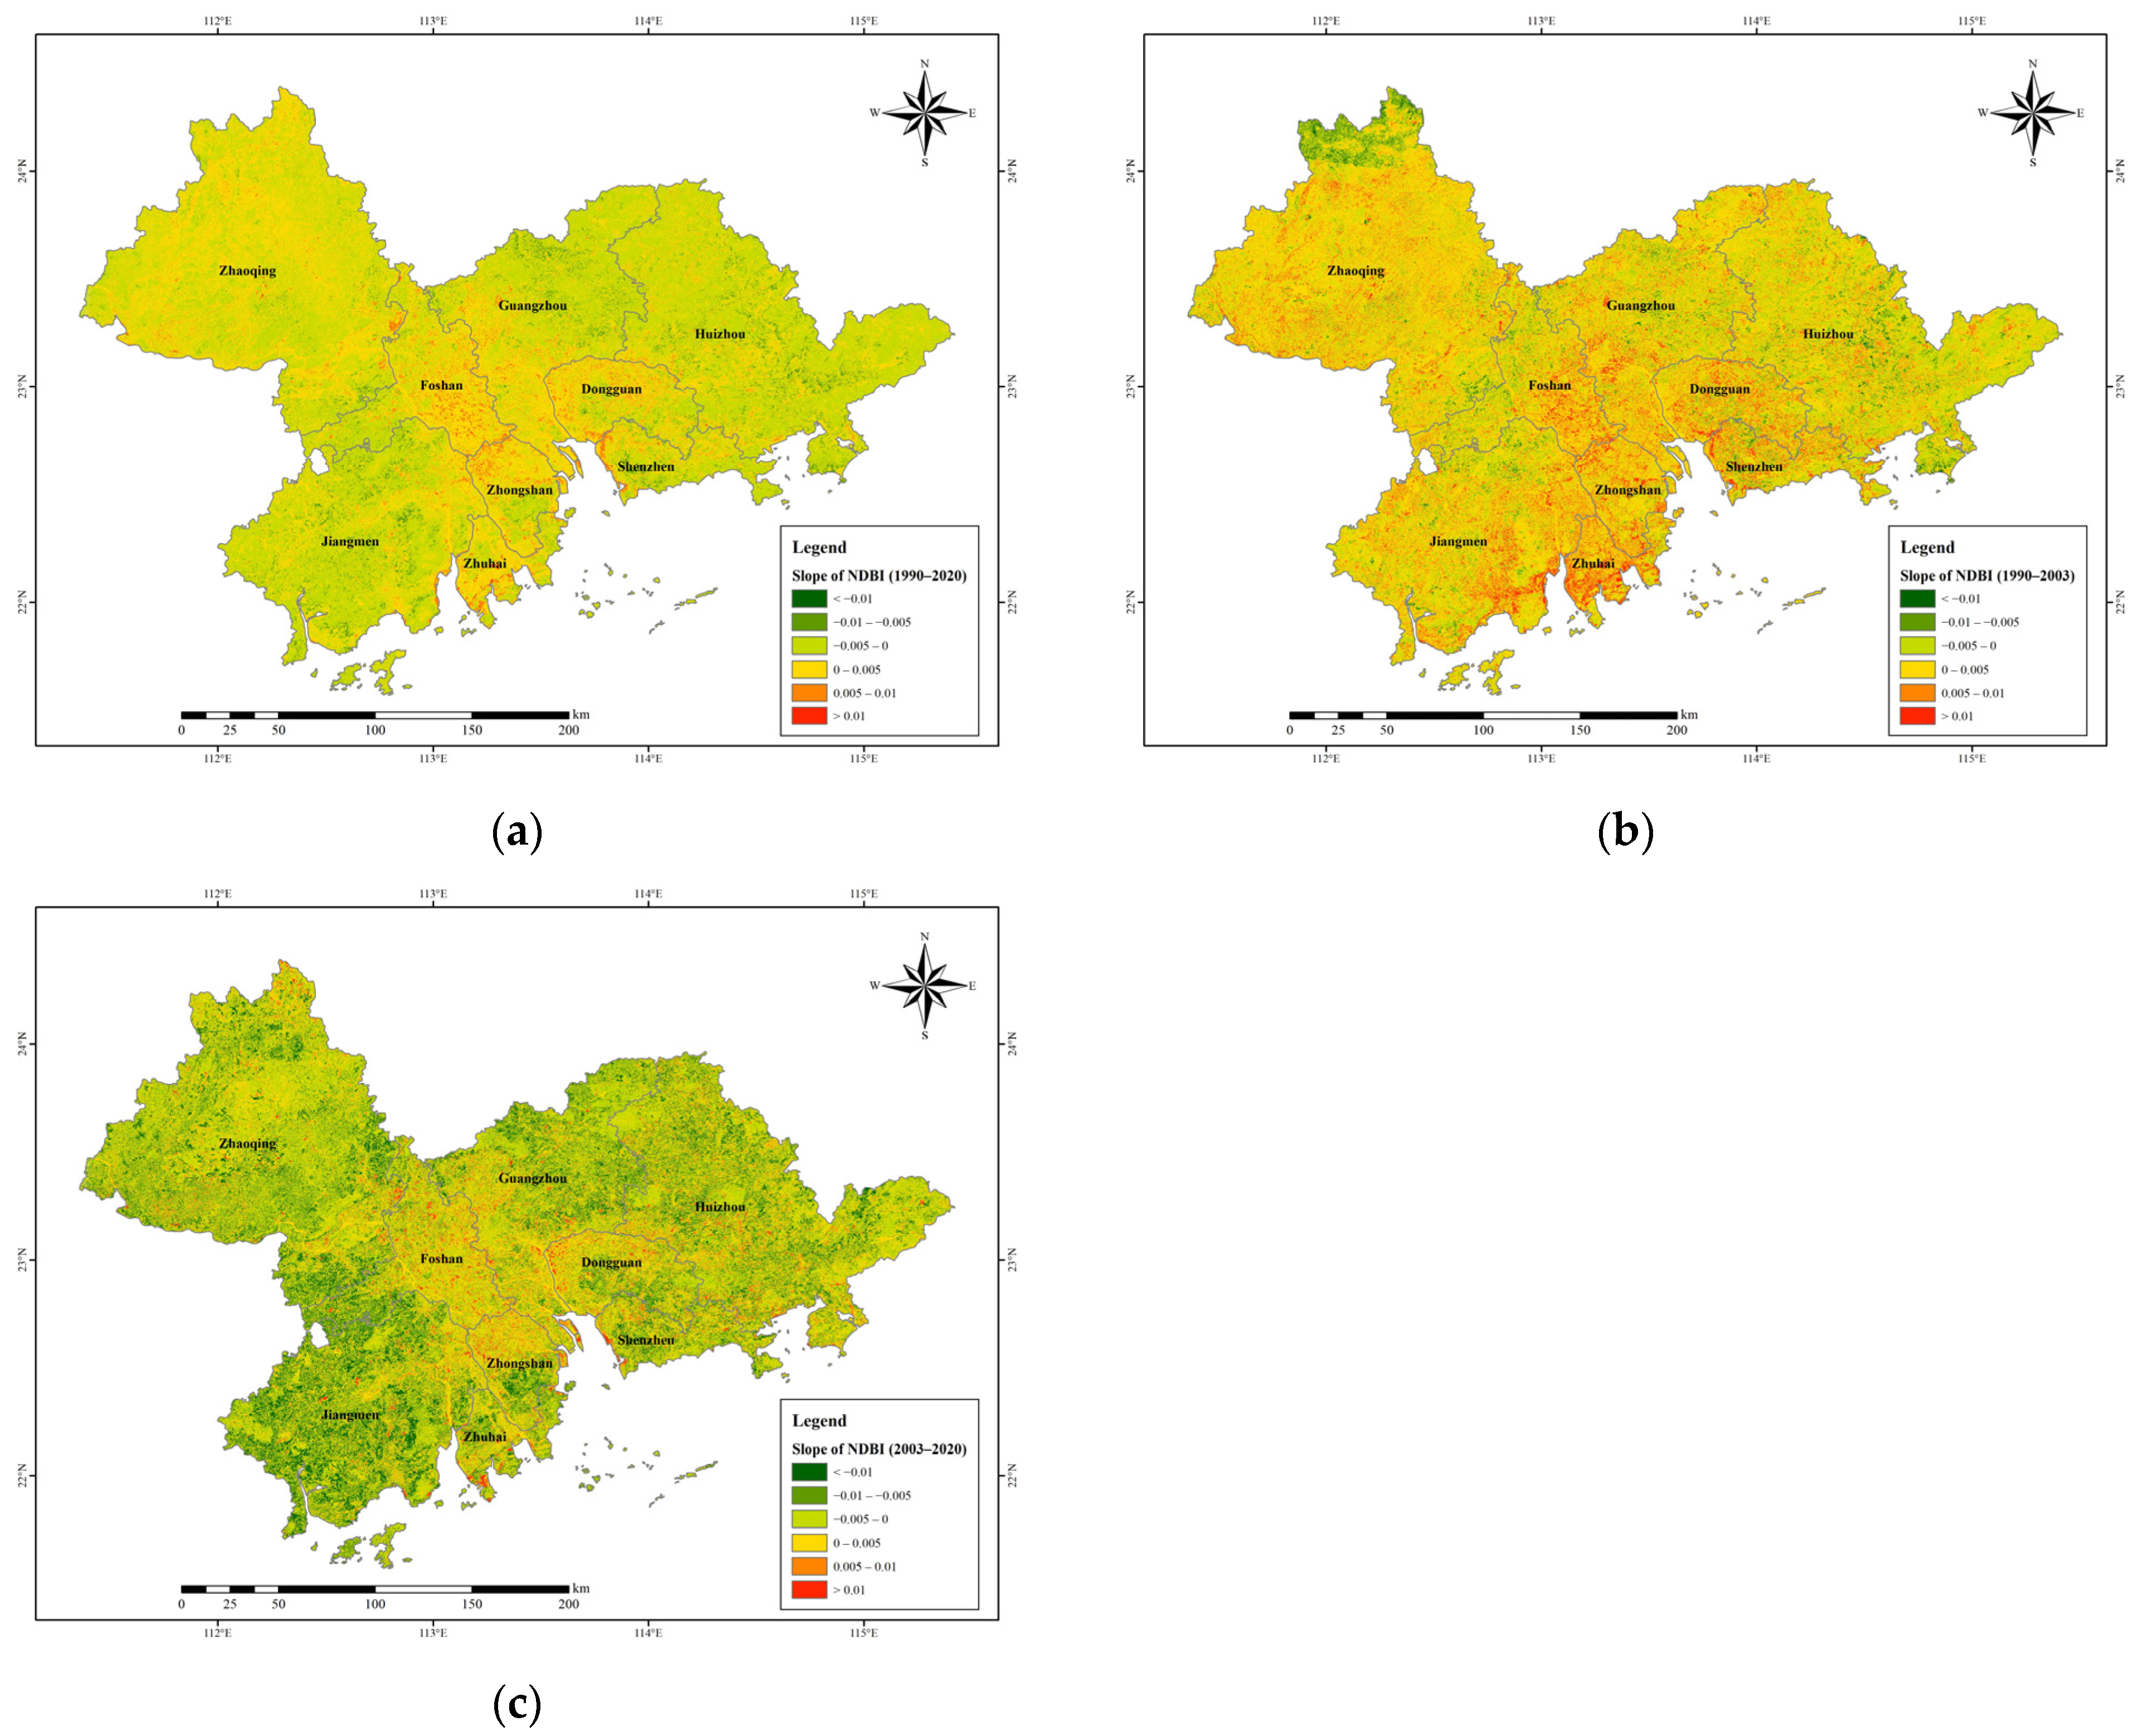
Figure 4.
(a) Trends of R99p in highly urbanized areas and non-highly urbanized areas; (b) trends of R95p in highly urbanized areas and non-highly urbanized areas; (c) trends of R99p in Guangzhou and Zengcheng; (d) trends of R95p in Guangzhou and Zengcheng; (e) trends of R99p in Nanhai and Gaoyao; (f) trends of R95p in Nanhai and Gaoyao.


Table 1.
Information on meteorological stations.
| Station Number | Longitude/ Decimal Degree | Latitude/ Decimal Degree | Altitude/m | Station Name | Time Series |
|---|---|---|---|---|---|
| 59271 | 112.43 | 23.63 | 57.3 | Guangning | 1990–2020 |
| 59278 | 112.45 | 23.03 | 41 | Gaoyao | 1990–2020 |
| 59287 | 113.48 | 23.22 | 41 | Guangzhou | 1990–2020 |
| 59288 | 113.12 | 23.03 | 3.1 | Nanhai | 1990–2020 |
| 59289 | 113.73 | 22.97 | 19.8 | Dongguan | 1990–2020 |
| 59294 | 113.83 | 23.33 | 38.9 | Zengcheng | 1990–2020 |
| 59298 | 114.37 | 23.07 | 22.4 | Huiyang | 1990–2020 |
| 59478 | 112.78 | 22.25 | 32.7 | Taishan | 1990–2020 |
| 59480 | 113.25 | 22.85 | 21.4 | Shunde | 1990–2020 |
| 59485 | 113.40 | 22.50 | 2.1 | Zhongshan | 1990–2020 |
| 59488 | 113.57 | 22.28 | 54 | Zhuhai | 1990–2020 |
| 59493 | 114.00 | 22.53 | 18.2 | Shenzhen | 1990–2020 |
Table 2.
Information on bands, wavelengths, and GEE data set for selected landsat satellites.
| Satellite | Bands | Wavelength/μm | GEE Data Set |
|---|---|---|---|
| Landsat 5 (TM) | NIR: B4 | 0.76–0.90 | C01/T1_SR |
| SWIR1: B5 | 1.55–1.75 | C01/T1_SR | |
| Landsat 7 (ETM+) | NIR: B4 | 0.76–0.90 | C01/T1_SR |
| SWIR1: B5 | 1.55–1.75 | C01/T1_SR |
Table 3.
NDBI trend identification results of MK trend test.
| City | Slope | ||
|---|---|---|---|
| Non-Highly Urbanized Areas | Guangning | −0.0011 * | −0.0014 * |
| Gaoyao | −0.0022 * | ||
| Zengcheng | −0.0020 * | ||
| Huiyang | −0.0012 * | ||
| Taishan | −0.0016 * | ||
| Highly Urbanized Areas | Guangzhou | −0.0002 | 0.0000 |
| Shenzhen | −0.0004 | ||
| Dongguan | 0.0010 ** | ||
| Zhongshan | 0.0001 | ||
| Zhuhai | 0.0016 ** | ||
| Nanhai | 0.0004 ** | ||
| Shunde | 0.0006 * | ||
Notes: * Trend is significant at the 0.05 level. ** Trend is significant at the 0.01 level.
Table 4.
Extreme precipitation trend identification results of MK trend test.
| Slope | R99p | R95p | Annual Precipitation | ||||
|---|---|---|---|---|---|---|---|
| Non-Highly Urbanized Areas | Guangning | 1.22 | 1.27 | 3.8 | 3.84 | 7.44 | 9.37 |
| Gaoyao | 0.48 | 1.18 | 2.66 | ||||
| Zengcheng | 2.42 | 6.87 | 16.44 | ||||
| Huiyang | 2.92 * | 7.15 * | 11.23 | ||||
| Taishan | 0.37 | 1.45 | −0.94 | ||||
| Highly Urbanized Areas | Guangzhou | 3.97 ** | 0.95 | 11.27 ** | 2.75 | 22.88 ** | 7.44 |
| Shenzhen | −0.2 | −1.18 | −4.67 | ||||
| Dongguan | 2.26 * | 6.60 * | 11.92 | ||||
| Zhongshan | 0.29 | 2.57 | 7.85 | ||||
| Zhuhai | −1.88 | −3.77 | −4.17 | ||||
| Nanhai | 2.44 | 6.26 | 14.26 * | ||||
| Shunde | 1.7 | 4.92 | 9.38 | ||||
Notes: * Trend is significant at the 0.05 level. ** Trend is significant at the 0.01 level.
Table 5.
Pearson’s correlation coefficients between NDBI and extreme precipitation.
| Pearson’s Correlation Coefficients | R99p | R95p | Annual Precipitation | |
|---|---|---|---|---|
| Non-Highly Urbanized Areas | Guangning | −0.110 | −0.047 | −0.005 |
| Gaoyao | −0.184 | −0.172 | −0.174 | |
| Zengcheng | −0.088 | −0.161 | −0.247 | |
| Huiyang | −0.415 * | −0.227 | −0.064 | |
| Taishan | −0.123 | −0.190 | −0.123 | |
| Highly Urbanized Areas | Guangzhou | 0.334 | 0.293 | 0.293 |
| Shenzhen | 0.262 | 0.416 * | 0.447 * | |
| Dongguan | 0.352 | 0.418 * | 0.358 * | |
| Zhongshan | 0.206 | 0.186 | 0.232 | |
| Zhuhai | 0.332 | 0.288 | 0.259 | |
| Nanhai | 0.391 * | 0.457 ** | 0.4 * | |
| Shunde | 0.361 * | 0.428 * | 0.373 * | |
Notes: * Correlation is significant at the 0.05 level (two-tailed). ** Correlation is significant at the 0.01 level (two-tailed).
Disclaimer/Publisher’s Note: The statements, opinions and data contained in all publications are solely those of the individual author(s) and contributor(s) and not of MDPI and/or the editor(s). MDPI and/or the editor(s) disclaim responsibility for any injury to people or property resulting from any ideas, methods, instructions or products referred to in the content. |
© 2024 by the authors. Licensee MDPI, Basel, Switzerland. This article is an open access article distributed under the terms and conditions of the Creative Commons Attribution (CC BY) license (https://creativecommons.org/licenses/by/4.0/).
Share and Cite
MDPI and ACS Style
Xu, T.; Yang, Z.; Gao, X.; Zhou, J. A Study on the Evolution of Urban Underlying Surfaces and Extreme Rainfall in the Pearl River Delta. Water 2024, 16, 267. https://doi.org/10.3390/w16020267
AMA Style
Xu T, Yang Z, Gao X, Zhou J. A Study on the Evolution of Urban Underlying Surfaces and Extreme Rainfall in the Pearl River Delta. Water. 2024; 16(2):267. https://doi.org/10.3390/w16020267
Chicago/Turabian StyleXu, Tianyin, Zhiyong Yang, Xichao Gao, and Jinjun Zhou. 2024. "A Study on the Evolution of Urban Underlying Surfaces and Extreme Rainfall in the Pearl River Delta" Water 16, no. 2: 267. https://doi.org/10.3390/w16020267
Note that from the first issue of 2016, this journal uses article numbers instead of page numbers. See further details here.