Article

Comparative Analysis of Flood Prevention and Control at LID Facilities with Runoff and Flooding as Control Objectives Based on InfoWorks ICM

1
Faculty of Architecture, Civil and Transportation Engineering, Beijing University of Technology, Beijing 100124, China
2
State Key Joint Laboratory of Environmental Simulation and Pollution Control, School of Environment, Beijing Normal University, Beijing 100875, China
*
Authors to whom correspondence should be addressed.
Water 2024, 16(3), 374; https://doi.org/10.3390/w16030374
Submission received: 27 November 2023 / Revised: 17 January 2024 / Accepted: 19 January 2024 / Published: 23 January 2024
(This article belongs to the Special Issue Urban Flood Mitigation and Sustainable Stormwater Management)

Abstract

:
Climate change and urbanization have led to an increase in the amount of water flowing into traditional drainage systems, which results in frequent urban flooding. Low–Impact Development (LID) facilities, with their distributed feature, are one of the important means to mitigate flooding and have been widely used. In this paper, based on integrated catchment management (ICM), we compare the abatement of runoff, flooding, and ponding under two durations of rainfall and eight different return periods with runoff as the control objective (RACO) and flooding as the control objective (FACO) for the deployment of LID facilities. The waterlogged area of FACO is higher by a range of 92.462 m2 to 24,124.39 m2 compared to RACO. Both percentage reduction of overflow volume and runoff volume tend to decrease gradually with the increase in the return period. For the percentage reduction of runoff volume per unit area, sometimes RACO is greater than FACO, and sometimes vice versa, while for the percentage reduction of overflow volume per unit area, the range where FACO exceeds RACO is between 0.29 to 10.95 (%/ha). The cost of FACO has decreased by 4.94% to 46.20% compared to RACO. This shows that FACO’s LID deployment method can fully utilize the capacity of LID facilities to mitigate inundation, reducing the cost of LID facilities to a certain extent.

1. Introduction

In recent years, urbanization has been advancing, and the increase in extreme weather caused by global warming and the urban heat island effect has put a great deal of pressure on traditional stormwater management systems [1], resulting in more frequent urban flooding, which has caused great economic losses and human casualties [2]. Since low–impact development (LID) facilities use green infrastructure (permeable pavement, green roof, rain garden, etc.), which can restore urban hydrology to the predevelopment function to a certain extent [3], LID facilities are currently used as an auxiliary method to mitigate the problem of urban flooding in combination with the traditional gray facilities [4].
There have been several multifaceted studies of LID facilities that have used runoff as a control objective. Muttil et al. [5] studied the recharge efficiency of LID facilities, such as infiltration trenches, in urban areas under climate change. Gilroy and McCuen [6] used a spatial and temporal model to analyze the effects of the location and number of LID facilities on runoff and flow. Guo [7] proposed a quantitative method (using long–term runoff statistics as an indicator) for evaluating the LID program. Aguayo et al. [8] developed an application that allows for detailed mapping of thousands of plots to address urban runoff–related issues to evaluate the cost of LID facilities. Joksimovic and Alam [9] calculated the full life–cycle cost and evaluated the cost efficiency of LID portfolio scenarios targeting runoff control based on the stormwater management model (SWMM) in accordance with the costing tool and guidance document. Bhaskar et al. [10] examined changes in basic flow regimes, such as flow due to LID facilities, under urbanization by comparing forest and urban LID watersheds. Leimgruber et al. [11] conducted sensitivity analysis and evaluation of green roof, infiltration trench, and bioretention basin parameters under long–term and single rainfall events based on the SWMM model under the influence of water balance of runoff volume, evapotranspiration, and groundwater recharge. Eckart et al. [12] adopted a multi–objective optimization simulation of the coupled model of SWMM and Borg MOEA with the goal of reducing peak flow, runoff volume, and cost of objective optimization simulation to evaluate LID facilities. Liu et al. [13] assessed water quantity impacts of BMP and LID facilities using runoff volume abatement. Wang et al. [14] considered the cost–effectiveness of bioretention facilities under climate change and urbanization using peak runoff combined with TSS.
Meanwhile, there have been many studies on the effectiveness of LID in mitigating urban flooding using runoff as the control objective. Jemberie and Melesse [15] analyzed the effects of individual and combined LID facilities on runoff based on SWMM using different rainfall distribution patterns and different durations of rainfall to evaluate the effectiveness of mitigating flooding. Li et al. [16] developed a multi–objective optimization design framework to analyze the effectiveness of detention ponds and LID facilities in improving water quality and controlling flood risk. Tansar et al. [17] explored the effect of LID facilities on flood control at the spatial scale by placing LID facilities in the upper, middle, and lower reaches of a region under different rainfall scenarios. Suresh et al. [18] analyzed the effect of LID facilities on the control of runoff depth and peak runoff in micro–urban watersheds to quantify the extent of their reduction in flooding in the context of climate change. Sin et al. [19] proposed a curve number approach to evaluate flood mitigation using storage and infiltration facilities. Luan et al. [20] simulated LID facilities in a typical mountainous area to analyze their flood mitigation effect. Dos Santos et al. [21] compared LID facilities with conventional drainage systems using a life cycle evaluation of the environmental and hydrological impacts of LID facilities in highly urbanized areas. Kumar et al. [22,23] combined SWMM with NSGA–II for multi–objective optimization to evaluate the effectiveness of LID facilities in mitigating urban flooding using runoff indicators and costs as optimization objectives. The abovementioned studies on LID facility flood mitigation were all evaluated using runoff volume, depth, and peak flow rate as evaluation metrics. The use of runoff as a control index for evaluating the flood mitigation of LID facilities may result in a situation where LID facilities may be deployed in areas that do not generate overflow or small overflow.
To solve the above problems, this paper adopts two control objectives for LID deployment: one is to take runoff as the control objective (RACO), which means the reduction effect of runoff is optimal, and the other is to take flooding as the control objective (FACO), which means the reduction effect of overflow is optimal. The simulation is based on InfoWorks ICM in eight different return periods and two types of rainfall durations to analyze the abatement effects of LID deployment methods on runoff, flooding, and ponding under the control objectives.

2. Materials and Methodologies
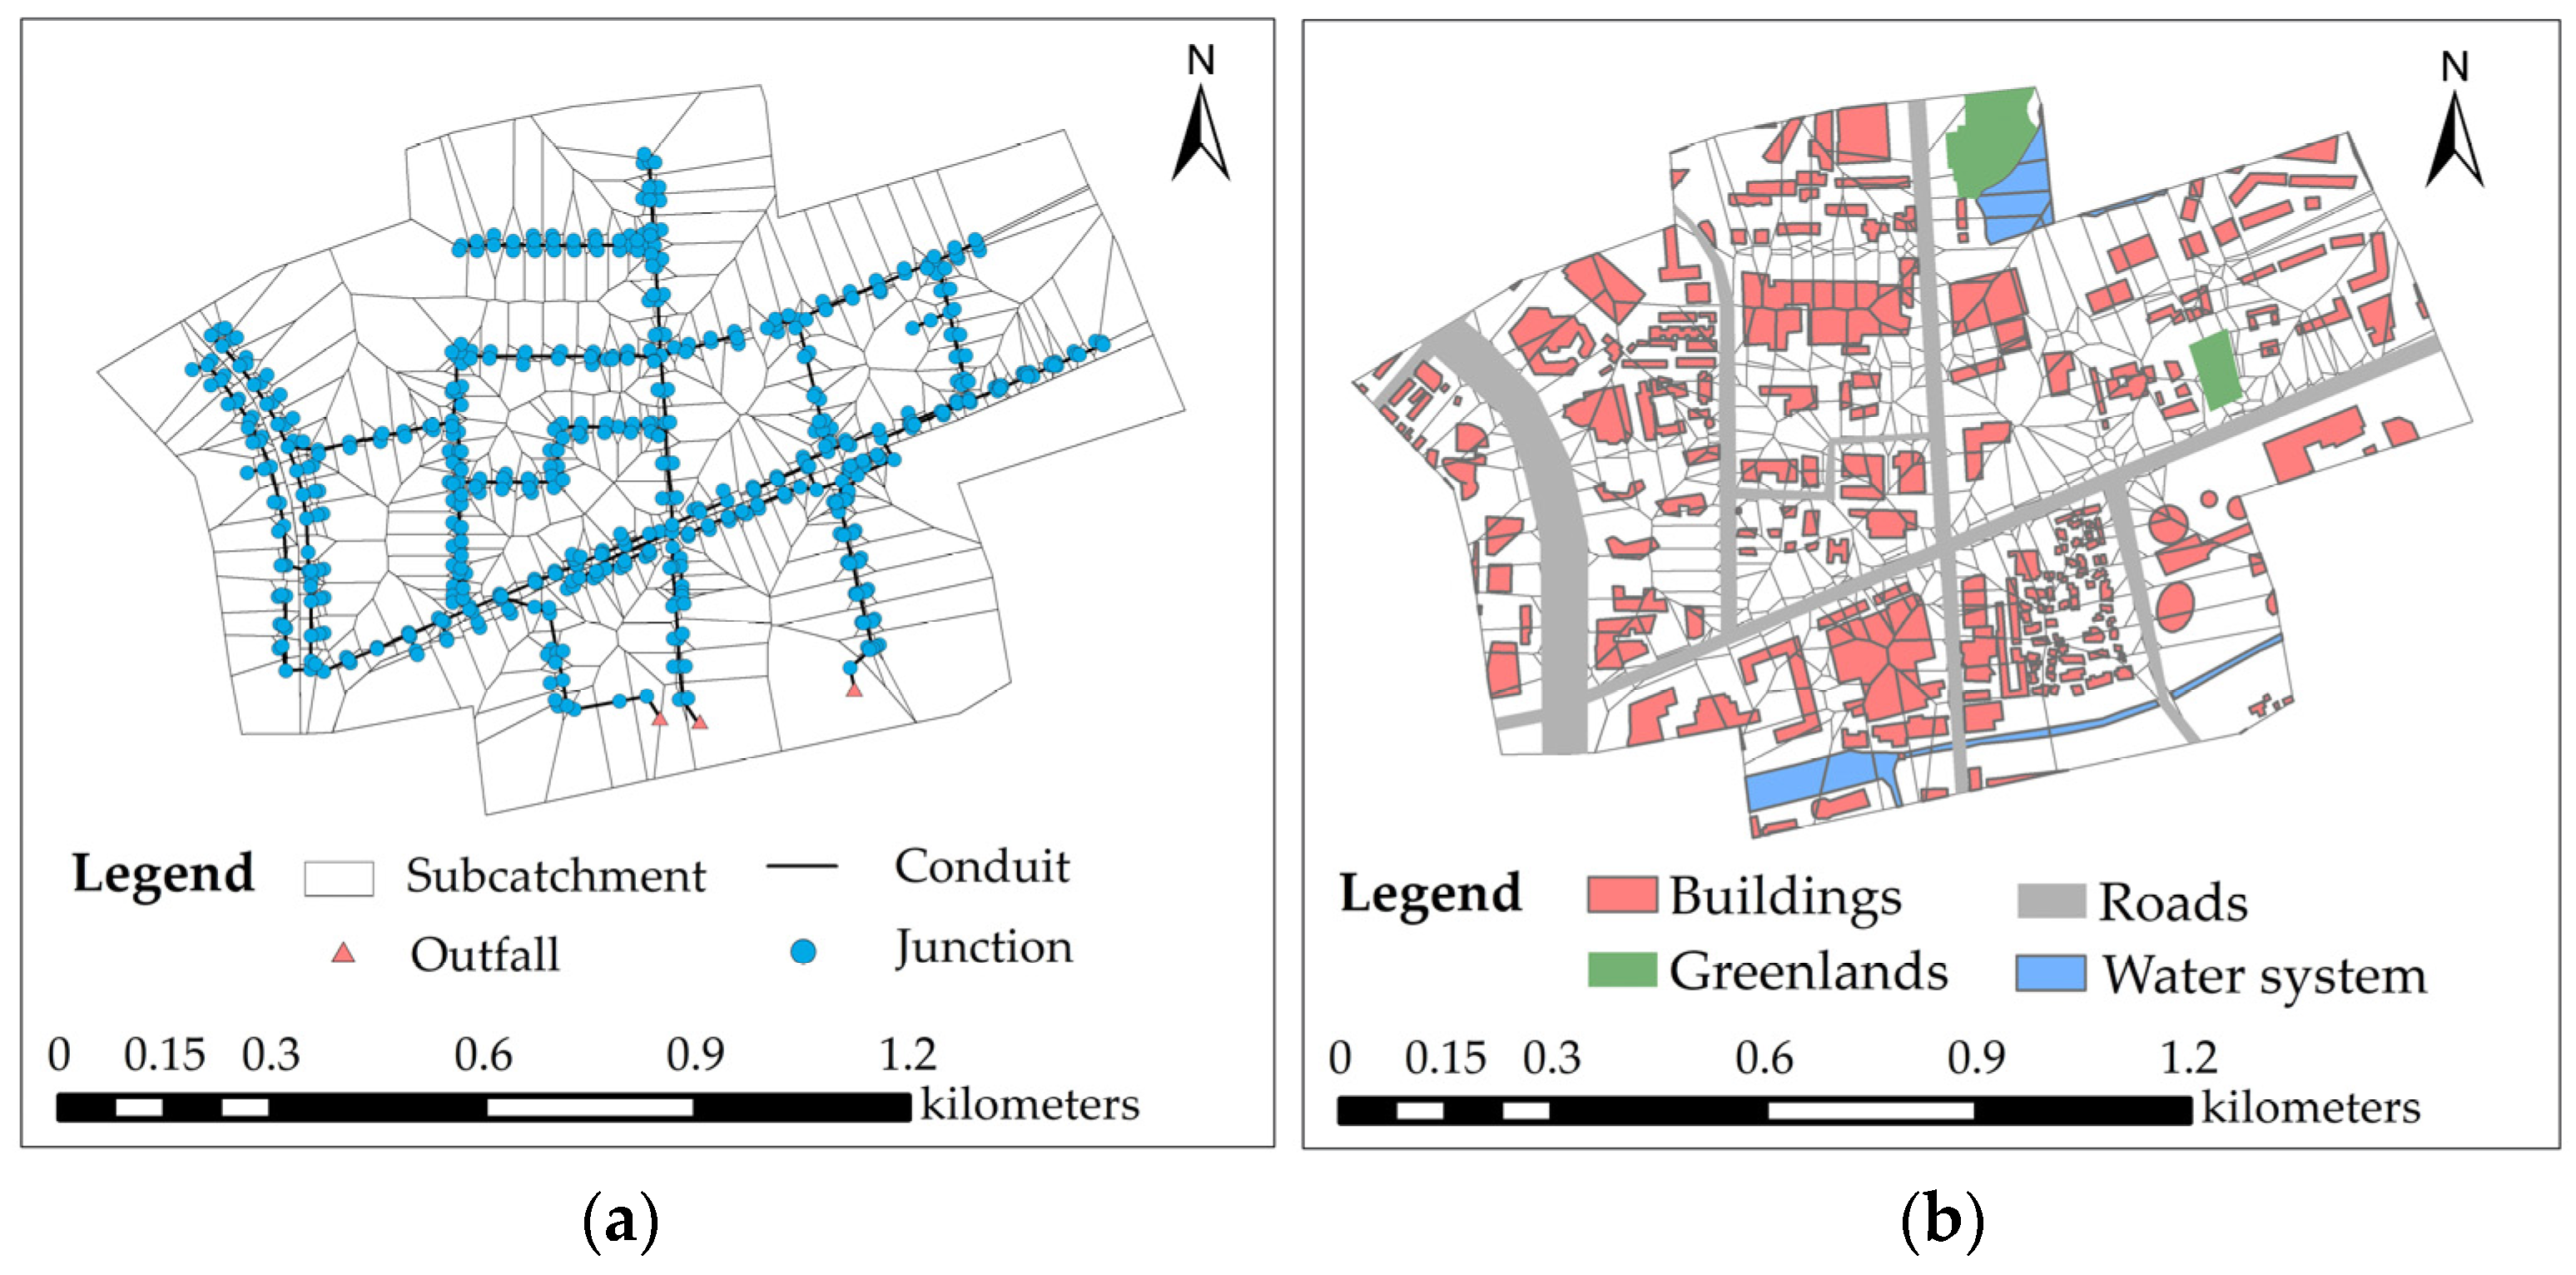
2.1. Study Area

The study area of this paper is in Chaoyang District, Beijing, China, with the central coordinates of 116°47′ E and 39°95′ N. The study area has a total area of 119.64 ha, with an east–west length of 1500 m and a north–south width of 1040 m. Summer is hot and rainy, and when the rainfall is large, the research area relying on a pipe network for drainage is prone to flooding. The schematic diagram of the research area is shown in Figure 1.

2.2. ICM Model

2.2.1. ICM Model Generalization

InfoWorks ICM is urban integrated catchment drainage modeling software developed by Wallingford, UK. It can solve time–consuming two–dimensional hydrodynamic problems through GPU–based parallel computation and is widely used in the fields of water quality testing, assessment of the current status of urban drainage systems, urban flooding risk assessment, etc. [24,25,26]. According to the topographic distribution and pipe network distribution of the study area, the study area is finally generalized into 577 subcatchments, 577 junctions, 580 conduits, and 3 outfalls, and an ICM model is built. The catchment yield and flow parameters are set according to different land use types. The land use types in the study area include buildings, roads, green space, water systems, and comprehensive land use. The ICM model and the land use distribution in the study area are shown in Figure 2 below.

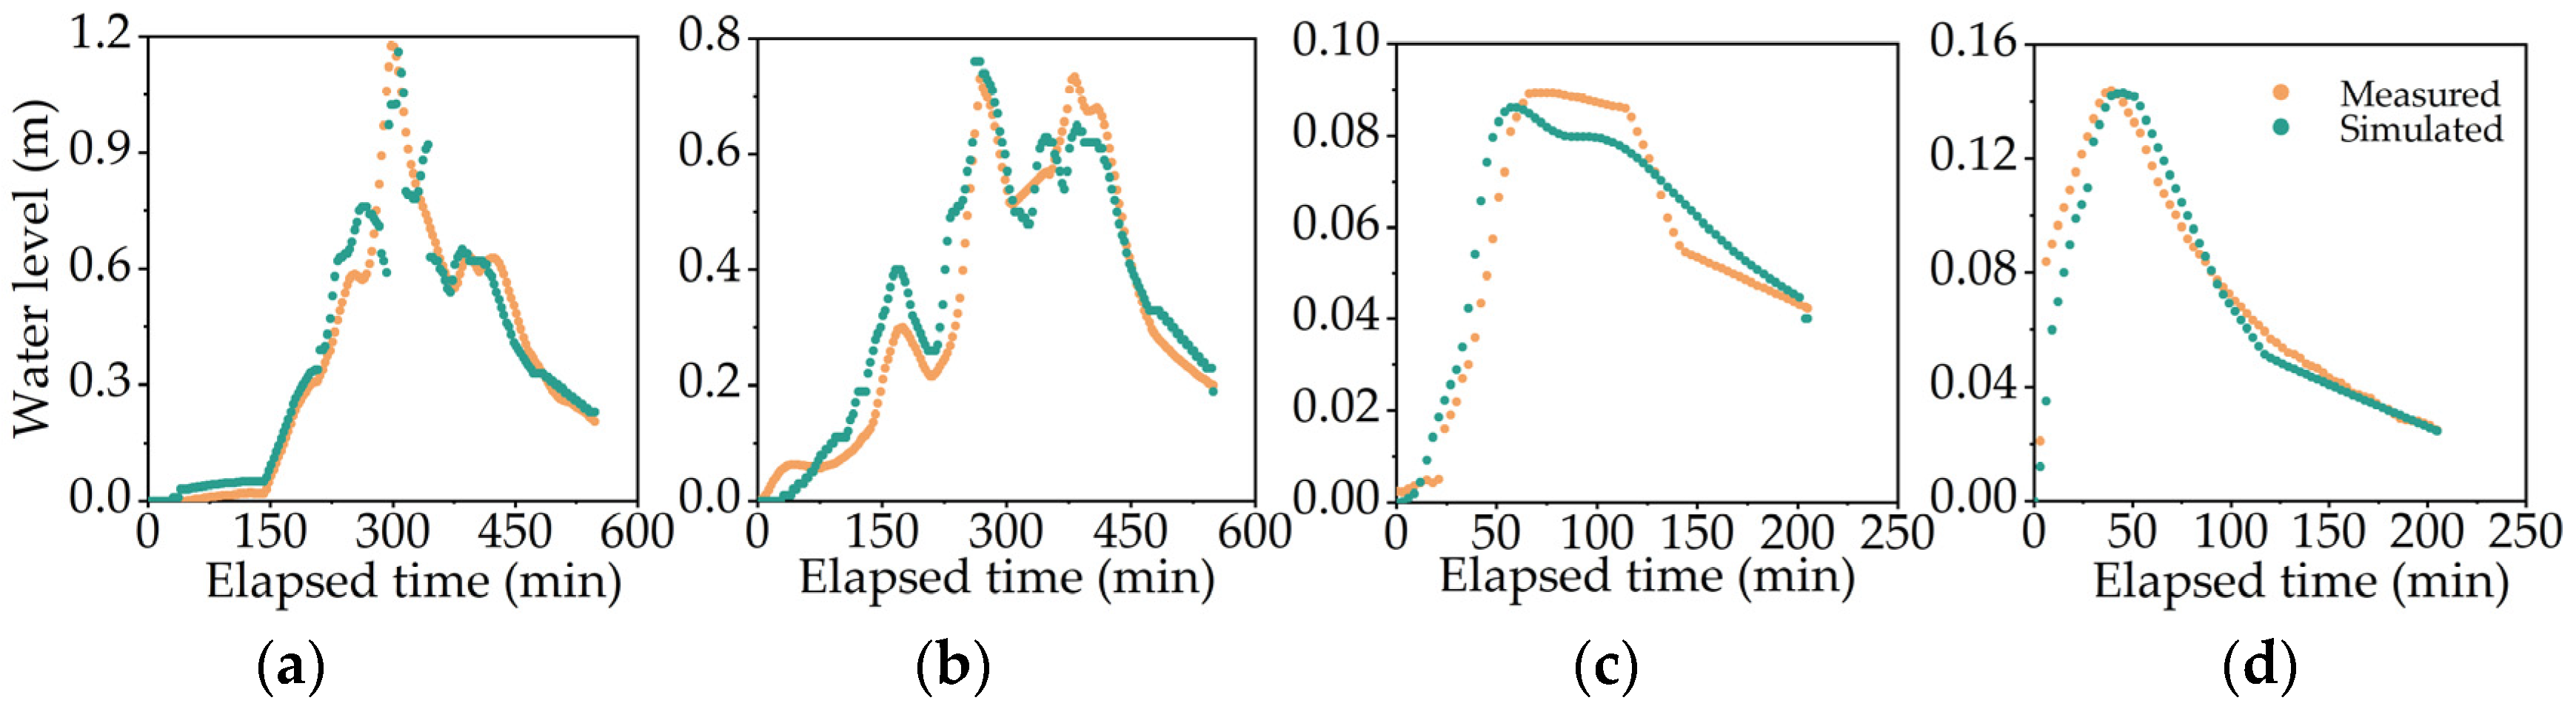
2.2.2. Parameter Calibration and Verification

Some of the parameters in this paper need to be calibrated and validated, and in this paper, the Nash–Sutcliffe efficiency coefficient (NSE), Root Mean Square Error (RMSE), and Percentage Bias (PBIAS) are used to quantify the degree of deviation between measured and simulated values, assessing simulation accuracy. The calculation formulas for three indicators are given by the following Equations (1)–(3):
N E S = 1 t = 1 T ( Q o t Q m t ) 2 t = 1 T ( Q o t Q 0 ¯ ) 2 ,
P B I A S = t = 1 T Q 0 t Q m t t = 1 T Q 0 t ,
and
R M S E = t = 1 T Q 0 t Q m t 2 T
where Q o t is the measured depth of observed inspection wells; Q m t is the simulated depth of observed inspection wells; Q o ¯ is the mean of all measured depths of observed inspection wells.
In this paper, the water levels of two inspection wells, J155 and J280, are observed. The rainfall event on 21 August 2022, with a rainfall amount of 81.4 mm and a rainfall duration of 548 min, is used to calibrate the model parameters. Additionally, the rainfall event on 3 September 2022, with a rainfall amount of 10.2 mm and a rainfall duration of 206 min, is utilized to validate the model parameters. The process lines of the measured and simulated water levels are shown in Figure 3 below. The calculation results of the three indicators for J155 and J280 under the two rainfall events are presented in Table 1. The model demonstrates a certain level of accuracy.

2.2.3. Design Storms

The design rainfall adopted in this model is calculated according to the design rainstorm intensity formula of the Beijing local standard, “ Technical specification for construction and application of the mathematical model of urban flooding prevention and control system” (DB11/T 2074–2022) [27]. The calculation formula is as follows (4). Two durations of rainfall, 180 min and 1440 min, are used, along with eight different return periods: 2, 3, 5, 10, 20, 30, 50, and 100 a, respectively. The study area belongs to the Beijing II district. The design rainfall patterns and rainfall depths for durations of 180 min and 1440 min with 8 different periods are shown in Figure 4 and Table 2, respectively.
  q = 1602   ( 1 + 1.037   l g P ) ( t + 11.593 )   0.681 ,
where q is the design storm intensity, L/(s·hm2); p is the return period of rainstorms (equals 2, 3, 5, 10, 20, 30, 50, or 100 a); t is the rainstorm duration (equals 180 or 1440 min).

2.3. Two Different Targets Setting Up LID Facilities

2.3.1. Targeting Runoff

To better evaluate the effectiveness of LID facilities, this paper employs two different approaches to deploy them: RACO and FACO.
Based on the study area of this paper, which includes commercial buildings, residential buildings, office buildings, green spaces, gardens, and plazas, three types of LID facilities are considered, namely rain gardens, green roofs, and permeable pavements. Rain gardens are paved on existing green spaces, gardens, or larger open spaces around buildings; green roofs are distributed on commercial, residential, and office buildings; and permeable pavements are paved on open spaces, sidewalks, open parking lots, plazas, and public places around buildings. In this paper, the parameters of the LID facilities are set according to the literature [28], as shown in Table 3.
Only surface runoff due to rainfall is considered (i.e., runoff due to snowmelt and subsurface runoff are not considered). The rainfall generated falls to the ground and generates runoff over the entire rainfall area. Therefore, runoff reduction is an area–wide indicator. The more the LID facilities are installed, the more effective the runoff reduction will be. The installation of LID facilities through RACO means that rain gardens, green roofs, and permeable pavements are installed in all areas where LID facilities can be implemented based on the type of land use in the study area, as shown in Figure 5a. The total areas of rain gardens, green roofs, and permeable pavements in the RACO method are 11.17 ha, 28.02 ha, and 14.28 ha, respectively.

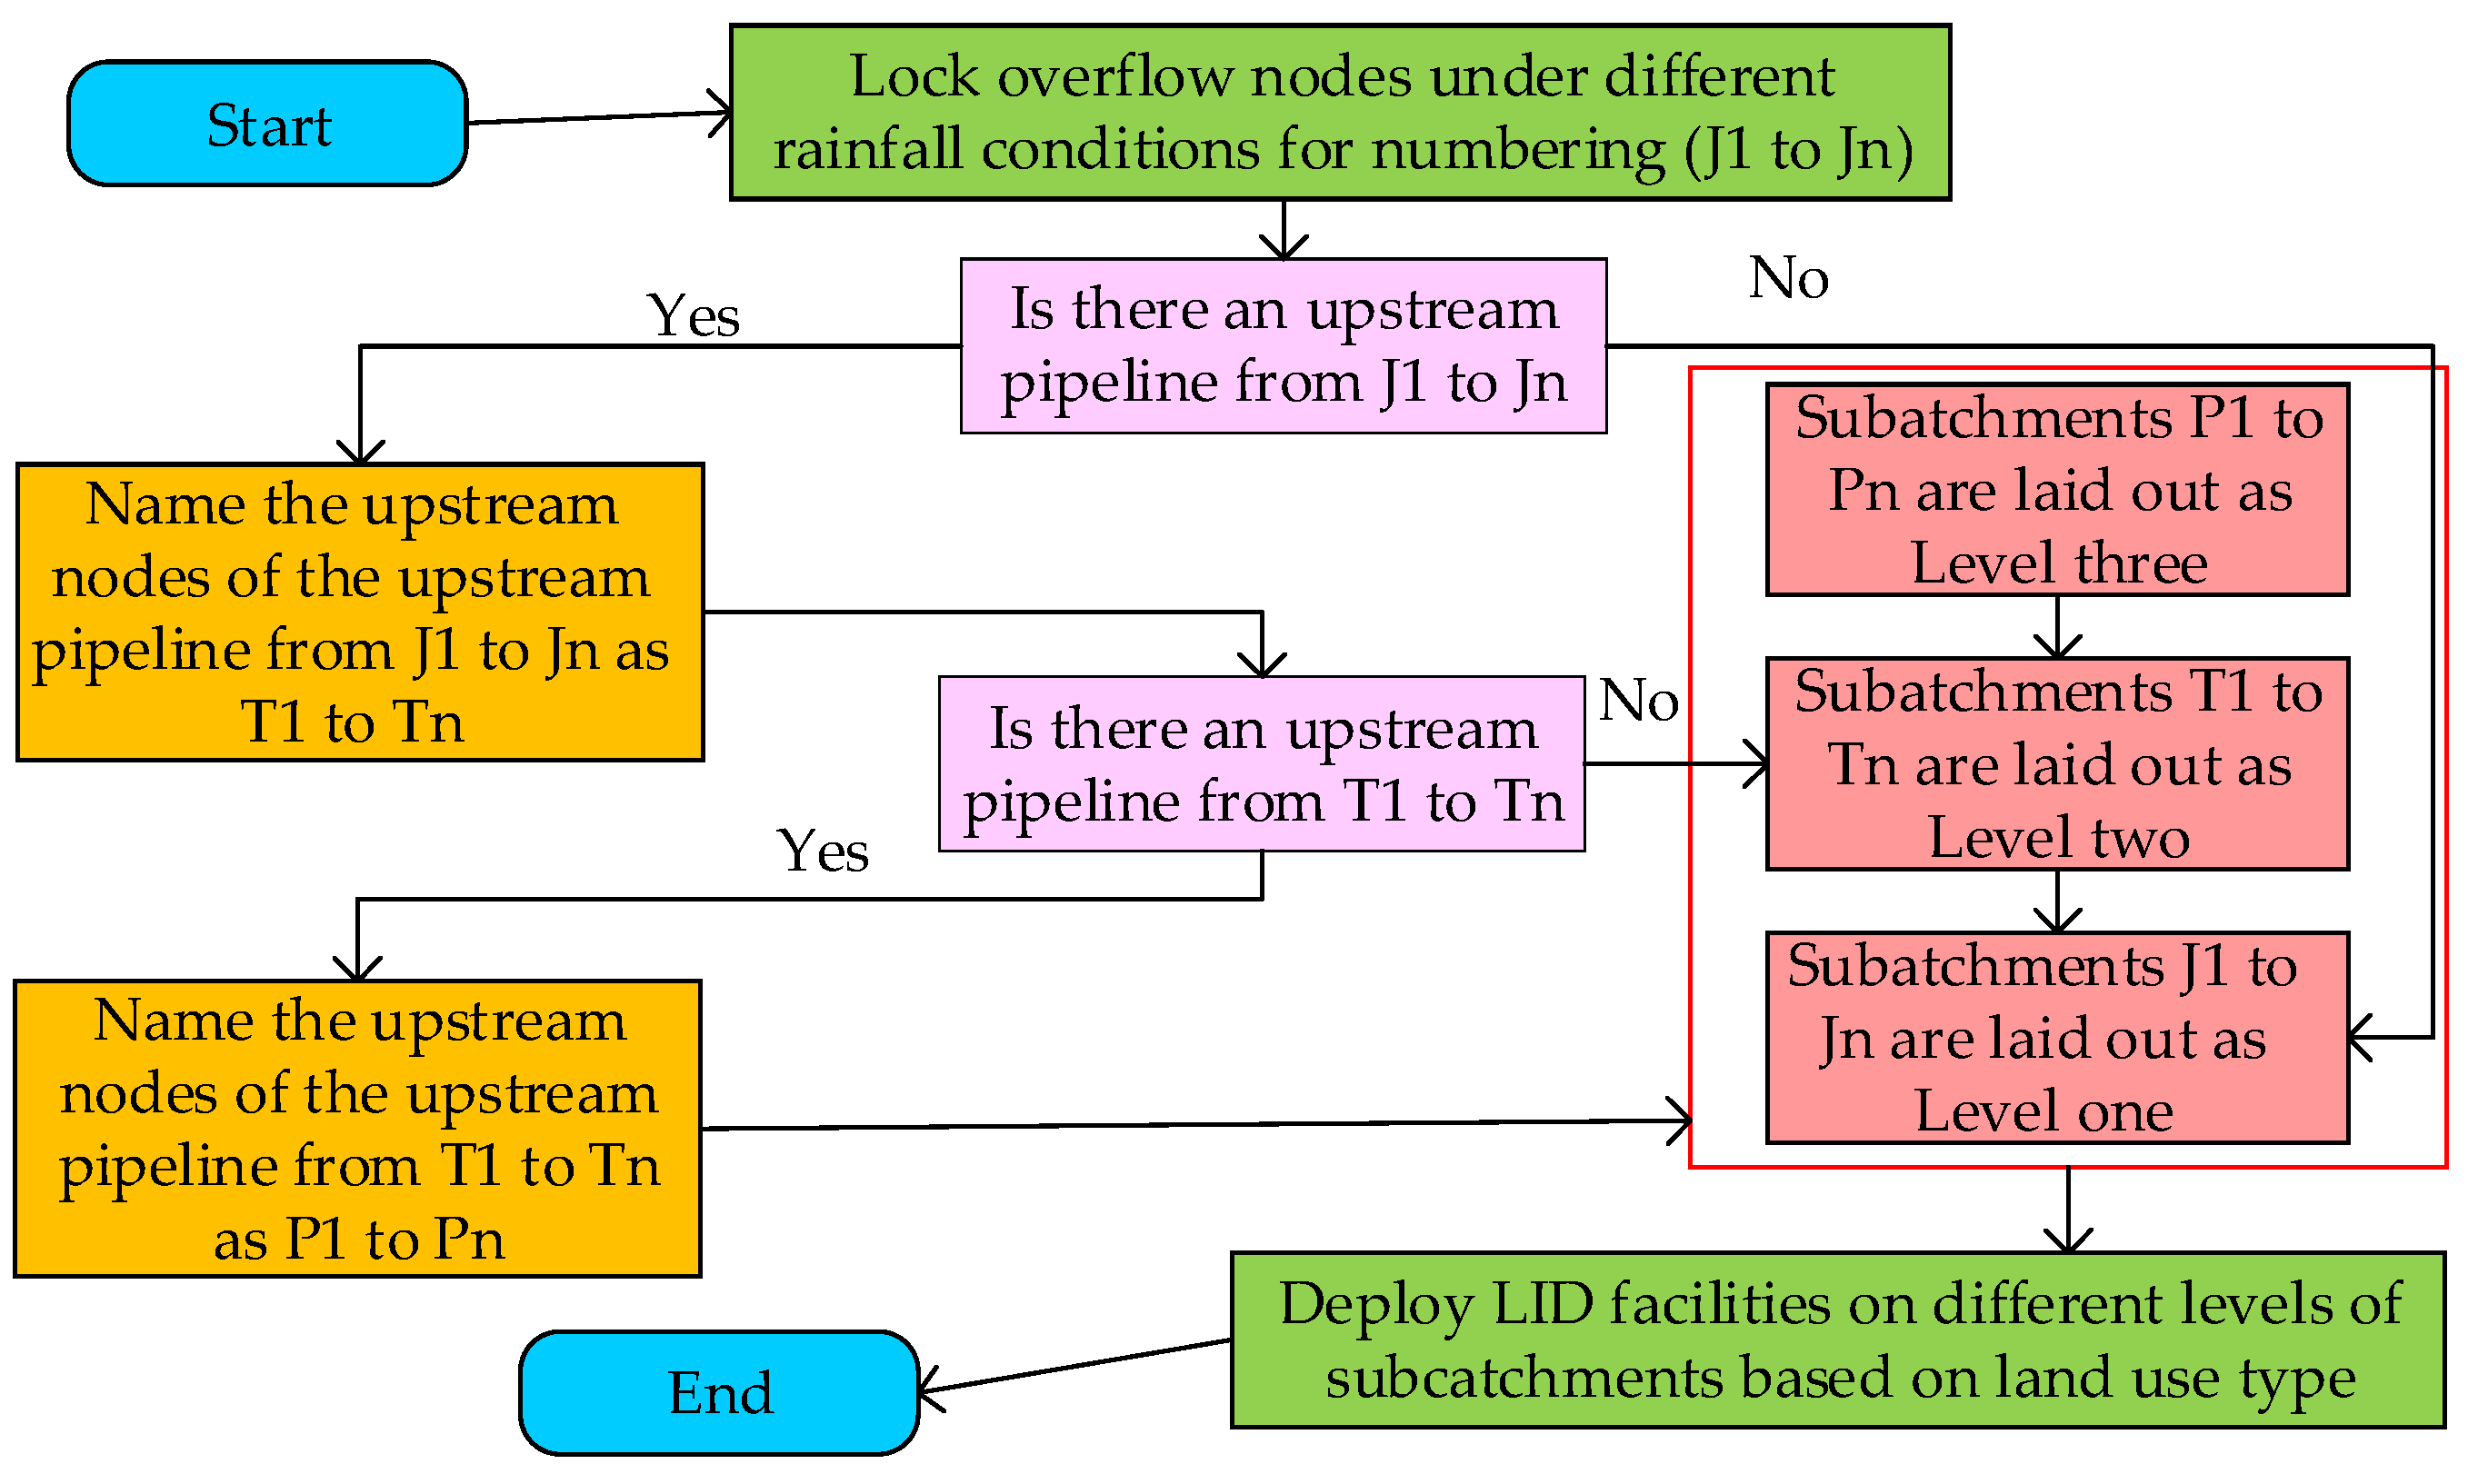
2.3.2. Targeting Flooding

When rainfall exceeds the capacity of the drainage network, flooding and ponding occur. The deployment method of RACO is to install LID facilities wherever possible, which is effective for runoff abatement but may be less effective for node overflow abatement. The reason is that there will be no overflow near the node of the subcatchments to arrange LID facilities; the control effect on runoff is obvious, but the control effect on the node overflow is not apparent. The deployment of LID facilities in the form of FACO should focus on the subcatchments near the nodes where overflow occurs. This approach achieves a larger flooding control effect with a smaller investment in LID facilities.
For FACO, the design rainfall for different return periods is first into the ICM. The overflow nodes in the original pipe network are targeted, the upstream pipe nodes where overflow nodes are located are tracked. LID facilities are then placed in the subcatchments where the tracked nodes are located. With each additional level of subcatchments upstream of each overflow node, the area of the LID layout increases exponentially due to the presence of pipe network branches. In other words, the higher the level of subcatchments, the larger the area of drainage and flooding facilities involved, the higher the costs, and the less effective the control of overflow from the nodes. Therefore, subcatchments above Level 3 are not paved. The type and area of LID facilities to be paved in different levels of subcatchments depend on the type of land use. For FACO, the area of the three types of LID facilities laid is shown in Table 4, and the extent of LID laid for a return period of 20 a under short duration is shown in Figure 5b. The flow chart of the laying process is shown in Figure 6.

2.4. Cost of LID Facilities

Some studies evaluate LID facilities not only from the aspects of runoff and flooding but also from economic perspectives [29,30,31]. To assess the economic viability of LID facilities deployed through two kinds of targets, this paper adopts the whole life cycle to calculate the cost of LID facilities, which is divided into two parts: unit infrastructure cost and unit maintenance cost. According to references [28], the cost settings for three kinds of LID facilities are shown in Table 5. According to references [29], the LID facility cost calculation formula is expressed in the following Equation (5):
A = S · B + n · S · C ,
where A is the total cost of LID facilities; B is the unit infrastructure cost of LID facilities; C is the unit maintenance cost of LID facilities; S is LID facilities layout area; n is the life cycle of LID facilities, and the life cycle of this paper is 30 a.

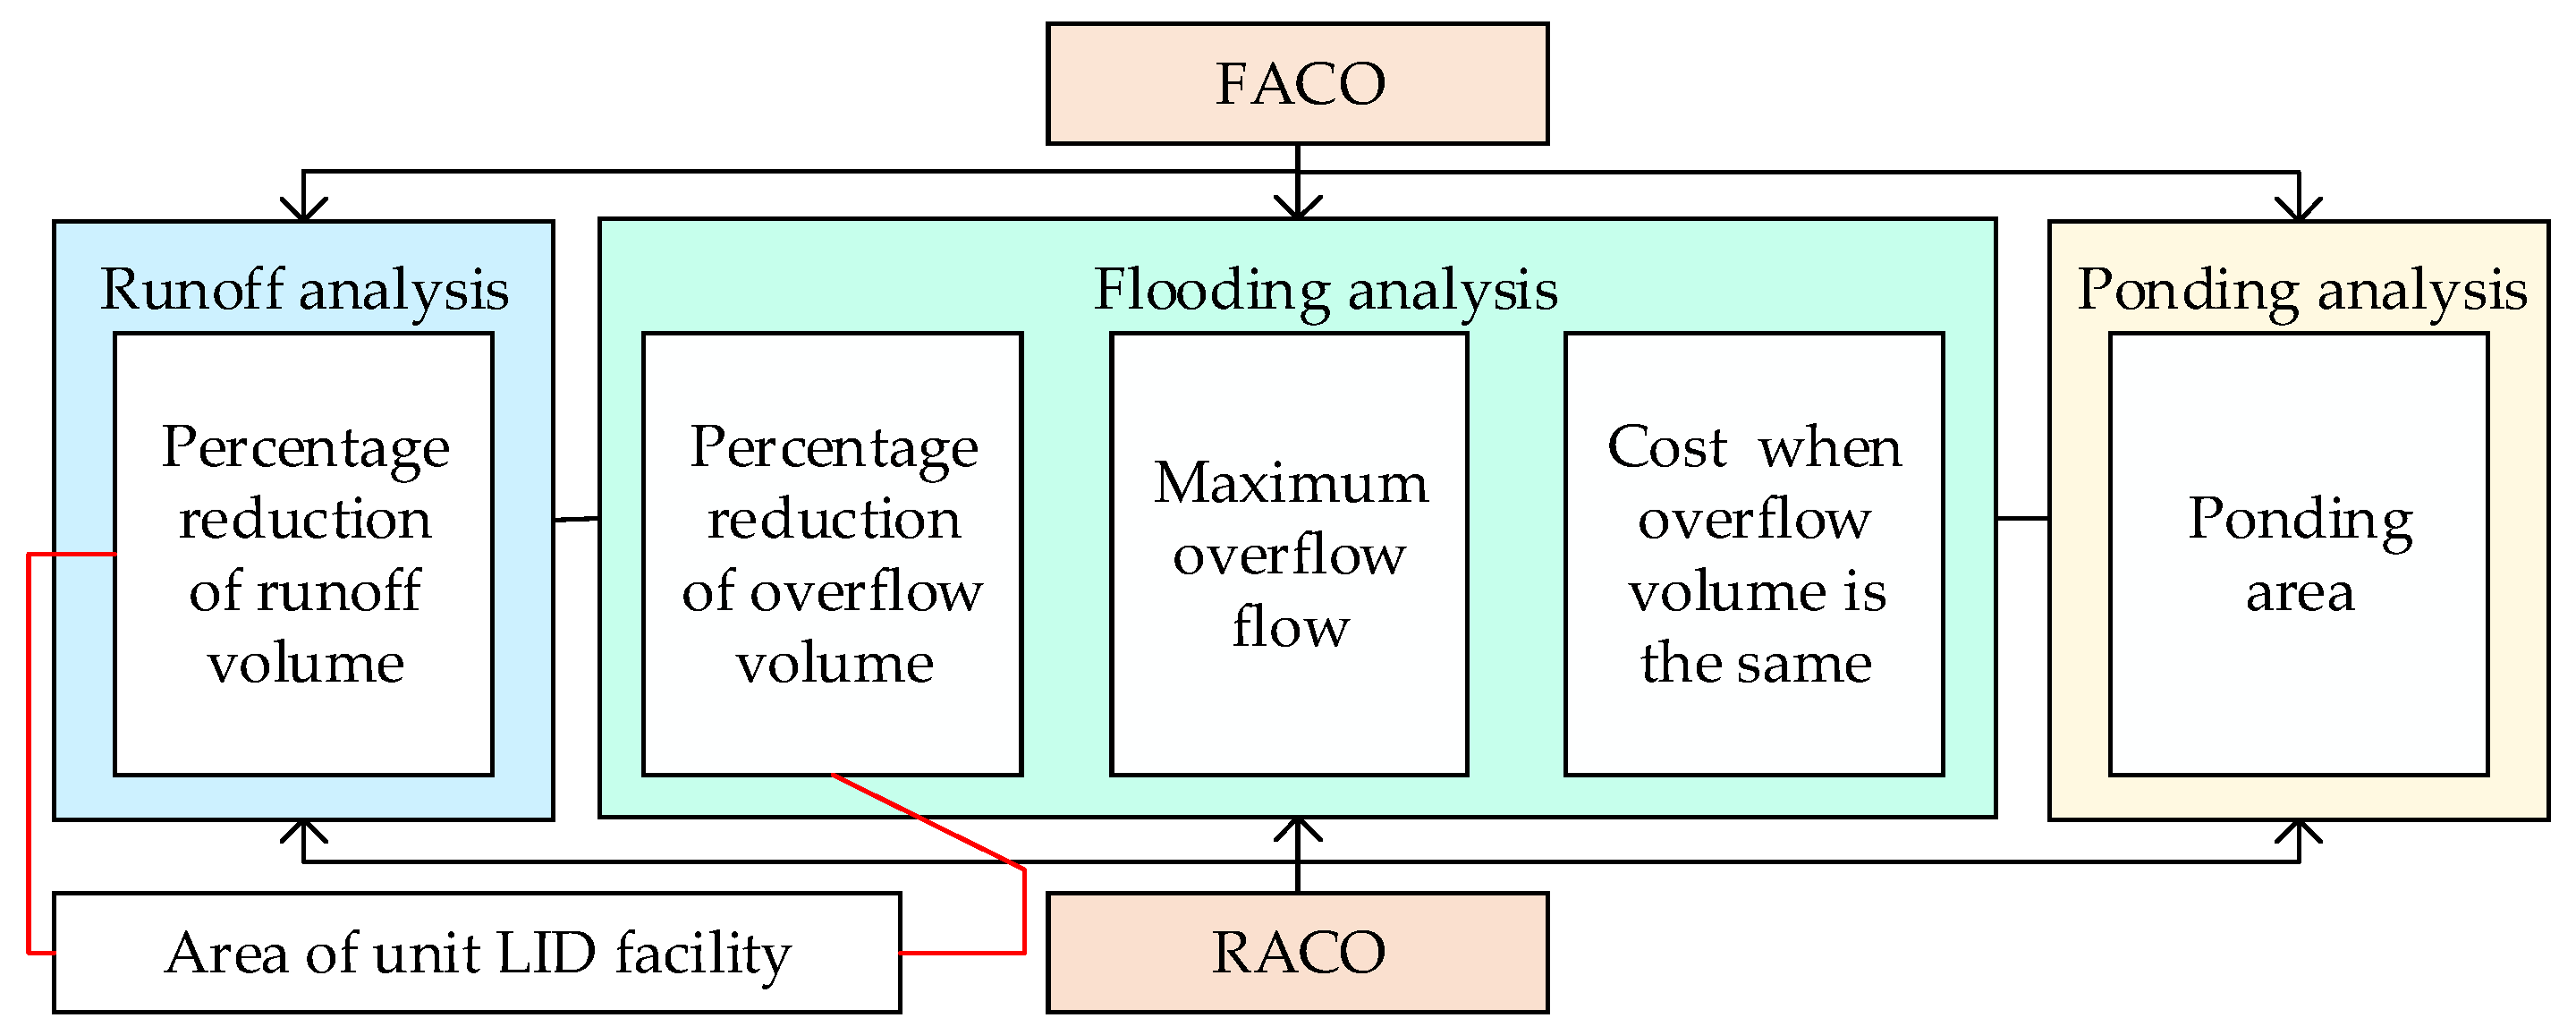
2.5. Evaluation Index

Due to the difference in the area of the LID facilities laid out as RACO and FACO, this paper adopts the percentage reduction of runoff volume per unit area as the runoff evaluation index and the percentage reduction of overflow volume per unit area as the flooding evaluation index. The formula is as follows (6):
P i = A i   S i         A i = C i     B i C i ,   i = 1 , 2 ,
where P1 and P2 are the percentage reduction of runoff volume and the percentage reduction of overflow volume per unit area, respectively; S is the area of LID facilities; A1 and A2 are the percentage reduction of runoff volume and the percentage reduction of overflow volume, respectively; C1 and C2 are the total volume of runoff and the total volume of node overflow generated through the original pipe network, respectively; B1 and B2 are the total volume of runoff and the total volume of node overflow after LID facilities are installed at two targets, respectively.

3. Results

3.1. Comparison of Runoff Control Effect

To better analyze the layout of LID facilities aiming at optimal runoff control and optimal overflow control effects, this paper adopts eight different return periods. Under two durations of rainfall (180 min and 1440 min), the results of runoff volume, node overflow volume, and the area of ponded water are obtained by simulating InfoWorks ICM. The article analysis flowchart is shown in Figure 7.
Figure 8a shows the comparison of runoff control effect per unit area for LID deployment methods of RACO and FACO. Under short–duration and long–duration rainfall conditions, with an increase in the return period, the runoff reduction effect for both RACO and FACO shows a decreasing trend, and the FACO displays a local fluctuation increase. The percentage reduction of runoff volume per unit area for FACO under short–duration rainfall conditions is 0.81% at maximum and 0.63% at minimum, and for RACO, it is 0.76% at maximum and 0.61% at minimum. In both cases, the reduction in runoff per unit area is greater for short–duration rainfall compared to long–duration rainfall.

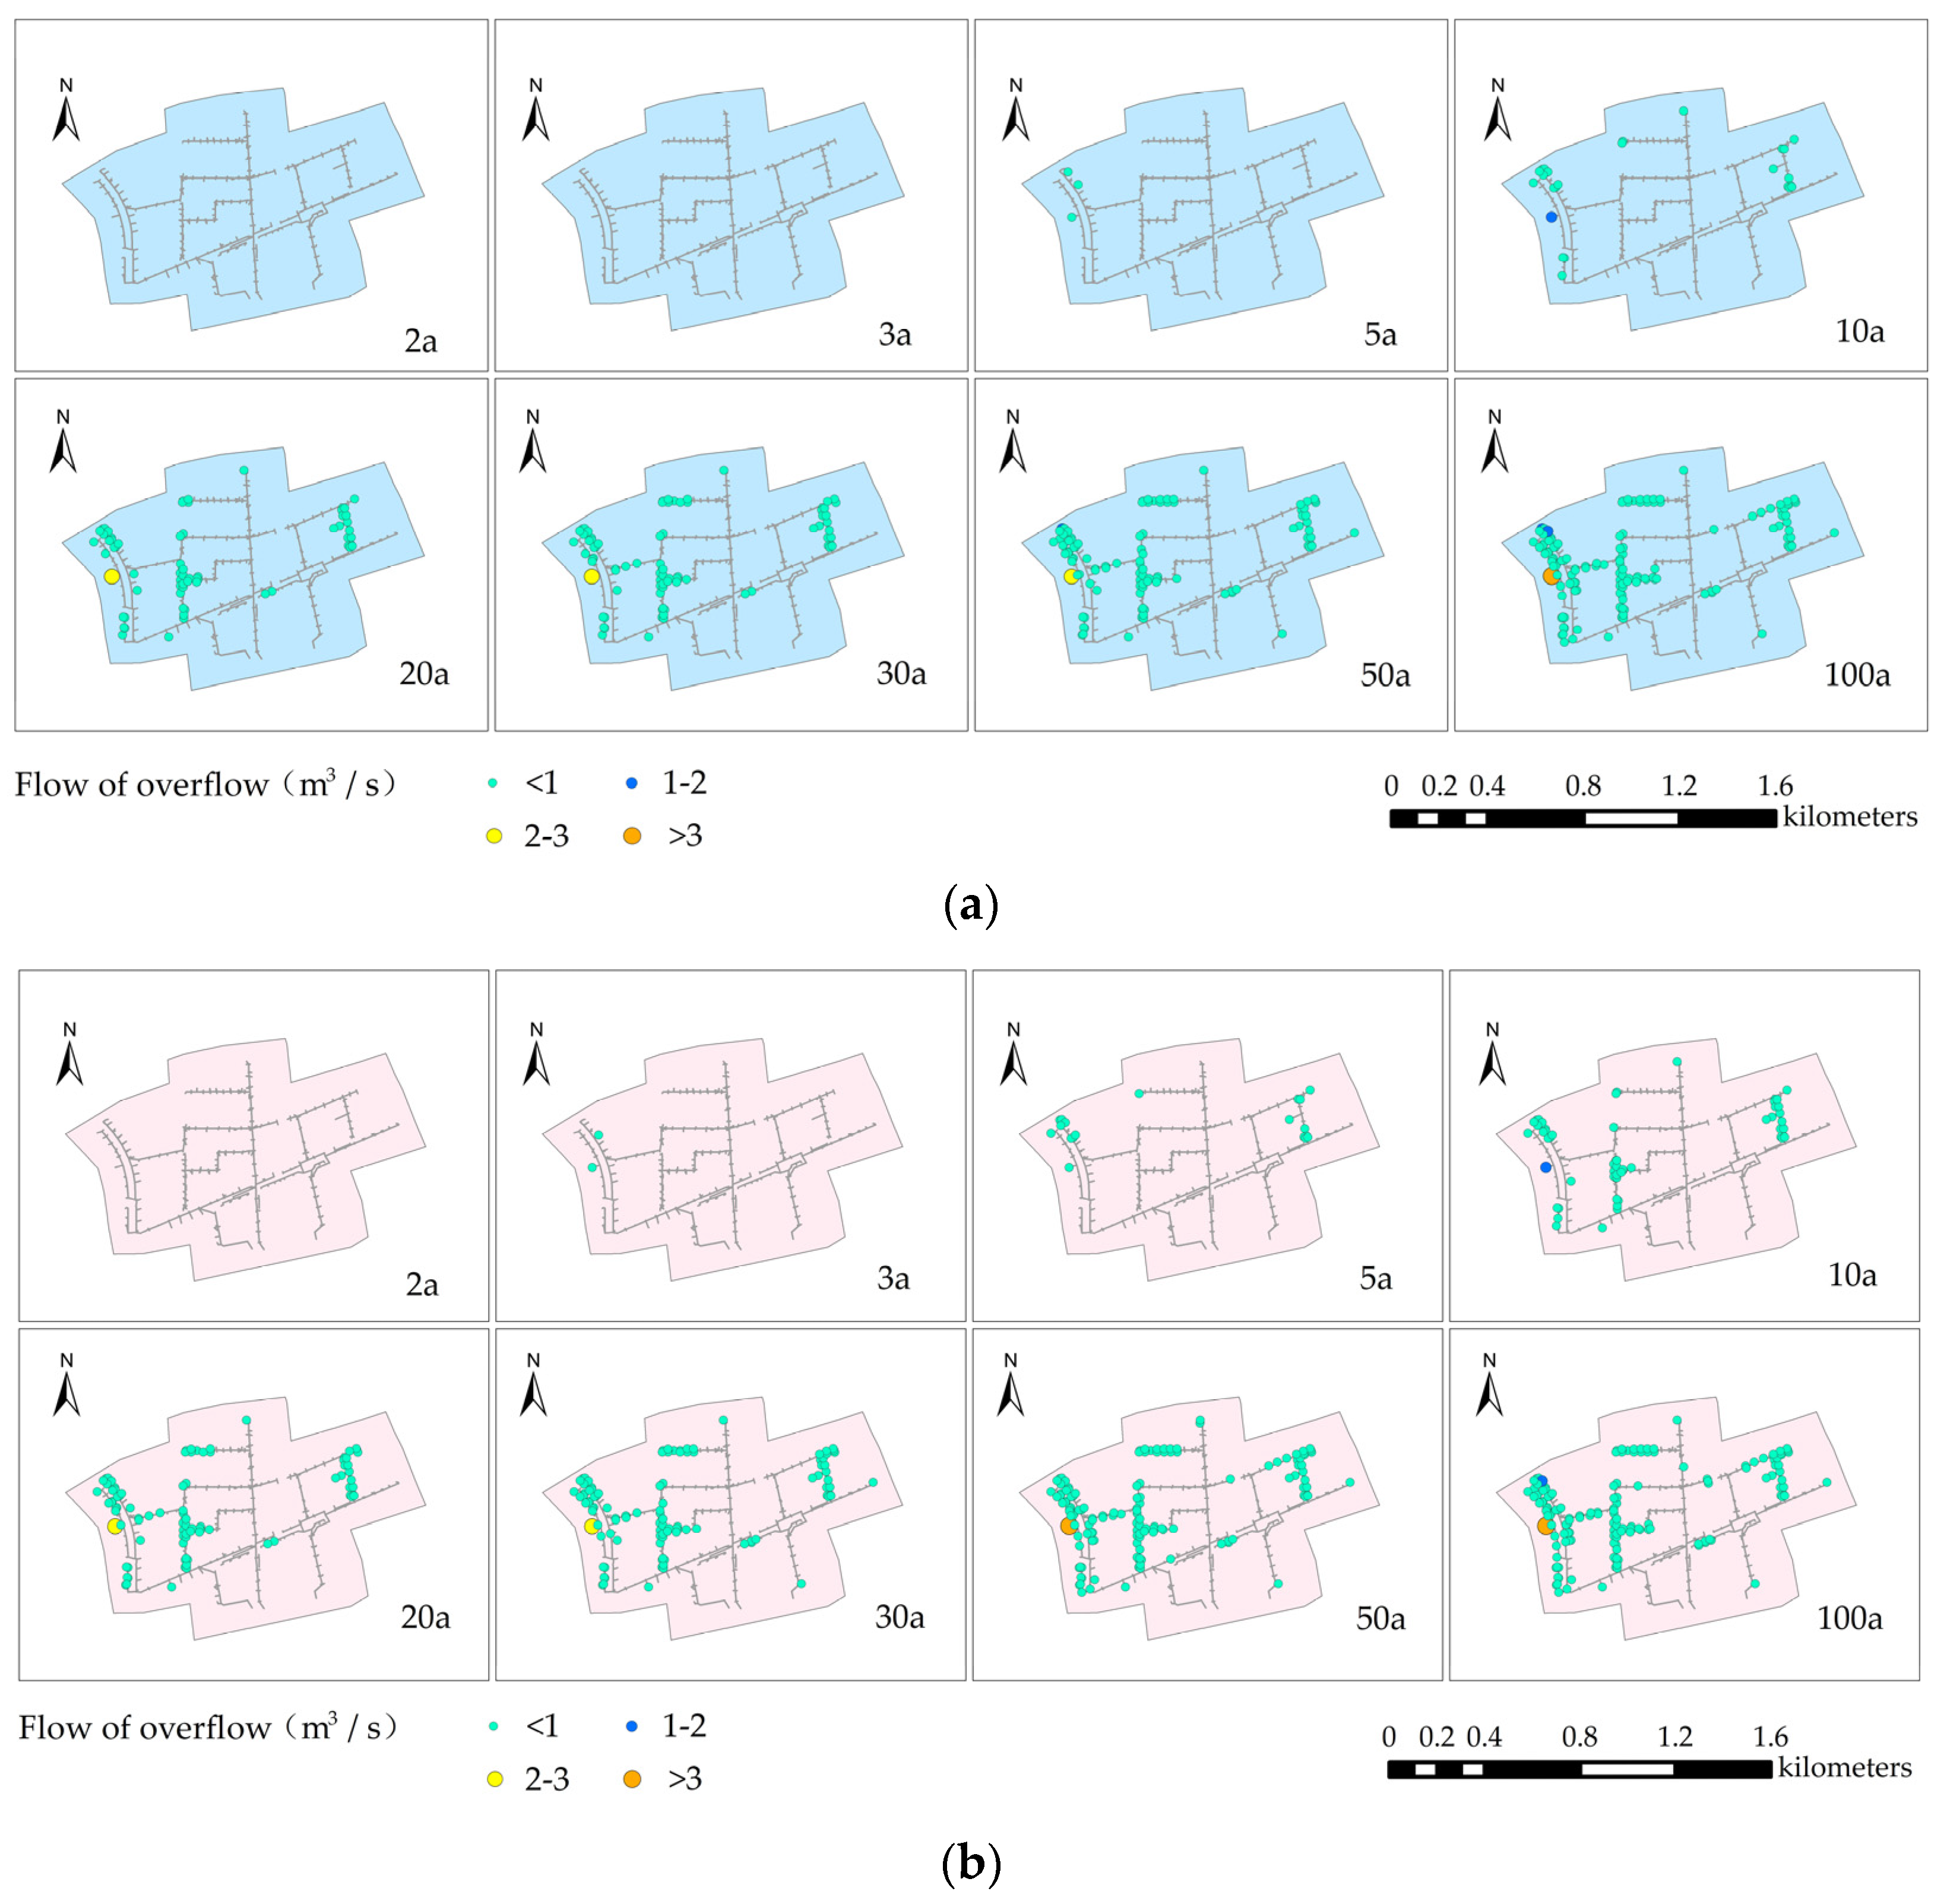
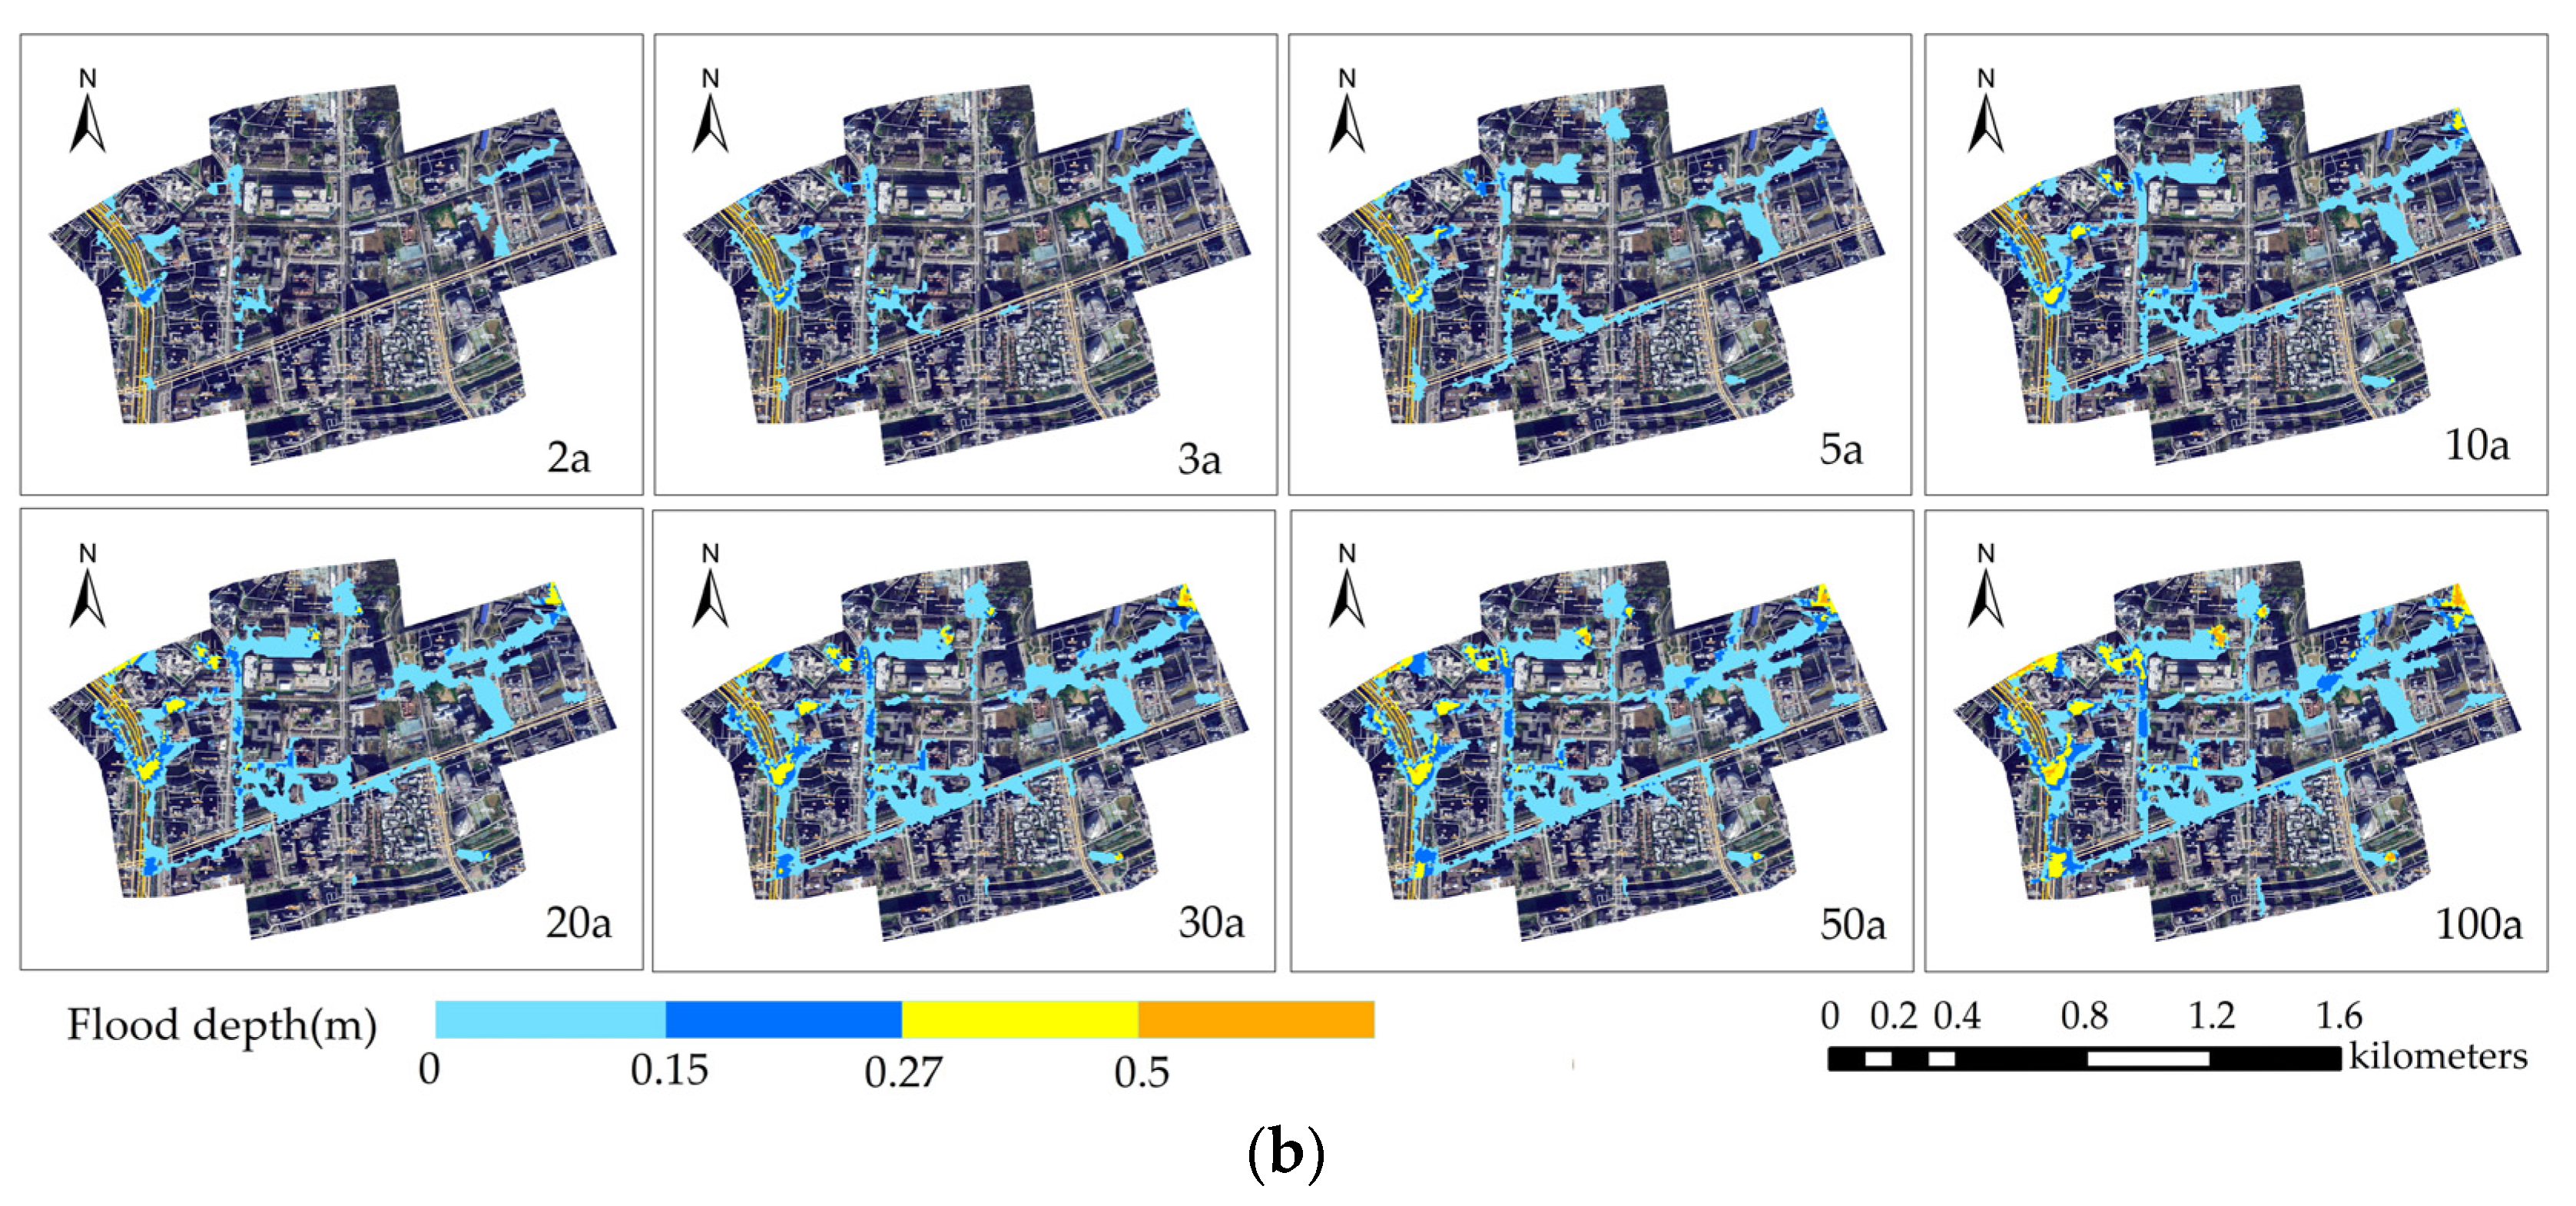
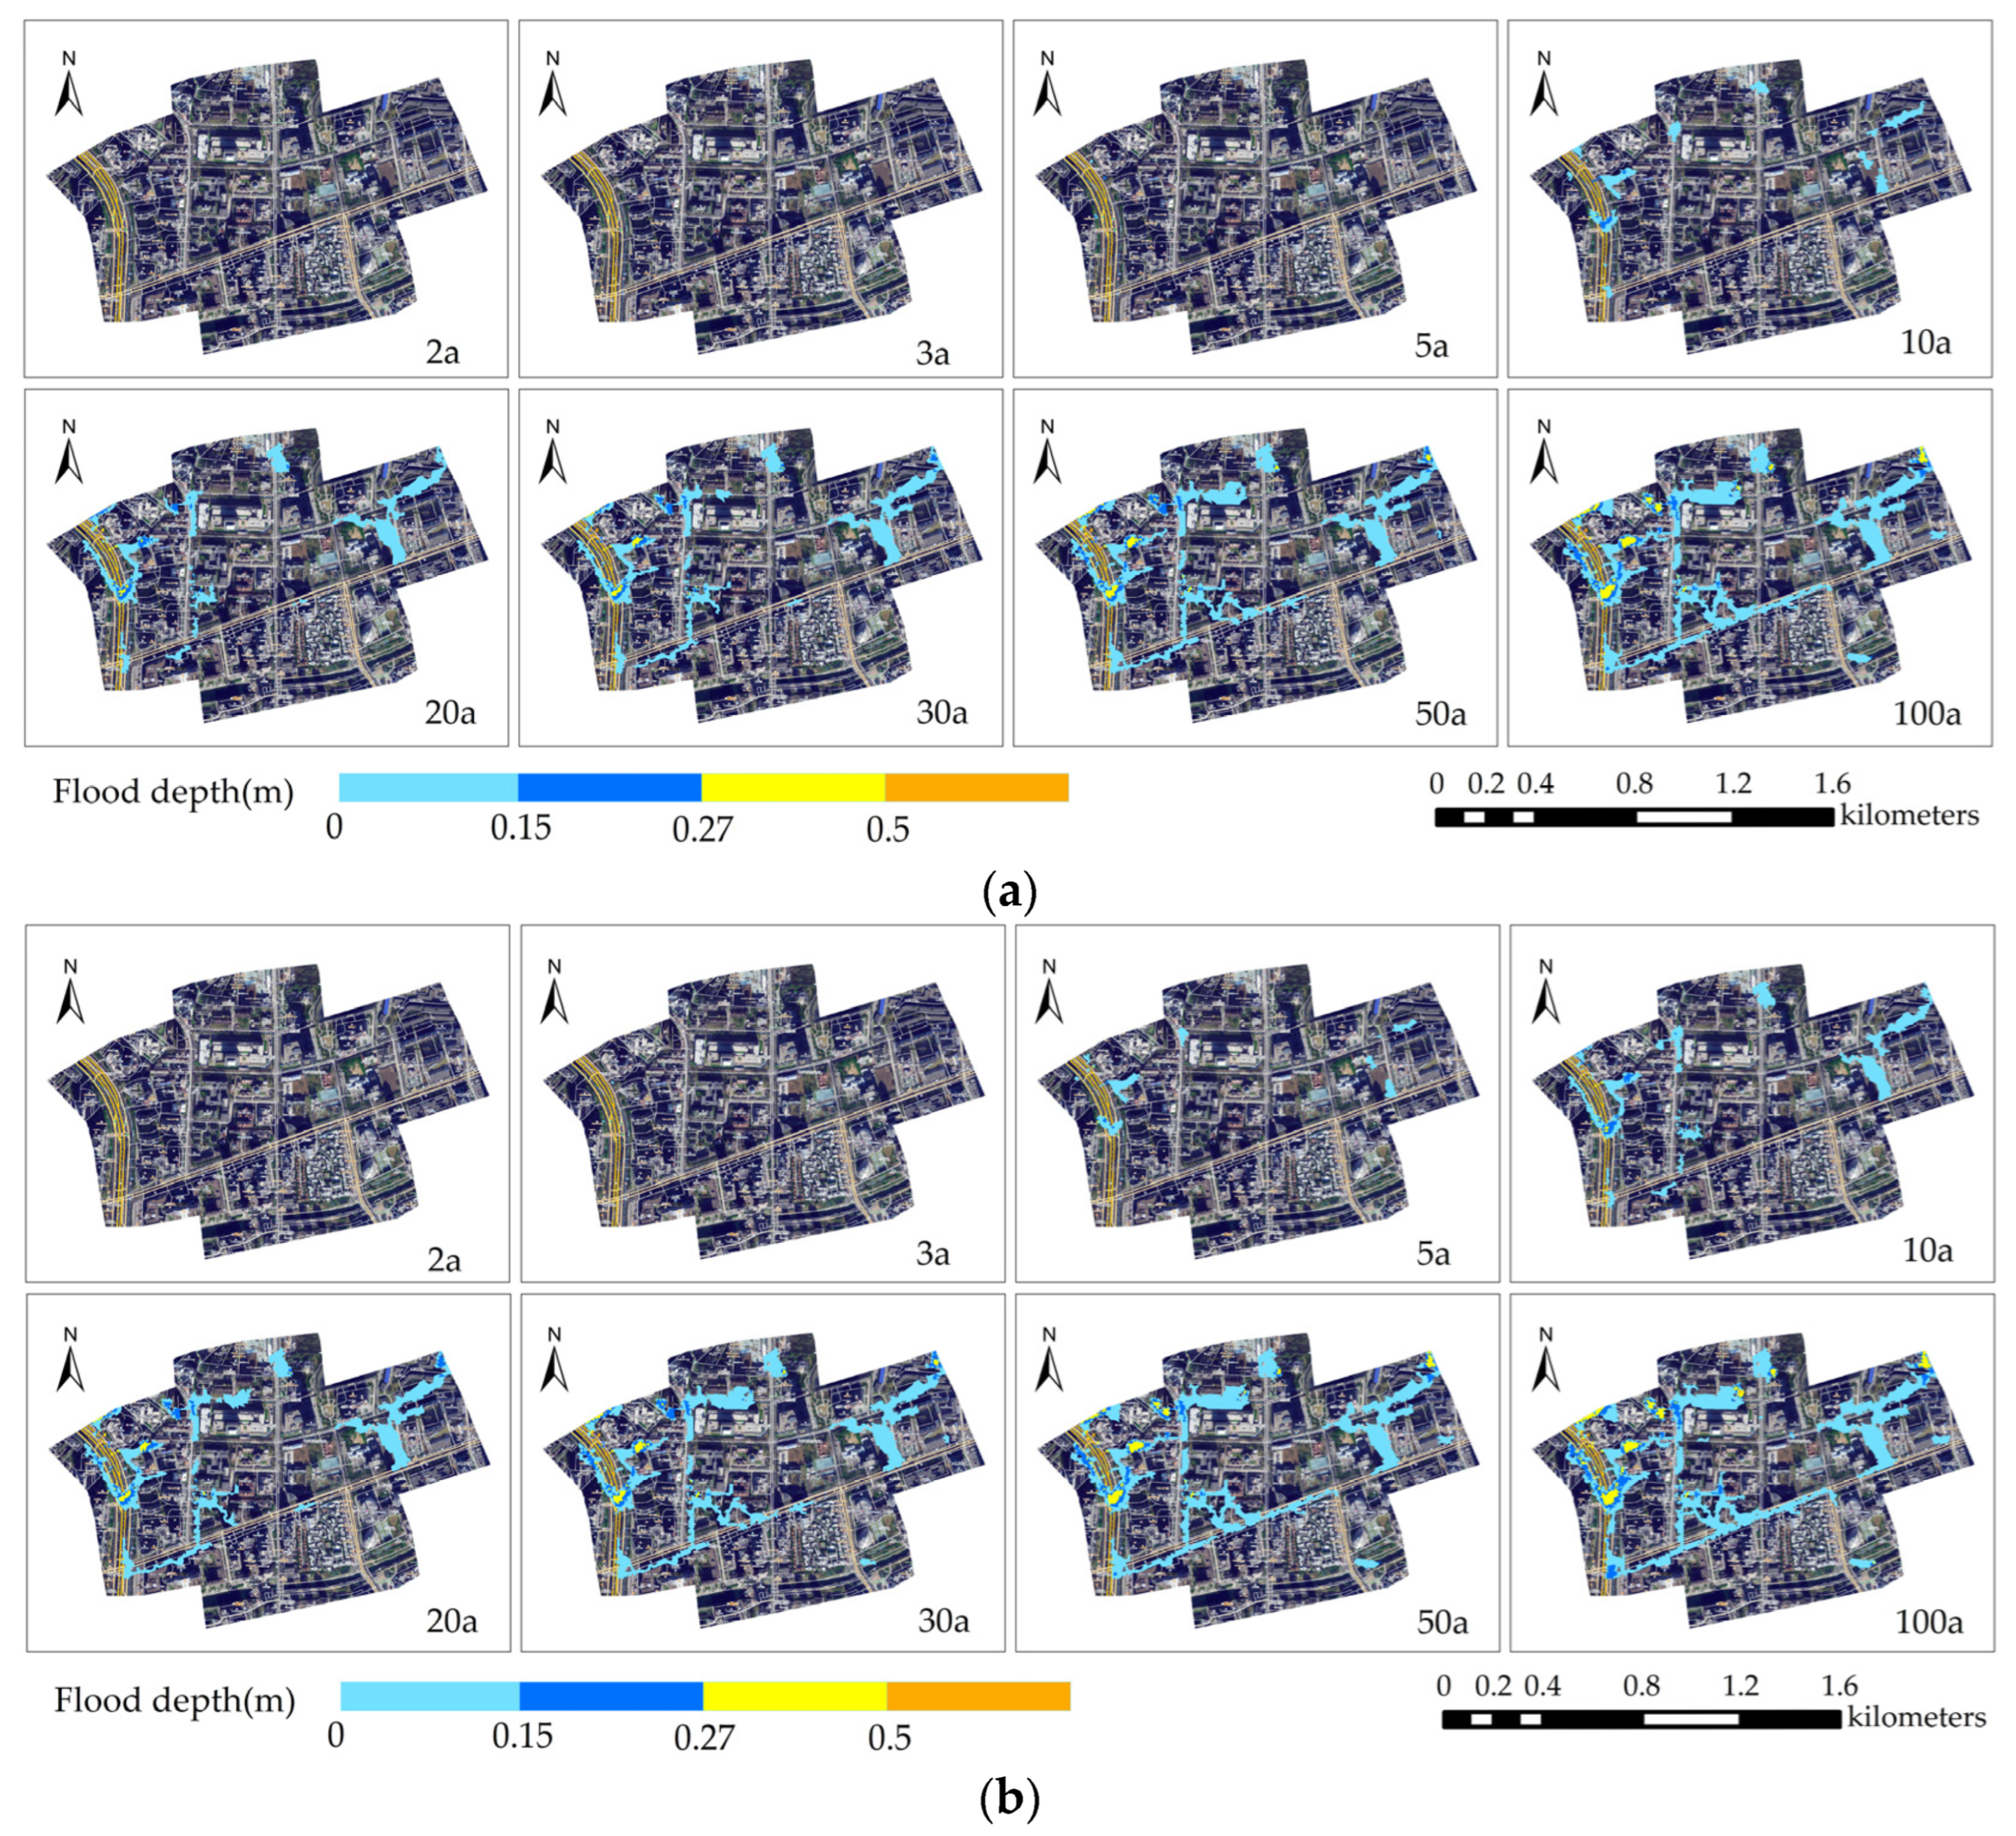
3.2. Comparison of Flooding Control Effect

Figure 8b shows the abatement of the total overflow volume per unit area for LID facilities deployed in RACO and FACO. It can be observed from the figure that the percentage reduction of overflow volume per unit area for both RACO and FACO decreases with the increase in return period for both durations of rainfall, and the percentage reduction of overflow volume per unit area for the short–duration rainfall is better than that for the long–duration rainfall. Regarding the percentage reduction of overflow volume per unit area, the range by which FACO is higher than RACO is between 0.29 and 10.95 (%/hm−2). The percentage reduction of overflow volume per unit area for FACO under short–duration rainfall conditions is 12.80% at maximum and 1.73% at minimum, and for RACO, it is 1.87% at maximum and 1.22% at minimum.
The maximum overflow flow rate at the nodes Is shown In Figure 9, Figure 10 and Figure 11. Both FACO and RACO methods have a certain effect on the overflow flow rate at the nodes of the original pipe network. The maximum overflow flow is mainly concentrated below 1 m3/s, and there are overflow nodes in both the original pipe network and the FACO method at different return periods. RACO has no overflow in short–duration rainfall with return periods of 2 and 3 a and no overflow in long–duration rainfall with return period of 2 a.
To approximate the same overflow volume as FACO, the area of the LID facility laid out as RACO is adjusted, and the cost comparison between the two is shown in Table 6 below. The cost of FACO has decreased by 4.94% to 46.20% compared to RACO. Both costs increase with increasing return period, with RACO costs varying from 6.61 × 10⁷ to 4.23 × 10⁸ Yuan for short–duration rainfall and from 1.37 × 10⁸ to 4.23 × 10⁸ Yuan for long–duration rainfall. FACO costs vary from 6.15 × 10⁷ to 3.25 × 10⁸ Yuan for short–duration rainfall and from 7.37 × 10⁷ to 3.33 × 10⁸ Yuan for long–duration rainfall.

3.3. Comparison of Ponding Control Effect

The ponding results obtained using InfoWorks ICM to simulate are shown in Figure 12, Figure 13 and Figure 14. As can be seen from the image, the water is mainly concentrated on the road and spreads on the road. When the return period is relatively small, ponding begins to appear on the west side of the study area. With the increase in the return period, ponding gradually appears on the east, south, and north sides of the study area, spreading rapidly, and the ponding area gradually increases. The area of FACO is higher by a range of 92.462 m2 to 24,124.39 m2 compared to RACO. The difference between FACO’s ponding area and RACO’s is more noticeable when the return period is small, and the difference is smaller when the return period is large.
Figure 15 shows the ponding areas of FACO and RACO for different water depths under two types of rainfall durations for the eight return periods. Under short–duration rainfall, the ponding area of RACO greater than 0.5 m does not change during the return periods of 10 a to 20 a and 50 a to 100 a; under other conditions, the ponding areas of FACO and RACO with different water levels increase with the increase in the return period. The water depth of the ponding in the study area is mainly below 0.15 m. The ponding area of RACO under short–duration rainfall below 0.15 m is 134,666.65 m2 and 146,251.81 m2 under long–duration rainfall; the ponding area of FACO under short–duration rainfall with a water depth below 0.15 m is 134,728.45 m2 and 146,803.21 m2 under long–duration rainfall. At the same return period, the area of ponding gradually decreases with increasing water depth. At the same water depth, the area of ponding for FACO and RACO gradually approaches with an increasing return period.

4. Discussion

As the amount and duration of rainfall increase, the soil layer at the LID facility gradually becomes saturated, and infiltration capacity diminishes. As a result, runoff and overflow abatement are higher in the low return period than in the high return period [23]. There may be two reasons why short–duration rainfall is more effective than long–duration rainfall in reducing runoff and overflow. The first reason is that LID facilities become less effective as rainfall increases, and the second reason is that at the beginning of the rainfall period, the infiltration capacity is strong, and the peak of the short–duration rainfall precedes the rainfall, while the peak of long–duration rainfall lags rainfall. The amount of rainfall is smaller and persists for a longer period in the early stage of the rainfall period. So, before the peak of rainfall, the soil may be close to saturation, and the reduction effect on runoff and overflow will be greatly reduced.
The area of LID facilities to be deployed with FACO depends on the type of land use contained in the subcatchments where the LID facilities are deployed and the nodes in the original network where the overflow occurred. For example, in a return period of 20 a, the newly generated overflow points are located downstream of the overflow points generated in the return period of 10 a. The LID facilities in the subcatchments upstream of the overflow point in the return period of 20 a have already been deployed and only need to be deployed in the subcatchments where the newly generated overflow points are located. At the same time, due to the different land use types in the subcatchments, the area of newly deployed LID facilities may be small, so the area of LID facilities may vary depending on the study area, resulting in runoff abatement fluctuating with the change in the return period.
RACO distributes LID facilities throughout the study area at all locations where LID facilities can be placed, but there may be locations where LID facilities do not generate overflow or generate a small amount of overflow, resulting in wasted LID facilities. FACO distributes LID facilities in the subcatchments upstream of the nodes that generate overflow, which allows for the full capacity of the LID facilities to be utilized. When the overflow volume of the two is approximately the same, FACO’s LID facilities are installed in a smaller area than RACO’s, and accordingly, the cost of FACO is less than that of RACO. FACO provides better attenuation of overflow volume per unit area than RACO. As the number of overflow–generating nodes in the network increases with the increase in the return period, the area of LID facilities in FACO will continue to approach that of RACO. Therefore, the difference between the two in terms of abatement of overflow volume per unit area will gradually decrease.
Urban pipe networks are usually built on both sides of roads. When the rainfall exceeds the carrying capacity of the urban pipe network, overflow from inspection wells will first produce ponding on low–lying roads and then spread out from the roads. The northwest trunk pipeline in the study area has a thin pipe diameter and weak drainage capacity, and the problem of ponding occurs first. Due to certain errors in the topographic data and the topography of the current study area, after the topographic data are adjusted, some of the square grids will be low–lying to form localized depressions. With the increase in the return period, the overflow flow will gradually increase, but the water is not overflowing from the depressions to the surrounding spread. With the increase in the return period, the area of LID facilities laid using RACO and FACO gradually becomes close to each other. So, at a return period of 20 a or less, there is a significant difference in the area of the two ponding, and at return periods greater than 20 a, the two ponding areas gradually approach each other.
The results of this paper on the deployment of LID facilities for the sources of flooding are consistent with the results of WANG et al. [32].

5. Conclusions

Under the duration of rainfall of 180 min and 1440 min, this paper adopts eight different return periods and uses the InfoWorks ICM model to analyze the layout of LID facilities aiming at runoff control and flooding control from three aspects: runoff, flooding, and ponding. Conclusions are drawn as follows:
  • This paper verifies the control effect of LID facilities on runoff, flooding, and ponding, which is better in a low return period than in a high return period and better in short durations than in long durations. With the increase in the return period, the soil gradually approaches saturation, which will gradually weaken the capacity of LID facilities.
  • Under return periods of less than 5 a, FACO can fully utilize the capacity of LID facilities to reduce the waterlogged area. FACO and RACO have very small or even close to zero ponding areas at short–duration rainfall with a return period of less than 5 a and at long–duration rainfall with a return period of less than 3 a. However, the LID placement area of RACO is much larger than that of FACO. The extra area of LID facilities of RACO compared to FACO cannot utilize the capacity of LID facilities, which results in wastage.
  • At return periods greater than 20 a, the deployment of LID facilities to alleviate flooding with FACO has no significant advantage over RACO. Under return periods of less than 20 a, the reduction of flooding per unit area through FACO is much larger than RACO, while at return periods greater than 20 a, the difference between FACO and RACO narrows down.
  • FACO has a better economy for the mitigation of urban flooding. When the overflow volume of FACO and RACO is approximately the same, FACO can reduce the waste of LID facilities to a certain extent due to its deployment in the subcatchments upstream of the overflow point, and its deployment area and cost are lower than that of RACO.
  • The deployment of LID facilities using FACO is suitable for return periods below 5 a, while LID facilities are often used as auxiliary measures. Therefore, for return periods exceeding 5 years, engineering measures such as network renovation and pump station construction should be adopted to alleviate urban flooding. This study only selects the central urban area of Beijing as the research area. The application of FACO to different urban areas to analyze the methodology more comprehensively is subject to further research. The proposed FACO deployment method has shown better results compared to RACO, but it may not be the optimal solution. The combination of FACO and optimization algorithms requires further research.

Author Contributions

Conceptualization, X.C. and H.W.; methodology, H.W. and J.Z.; software, H.W. and J.Z.; validation, Z.L.; formal analysis, X.C. and H.W.; data curation, B.C.; writing—original draft preparation, X.C.; writing—review and editing, X.C.; supervision, B.C. All authors have read and agreed to the published version of the manuscript.

Funding

This research was funded by the Major Science and Technology Innovation Pilot Project for Water Resources Protection and Integrated-Saving Utilization in the Yellow River Basin of Inner Mongolia Autonomous Region (grant number: 2023JBGS0007), National Natural Science Foundation of China (grant number 72091511), Beijing Natural Science Foundation (9222017), R&D Program of Beijing Municipal Education Commission (grant number KM202310005023 &KM202210005017), Beijing Natural Science Foundation (8242003).

Data Availability Statement

The data presented in this study are available on request from the corresponding author.

Conflicts of Interest

The authors declare no conflict of interest.

Abbreviations

FACOflooding as the control objective
RACOrunoff as the control objective
LIDlow impact development
Short–durationrainfall of short duration (180 min)
Long–durationrainfall of long duration (1440 min)
SWMMstorm water management model
ICMintegrated catchment management
NSEnash–sutcliffe efficiency
RMSEroot mean square error
PBIASpercentage bias

References

  1. Eckart, K.; McPhee, Z.; Bolisetti, T. Performance and implementation of low impact development—A review. Sci. Total Environ. 2017, 607–608, 413–432. [Google Scholar] [CrossRef] [PubMed]
  2. Li, Q.Y.; Yang, Y.C.; Liao, H.X.; Liu, M.Q.; Liao, L.P.; Huang, S.Q.; Sun, G.K.; Mo, C.X.; Li, X.G. The simulation, regulation capacity assessment and coping strategy of rainstorm runoff waterlogging in Zhu pai–chong Basin of Nanning, China. J. Environ. Manag. 2023, 332, 117395. [Google Scholar] [CrossRef] [PubMed]
  3. Liu, T.Q.; Lawluvy, Y.; Shi, Y.; Yap, P.S. Low impact development (LID) practices: A review on recent developments, challenges and prospects. Water Air Soil Pollut. 2021, 232, 344. [Google Scholar] [CrossRef]
  4. Muttil, N.; Nasrin, T.; Sharma, A.K. Impacts of extreme rainfalls on sewer overflows and WSUD–based mitigation strategies: A review. Water 2023, 15, 429. [Google Scholar] [CrossRef]
  5. Newcomer, M.E.; Gurdak, J.J.; Sklar, L.S.; Nanus, L. Urban recharge beneath low impact development and effects of climate variability and change. Water Resour. Res. 2014, 50, 1716–1734. [Google Scholar] [CrossRef]
  6. Gilroy, K.L.; McCuen, R.H. Spatio–temporal effects of low impact development practices. J. Hydrol. 2009, 367, 228–236. [Google Scholar] [CrossRef]
  7. Guo, J.C.Y. Preservation of watershed regime for low–impact development through detention. J. Hydrol. Eng. 2010, 15, 15–19. [Google Scholar] [CrossRef]
  8. Aguayo, M.; Yu, Z.W.; Piasecki, M.; Montalto, F. Development of a web application for low impact development rapid assessment (LIDRA). J. Hydroinform. 2013, 15, 1276–1295. [Google Scholar] [CrossRef]
  9. Joksimovic, D.; Alam, Z. Cost efficiency of low impact development (LID) stormwater management practices. Procedia Eng. 2014, 89, 734–741. [Google Scholar] [CrossRef]
  10. Bhaskar, A.S.; Hogan, D.M.; Archfield, S.A. Urban base flow with low impact development. Hydrol. Process. 2016, 30, 3156–3171. [Google Scholar] [CrossRef]
  11. Leimgruber, J.; Krebs, G.; Camhy, D.; Muschalla, D. Sensitivity of model–based water balance to low impact development parameters. Water 2018, 10, 1838. [Google Scholar] [CrossRef]
  12. Eckart, K.; McPhee, Z.; Bolisetti, T. Multiobjective optimization of low impact development stormwater controls. J. Hydrol. 2018, 562, 564–576. [Google Scholar] [CrossRef]
  13. Liu, Y.Z.; Bralts, V.F.; Engel, B.A. Evaluating the effectiveness of management practices on hydrology and water quality at watershed scale with a rainfall–runoff model. Sci. Total Environ. 2015, 511, 298–308. [Google Scholar] [CrossRef] [PubMed]
  14. Wang, M.; Zhang, D.Q.; Adhityan, A.; Ng, W.J.; Dong, J.W.; Tan, S.K. Assessing cost–effectiveness of bioretention on stormwater in response to climate change and urbanization for future scenarios. J. Hydrol. 2016, 543, 423–432. [Google Scholar] [CrossRef]
  15. Jemberie, M.A.; Melesse, A.M. Urban flood management through urban land use optimization using LID techniques, city of Addis Ababa, Ethiopia. Water 2021, 13, 1721. [Google Scholar] [CrossRef]
  16. Li, F.; Yan, X.F.; Duan, H.F. Sustainable design of urban stormwater drainage systems by implementing detention tank and LID measures for flooding risk control and water quality management. Water Resour. Manag. 2019, 33, 3271–3288. [Google Scholar] [CrossRef]
  17. Tansar, H.; Duan, H.F.; Mark, O. Catchment–scale and local–scale based evaluation of LID effectiveness on urban drainage system performance. Water Resour. Manag. 2022, 36, 507–526. [Google Scholar] [CrossRef]
  18. Suresh, A.; Pekkat, S.; Subbiah, S. Quantifying the efficacy of low impact developments (LIDs) for flood reduction in micro–urban watersheds incorporating climate change. Sustain. Cities Soc. 2023, 95, 104601. [Google Scholar] [CrossRef]
  19. Sin, J.; Jun, C.; Zhu, J.H.; Yoo, C. Evaluation of flood runoff reduction effect of LID (Low Impact Development) based on the decrease in CN: Case studies from Gimcheon Pyeonghwa district, Korea. Procedia Eng. 2014, 70, 1531–1538. [Google Scholar] [CrossRef]
  20. Luan, Q.H.; Fu, X.R.; Song, C.P.; Wang, H.C.; Liu, J.H.; Wang, Y. Runoff effect evaluation of LID through SWMM in typical mountainous, low–lying urban areas: A case study in China. Water 2017, 9, 439. [Google Scholar] [CrossRef]
  21. Dos Santos, M.F.N.; Barbassa, A.P.; Vasconcelos, A.F.; Ometto, A.R. Stormwater management for highly urbanized areas in the tropics: Life cycle assessment of low impact development practices. J. Hydrol. 2021, 598, 126409. [Google Scholar] [CrossRef]
  22. Kumar, S.; Guntu, R.K.; Agarwal, A.; Villuri, V.G.K.; Pasupuleti, S.; Kaushal, D.R.; Gosian, A.K.; Bronstert, A. Multi–objective optimization for stormwater management by green–roofs and infiltration trenches to reduce urban flooding in central Delhi. J. Hydrol. 2022, 606. [Google Scholar] [CrossRef]
  23. Yang, B.Y.; Zhang, T.; Li, J.Z.; Feng, P.; Miao, Y.J.J. Optimal designs of LID based on LID experiments and SWMM for a small–scale community in Tianjin, north China. J. Environ. Manag. 2023, 334, 117442. [Google Scholar] [CrossRef] [PubMed]
  24. Ferguson, C.; Fenner, R. The impact of natural flood management on the performance of surface drainage systems: A case study in the Calder Valley. J. Hydrol. 2020, 590, 125354. [Google Scholar] [CrossRef]
  25. Cheng, T.; Xu, Z.X.; Hong, S.Y.; Song, S.L. Flood risk zoning by using 2D hydrodynamic modeling: A case study in Jinan city. Math. Probl. Eng. 2017, 2017, 5659197. [Google Scholar] [CrossRef]
  26. Zhou, J.J.; Pang, Y.L.; Wang, H.; Li, W.T.; Liu, J.H.; Luo, Z.R.; Shao, W.W.; Zhang, H.J. Sewage network operational risks based on InfoWorks ICM with nodal flow diurnal patterns under NPIs for COVID-19. Water Res. 2023, 246, 120708. [Google Scholar] [CrossRef] [PubMed]
  27. DB11/T 2074–2022; Technical Specification for Construction and Application of Mathematical Model of Urban Flooding Prevention and Control System. Beijing Municipal Commission of Planning and Natural Resources, Beijing Municipal Bureau of Market Supervision and Administration: Beijing, China, 2022.
  28. Xu, W.B.; Jiang, Z.Q.; Yuan, Y.; Zhai, M.M.; Li, N.; Gao, J.Y.; Li, J.K. Analysis of urban waterlogging and LID reconstruction scheme in Nanchang City based on MIKE & SWMM. Water Resour. Power 2023, 41, 77–81+171. [Google Scholar]
  29. Hua, P.; Yang, W.Y.; Qi, X.C.; Jiang, S.S.; Xie, J.Q.; Gu, X.Y.; Li, H.H.; Zhang, J.; Krebs, P. Evaluating the effect of urban flooding reduction strategies in response to design rainfall and low impact development. J. Clean Prod. 2020, 242, 118515. [Google Scholar] [CrossRef]
  30. Koc, K.; Ekmekcioglu, O.; Ozger, M. An integrated framework for the comprehensive evaluation of low impact development strategies. J. Environ. Manag. 2021, 294, 113023. [Google Scholar] [CrossRef]
  31. Wang, H.; Zhou, J.J.; Tang, Y.; Liu, Z.L.; Kang, A.Q.; Chen, B. Flood economic assessment of structural measure based on integrated flood risk management: A case study in Beijing. J. Environ. Manag. 2021, 280, 111701. [Google Scholar] [CrossRef]
  32. Wang, J.; Liu, J.H.; Yang, Z.X.; Mei, C.; Wang, H.; Zhang, D.Q. Green infrastructure optimization considering spatial functional zoning in urban stormwater management. J. Environ. Manag. 2023, 344, 118407. [Google Scholar] [CrossRef] [PubMed]
Figure 1. Schematic of the study area.
Water 16 00374 g001
Figure 2. (a) Schematic diagram of the ICM model; (b) land use distribution.
Water 16 00374 g002
Figure 3. Comparison of measured and simulated water level. (a): J155 inspection well for 21 August 2022 rainfall; (b): J280 inspection well for 21 August 2022 rainfall; (c): J155 inspection well for 3 September 2022 rainfall; (d): J280 inspection well for 3 September 2022 rainfall.
Water 16 00374 g003
Figure 4. Design rainfall for eight different periods in the Beijing II district. (a) Designed rainfall pattern for 180 min in the Beijing II district; (b) designed rainfall pattern for 1440 min in the Beijing II district.
Water 16 00374 g004
Figure 5. (a): LID facility layout scope for RACO; (b): LID facility layout scope for FACO for a return period of 20 a under short duration.
Water 16 00374 g005
Figure 6. Layout flowchart for FACO.
Water 16 00374 g006
Figure 7. The article analysis flowchart.
Water 16 00374 g007
Figure 8. Reduction of runoff and overflow per unit area.
Water 16 00374 g008
Figure 9. (a) Maximum value of node overflow flow under short–duration rainfall (original pipe network); (b) maximum value of node overflow flow under long–duration rainfall (original pipe network).
Water 16 00374 g009
Figure 10. (a) Maximum value of node overflow flow under short–duration rainfall (FACO); (b) maximum value of node overflow flow under long–duration rainfall (FACO).
Water 16 00374 g010aWater 16 00374 g010b
Figure 11. (a) Maximum value of node overflow flow under short–duration rainfall (RACO); (b) maximum value of node overflow flow under long–duration rainfall (RACO).
Water 16 00374 g011
Figure 12. (a) Ponding area under short–duration rainfall (original pipe network); (b) ponding area under long–duration rainfall (original pipe network).
Water 16 00374 g012aWater 16 00374 g012b
Figure 13. (a) Ponding area under short–duration rainfall (FACO); (b) ponding area under long–duration rainfall (FACO).
Water 16 00374 g013
Figure 14. (a) Ponding area under short–duration rainfall (RACO); (b) ponding area under long–duration rainfall (RACO).
Water 16 00374 g014
Figure 15. Ponding areas of FACO and RACO at different water depths. (a) Ponding area under short–duration rainfall (RACO); (b) ponding area under long–duration rainfall (RACO); (c) ponding area under short–duration rainfall (FACO); (d) ponding area under long–duration rainfall (FACO).
Water 16 00374 g015
Table 1. The calculation results of three indicators.
Evaluation MetricsNSERMSEPBIAS
J155 for 21 August 20220.9380.077−0.024
J280 for 21 August 20220.9010.071−0.073
J155 for 3 September 20220.9270.0100.040
J280 for 3 September 20220.9020.008−0.040
Table 2. Rainfall depth under different return periods and rainfall durations(mm).
Return Period2a3a5a10a20a30a50a100a
Short–duration63.3572.1783.2898.35113.20122.00133.08148.12
Long–duration127.36145.06167.53197.72228.06245.68268.19298.46
Table 3. LID facility parameter Settings.
Process LayerParameterRain GardenGreen RoofPermeable Pavement
Surface layerBerm Height/mm250.00 50.00 0.00
Vegetation Volume 0.10 0.60 0.00
Surface Roughness0.24 0.80 0.01
Surface Slope/%5.00 0.20 0.50
Soil layerThickness/mm900.00 100.00 150.00
Porosity0.18 0.18 0.50
Field Capacity 0.10 0.10 0.20
Wilting Point0.03 0.03 0.00
Conductivity/(mm·h−1)18.00 18.00 720.00
Conductivity Slope10.00 10.00 10.00
Suction Head/mm90.00 90.00 90.00
Storage layerThickness/mm0.00 600.00
Void Ratio0.75 0.75
Seepage Rate/(mm·h−1)12.70 12.70
Clogging Factor0.00 180.00
Table 4. Area of LID facility deployment for FACO (ha).
Duration of RainfallReturn PeriodRain Garden (ha)Green Roof (ha)Permeable Pavement (ha)Total Area (ha)
Short–
duration
2 a1.29 4.05 1.39 6.74
3 a1.32 5.25 1.88 8.44
5 a1.59 6.87 2.52 10.99
10 a3.20 10.75 3.75 17.70
20 a6.38 14.35 5.33 26.06
30 a6.62 15.81 6.35 28.78
50 a7.19 16.65 7.29 31.12
100 a7.20 17.62 7.81 32.63
Long–
duration
2 a1.42 5.18 1.85 8.45
3 a1.81 6.04 2.13 9.98
5 a2.07 9.02 3.64 14.73
10 a5.30 13.30 4.81 23.41
20 a6.64 15.31 5.78 27.74
30 a6.86 16.02 6.38 29.25
50 a7.06 17.02 7.09 31.16
100 a7.18 17.90 8.54 33.62
Table 5. LID facility cost.
LID Facility Unit Infrastructure Cost (Yuan·m−2)Unit Maintenance Cost
(Yuan·m−2·a−1)
Rain Garden80055
Green Roof2006
Permeable Pavement7808.7
Table 6. Comparison of costs when RACO and FACO overflow volumes are the same.
Return PeriodFACO–Short (Yuan)RACO–Short (Yuan)FACO–Long (Yuan)RACO–Long (Yuan)
2 a6.15 × 1076.61 × 1077.37 × 1071.37 × 108
3 a7.18 × 1078.99 × 1078.94 × 1071.48 × 108
5 a9.14 × 1071.37 × 1081.23 × 1081.74 × 108
10 a1.58 × 1082.43 × 1082.31 × 1082.43 × 108
20 a2.66 × 1083.12 × 1082.81 × 1083.07 × 108
30 a2.88 × 1083.60 × 1082.95 × 1083.70 × 108
50 a3.15 × 1083.97 × 1083.11 × 1084.07 × 108
100 a3.25 × 1084.23 × 1083.33 × 1084.23 × 108
Disclaimer/Publisher’s Note: The statements, opinions and data contained in all publications are solely those of the individual author(s) and contributor(s) and not of MDPI and/or the editor(s). MDPI and/or the editor(s) disclaim responsibility for any injury to people or property resulting from any ideas, methods, instructions or products referred to in the content.

