Article

A CMIP6 Multi-Model Analysis of the Impact of Climate Change on Severe Meteorological Droughts through Multiple Drought Indices—Case Study of Iran’s Metropolises

by
Rasoul Afsari
1,
Mohammad Nazari-Sharabian
2,*,
Ali Hosseini
3 and
Moses Karakouzian
4
1
Department of Passive Defense (Urban Planning of Passive Defense), Supreme National Defense University, Tehran 1698613411, Iran
2
Department of Mathematics, Engineering and Computer Science, West Virginia State University, Institute, WV 25112, USA
3
Department of Human Geography and Planning, University of Tehran, Tehran 1417853933, Iran
4
Department of Civil and Environmental Engineering and Construction, University of Nevada Las Vegas, Las Vegas, NV 89154, USA
*
Author to whom correspondence should be addressed.
Water 2024, 16(5), 711; https://doi.org/10.3390/w16050711
Submission received: 26 December 2023 / Revised: 22 February 2024 / Accepted: 24 February 2024 / Published: 28 February 2024
(This article belongs to the Special Issue Impacts of Climate Change on Water Resources: Assessment and Modeling)

Abstract

:
This study extensively explores the impact of climate change on meteorological droughts within metropolises in Iran. Focused on Tehran, Mashhad, Isfahan, Karaj, Shiraz, and Tabriz, this research employed CMIP6 climate models under varying climate change scenarios (SSPs) to forecast severe meteorological droughts spanning the period from 2025 to 2100. The investigation utilized a diverse set of drought indices (SPI, DI, PN, CZI, MCZI, RAI, and ZSI) to assess the drought severity in each city. This study is crucial as it addresses the pressing concerns of rapidly decreasing water levels in Iran’s dams, serious declines in underground aquifers, and the compounding issues of land subsidence and soil erosion due to excessive groundwater withdrawal in the face of severe droughts. This study culminated in the generation of box plots and heatmaps based on the results. These visual representations elucidated the distribution of the drought values under different indices and scenarios and provided a depiction of the probability of severe drought occurrences until the end of the century for each city. The resulting findings serve as invaluable tools, furnishing policymakers with informed insights to proactively manage and fortify metropolitan resilience against the evolving challenges posed by a changing climate.

1. Introduction

Drought stands as one of the most expensive natural disasters and has the capacity to generate extensive, enduring, and often overlooked effects on agriculture, on ecosystems, and on socioeconomic factors [1]. These consequences stem from their gradual emergence and prolonged duration [2]. Severe drought events, intensified by the ever-growing specter of climate change, present a profound challenge to regions dependent on stable water resources [3]. Among those regions, the Iranian metropolises of Tehran, Mashhad, Isfahan, Tabriz, Shiraz, and Karaj are struggling with the alarming prospect of increasingly frequent and severe droughts. As we approach a century marked by unprecedented climate fluctuations, the urgency of predicting and mitigating these upcoming challenges becomes critical for ensuring long-term sustainability.
As evidenced by the Special Report on Extremes of the Intergovernmental Panel on Climate Change (IPCC), a growing number of regions have been facing an increasing severity, duration, and frequency of drought events [4,5]. Drought, a natural hazard that is caused by a long-term deficiency of precipitation or water, has been defined in multiple categories based on different domains of the hydrological cycle or anomalous supply failures, such as meteorological drought, agricultural drought, hydrological drought, and socioeconomic drought [6]. Prolonged meteorological droughts tend to further trigger hydrological, agricultural, and other droughts, resulting in substantial damage to agricultural productivity, ecosystem services, watershed systems, and drinking water supply [7,8]. As prolonged drought leads to substantial declines in runoff and streamflow, the accumulation of surface sediment, nutrients, and bacteria is exacerbated [9,10]. Consequently, heavy precipitation events or floods in the post-drought period may lead to a sudden increase in concentrations, resulting in extreme water quality impacts and posing significant challenges to the sustainable management systems of water resources [11,12].
In the pursuit of sustainable urban development, acknowledging and addressing the implications of climate change stands as a pivotal priority. Cities, as hubs of human activity, face multifaceted challenges exacerbated by climate change, ranging from heightened temperatures and extreme weather events to resource scarcity [13]. By integrating climate change considerations into urban planning and development strategies, cities can bolster their resilience, mitigate environmental risks, and ensure long-term sustainability [14]. Incorporating climate-conscious policies enables cities to adapt infrastructure, optimize resource management, and foster eco-friendly practices, thereby enhancing livability, minimizing vulnerabilities, and cultivating environmentally conscious communities [15].
A thorough examination of drought research unveils a broad array of studies, chiefly categorized based on temporal aspects (exploring occurrences in the past, present, or future) and delving into its multifaceted causes and consequential effects. These investigations display a range of methodological approaches, where certain studies lean on a singular drought index to delineate drought conditions [16,17,18], while others employ a multitude of indices for a more nuanced assessment [19,20,21]. Additionally, certain research delves into historical drought occurrences and the underlying causes [22,23,24], whereas others project future drought scenarios through methodologies such as the statistical downscaling of Global Climate Models (GCMs) [25,26,27], machine learning, AI techniques [28,29,30], etc. Furthermore, the impact assessments of drought extend across agricultural [31], ecological [32], and socioeconomic domains [7], reflecting the intricate interplay between water scarcity and diverse societal sectors.
This study undertakes an investigation into the prediction of severe drought (severely dry to extremely dry conditions) within the Iranian context, concentrating on the aforementioned six major metropolises. The advanced capabilities of CMIP6 (Coupled Model Intercomparison Project Phase 6) multi-model simulations are employed to undertake a comprehensive study spanning the entirety of the 21st century. The research aims to enhance understanding of the intricate dynamics of severe drought occurrences in Iran’s metropolises. The significance of this research is not only found in its temporal scope, which encompasses the challenges and changes these metropolises may face until the end of the century, but also in its utilization of various climate change scenarios (Shared Socioeconomic Pathways (SSPs)). Furthermore, recognizing the limitations of relying on a solitary index to furnish actionable insights for decision-making, this study employs a diverse array of drought indices. This multifaceted approach aims to comprehensively evaluate and assess severe drought occurrences, acknowledging the intricate and multifaceted nature of these climatic events. Considering the above, the novelty of this research can be highlighted in several aspects:
  • Focus on Iran’s metropolises: While previous studies mostly investigated specific cities within Iran, this study uniquely concentrates on the six metropolises of the country. This specific focus allows for a deeper understanding of severe drought occurrences in densely populated urban areas, which may face unique challenges compared to rural or less densely populated areas.
  • Utilization of CMIP6 GCMs: This study stands out by utilizing the advanced capabilities of CMIP6 multi-model simulations, which represent the latest generation of climate models. Very few studies have incorporated CMIP6 GCMs due to their recent development. By employing these cutting-edge models, this research contributes to advancing the understanding of climate dynamics and their implications for severe drought in Iran’s metropolises.
  • Employment of seven drought indices: Unlike many previous studies that have used a limited number of drought indices, this research employs seven drought indices. The utilization of multiple indices enhances the robustness and reliability of this study’s findings.
  • Investigation of cumulative dry days: This approach provides insights into the persistence and cumulative impact of drought events, which is essential for understanding their long-term implications for Iran’s metropolises. Additionally, this investigation sheds light on how different GCMs predict dry days, offering a comparative analysis of their projections.
The framework of this study is shown in Figure 1.

2. Materials and Methods

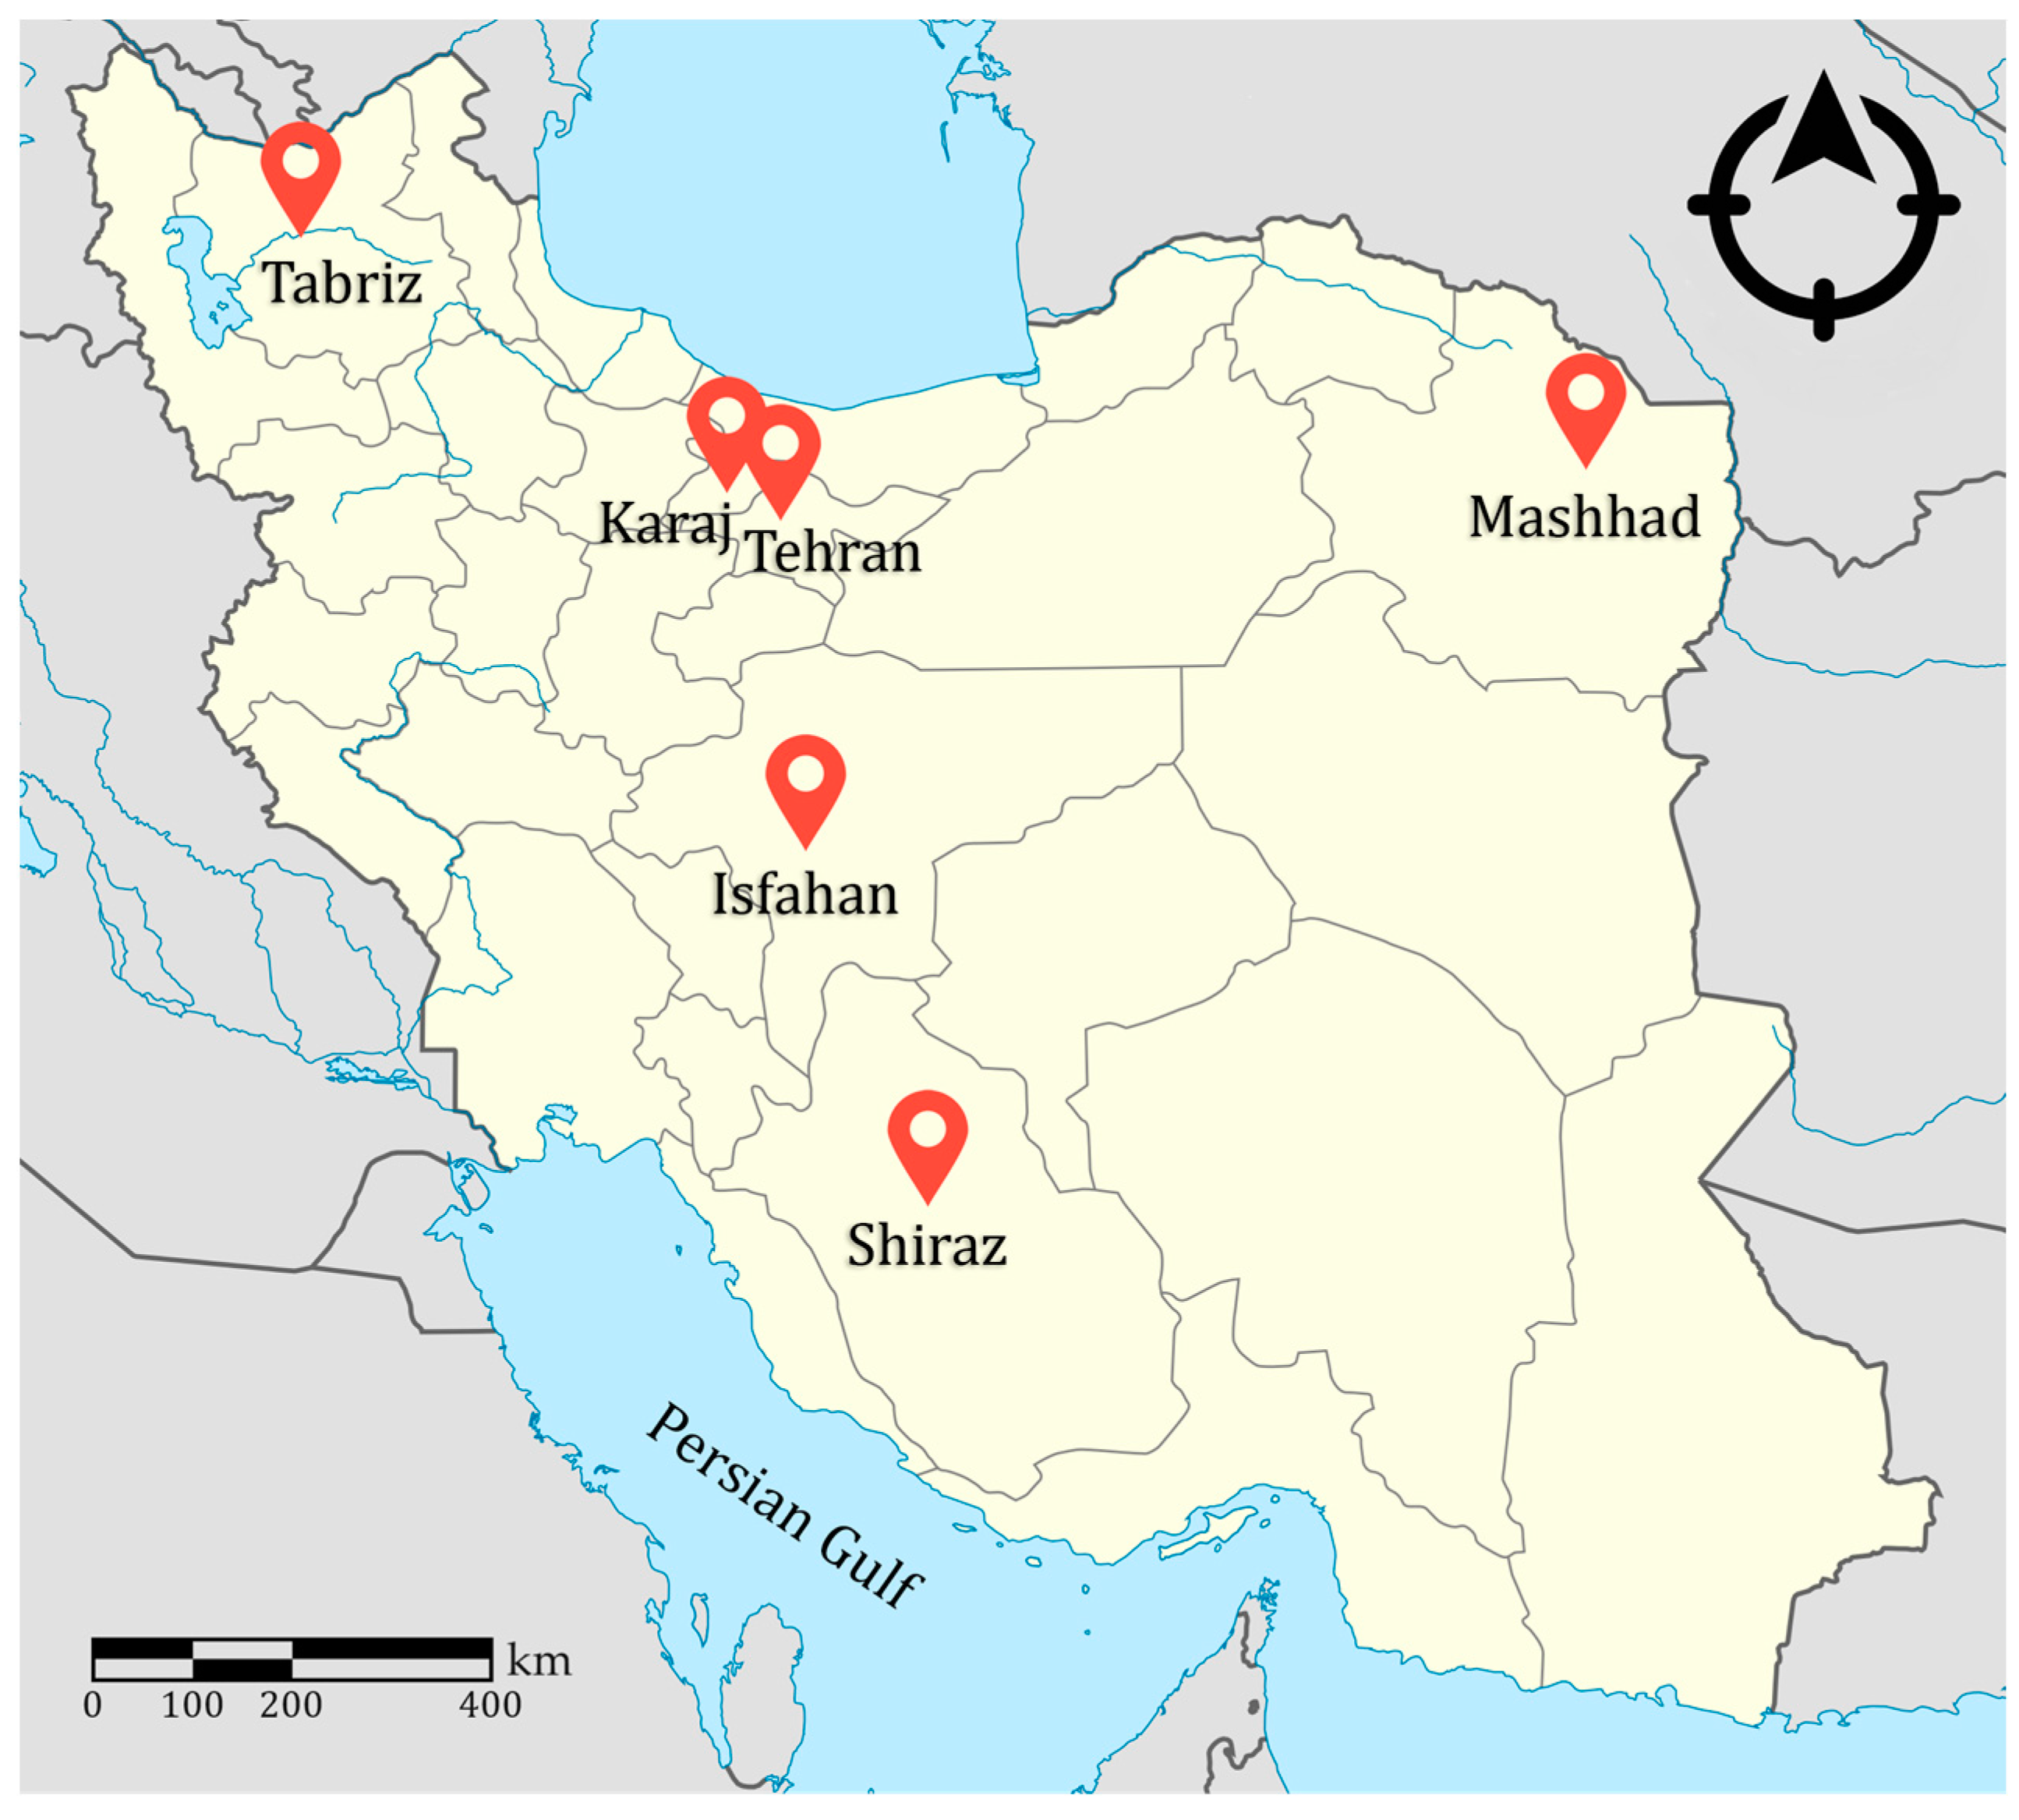
2.1. Iran’s Metropolises and Observed Data

Iran is an expansive country that spans various geographic regions, and its diverse landscapes contribute to a wide array of climate types. From the arid deserts in the central regions to the humid subtropical areas along the Caspian Sea, Iran showcases a remarkable climatic diversity. This research focused on six metropolises in Iran, each showcasing a distinct climate profile: Tehran, Mashhad, Isfahan, Karaj, Shiraz, and Tabriz.
  • Tehran:
    -
    Geographic Coordinates: 35.6895° N, 51.3890° E.
    -
    Climate: Situated in the northern part of Iran, Tehran experiences a cold semi-arid climate. It is nestled in the foothills of the Alborz Mountains, which shield the city from the harsher climates of central Iran. Summers are hot and dry, with temperatures often exceeding 35 °C, while winters are relatively mild, with temperatures occasionally dropping below freezing. Tehran receives most of its precipitation during the winter months, mainly in the form of rain, but snowfall is not uncommon, particularly in the higher elevations of the city.
    -
    Population: Approximately 8 million.
  • Mashhad:
    -
    Geographic Coordinates: 36.2605° N, 59.6168° E.
    -
    Climate: Located in northeastern Iran, Mashhad experiences a cold semi-arid climate. Situated on a plateau surrounded by mountains, the city’s climate is influenced by its elevation and proximity to the desert regions. Summers are hot, with temperatures often exceeding 35 °C (95°F), while winters are cold, with temperatures occasionally dropping below freezing. Snowfall is relatively common during the winter months.
    -
    Population: Approximately 3 million.
  • Isfahan:
    -
    Geographic Coordinates: 32.6546° N, 51.6680° E.
    -
    Climate: Located in central Iran, Isfahan features a cold desert climate. Situated in a vast, arid plain surrounded by mountains, the city experiences hot summers and cold winters. Summers are characterized by high temperatures, often exceeding 40 °C, while winters are relatively mild, with temperatures occasionally dropping below freezing. Isfahan receives minimal precipitation throughout the year, with most rainfall occurring during the winter months.
    -
    Population: Approximately 2 million.
  • Karaj:
    -
    Geographic Coordinates: 35.8355° N, 50.9915° E.
    -
    Climate: Located northwest of Tehran, Karaj shares a similar climate to its neighboring capital. Situated in the foothills of the Alborz Mountains, the city experiences a cold semi-arid climate. Summers are hot and dry, while winters are cool and rainy, with occasional snowfall. Karaj receives most of its precipitation during the winter months, primarily in the form of rain.
    -
    Population: Approximately 1.9 million.
  • Shiraz:
    -
    Geographic Coordinates: 29.5926° N, 52.5836° E.
    -
    Climate: Located in southwestern Iran, Shiraz experiences a cold semi-arid climate. Situated on a plateau surrounded by mountains, the city’s climate is influenced by its elevation and proximity to the Zagros mountains. Summers are hot and dry, with temperatures often exceeding 35 °C, while winters are relatively mild, with temperatures rarely dropping below freezing. Shiraz receives most of its precipitation during the winter months, primarily in the form of rain.
    -
    Population: Approximately 1.8 million.
  • Tabriz:
    -
    Geographic Coordinates: 38.0962° N, 46.2738° E.
    -
    Climate: Located in northwestern Iran, Tabriz experiences a humid continental climate. Situated at the foothills of the Sahand mountains, the city’s climate is influenced by its elevation and proximity to the Caspian Sea. Summers are warm and dry, while winters are cold and snowy, with temperatures occasionally dropping below freezing. Tabriz receives most of its precipitation during the winter months, primarily in the form of snow.
    -
    Population: Approximately 1.5 million.
These cities’ varying climates are a reflection of Iran’s climatic diversity, influenced by its vast topography and geographical location. The geographic locations of these metropolises are shown in Figure 2. The observed records of daily precipitation and average temperature data were acquired from the Islamic Republic of Iran Meteorological Organization [33], spanning from 1951 to 2023 for Tehran, Mashhad, Isfahan, Shiraz, and Tabriz, and from 1985 to 2023 for Karaj, due to the availability of the data.

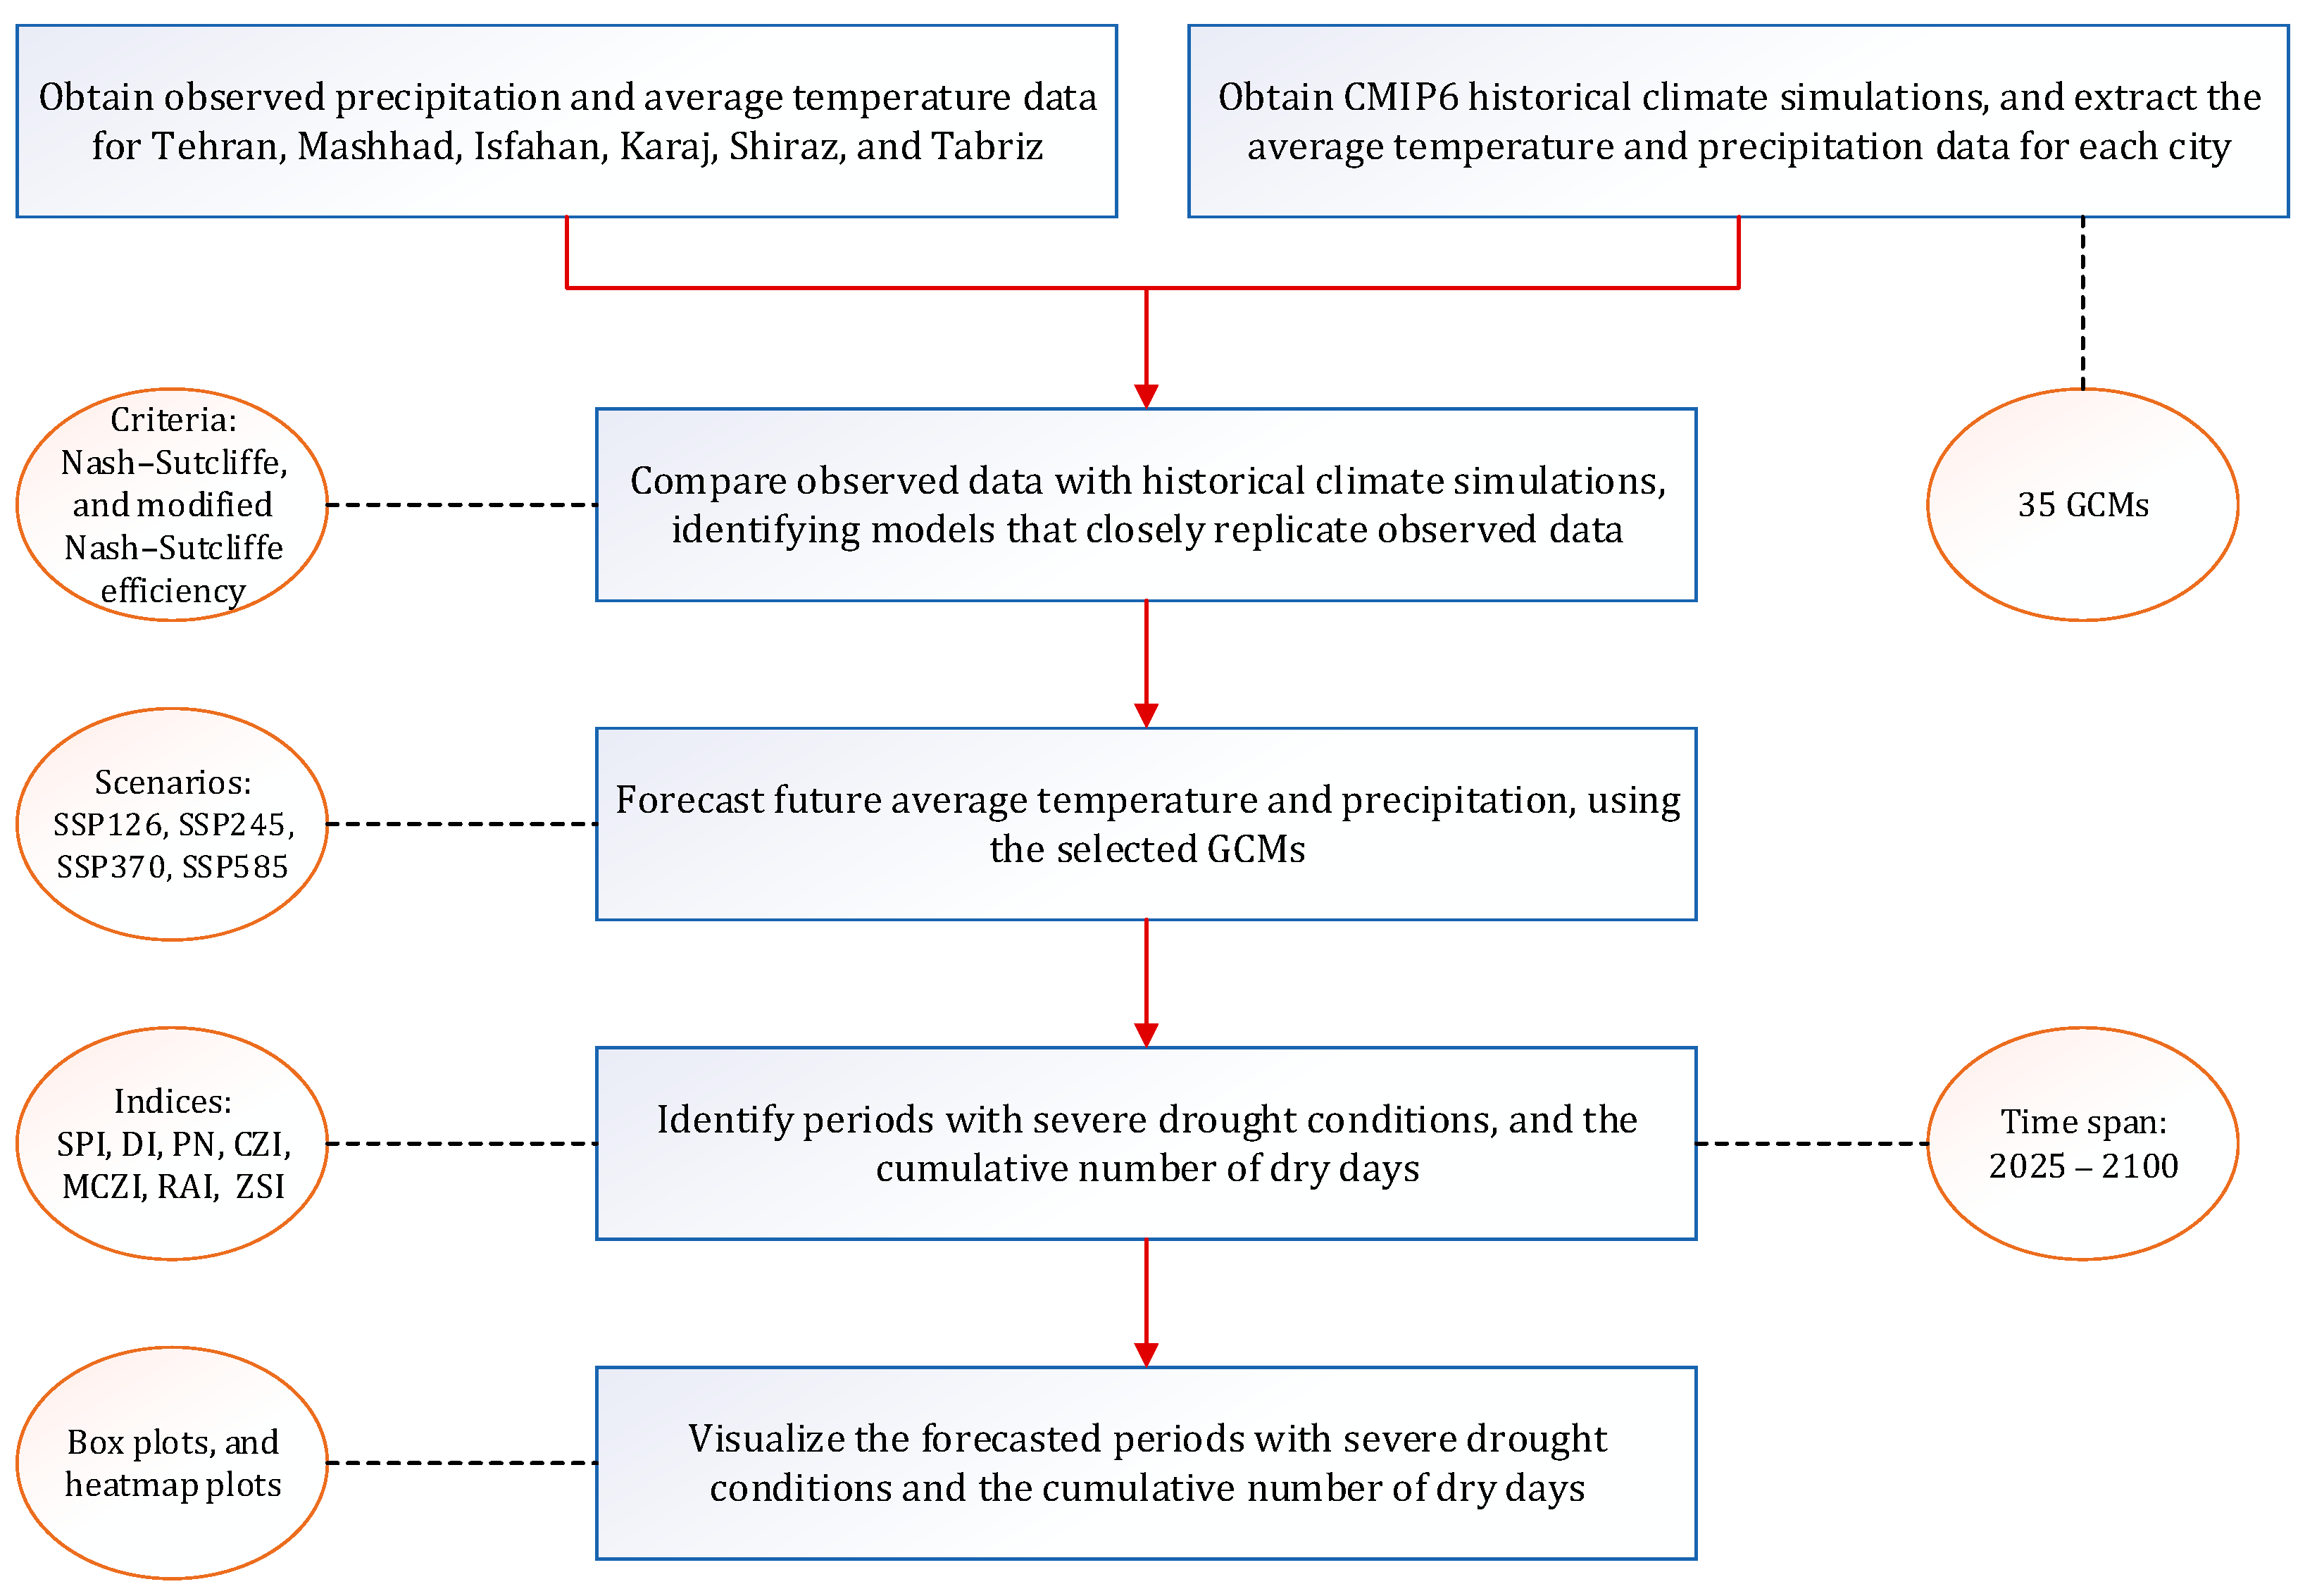
2.2. GCMs and Scenarios

GCMs play a vital role in forecasting future climate conditions under varying emission scenarios. These models, known for their universal applicability [34], exhibit varied simulation performances across different climatic elements and geographical regions. This diversity in outcomes underscores the nuanced nature of GCMs, highlighting the need for careful consideration when interpreting their projections. This study utilized 35 GCM simulations derived from the Coupled Model Intercomparison Project Phase 6 (CMIP6) datasets. These datasets were accessed through the NASA Earth Exchange Global Daily Downscaled Projections (NEX-GDDP-CMIP6) portal [35], which provides a platform for obtaining high-resolution, bias-corrected, and downscaled climate data. The use of multiple simulations from the CMIP6 ensemble offers a comprehensive view of potential climate futures, taking into account a wide range of GCM outputs. This approach enhances the robustness of this study by incorporating a diverse array of climate scenarios and projections. The climate data were obtained in the NetCDF format, spanning from 1951 to 2015, and were extracted for designated geographic locations. Table 1 details the GCMs employed in this study, along with their respective resolutions and the scenarios each model was subjected to.
SSPs serve as climate change scenarios projecting global socioeconomic changes up to 2100, as outlined in the IPCC Sixth Assessment Report on Climate Change in 2021 [4]. These pathways are instrumental in deriving greenhouse gas emissions scenarios aligned with diverse climate policies. SSPs offer narratives that articulate alternative socioeconomic trajectories. These storylines provide qualitative descriptions interlinking various elements within the narratives. Moreover, they include quantitative data associated with scenarios concerning the national population, urbanization, and the GDP (per capita) [36].
  • SSP1—Choosing the sustainable route (minimal hurdles for mitigation and adaptation):
The world is shifting towards sustainability, balancing inclusive development with environmental constraints. Shared global resources are managed better, education and healthcare investments reshape demographics, and economic growth now emphasizes overall human well-being. This focus is reducing inequality globally and within nations, steering consumption toward minimal material growth and lower resource use.
  • SSP2—Middle of the road (medium challenges to mitigation and adaptation):
The world largely mirrors historical trends in social, economic, and technological norms. Disparities persist in development and income growth among nations. Efforts towards sustainable development progress incrementally. Environmental degradation continues, with sporadic improvements, resulting in a slight decrease in resource consumption. Global population growth stabilizes in the latter half of the century. Income inequality improves slowly, and challenges in reducing the vulnerability to societal and environmental changes persist.
  • SSP3—Regional rivalry:
Nations prioritize domestic and regional issues due to resurging nationalism, competitiveness, and security concerns. Policies focus on national and regional security, diverting resources from broader development goals to achieve energy and food security. Declining investments in education and technology slow economic growth and foster resource-intensive consumption, worsening inequality. Developed countries face low population growth, while developing nations experience higher rates. Limited international attention to environmental problems results in severe degradation in specific regions, complicating mitigation and adaptation efforts.
  • SSP4—Inequality:
Challenges for adapting to changes are significant while mitigation faces minimal hurdles. Inequalities widen due to uneven investments in human capital, creating global social divisions. A divide emerges between interconnected, knowledge-driven societies and fragmented, low-income communities engaged in less advanced industries. Social cohesion weakens, fostering conflict. High-tech sectors advance, while the energy sector diversifies between carbon-intensive and low-carbon sources. Environmental policies primarily address local issues in middle- and high-income regions.
  • SSP5—Fossil fuel-fueled development:
The world prioritizes competitive markets and innovation for rapid technological advancement and human capital growth, aiming for sustainability. Despite extensive investment in healthcare and education, there is the widespread use of fossil fuels and resource-intensive lifestyles, rapidly expanding the global economy. The global population peaks and starts declining, while local environmental issues like air pollution are well managed. Confidence exists in governing social and ecological systems, including considering geo-engineering interventions if needed.

2.3. Drought Indices

Several drought indicators have been developed to describe and identify various forms of drought. Standardized drought indicators are frequently applied to assess the diverse types of drought, enabling comparisons across various timeframes and geographic extents [37]. Drought indices used in this study, accompanied by their respective classifications are listed in Table 2. Further elucidation regarding these indices is provided below.

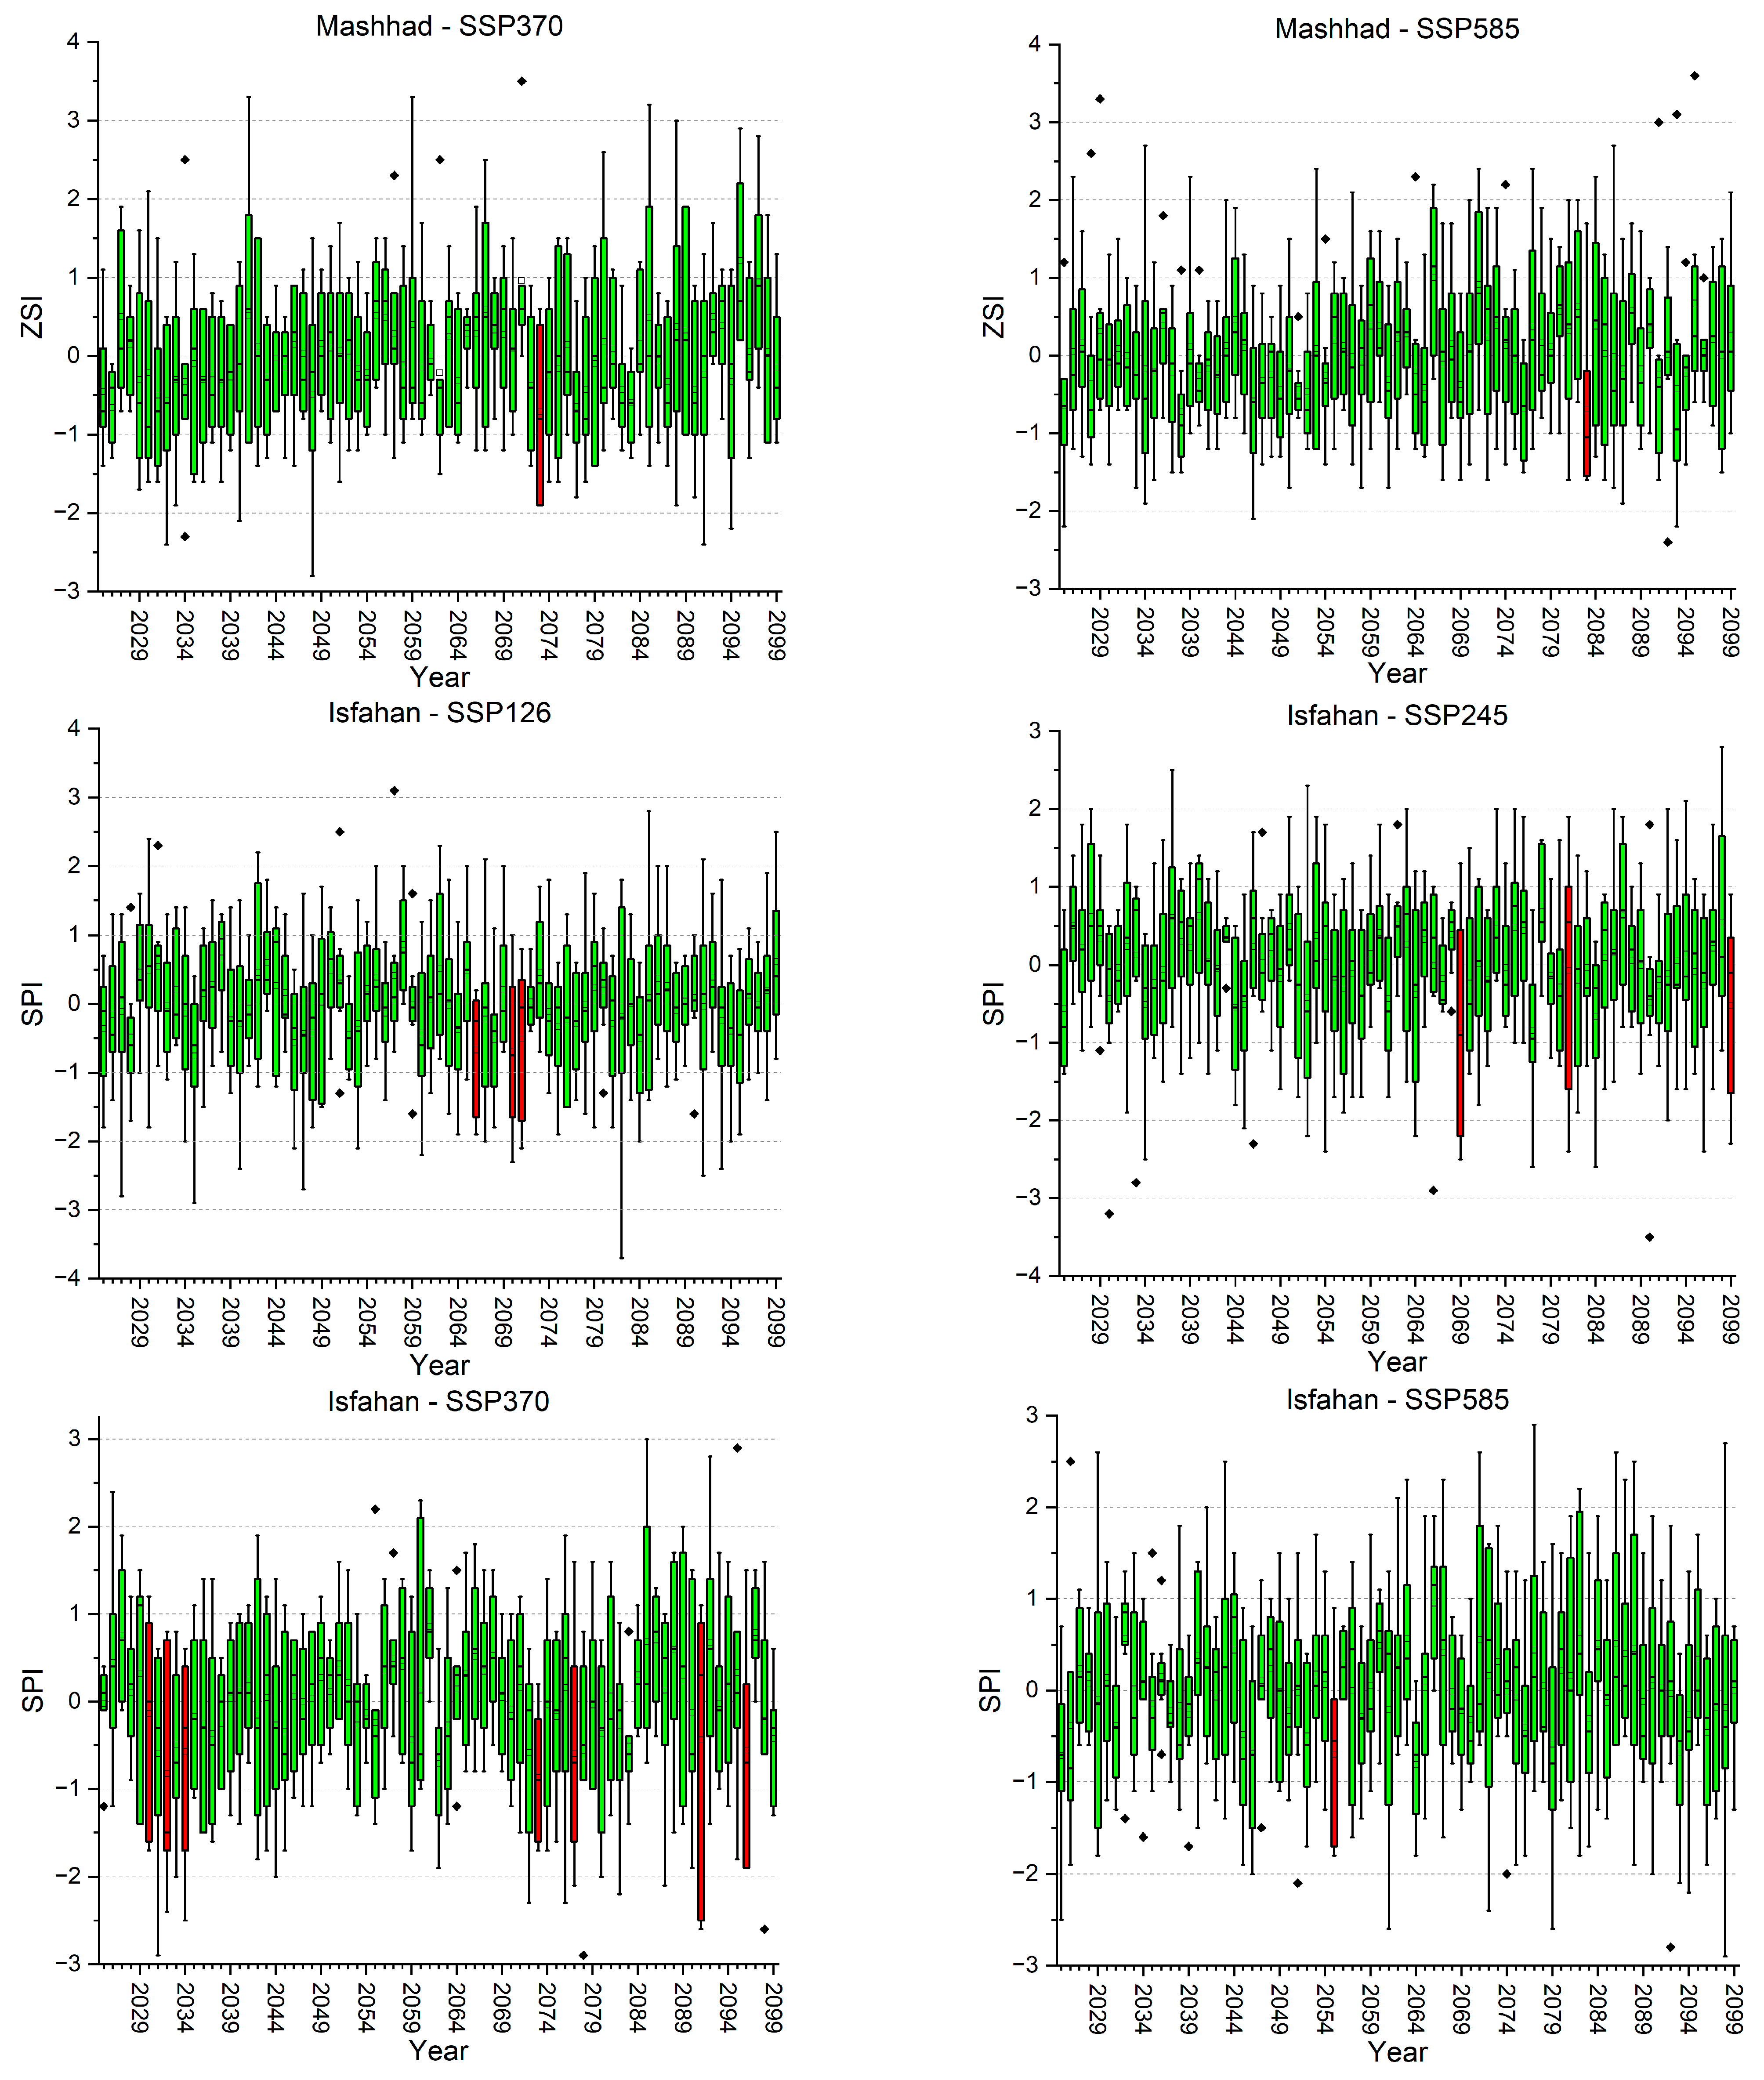
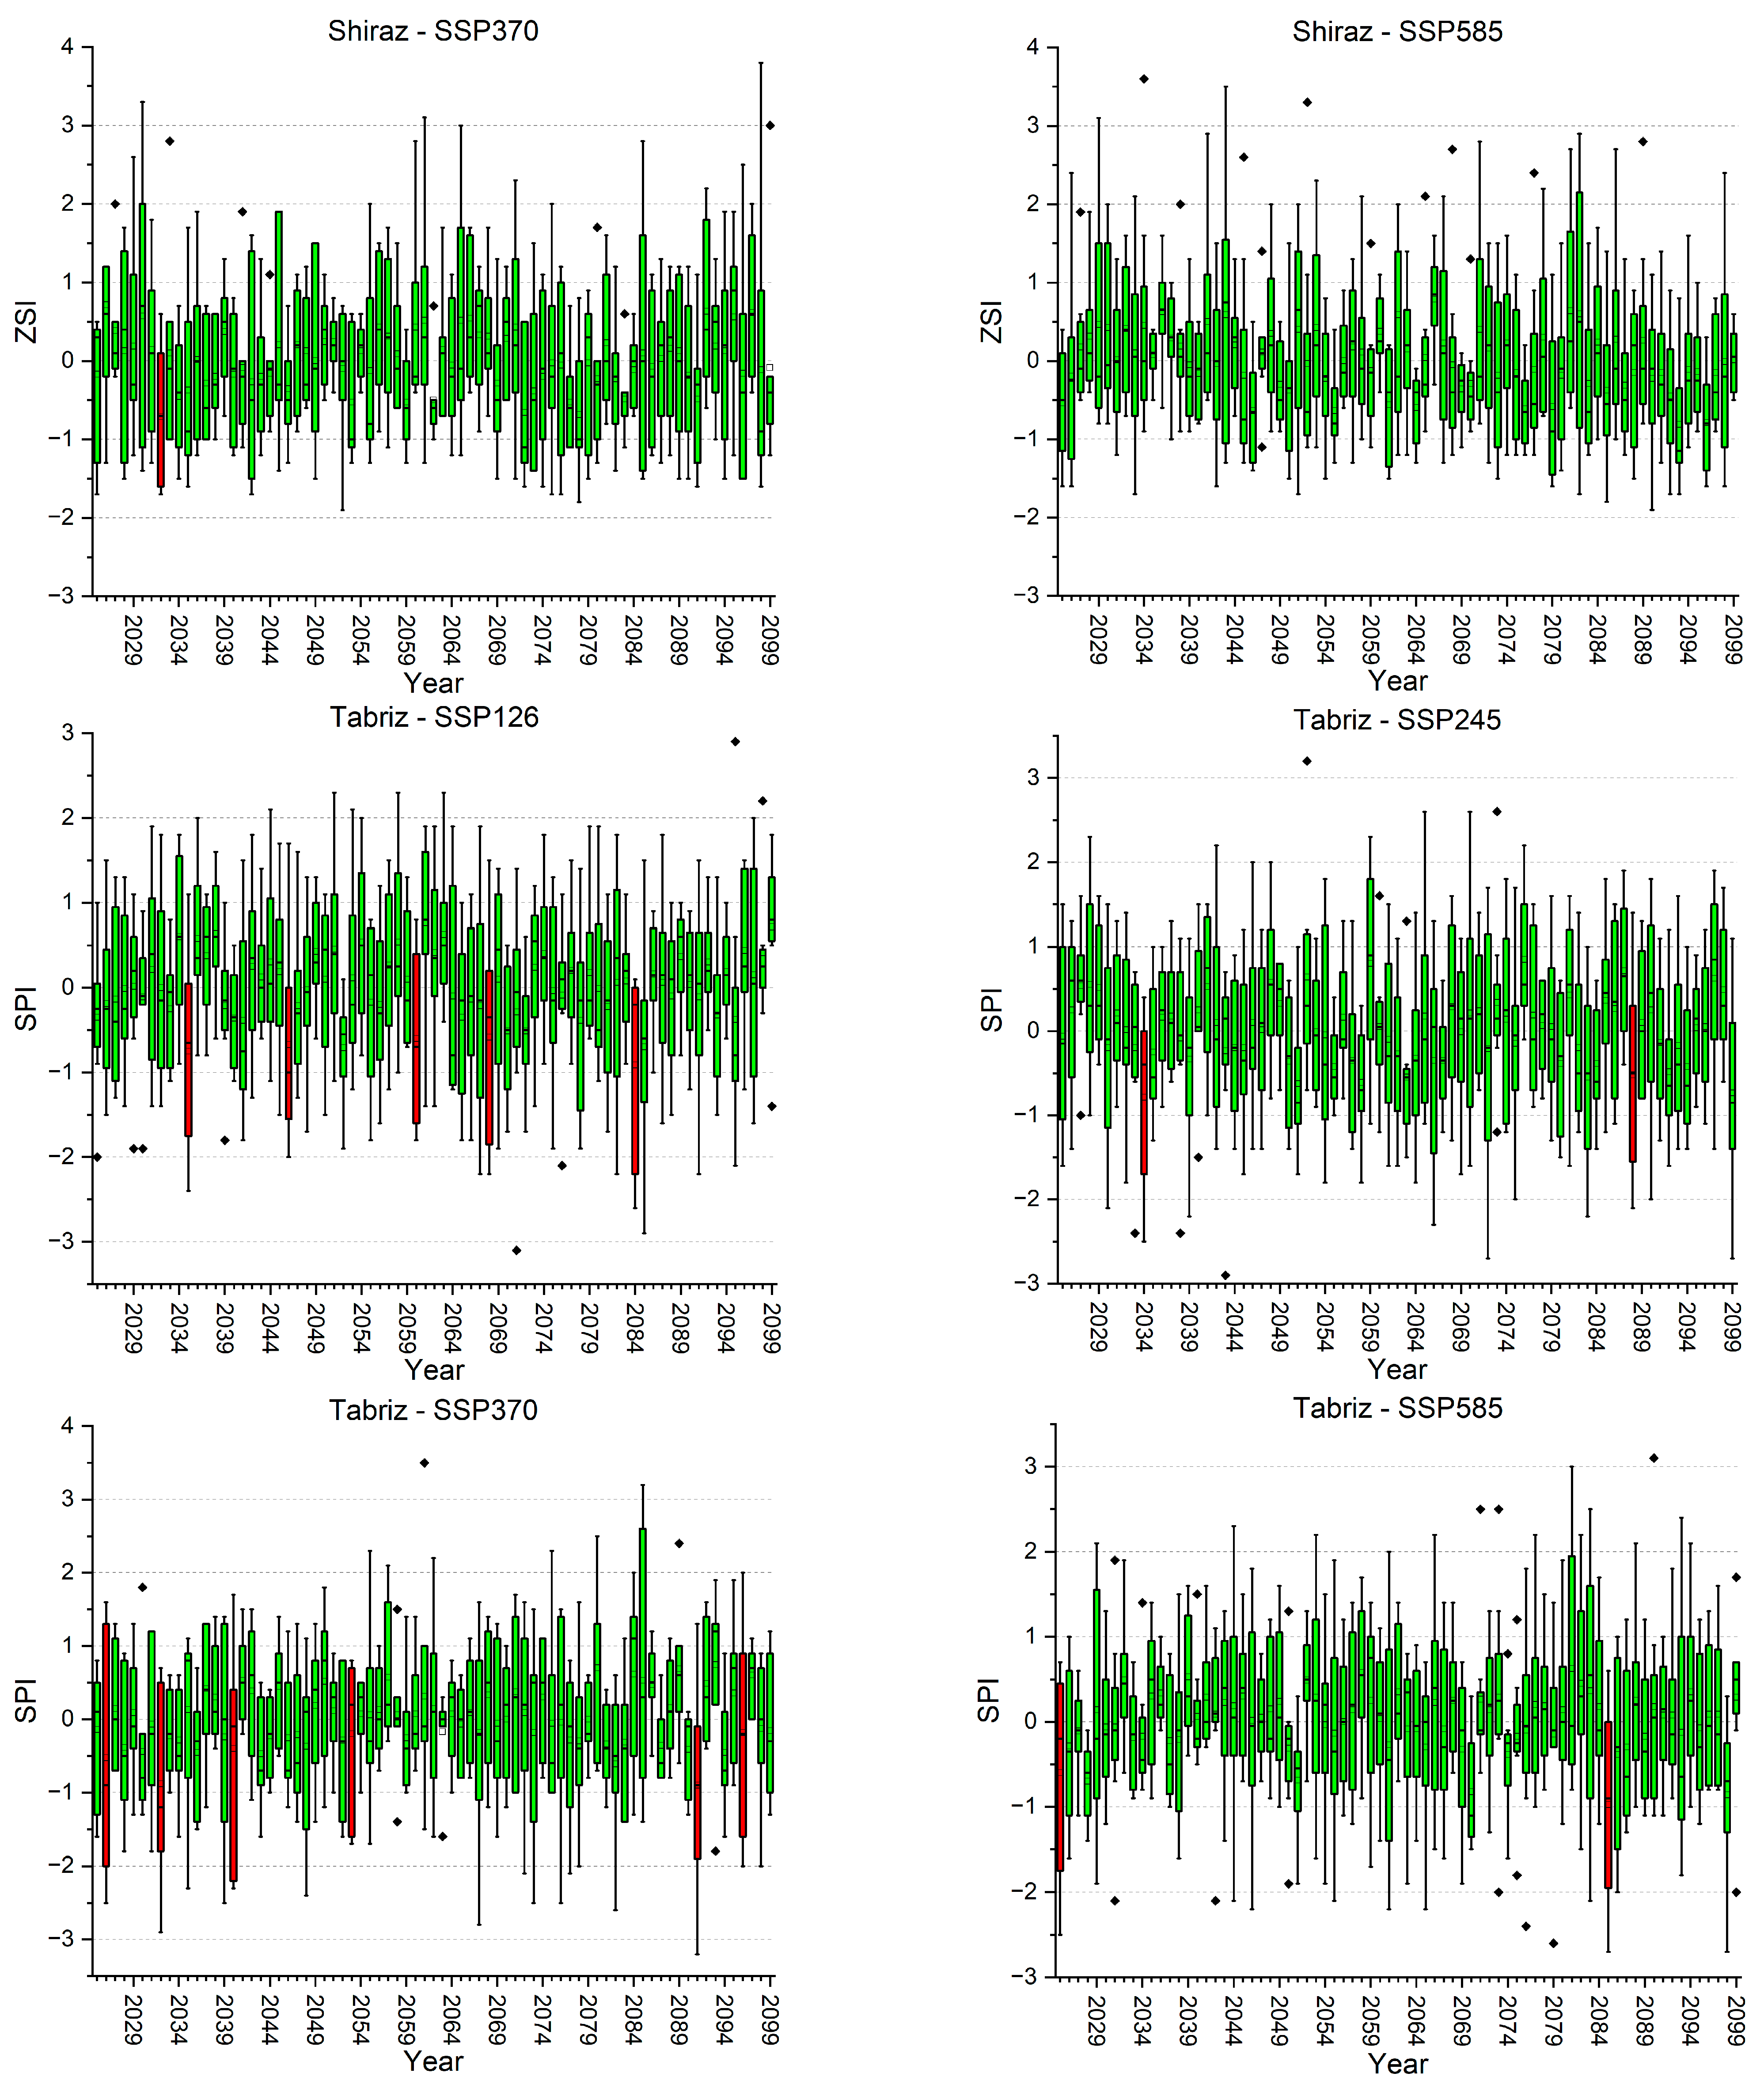
2.3.1. Standardized Precipitation Index (SPI)

The SPI index is widely used to analyze and understand meteorological droughts across various periods. It was developed in 1993 by researchers at Colorado State University to improve water supply monitoring in Colorado [38]. The SPI’s strength lies in its adaptability, allowing for comparisons across different climate regions. It achieves this by standardizing precipitation data, making it follow a specific pattern based on statistical models. The SPI begins with the raw precipitation data, which are inherently unpredictable. To make this data more manageable, mathematical techniques such as gamma or Pearson Type III distributions are applied, transforming the data into a predictable, normal distribution. The resultant SPI values span from +2.0 to −2.0. Given the possibility of precipitation data conforming to a gamma distribution, the calculation of the SPI entails the utilization of the probability density function inherent to the gamma distribution:
g x = 1 β α Γ ( α )   x α 1 e x β   f o r   x > 0
where the gamma function is denoted by Γ , where x represents the quantity of precipitation (x > 0), ( α > 0) stands as the shape parameter, and ( β > 0) represents the scale parameter. The SPI then quantifies how far the observed precipitation deviates from the long-term average in terms of standard deviations. The positive SPI values indicate higher than average precipitation, while the negative values signify below average precipitation. This versatility makes the SPI suitable for monitoring both dry and wet conditions. It is important to have a dataset spanning at least 30 years for accurate SPI calculations, emphasizing the significance of reliable data [39].

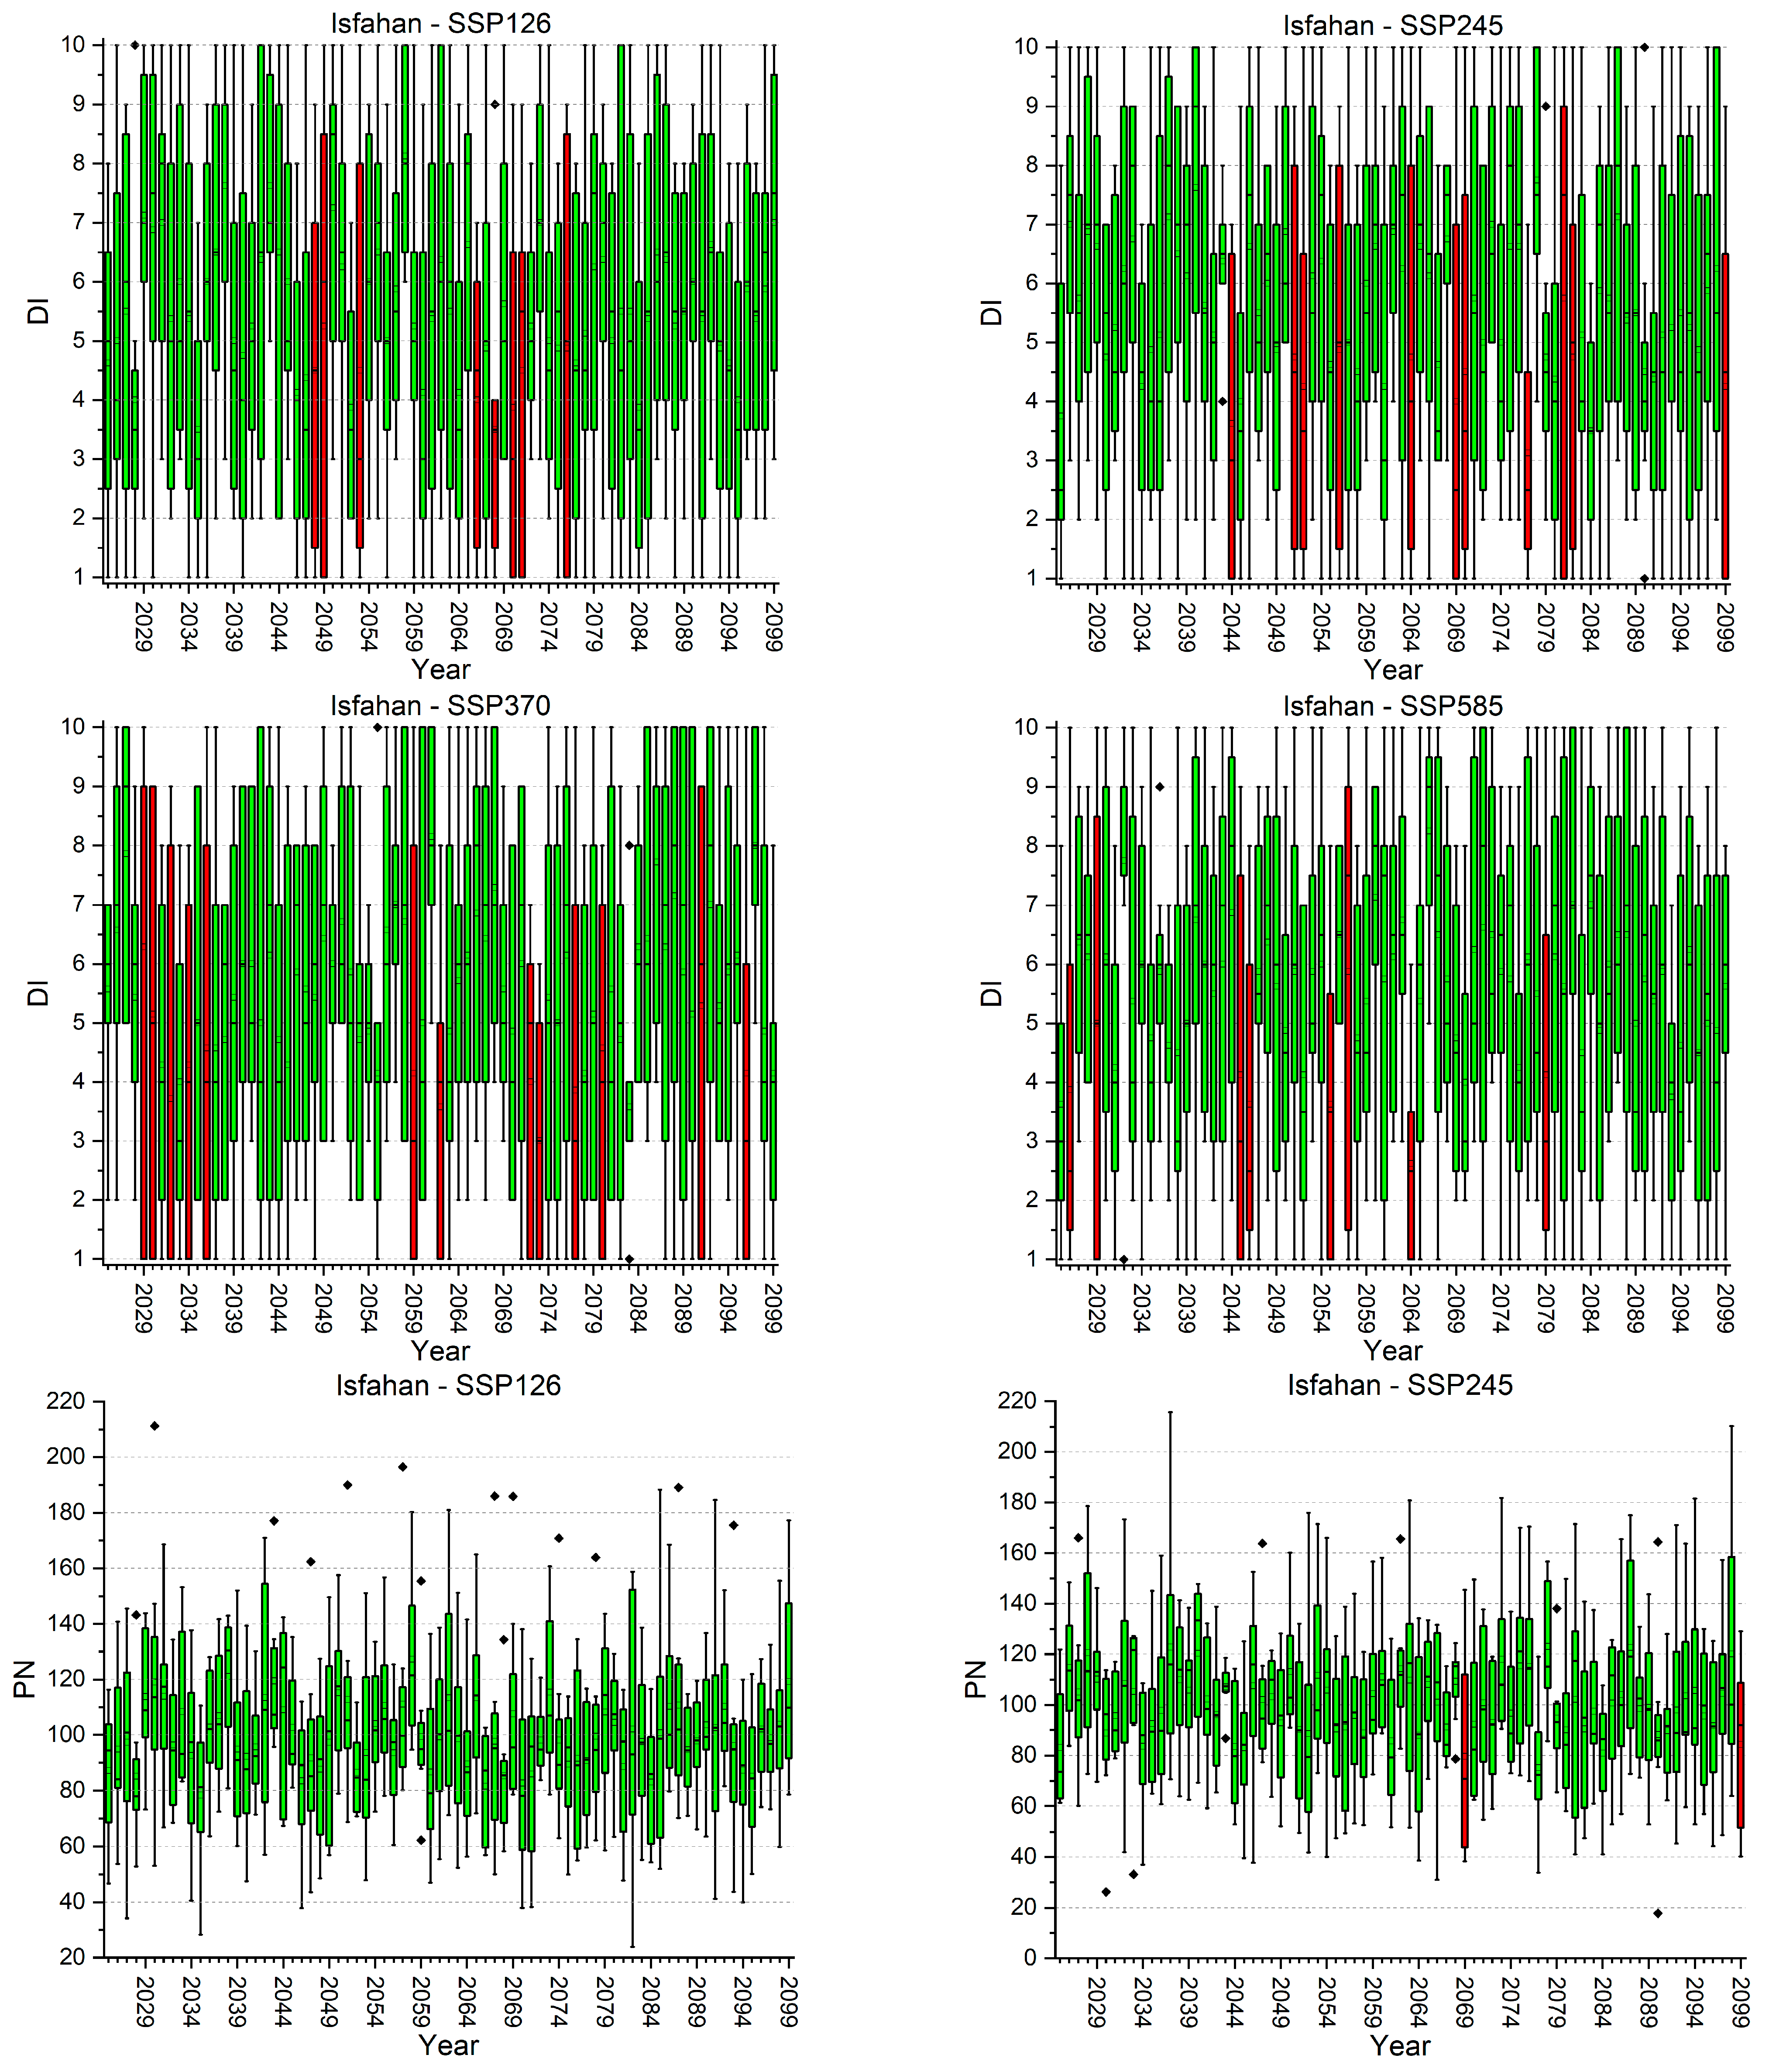
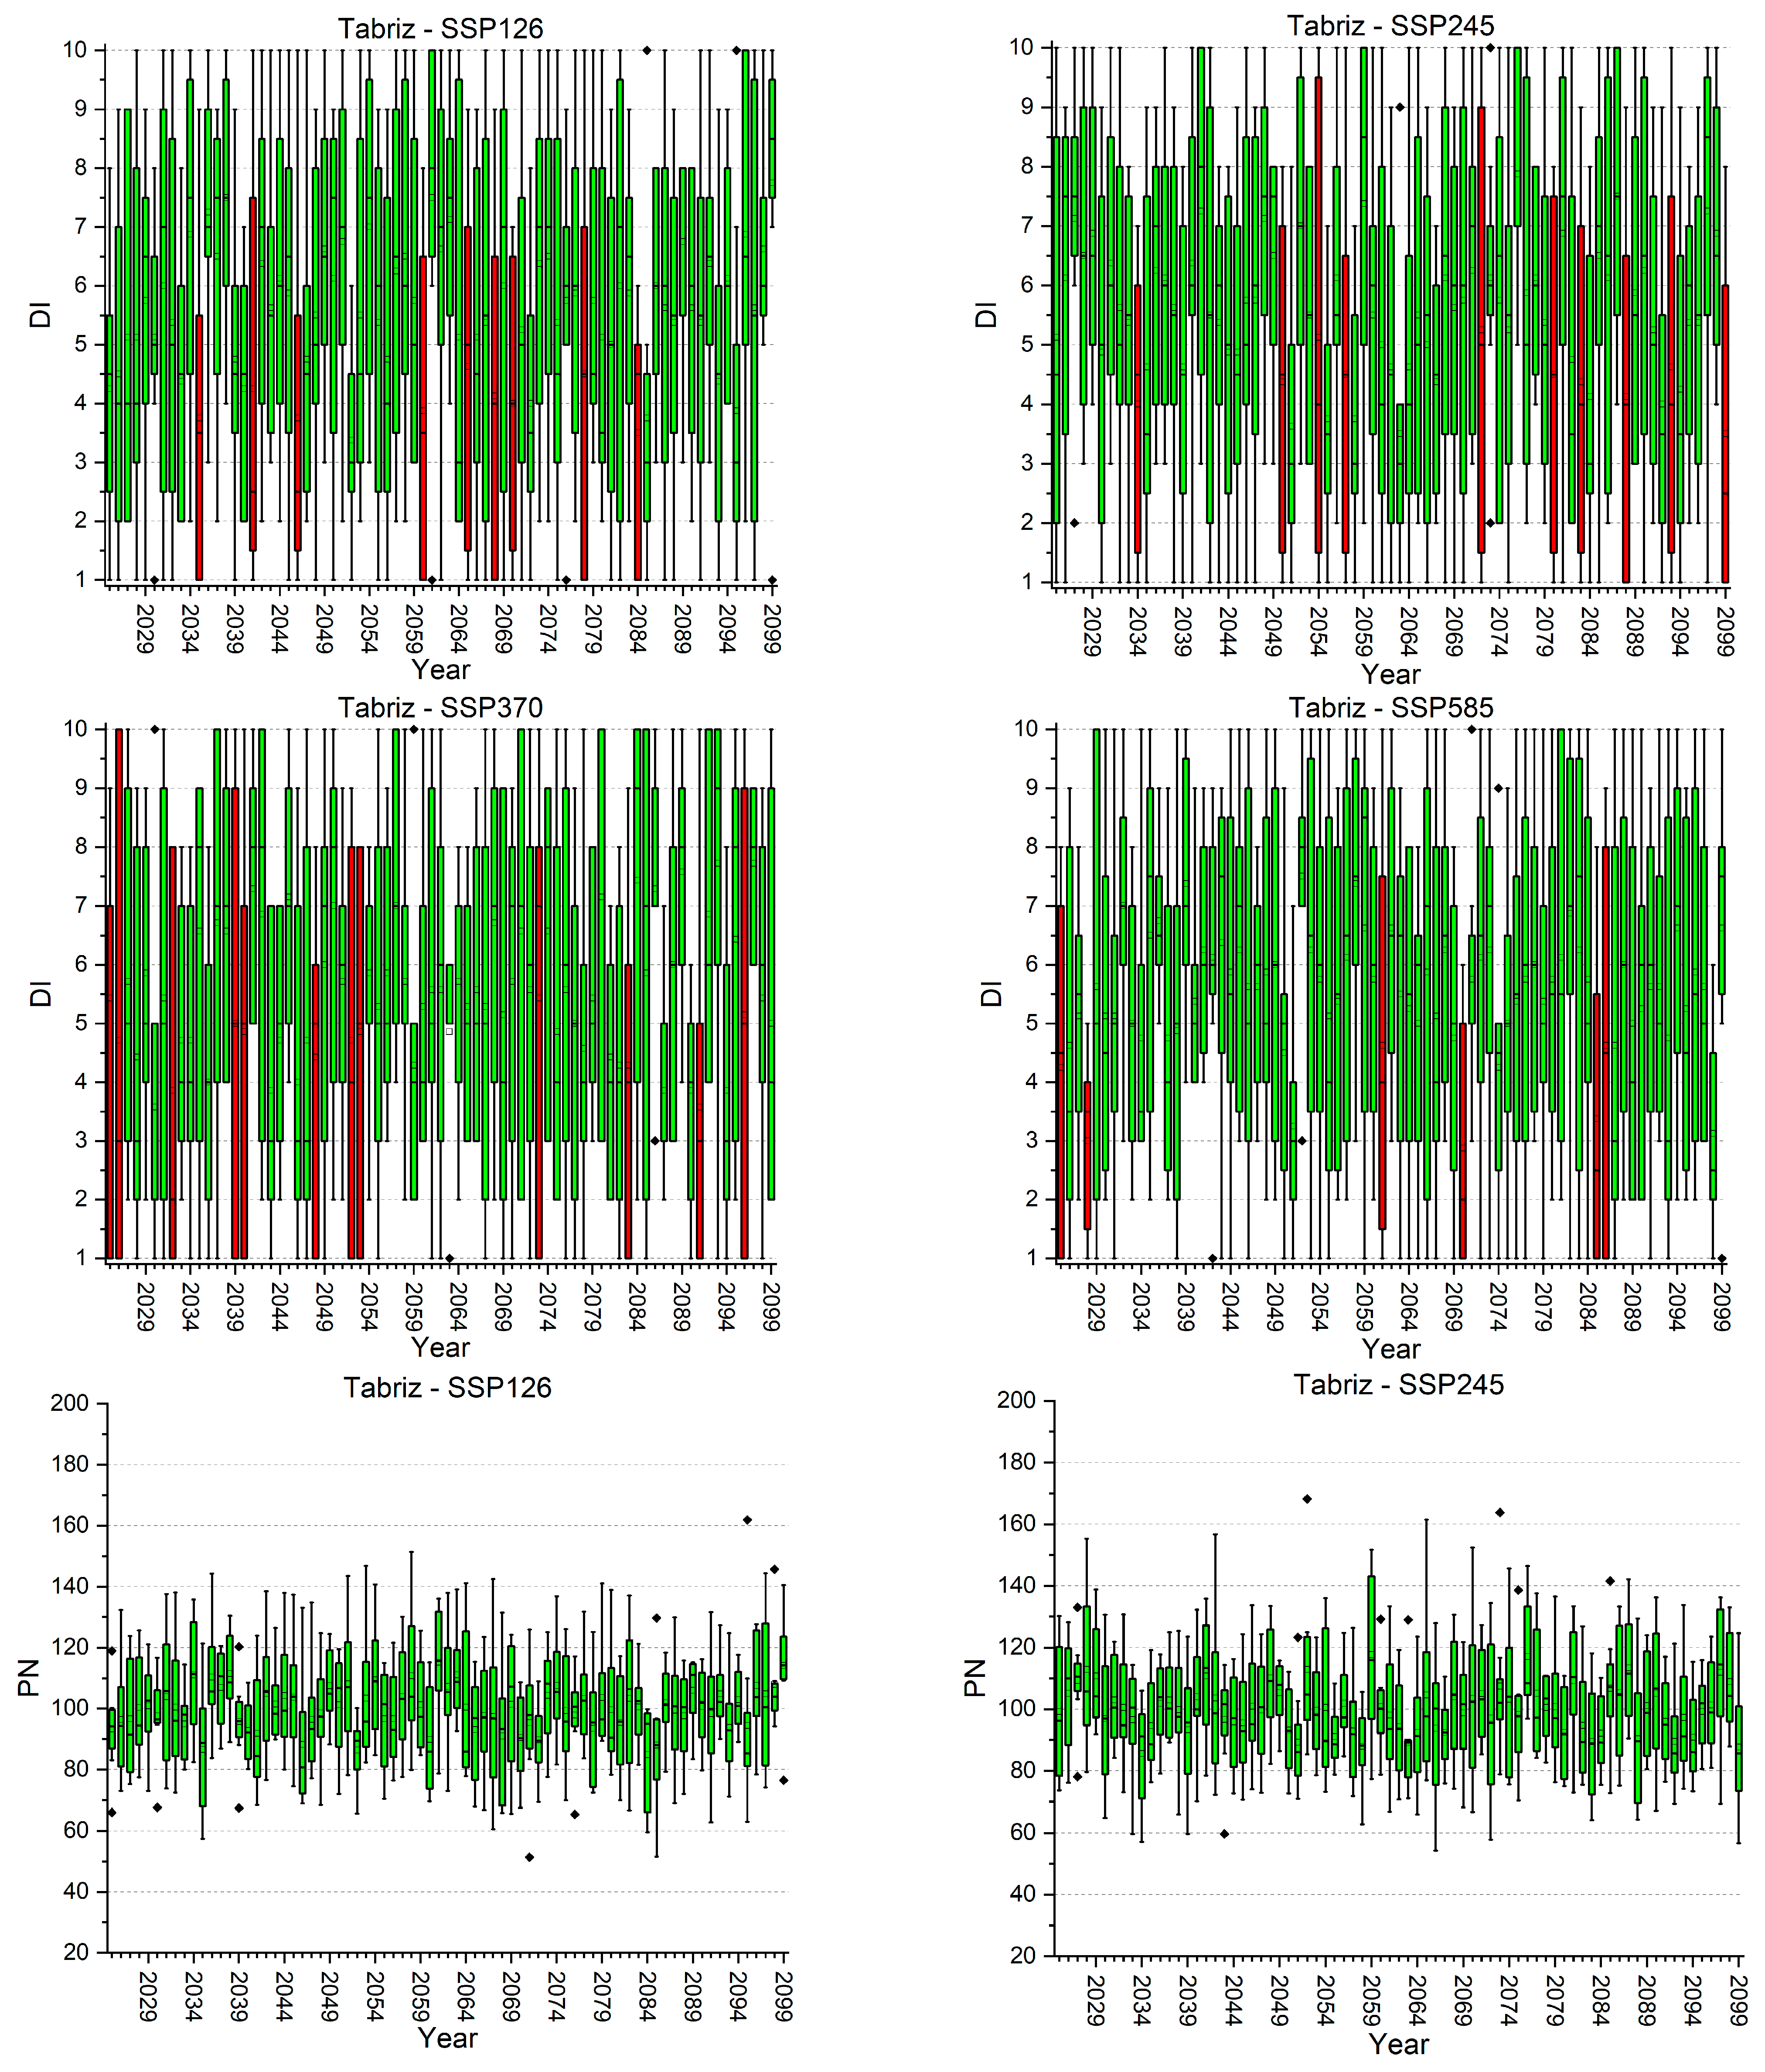
2.3.2. Deciles Index (DI)

The DI index, introduced by Gibbs and Maher (1967) [40], provides a method for assessing monthly precipitation levels based on a long-term record of data. The DI calculation involves several steps. Initially, the monthly precipitation totals are sorted in descending order to construct a cumulative frequency distribution. This distribution is then divided into ten parts, each representing a tenth of the deciles. These deciles are subsequently organized into five groups, with two deciles assigned to each group. The classification is based on the percentage of precipitation relative to the long-term record (Equation (2)).
D E C n = P e r ( P m , n ) D I i , j = n       i f     D E C n 1 < P i , j D E C n
The term DECn represents the deciles associated with the value of n, where n takes on values such as 10, 20, …, 90. Per signifies the percentile function, and Pm corresponds to the rainfall observed in month m. The DI index offers a straightforward way to assess the deviation of current precipitation conditions from long-term averages. This information is valuable for understanding the relative wetness or dryness of a given period, aiding in various applications, including drought monitoring and water resource management [41].

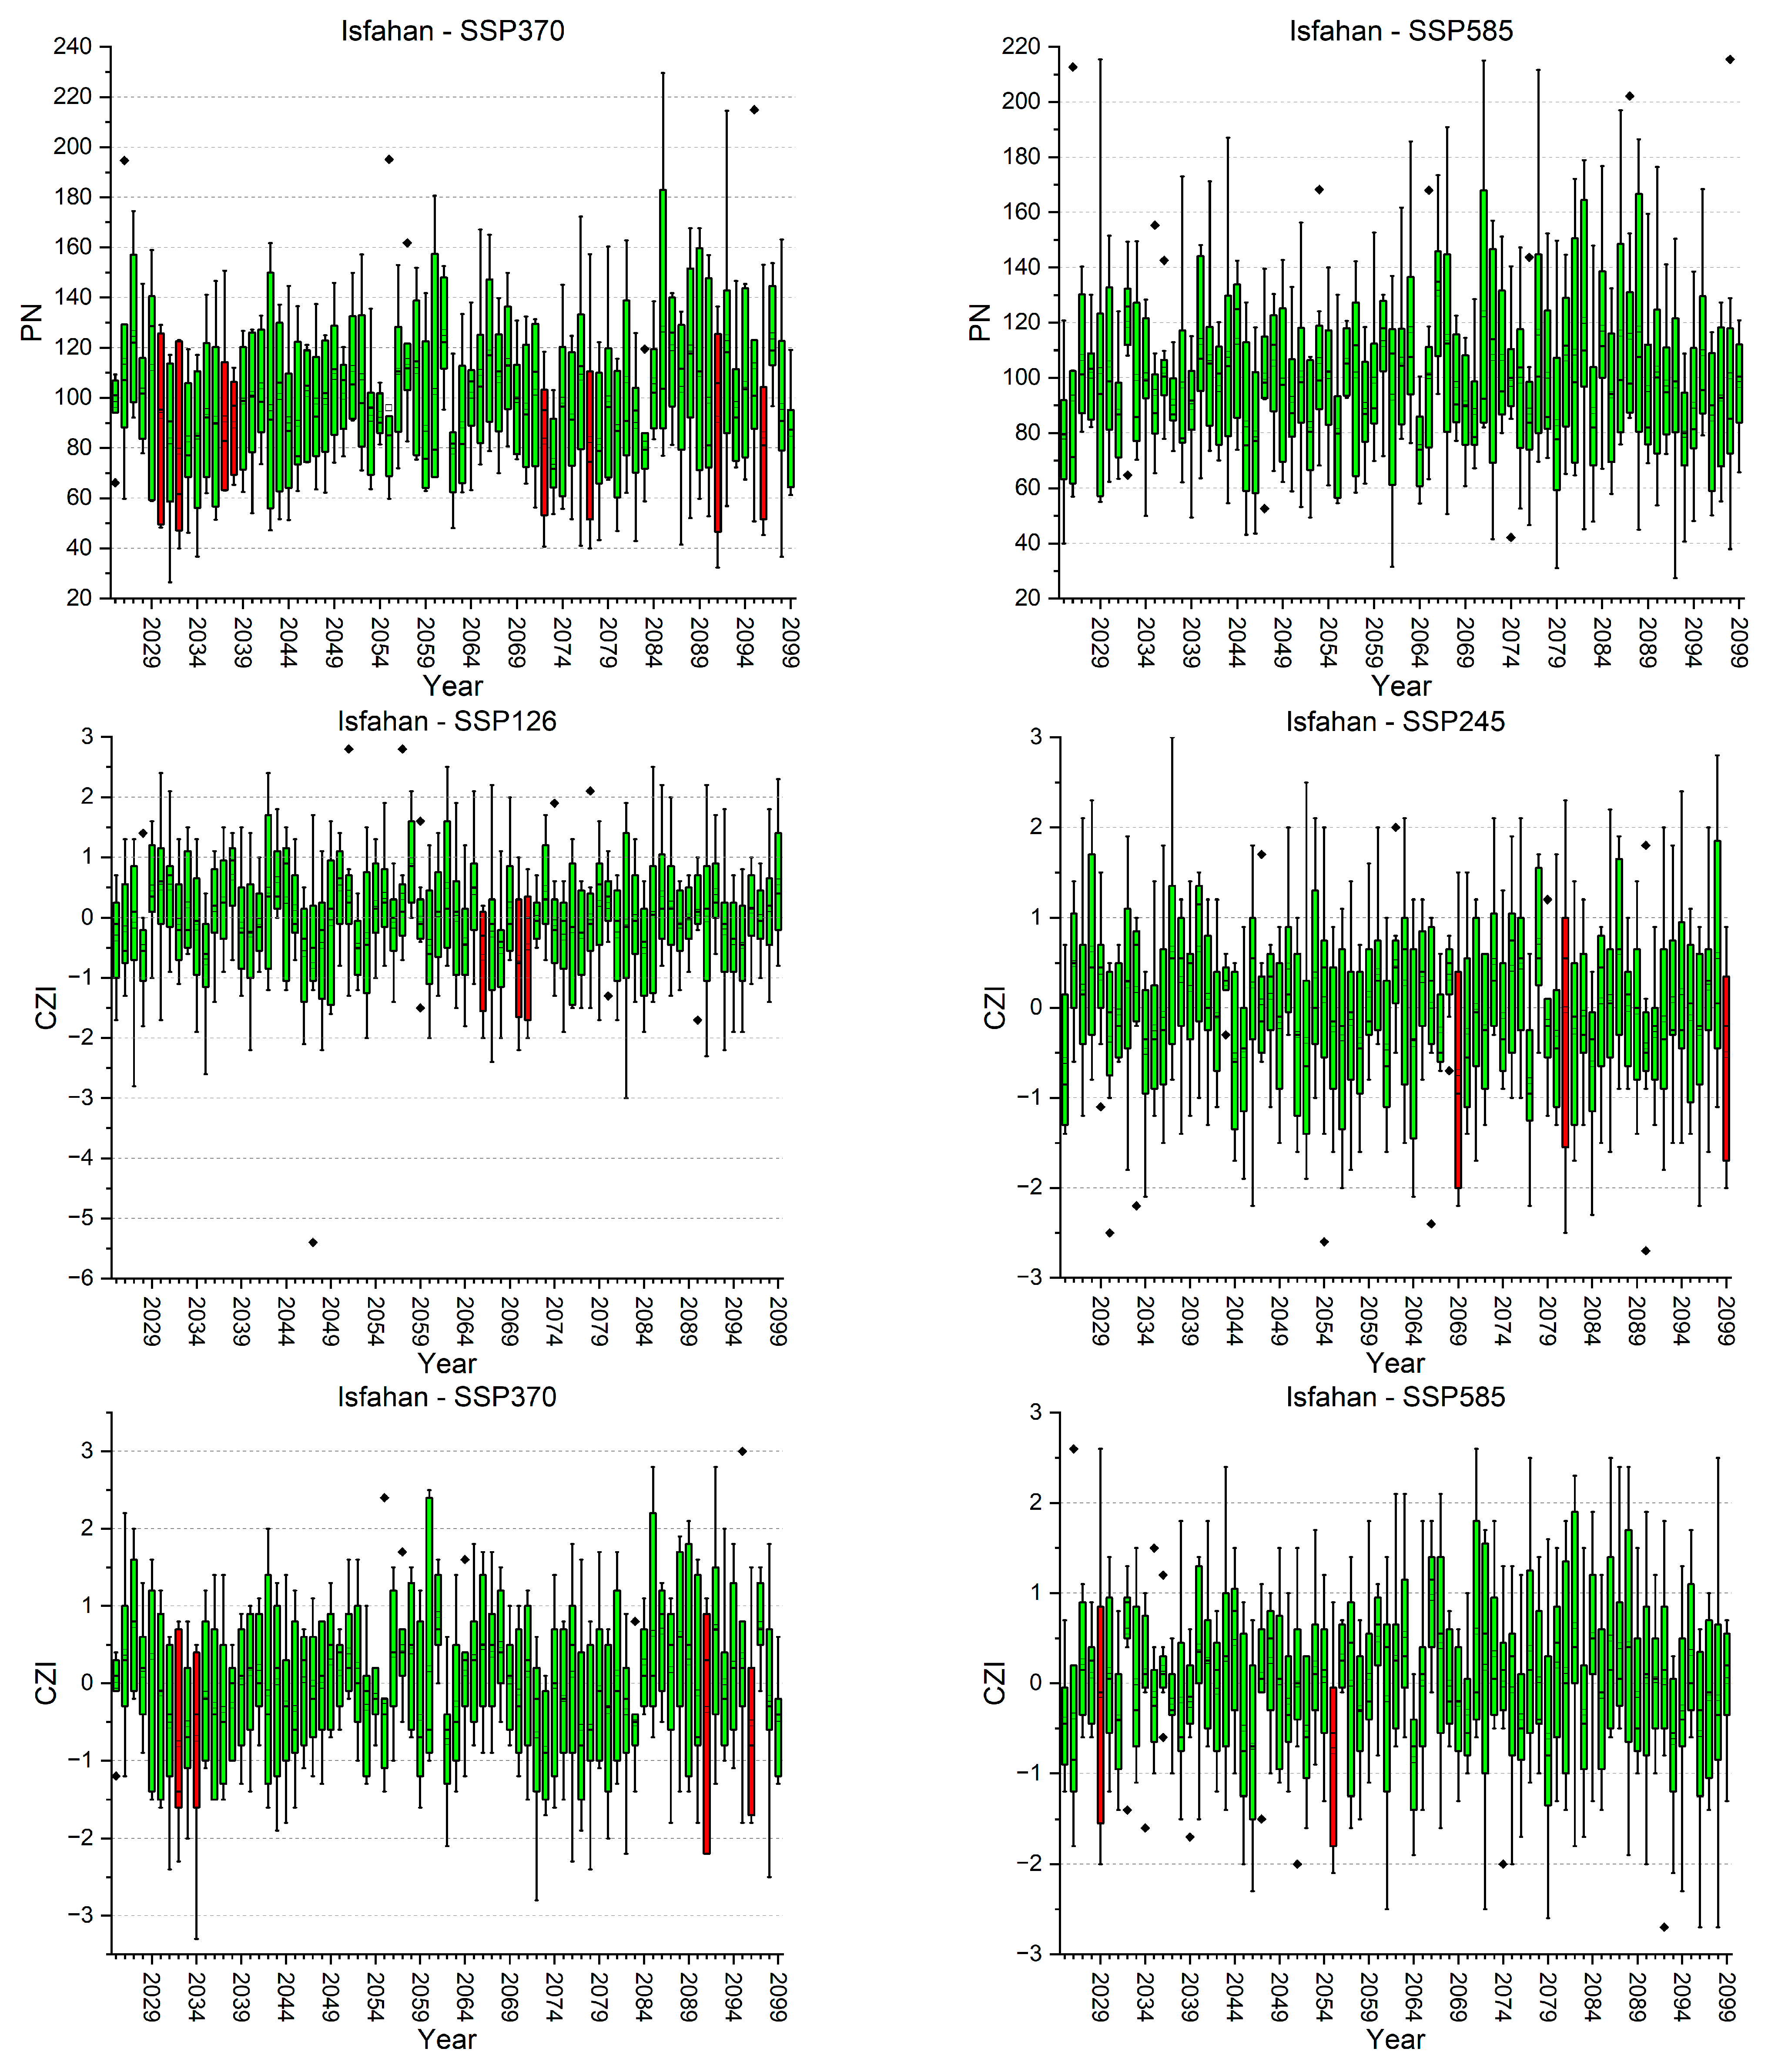
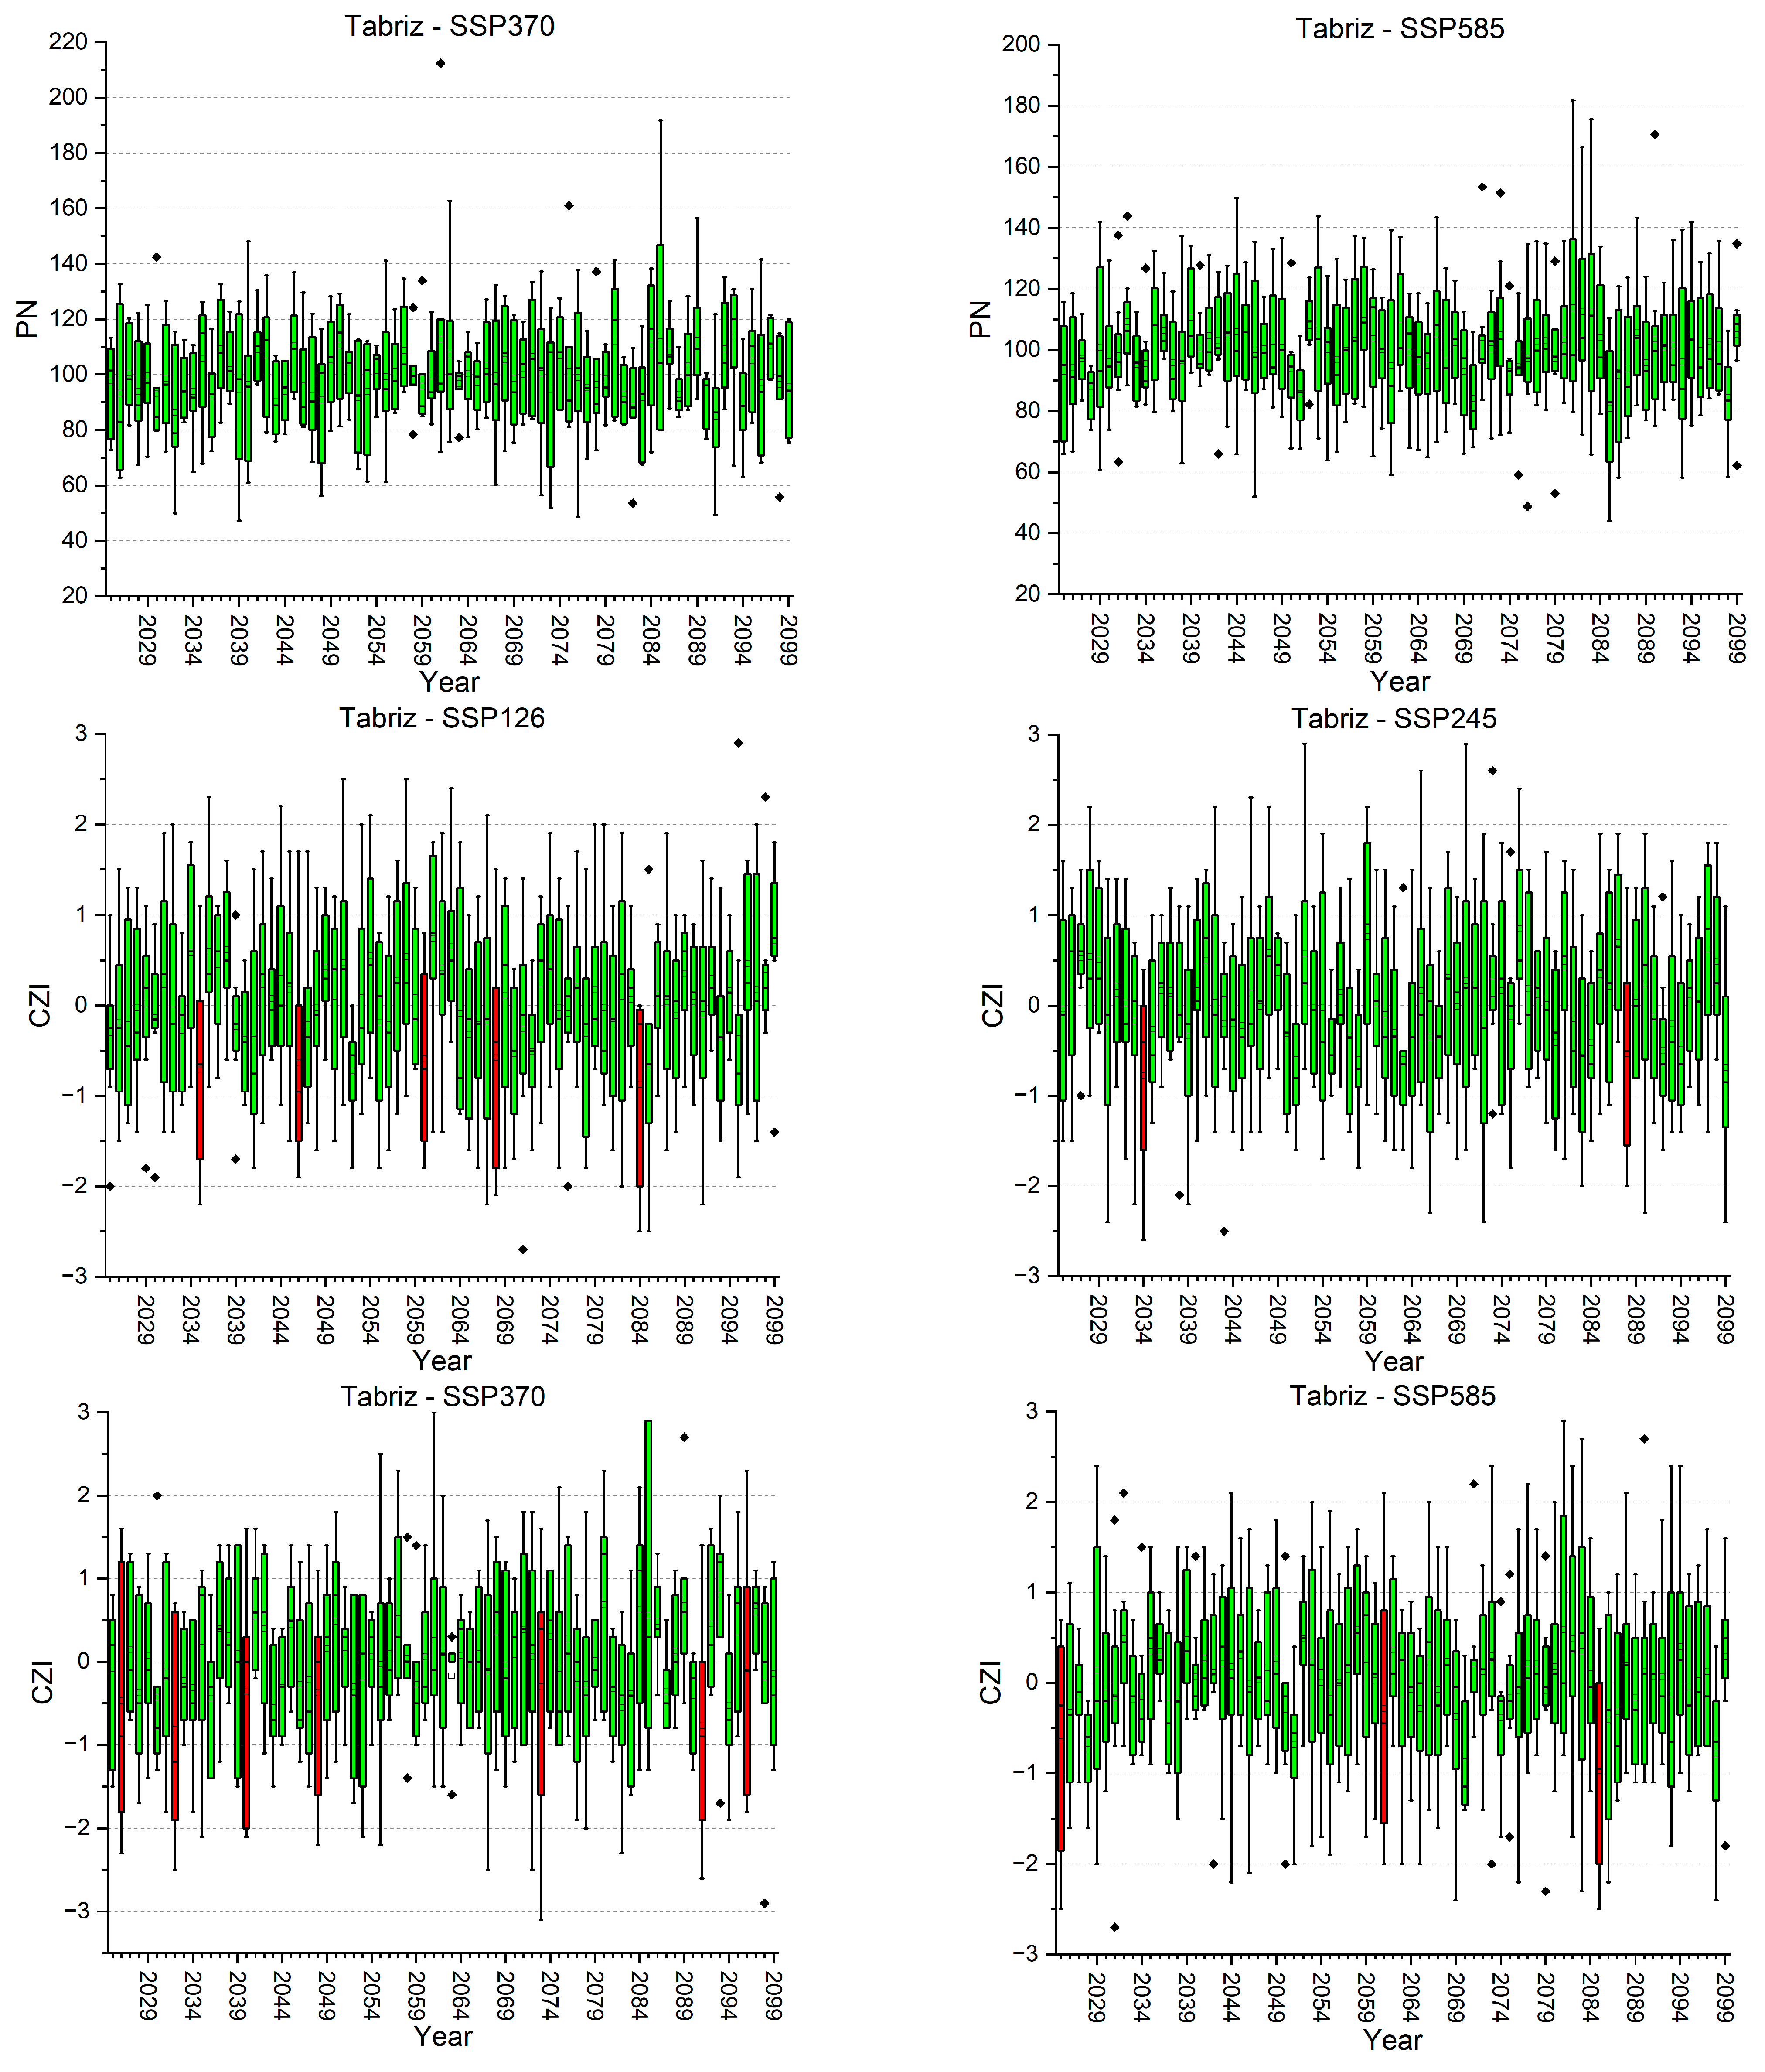
2.3.3. Percent of Normal (PN) Precipitation

The PN index is an easy and straightforward tool for quantifying drought conditions. It is computed as the ratio of the normal precipitation ( p i ) to the observed precipitation ( p ), expressed as a percentage. To obtain a meaningful PN index, a minimum of 30 years of precipitation data is required, making it suitable for long-term drought assessments [42]. The calculation of the PN drought index at a specific station is calculated according to the following formula:
P N = p i p × 100
This formula allows for the straightforward derivation of the PN index, making it a valuable tool for gaining insights into precipitation anomalies and long-term drought patterns.

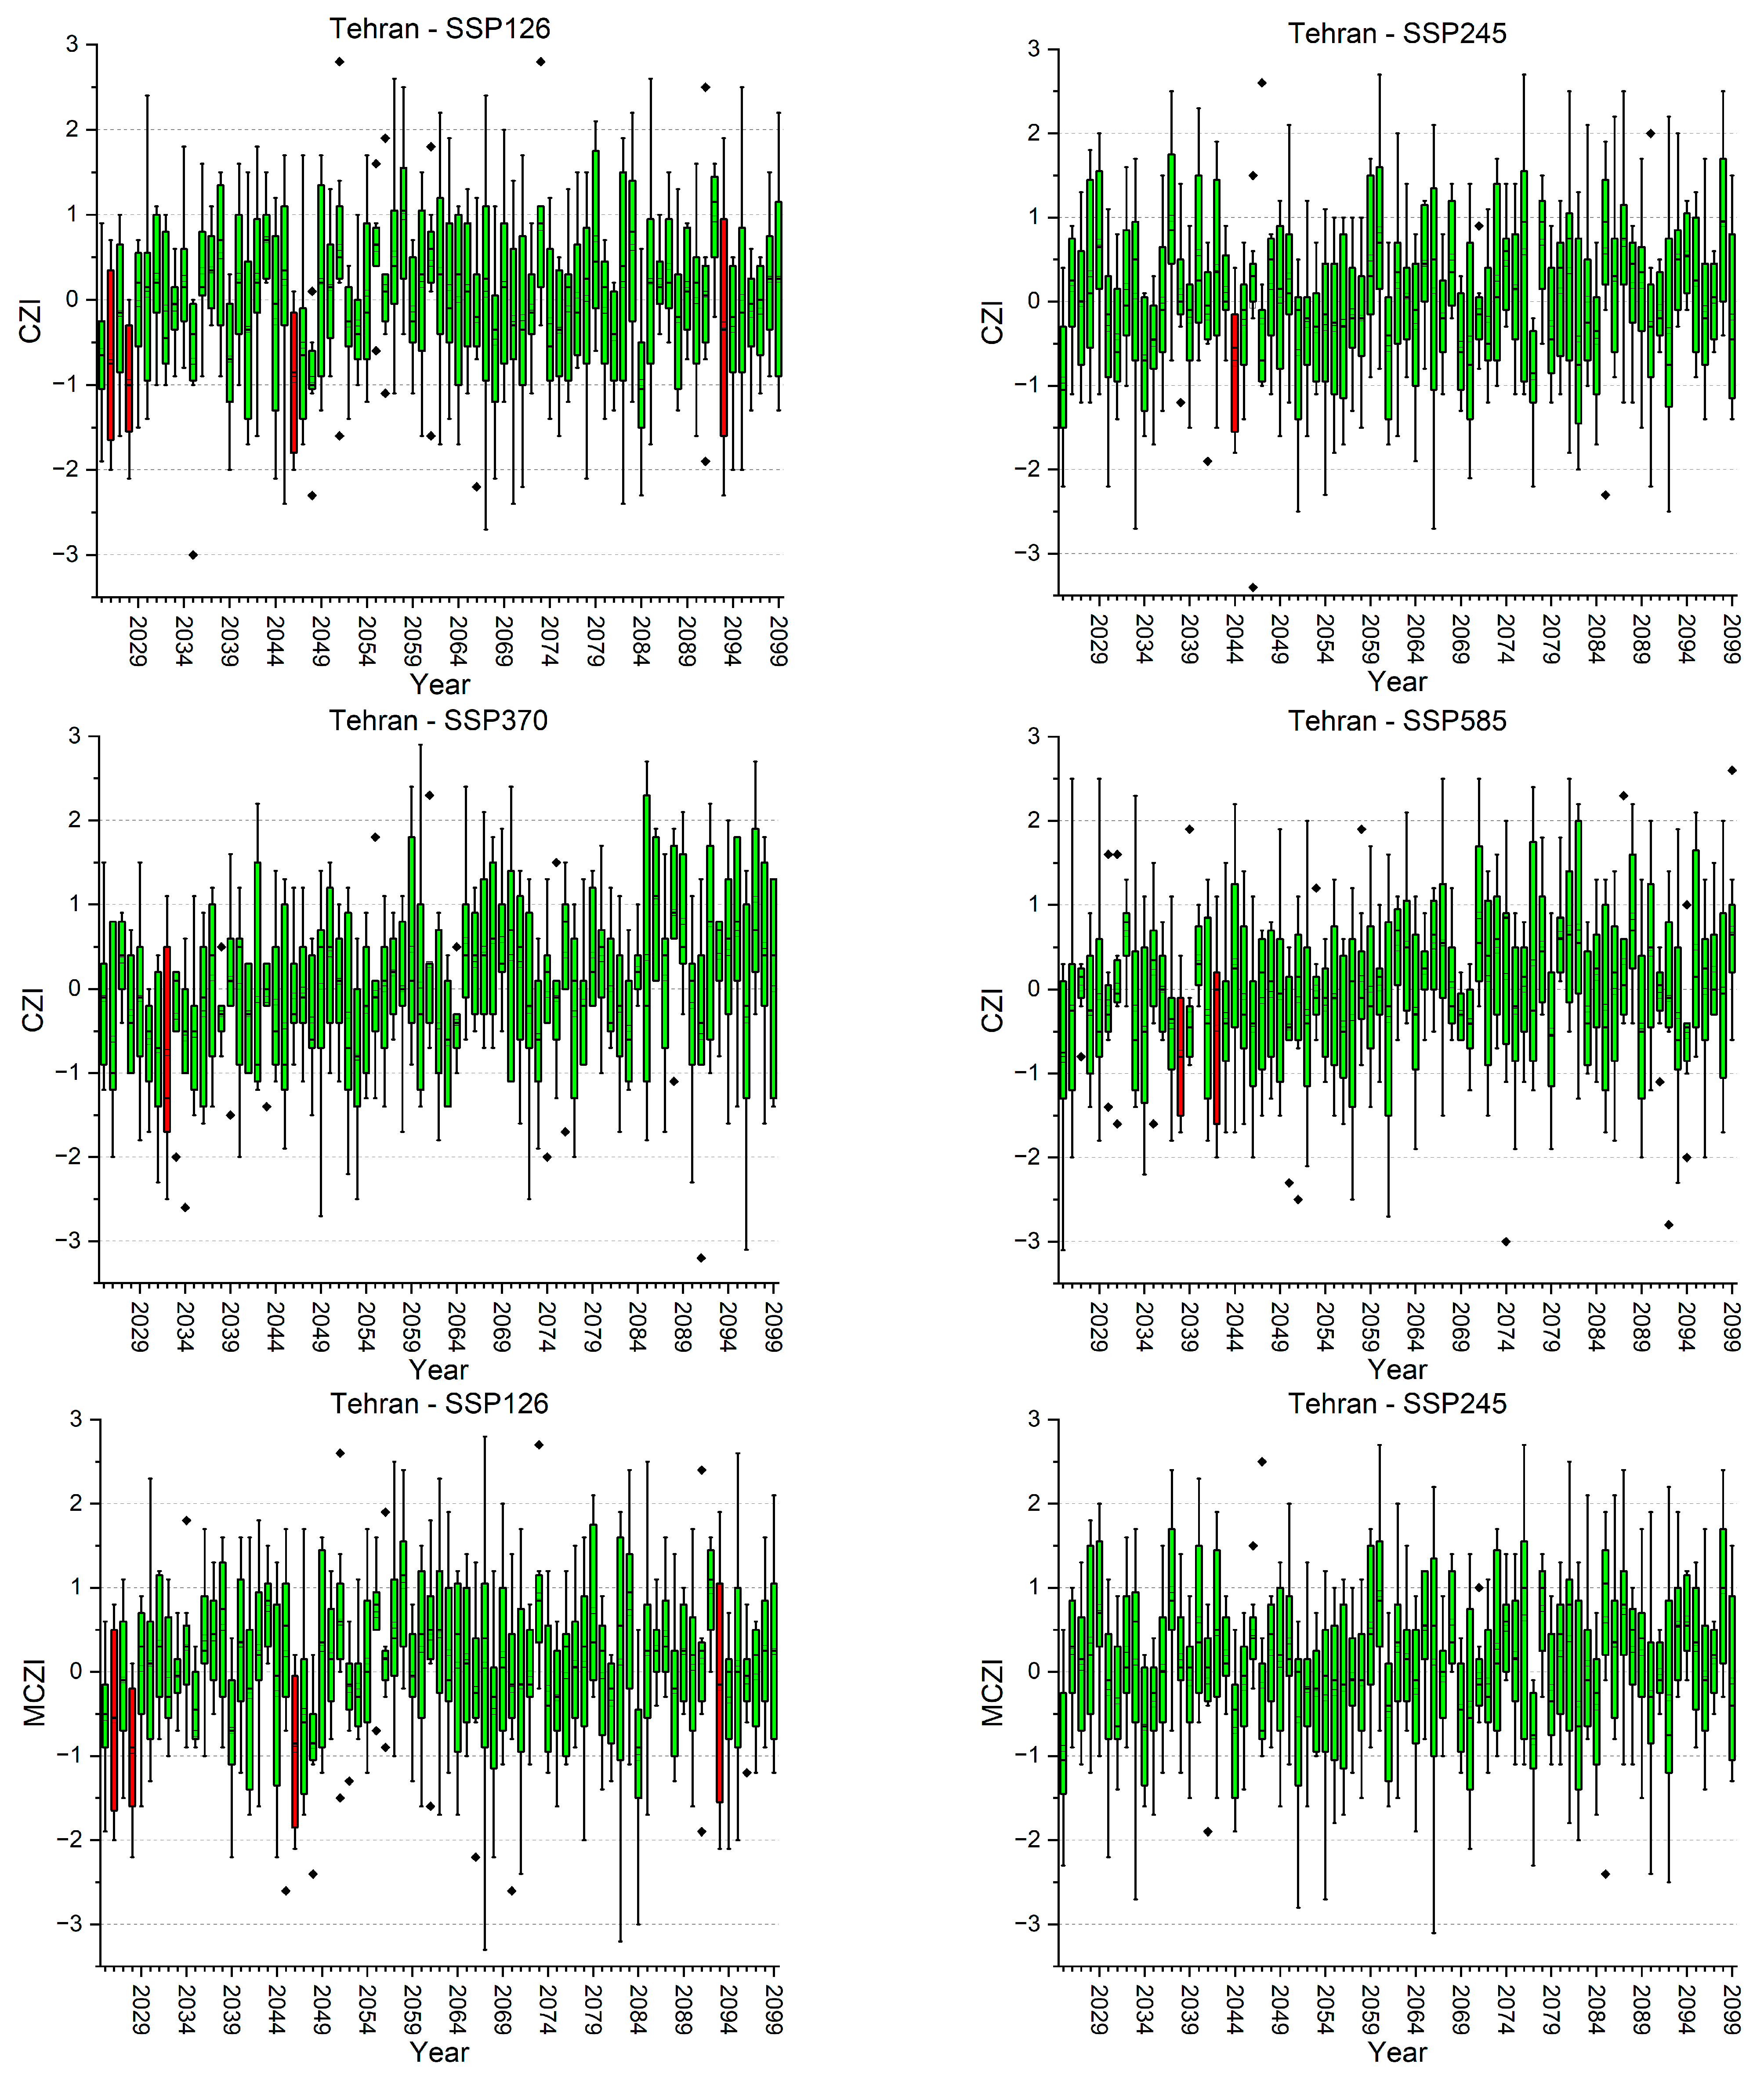
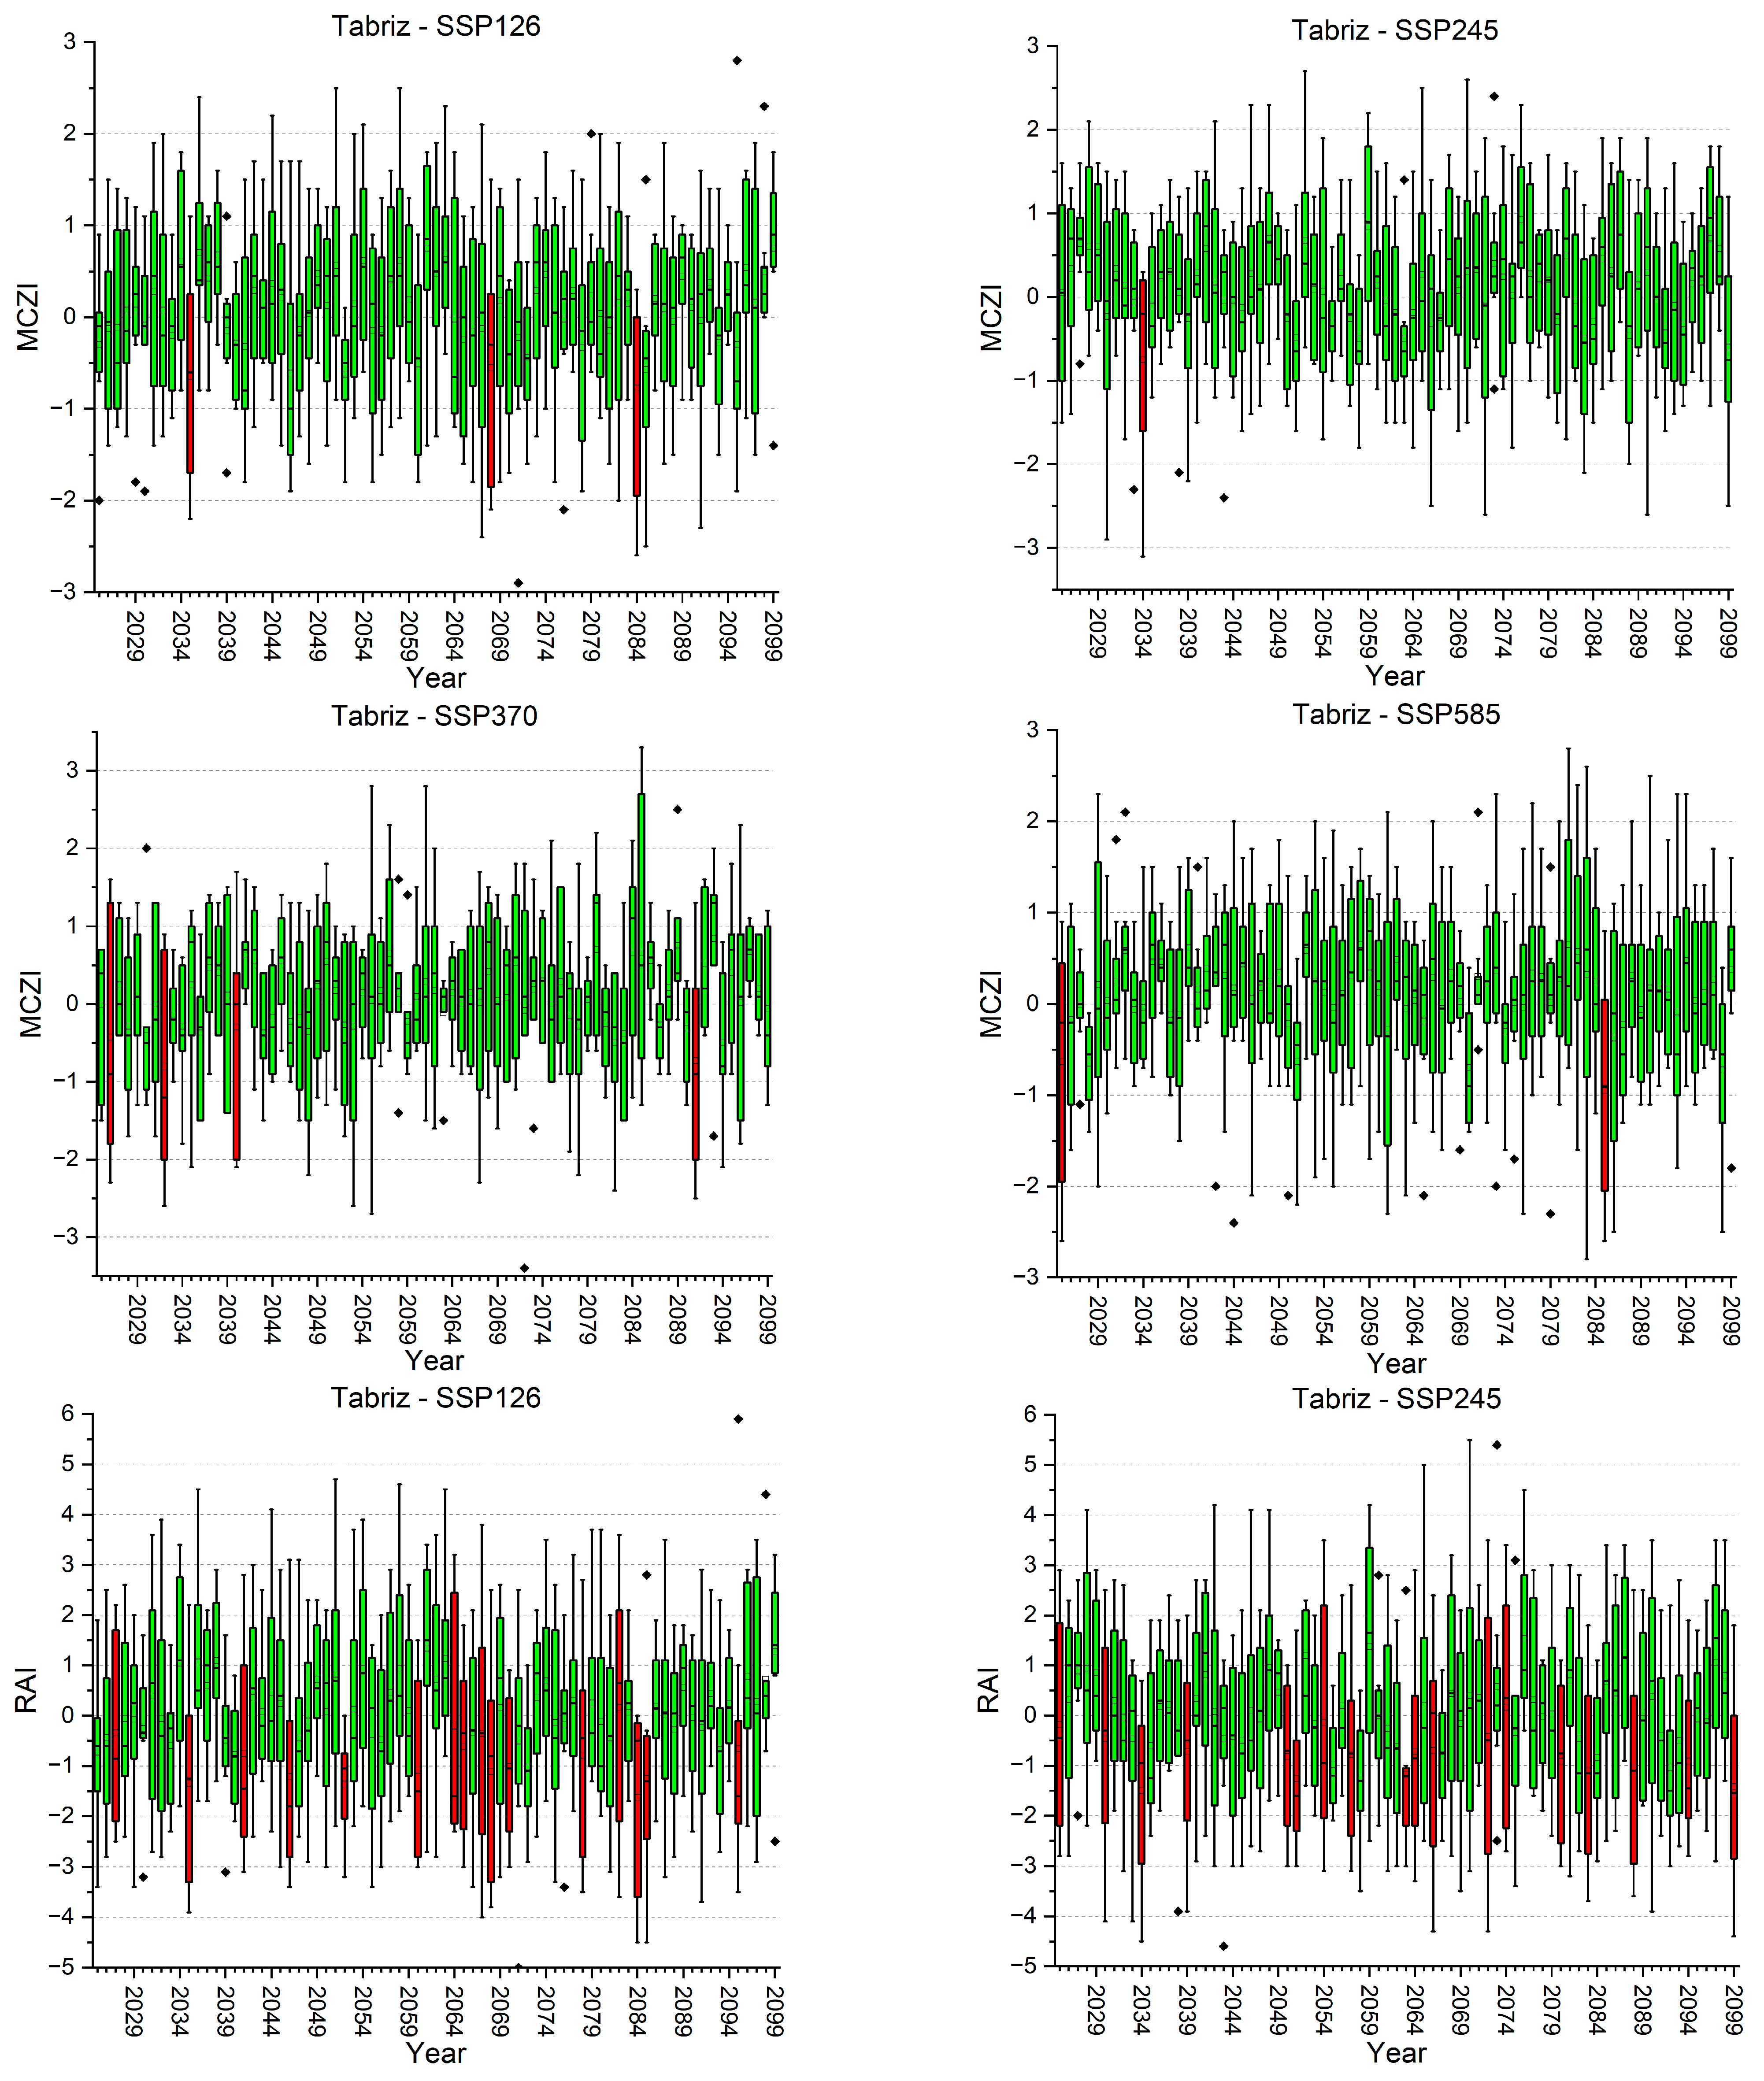
2.3.4. China Z-Index (CZI) and Modified China Z-Index (MCZI)

The CZI index is based on the Wilson–Hilferty cube root transformation, a method introduced by Wilson and Hilferty (1931) [43]. Assuming that the precipitation follows the Pearson Type III distribution, the following equations compute the CZI.
σ = 1 n   i = 1 n ( x i x ¯ ) 2
C s = i = 1 n ( x i x ¯ ) 2 n × σ 3
C Z I = 6 C s ( C s 2 Z S c o r e + 1 ) 1 3 6 C s + C s 6
where C s represents the coefficient of skewness and σ denotes the standard deviation derived from a set of n observations. The MCZI index is calculated similarly to the CZI, but it employs the median of the precipitation data instead of the mean for its calculation [39].

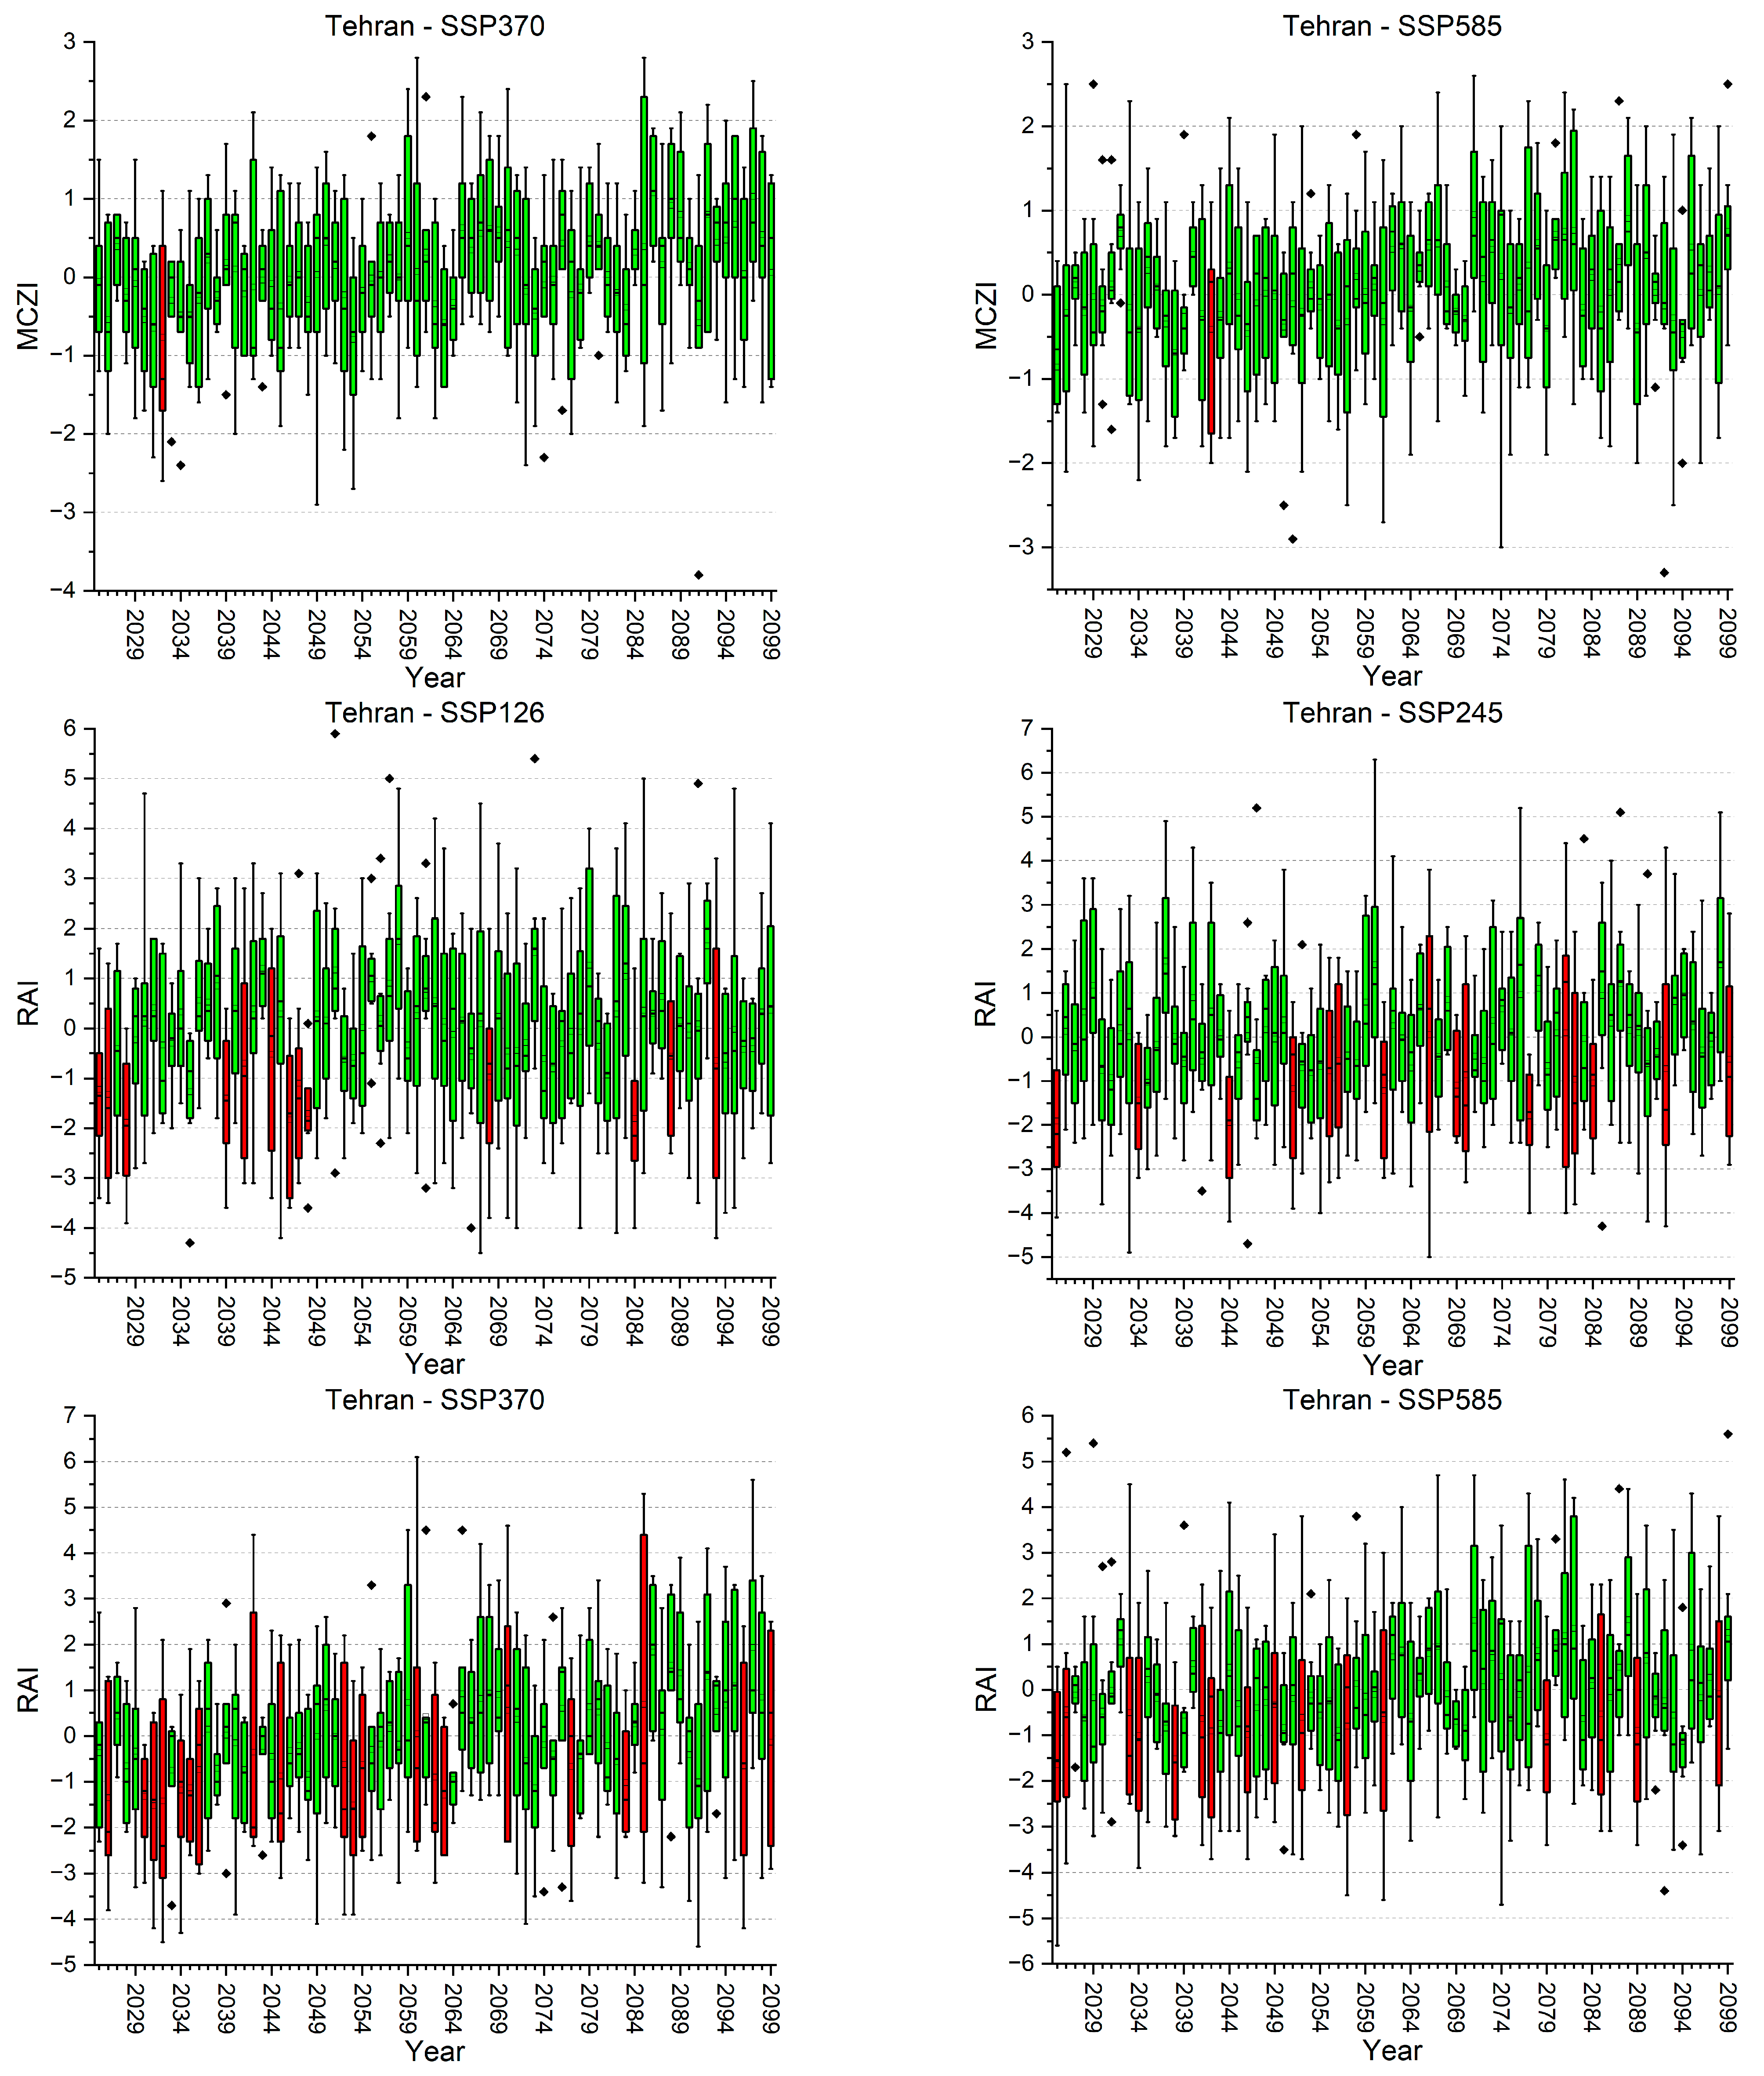
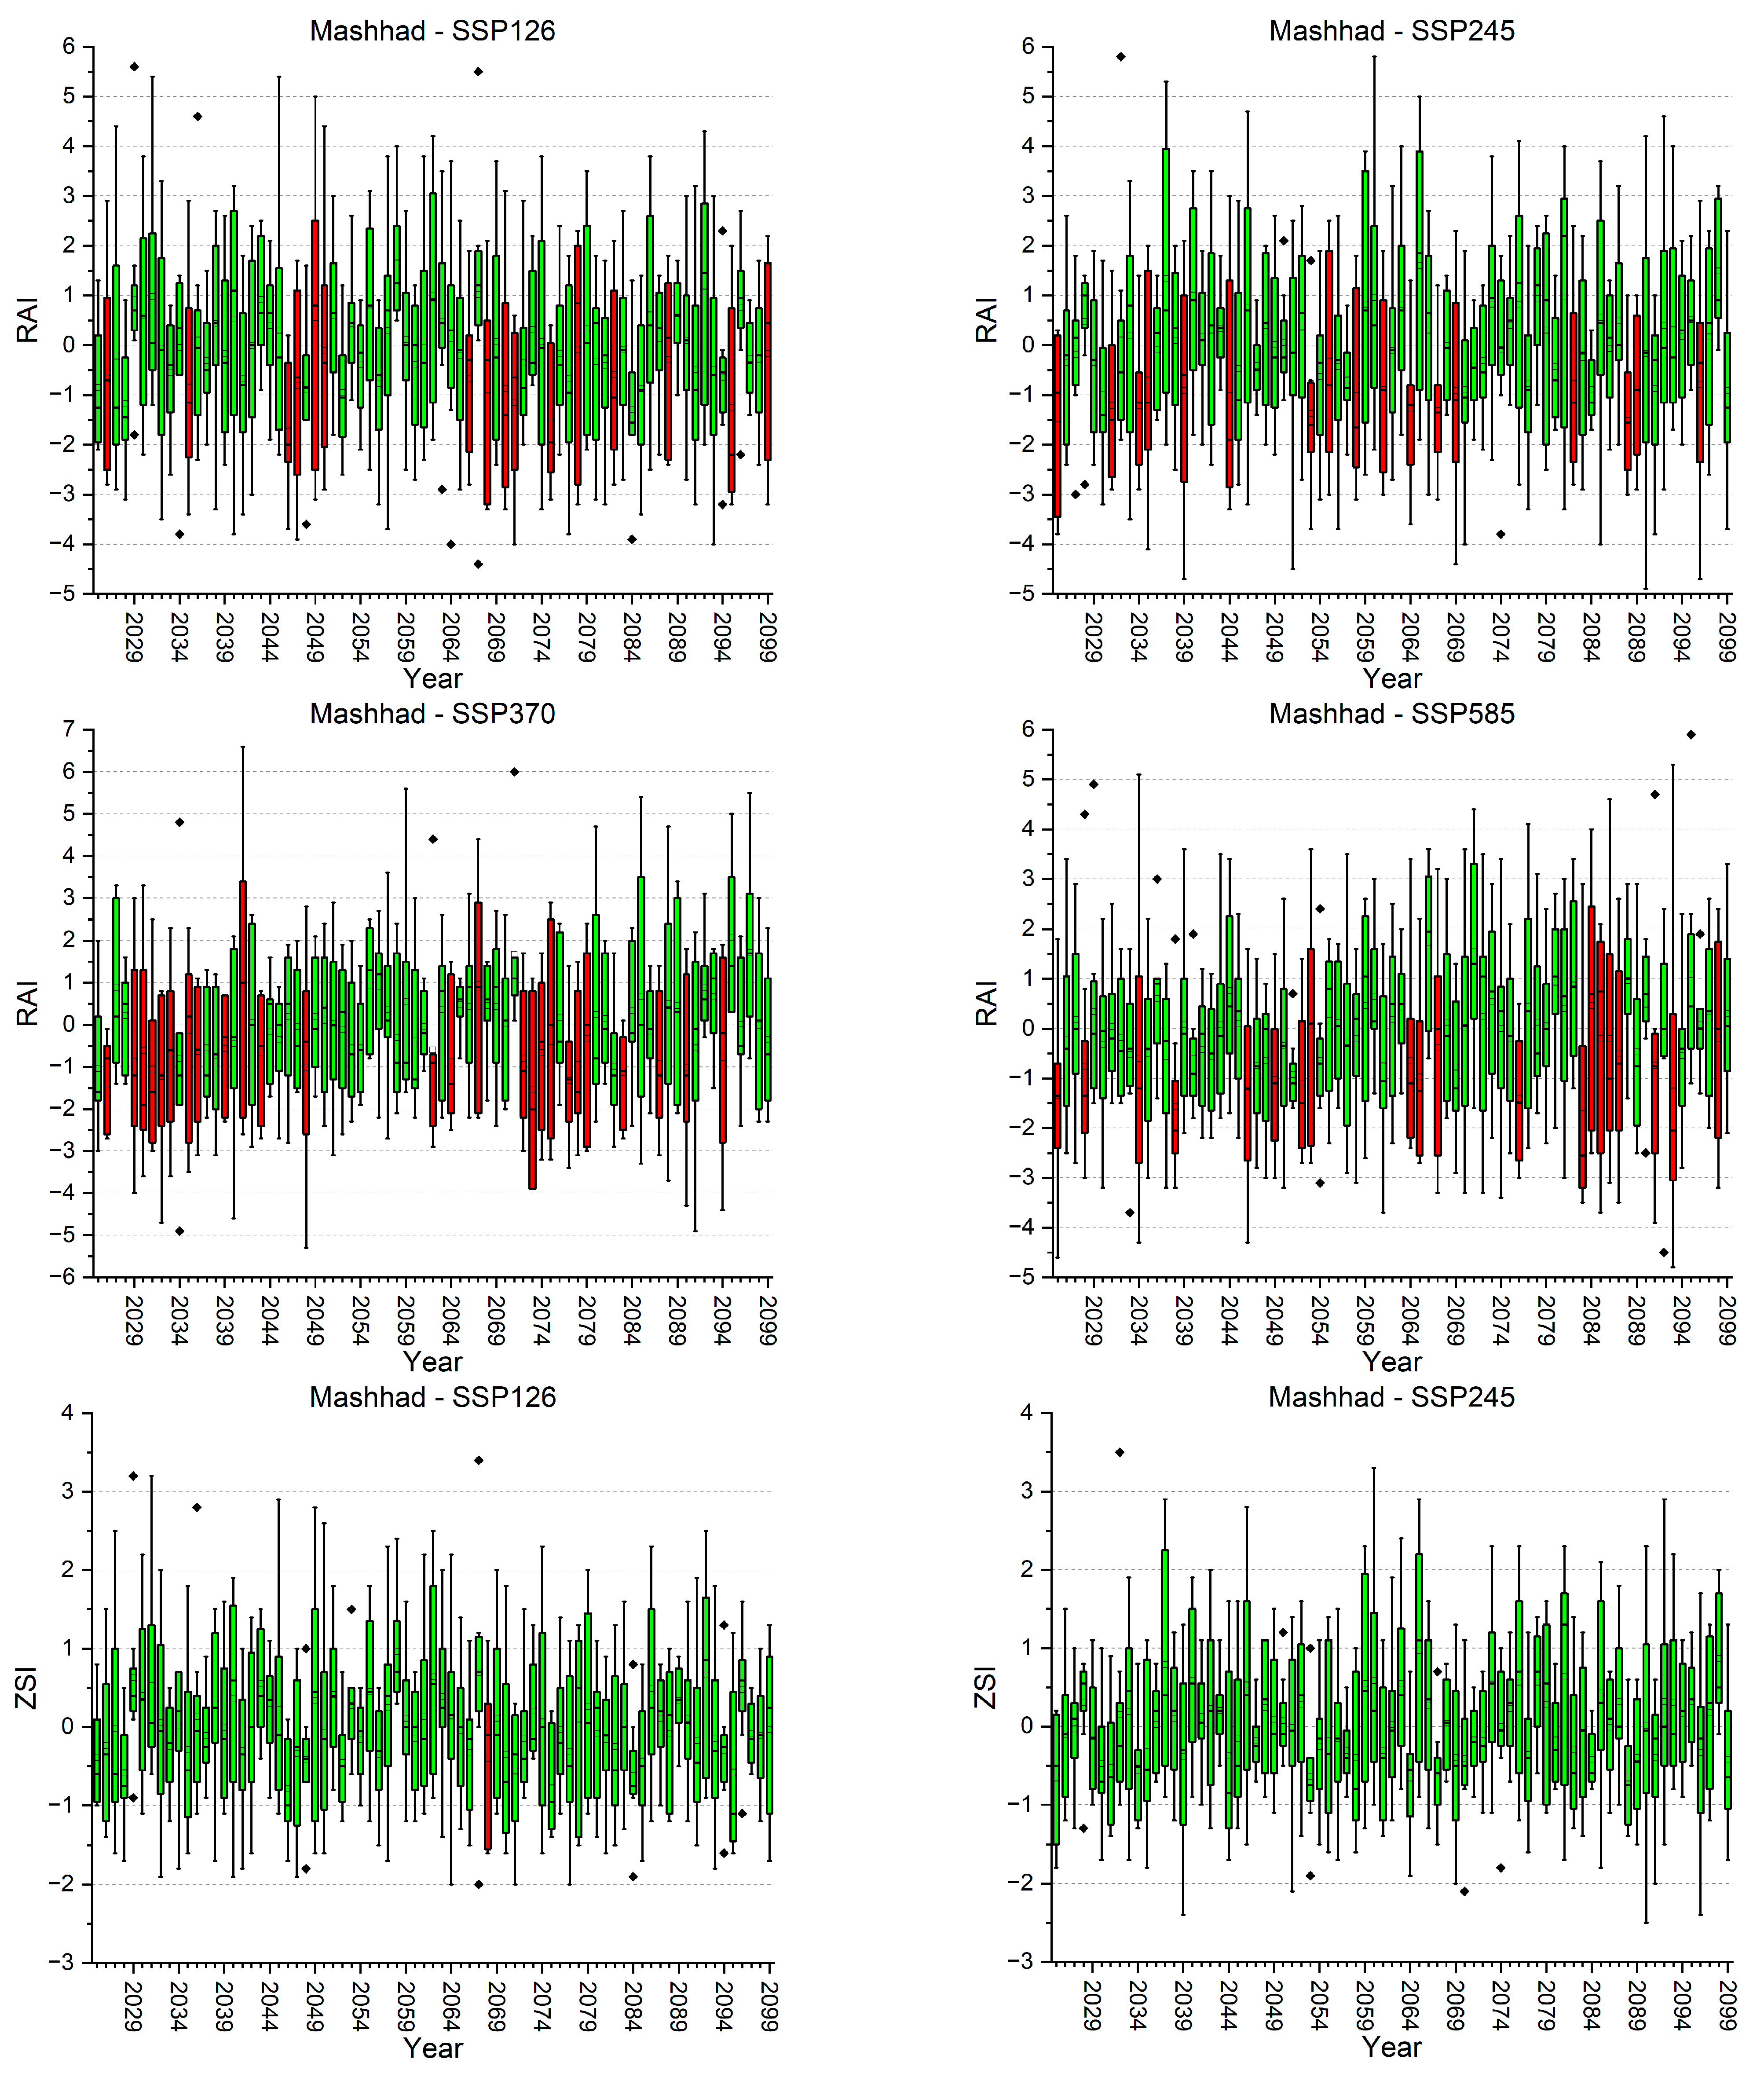
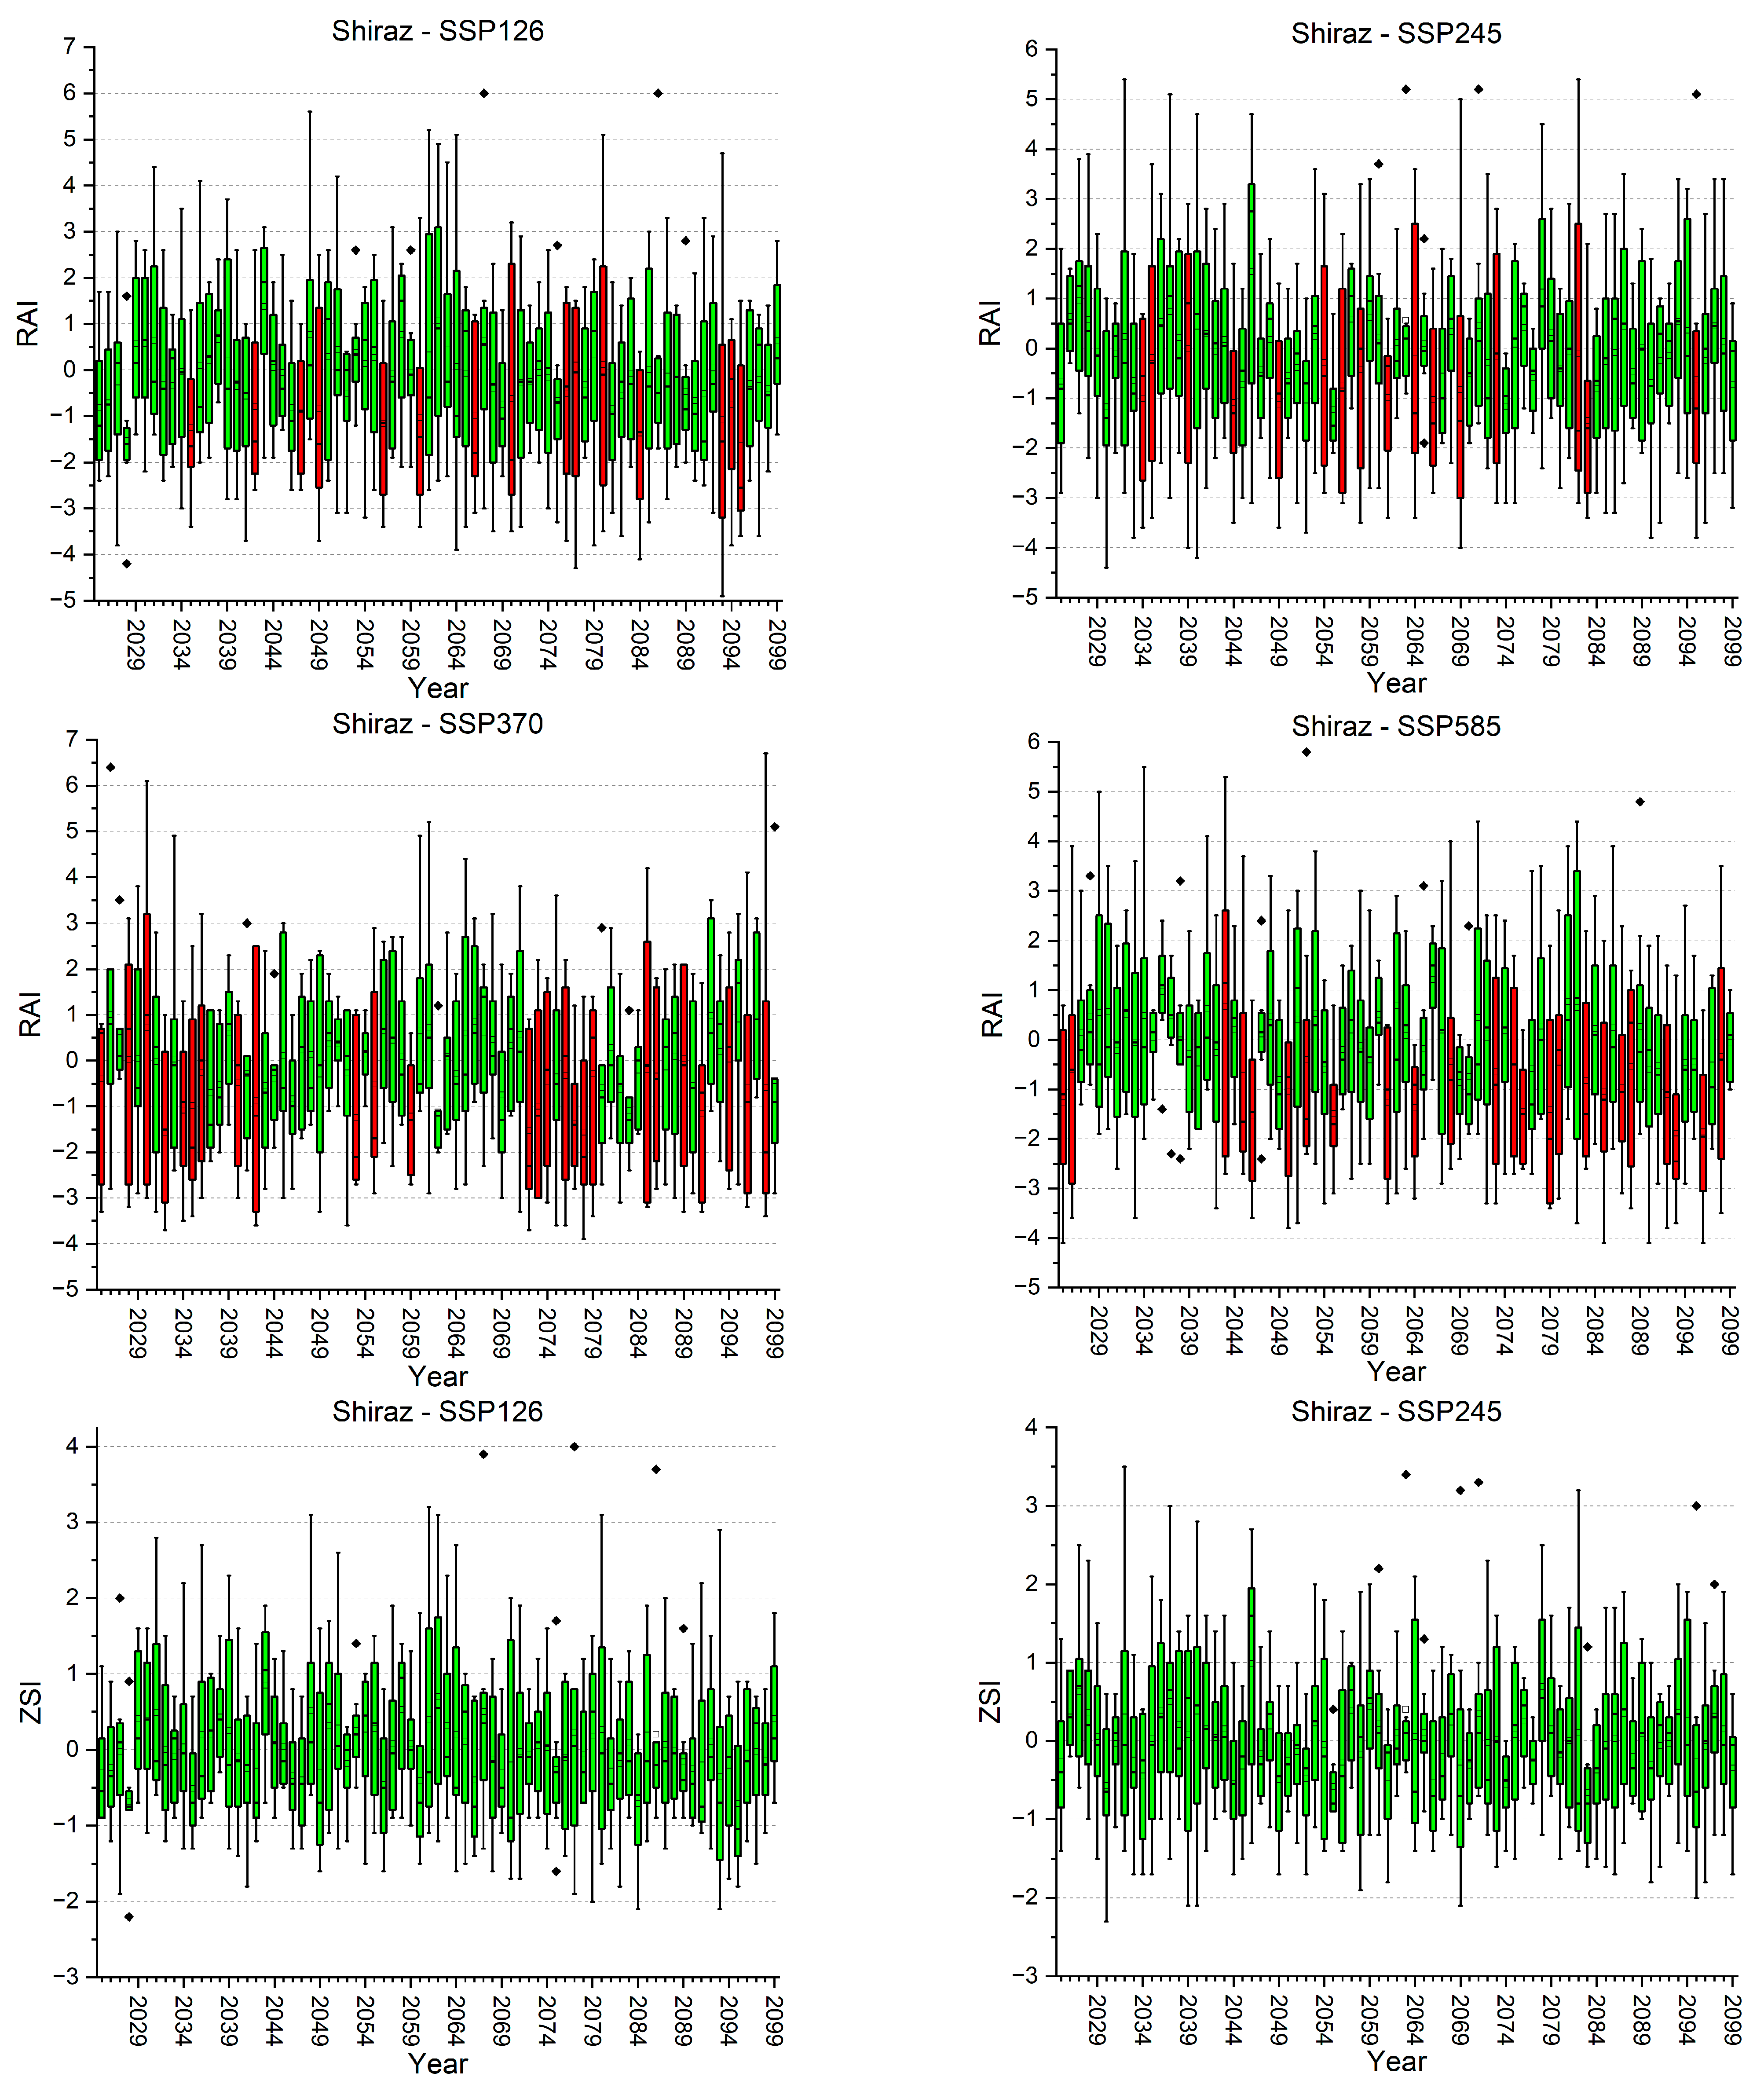
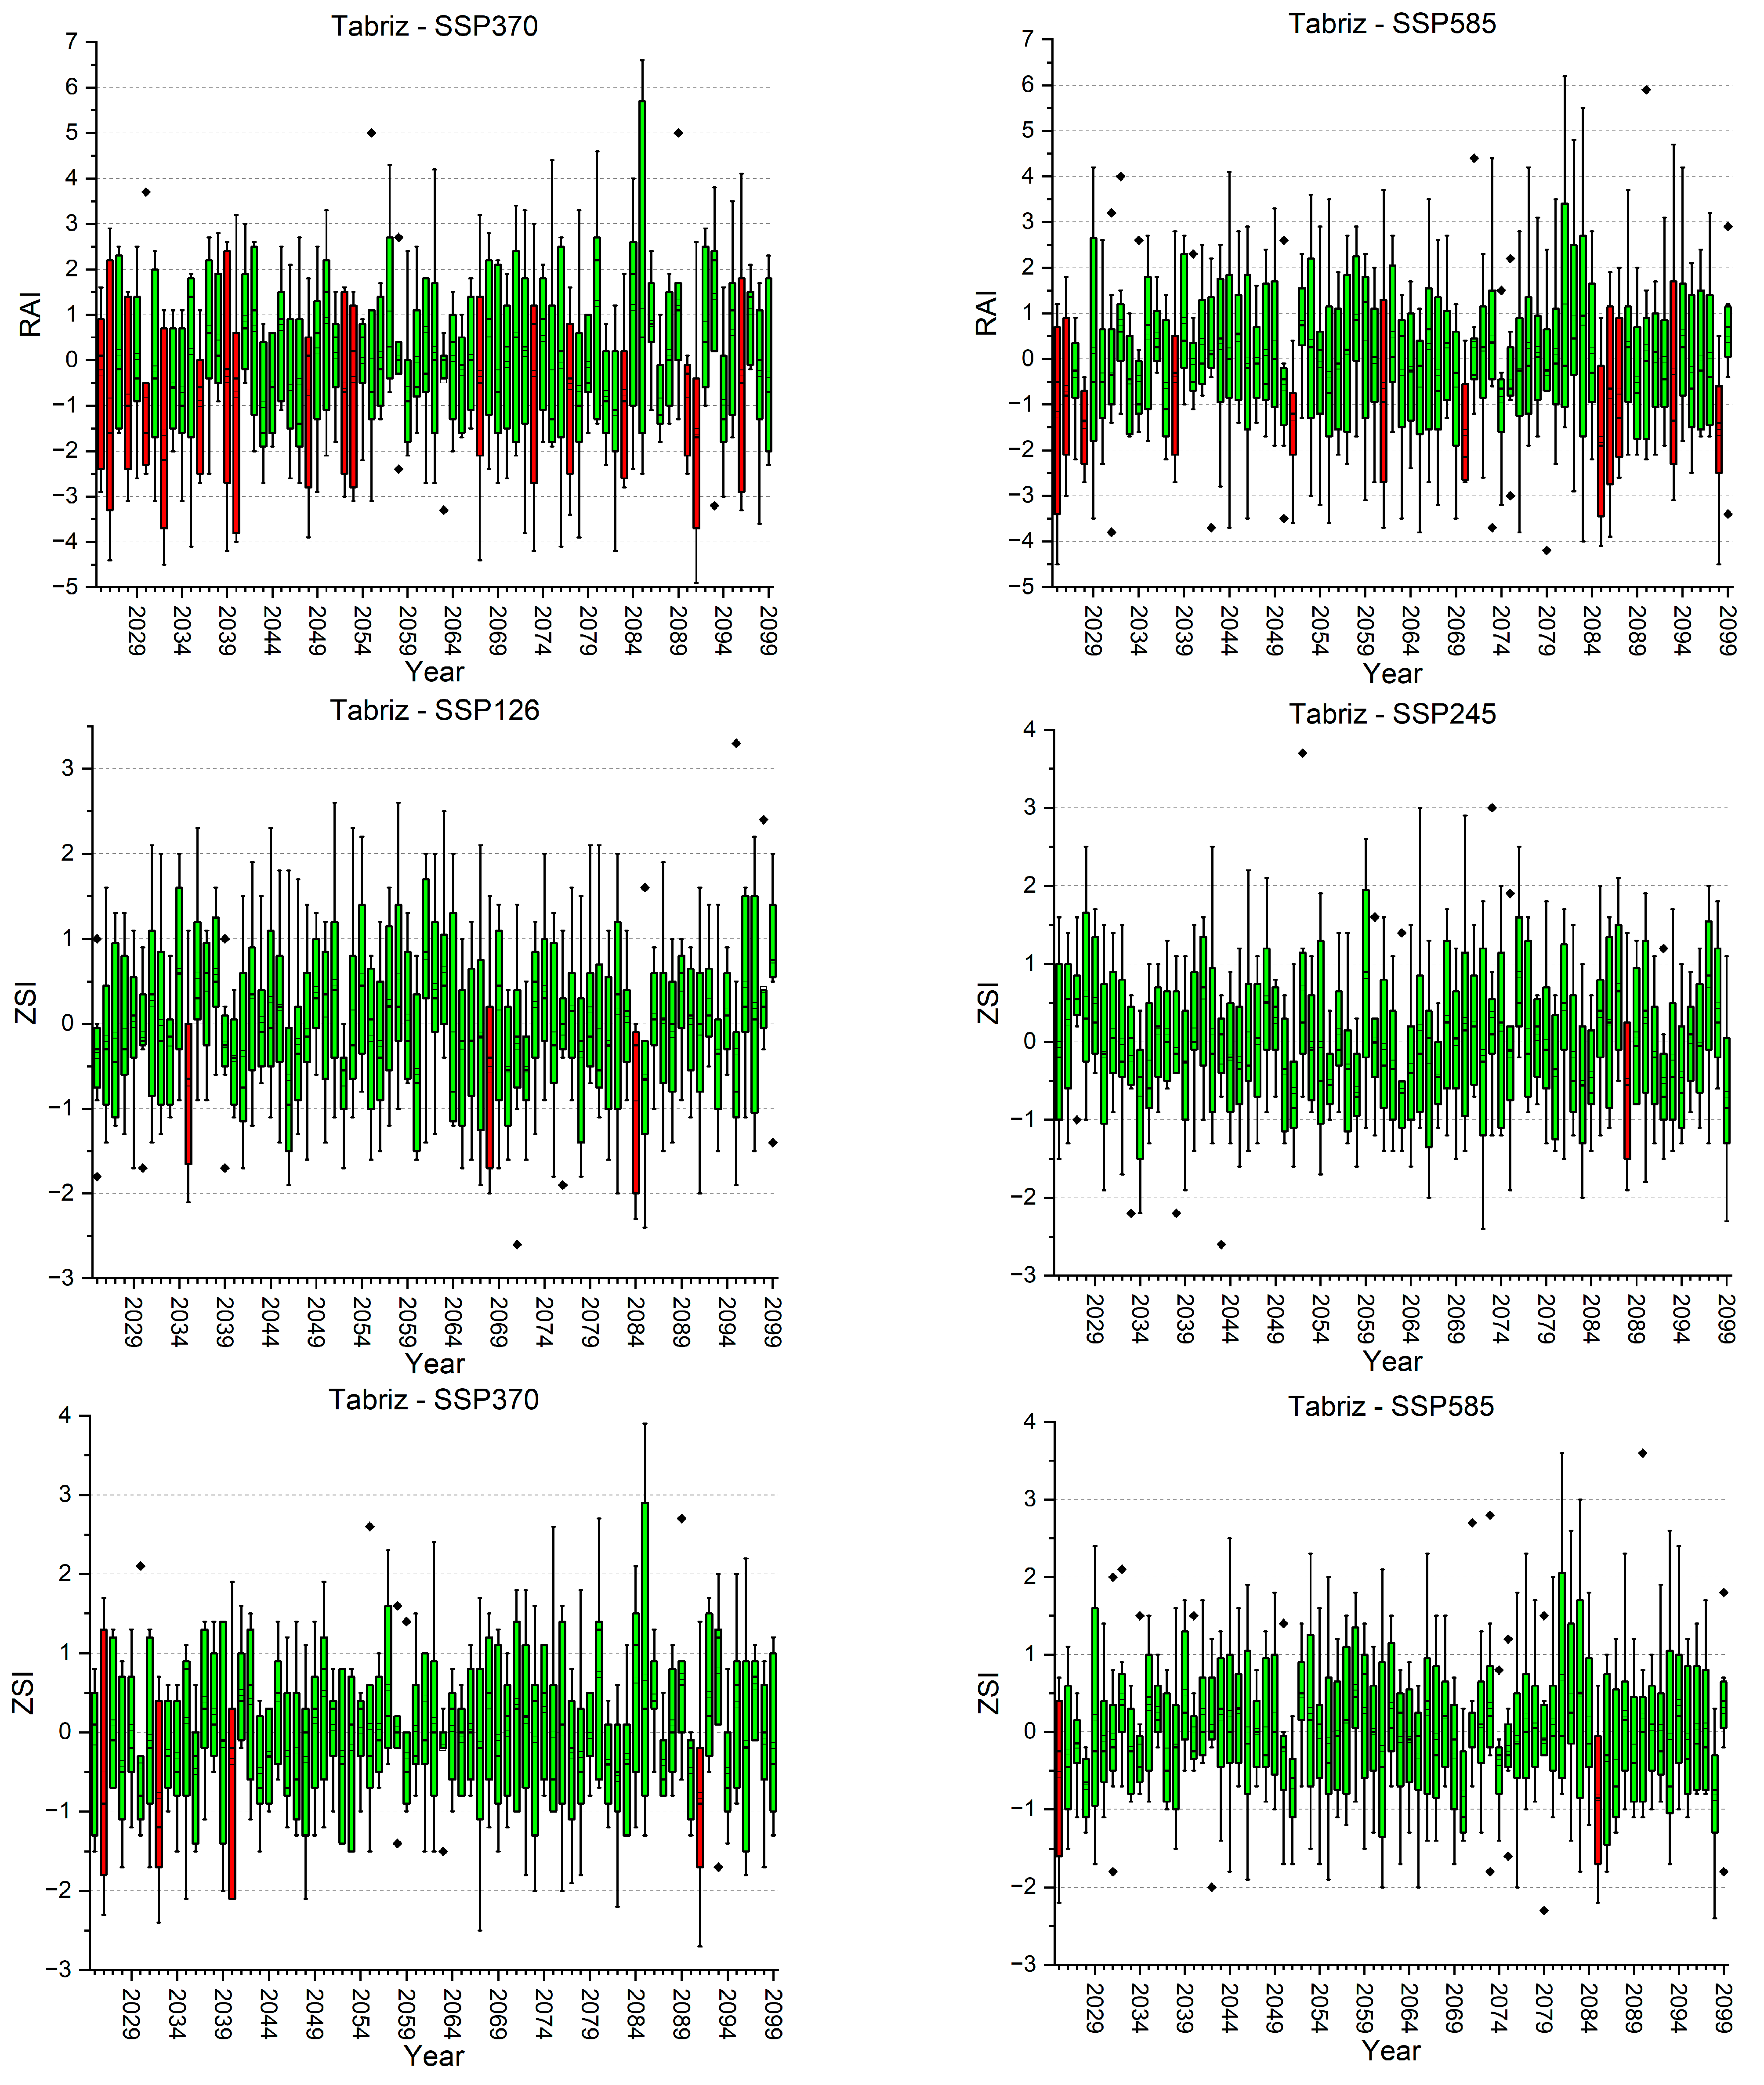
2.3.5. Rainfall Anomaly Index (RAI)

The RAI index was introduced by Van Rooy (1965) [44]. It functions as a ranking method to designate the extent of positive and negative precipitation, assigning values between +3 and −3. The RAI is computed by using the following equations:
R A I = 3 p p ¯ m ¯ p ¯
If p < p ¯ , then
R A I = 3 p p ¯ X ¯ p ¯
where p represents the individual precipitation values and p ¯ denotes the mean precipitation value. Additionally, m ¯ stands for the mean of the top ten maximum precipitation values and X ¯ signifies the mean of the bottom ten minimum precipitation values within the dataset.

2.3.6. Z-Score Index (ZSI)

The ZSI index offers a direct method for drought assessment, differing from techniques that entail converting precipitation data into distributions such as Pearson Type III or Gamma distribution [39]. Its calculation involves a straightforward equation, contributing to its user-friendly and accessible nature. The index is derived from the following equation:
Z S I = ( x x ¯ ) σ
where X represents the observed precipitation value, x ¯ signifies the long-term mean of precipitation, and σ denotes the standard deviation of precipitation.

2.4. Statistical Methods

2.4.1. Mann–Kendall (M-K) Trend Analysis

The M-K trend test, developed by Mann (1945) [45] and Kendall (1975) [46], is a non-parametric method that holds applicability across various data distributions. This test discerns the presence of a monotonic trend (whether it ascends or descends) within a dataset across time [47]. The M-K method stands out for its independence from specific data probability distributions, exhibiting robustness against outliers or skewed distributions [48,49]. This resilience to outliers renders it a prevalent choice in the analysis of hydrometeorological time series data. For a given time series {Xi, i = 1, 2, …, n}, the null hypothesis H0 assumes it is independently distributed, and the alternative hypothesis H1 is that there exists a monotonic trend. The test statistic S is given by the following:
S = i = 1 n 1 j = i + 1 n s g n ( x j x i )
where Xi and Xj are the values of sequence i and j and n is the length of the time series. Assuming ( x j x i ) = θ , the value of sgn( θ ) and the variance are computed as follows:
s g n θ = + 1     i f   θ > 0 0     i f   θ = 0 1     i f   θ < 0
v a r s = n n 1 2 n + 5 i = 1 m T i i ( i 1 ) ( 2 i + 5 ) 18
where Ti is the number of data in the tied group and m is the number of groups of tied ranks. The standardized test statistic Z is computed by the following:
Z = S 1 v a r ( S )     i f   S > 0 0     i f   S = 0 S + 1 v a r ( S )     i f   S < 0
Positive Z values signify increasing trends, while negative Z values indicate decreasing trends. The assessment of trends occurs at a designated α significance level. When |Z|>| Z 1 α 2 | (for the two-tailed test) or |Z|>| Z 1 α | (for the one-tailed test), the null hypothesis is rejected, signifying a statistically significant trend within the time series. In this study, the null hypothesis was tested at a 95% confidence level, adhering to the standard significance level used in many statistical evaluations [50,51].

2.4.2. Nash–Sutcliffe (NS) and Modified Nash–Sutcliffe (MNS) Models Efficiency Coefficient

The NS is a normalized statistic that determines the relative magnitude of the residual variance (‘noise’) compared to the measured data variance (‘information’) [52]. The NS indicates how well the plot of the observed versus simulated data fits the 1:1 line (Equation (14)). On the other hand, the MNS offers a heightened sensitivity in identifying substantial over- or under-predictions compared to the standard square form of the NS. This modification becomes particularly relevant when j equals 1, markedly mitigating the overestimation of the peak values [53]. This methodological adjustment stands pivotal in refining our understanding of the predictive accuracy, especially in situations where the forecasting is complicated and the models have high uncertainties. A more detailed and accurate way to evaluate the model is achieved by leveraging the parameter j within the MNS formulation, enabling a more precise assessment of the model performance (Equation (15)).
N S = 1 i ( y i y ^ i ) 2 i ( y i y ¯ ) 2
M N S = 1 i y i y ^ i j i y i y ¯ j
where yi and y ^ are the observed and simulated variables, respectively; the bar indicates the average, and i is the ith measured or simulated value. The NS and MNS functions exhibit a continuum spanning from negative infinity to 1, where a score of 1 signifies an exact correspondence between the simulated and observed data. Values within the range of 0 to 1 denote the proximity between simulated and observed values, while scores below 0 indicate a lack of predictive capacity within the model [54].

3. Results and Discussion

Iran, as the Middle East’s foremost emitter and the world’s seventh-largest contributor of greenhouse gases, owes its significant emissions to the substantial production and consumption of oil and gas, coupled with rapid urbanization [55]. Figure 3 illustrates the historical trends in the average temperature and precipitation across Iran’s metropolitan areas, providing clear evidence of the country’s susceptibility to climate change. This climatic shift has caused a dramatic decrease in the water levels of dams essential for the supply of water in Iran, a significant depletion of underground aquifers, and the consequential land subsidence and soil erosion, all of which are exacerbated by the over-extraction of groundwater amidst persistent and severe drought conditions. The figure demonstrates a steady increase in average temperatures across all cities, signaling a universal warming trend. However, precipitation patterns were more variable, with no clear uniform trend emerging across the dataset. To facilitate a nuanced analysis of these climatic trends, the M-K trend test was applied. The test was employed to ascertain the presence and significance of trends in the average temperature and precipitation data for each city.
The results derived from the application of the M-K test are presented in Table 3. The statistical evidence provided by the test further substantiates the visual trends observed in the figures, thus offering a comprehensive view of the climatic trends that are shaping the environment of these significant Iranian urban centers. According to Table 3, at a 95% confidence interval, all cities exhibited positive Z values, indicating a clear upward trend in temperatures, consistent with the general expectations of global warming patterns. In contrast, the precipitation data presented a more complex picture. At the same 95% confidence interval, only the city of Tabriz demonstrated a statistically significant trend, which was a decrease in precipitation. This downward trend aligns with concerns over increased aridity and water scarcity issues in the region. However, when considering confidence intervals other than 95%, the Z values suggested varied trends for precipitation in other cities. Specifically, Tehran and Isfahan showed upward trends in precipitation, whereas Mashhad, Karaj, and Shiraz exhibited downward trends. These mixed results indicate that precipitation patterns are less consistent than temperature trends and may be influenced by a range of local and regional factors, such as geography, urban development, and atmospheric conditions.
In the subsequent phase of this study, a meticulous comparison was carried out between the observed climatic data and the daily simulations generated by the GCMs. This step was crucial to determine the precision with which these models could replicate the real-world trends of average temperature and precipitation in the cities under study. The core objective of this comparison was to identify the GCMs that were most successful in mirroring the observed climatic patterns. To evaluate the accuracy of the models’ simulations against the actual observed data, the NS efficiency was employed, as defined in Equation (14). Given the notable uncertainties that typically accompany precipitation simulations, a more robust metric, the MNS efficiency, was utilized with the parameter j set to 1, in accordance with Equation (15). The results of this extensive comparison are presented in Table 4. The table employs a color-coded system to simplify the interpretation of the NS and MNS efficiency values. The values that indicate a higher efficiency are marked in green, denoting a strong correlation with the observed data. The moderate values are indicated in yellow, and the lower values, suggesting a weaker correlation, are in red. Among the entire suite of 35 GCMs examined, several demonstrated a particularly high degree of accuracy. The models that were most consistent with the observed data for both precipitation and average temperature trends across the cities were ACCESS-ESM1-5, CNRM-CM6-1, CNRM-ESM2-1, GISS-E2-1-G, IPSL-CM6A-LR, KIOST-ESM, MIROC-ES2L, and MRI-ESM2-0. These models distinguished themselves as the most reliable and were thus selected for use in future climate projections within the context of this research. The other models, which did not perform as well, were excluded from further analysis. This rigorous process of model selection is designed to ensure that subsequent climate forecasts are built upon a solid and credible base of empirical accuracy. In the body of existing research, other researchers have applied identical GCMs as those utilized in this study to explore various global regions [56,57,58,59,60,61,62,63].
In the next step, this research advanced to the stage of projecting future climate conditions. Projections were made for the average temperature and precipitation using the selected GCMs, under the SSP126, SSP245, SSP370, and SSP585 scenarios. The projections were aimed at understanding potential future severe drought conditions. To assess the drought conditions, the SPI, DI, PN, CZI, MCZI, RAI, and ZSI indices were used. Each index offers a different perspective on the drought conditions, using a combination of average temperature and precipitation. Drought index values were computed for each city using each GCM, scenario, and future year, covering a timeline from 2025 to 2100. This extensive analysis resulted in the creation of a large dataset, comprising 1800 tables that provide a detailed view of potential drought conditions. Table 5 is highlighted as a representative example. It illustrates the calculated drought index values for the city of Tehran for the year 2050, based on simulations from the eight selected GCMs under the SSP585 scenario.
The complexity of the raw climate data, particularly when dealing with large datasets spanning multiple GCMs and scenarios, requires effective methods of interpretation and communication. Box plots are a statistical tool that can be effectively used to visualize the spread and central tendency of a dataset, making it more understandable for both technical and non-technical audiences [64]. In this study, box plots were used to distill the information from tables like Table 5. These visual representations are particularly useful in identifying the range of predictions for drought indices across different GCMs and scenarios. Figure 4 specifically showcases these box plots for Tehran. The plots summarize the range of RAI drought index values projected from 2025 to 2100 across the four SSP scenarios. Each bar within the box plot ensemble represents the spread of the RAI values for a given time period, obtained from the eight selected GCMs. These bars summarize eight data points into an easily digestible format, indicating the median, quartiles, and potential outliers of the dataset. The use of red shading on the bars that extend into the very dry to extremely dry categories (as defined in Table 2) shows the periods of an increased risk of severe drought conditions. This visual cue simplifies the detection of concerning trends within the dataset without the need to delve into the complex numerical data. The analysis findings revealed variations in the sensitivity of the seven drought indices in detecting severe drought conditions. More severe drought conditions were detected based on the RAI index, followed by the DI, CZI, SPI, CZI, MCZI, and PN. The generation of 168 graphs, one for each combination of city, drought index, and scenario, presented in Appendix A, offers a comprehensive visual database of the projected climate extremes.
Heatmaps are an excellent way to synthesize complex data into a coherent visual form that can quickly communicate key insights. They are particularly good at showing the density of events across two dimensions (e.g., the time and drought severity). To distill the data into more focused insights for individual cities, heatmap plots were derived from the underlying box plots (Figure 5). The methodology for generating these heatmaps involved counting how often the very dry to extremely dry conditions (represented by the red bars in the box plots) occurred each year across all the drought indices. This count was then represented as a color gradient in the heatmap, with the deeper shades of red indicating a higher likelihood of severe drought conditions. Taking Mashhad under the SSP585 scenario in the year 2083 as an example, if all seven drought indices are showing that the conditions are very dry to extremely dry, this would be depicted as a deep red cell in the heatmap for Mashhad for that year. This would signal to readers that there is a strong consensus among the indices that severe drought conditions are highly probable for Mashhad in 2083 under the SSP585 scenario. The heatmap not only shows the expected drought conditions for a single year but also allows readers to track changes and trends over time. The benefit of using a heatmap is that it can represent a large amount of data in a way that is quickly understandable [65]. It shows the density of severe drought predictions in a visually intuitive manner, where a quick scan of the color distribution can reveal years and periods with elevated risks.
According to Figure 5, the effects of climate change vary significantly from one city to another, underlining the fundamental influence of geographical location on climate change impacts. Factors such as latitude, elevation, and proximity to bodies of water, along with ocean currents, topography, vegetation, and land use practices, are pivotal in shaping the specific ways in which climate change manifests in different areas. These geographical elements not only influence the local climate conditions but also determine the extent and nature of the climate change effects, ranging from altered weather patterns and temperature shifts to changes in precipitation and extreme weather events.
The analysis of heatmaps across various SSPs reveals differing levels of drought risk for specific cities, which reflects how each scenario’s assumptions about greenhouse gas emissions and socioeconomic developments might impact regional climates differently. Based on the number of deeper red cells, the following is a breakdown of what each scenario indicates for the metropolises in Iran:
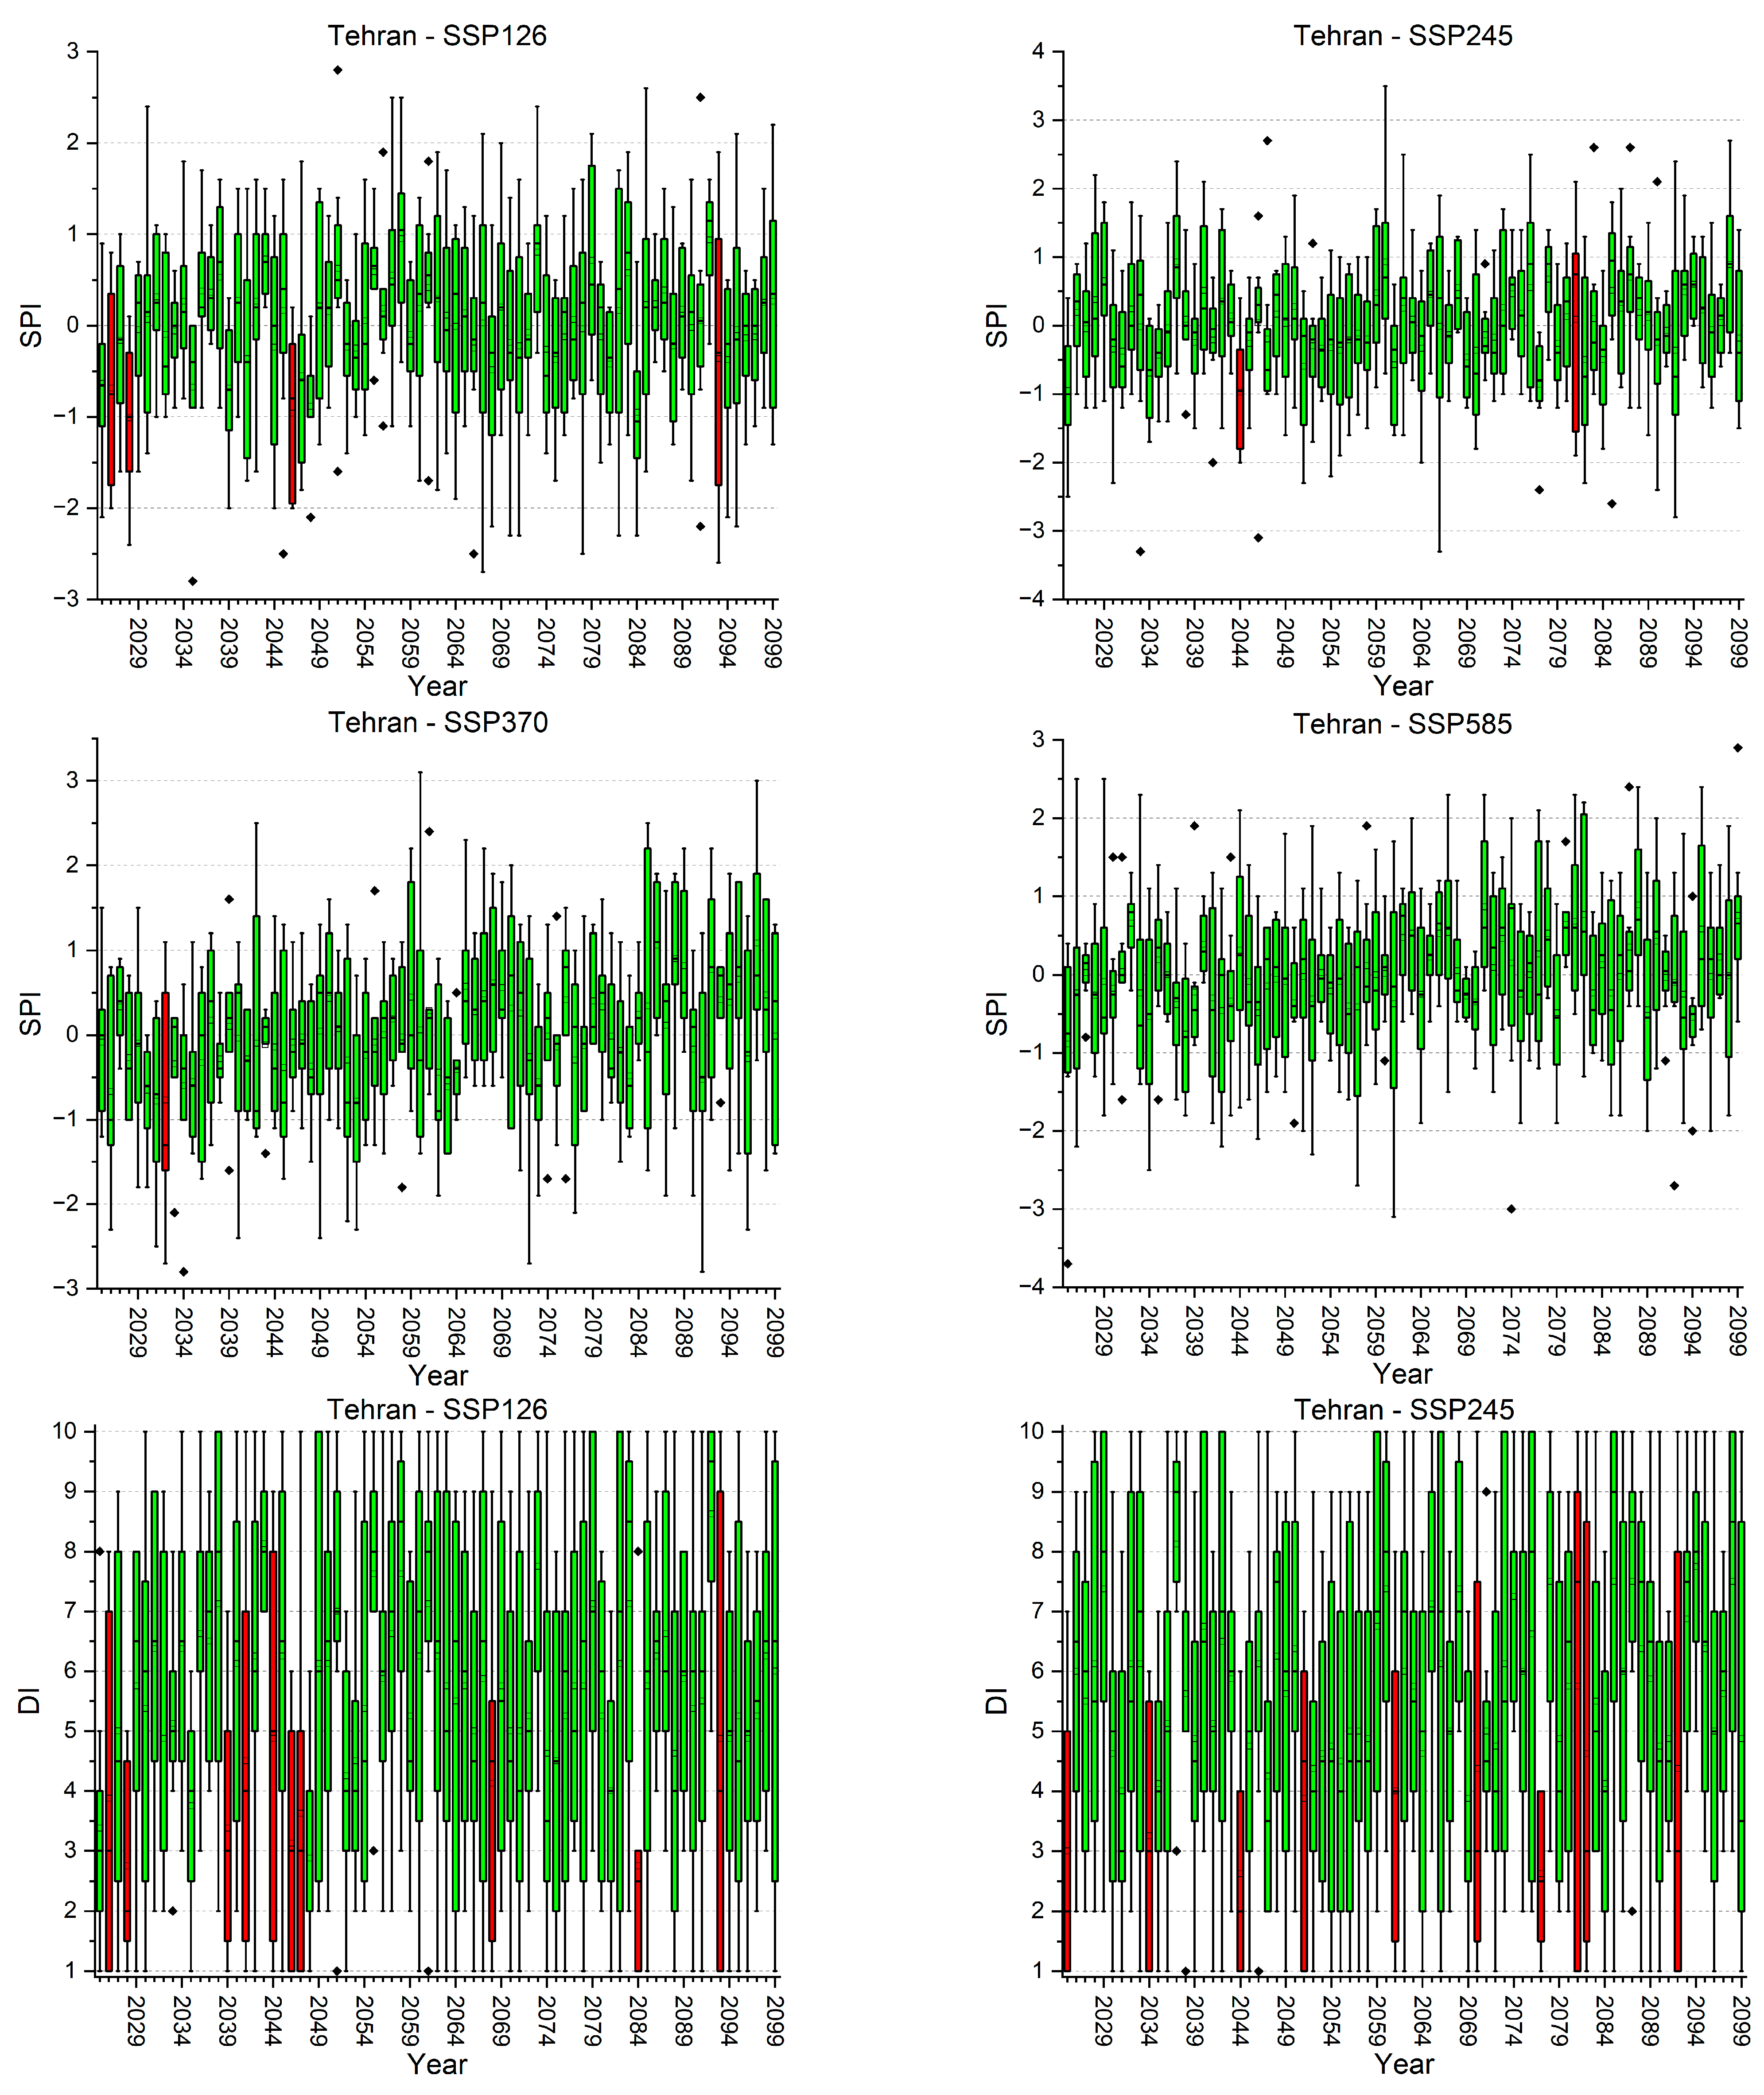
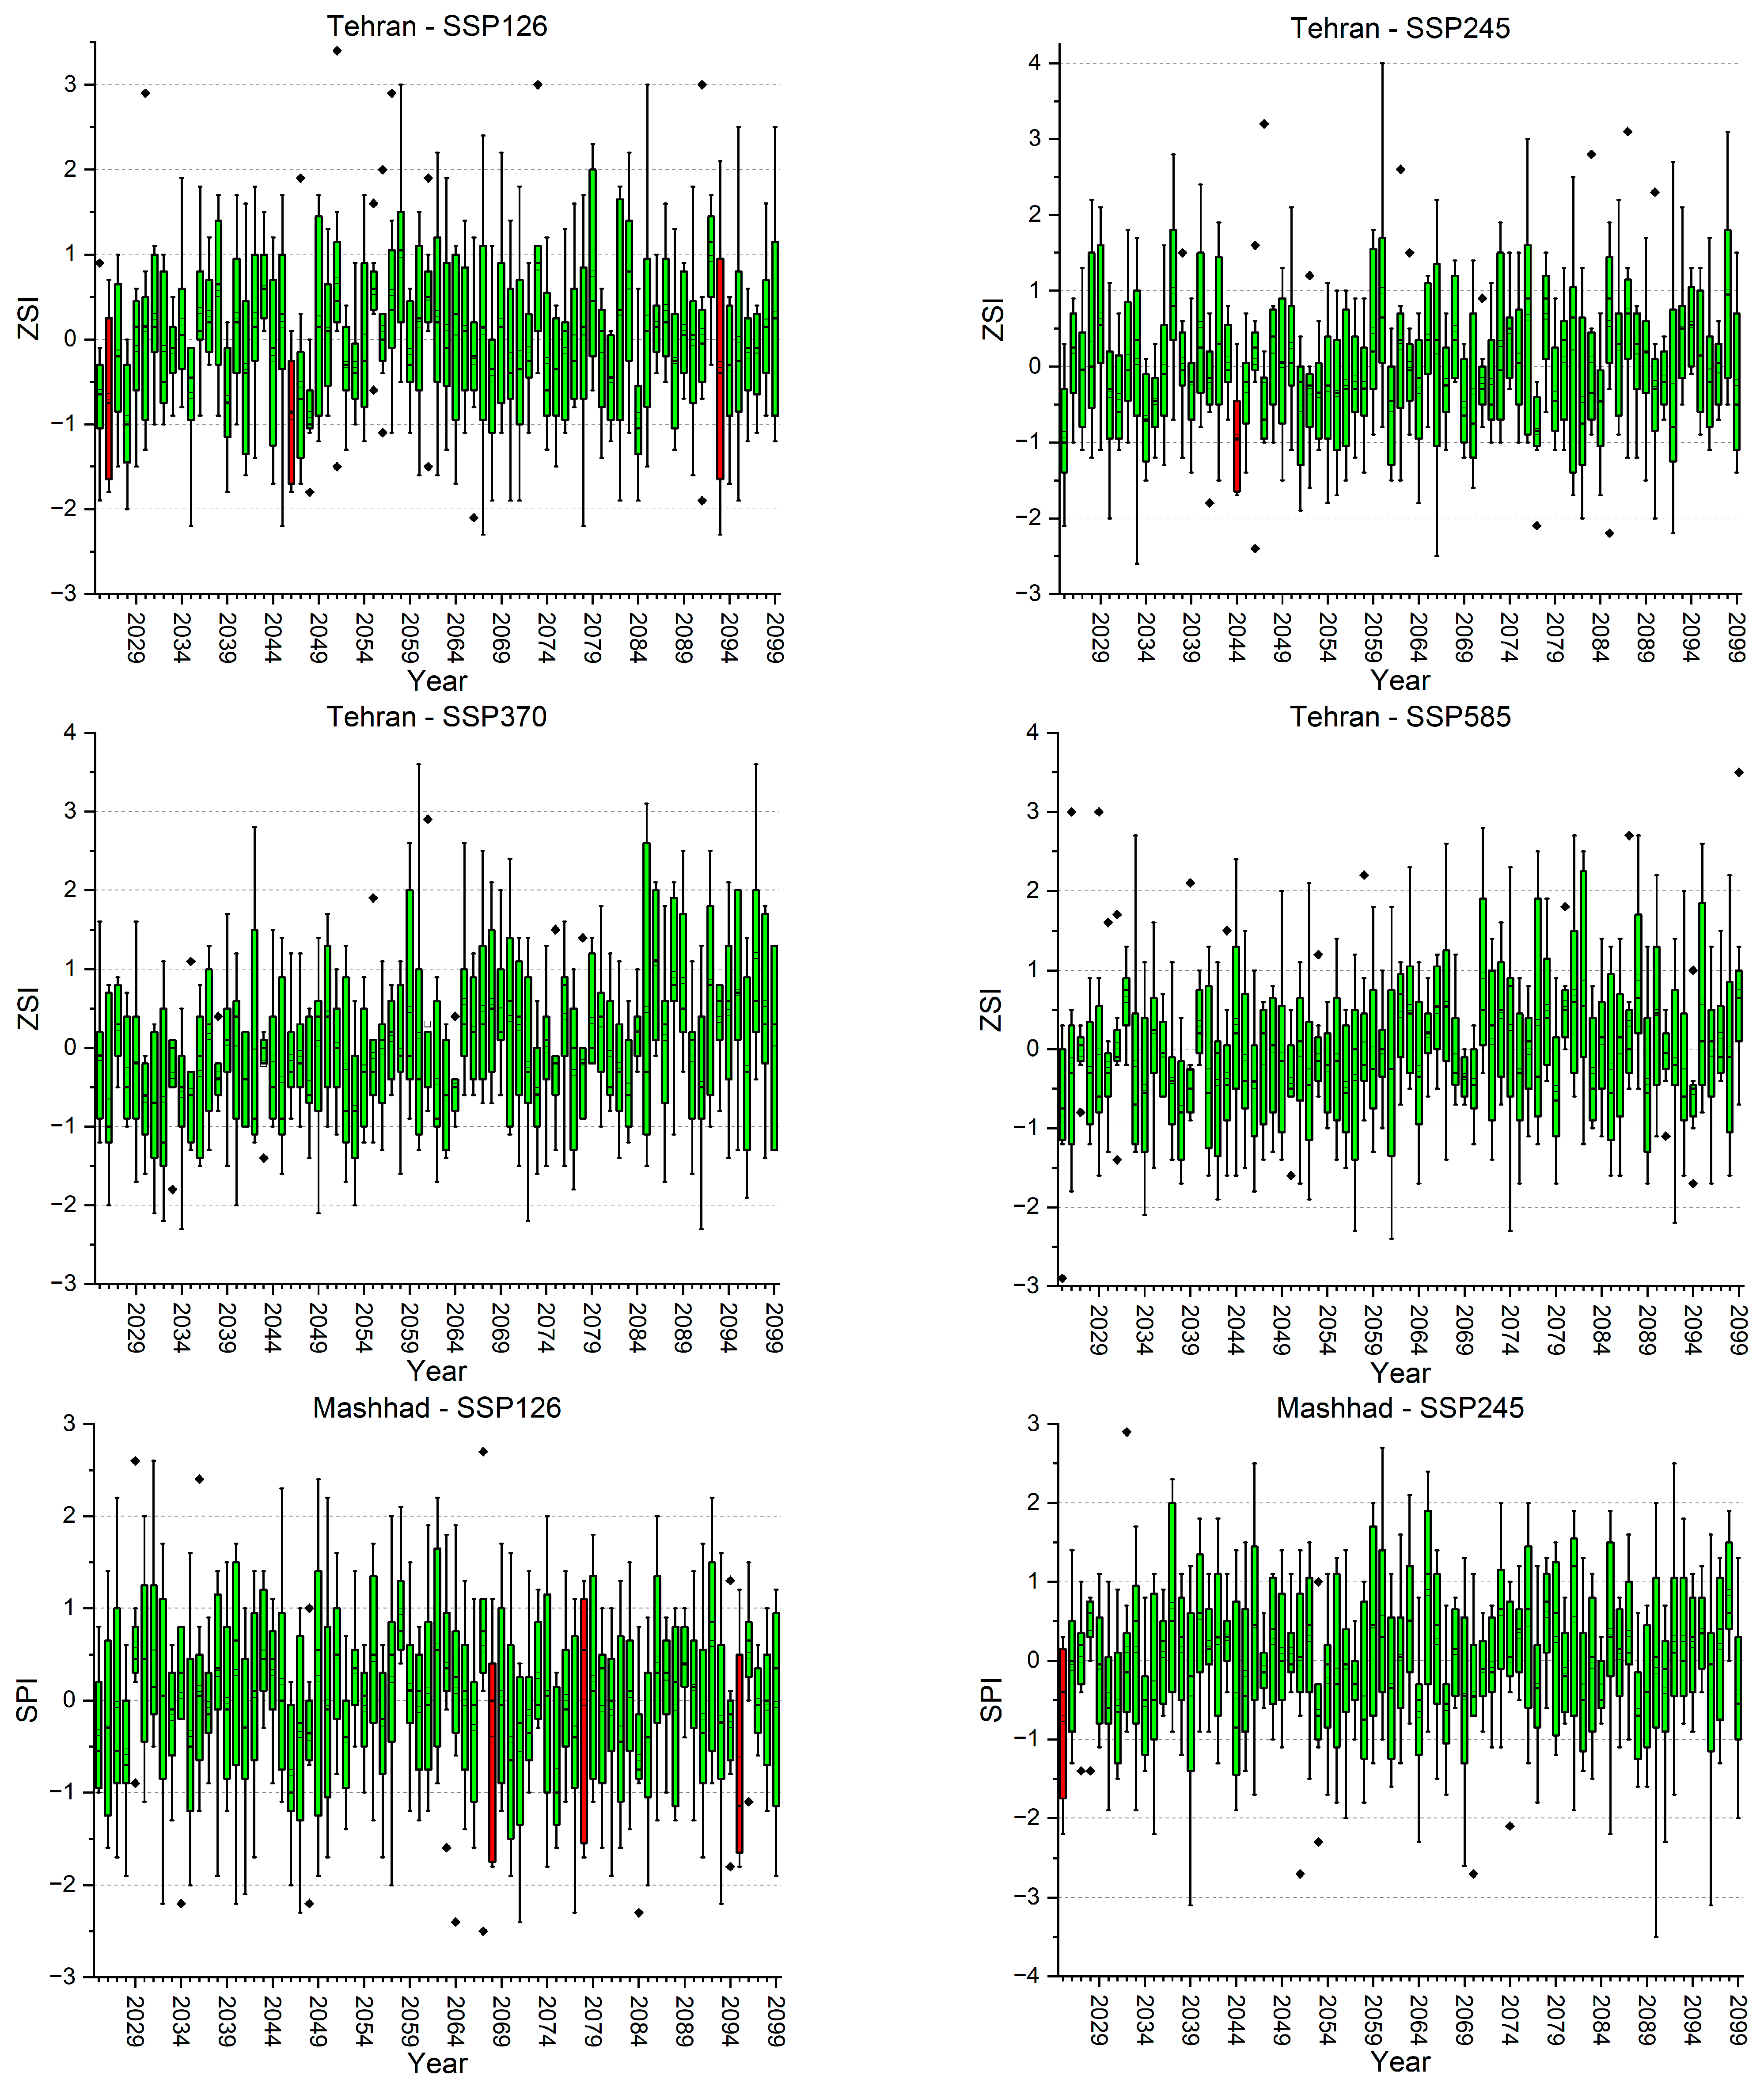
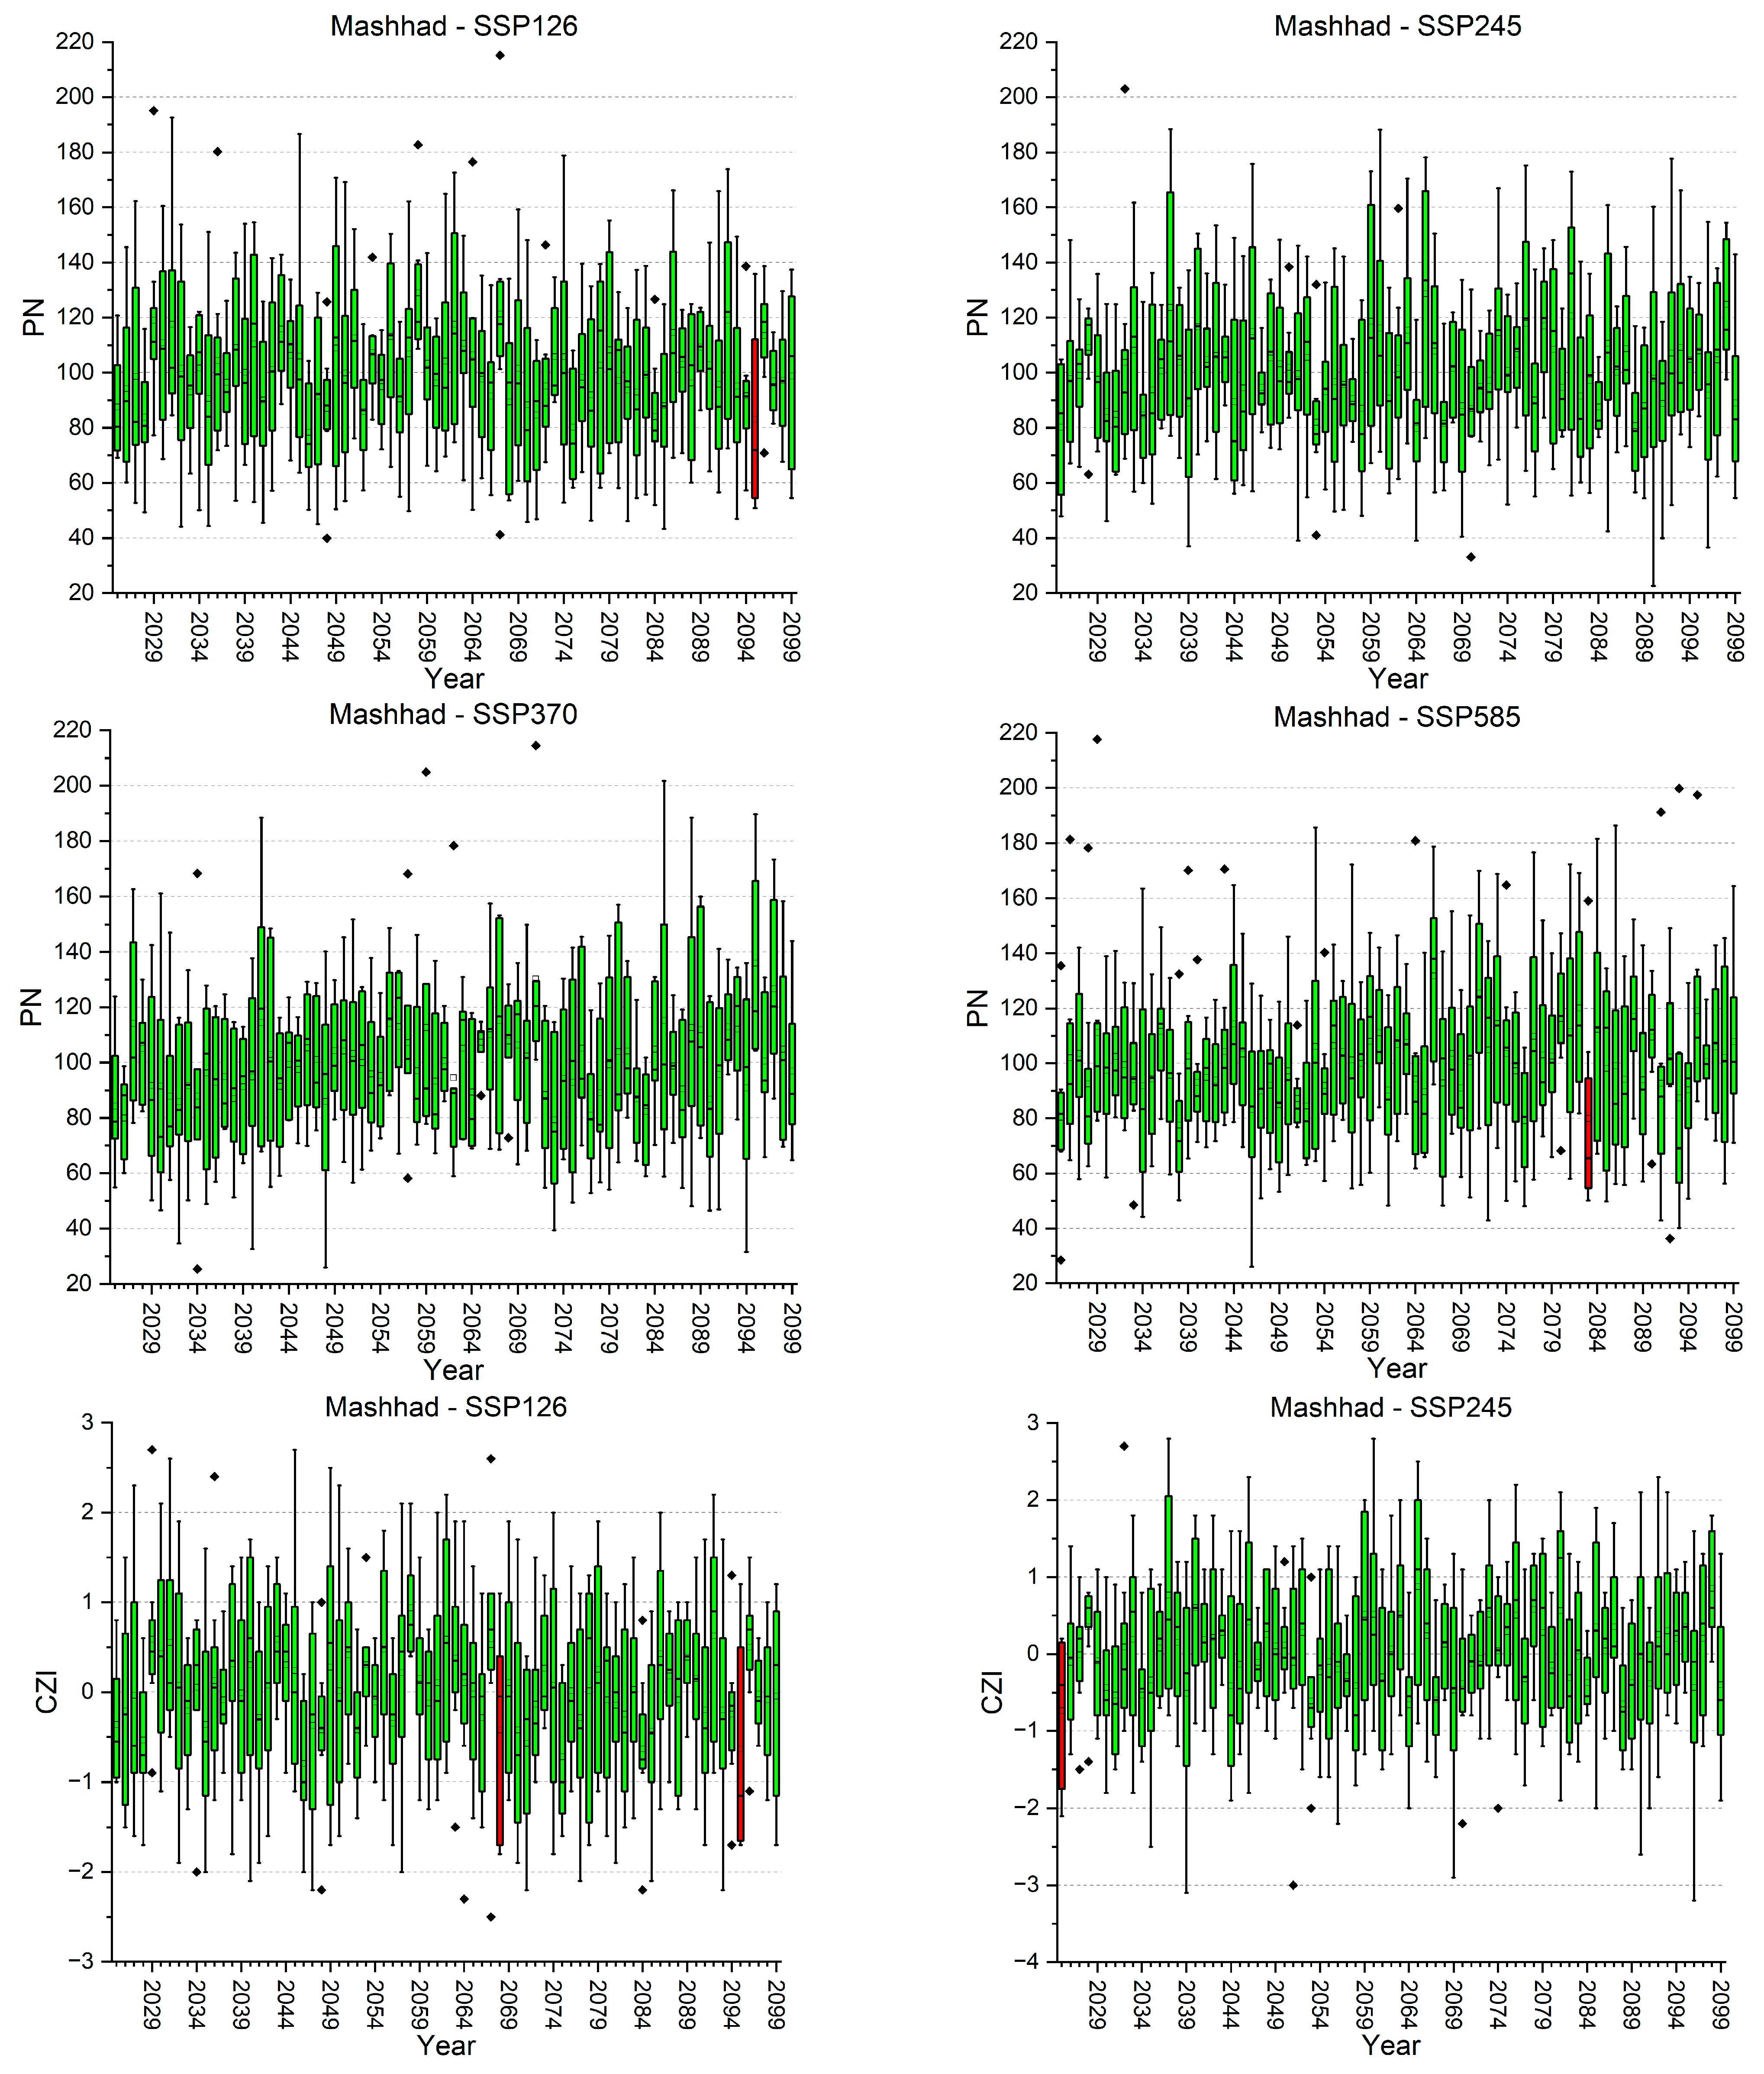
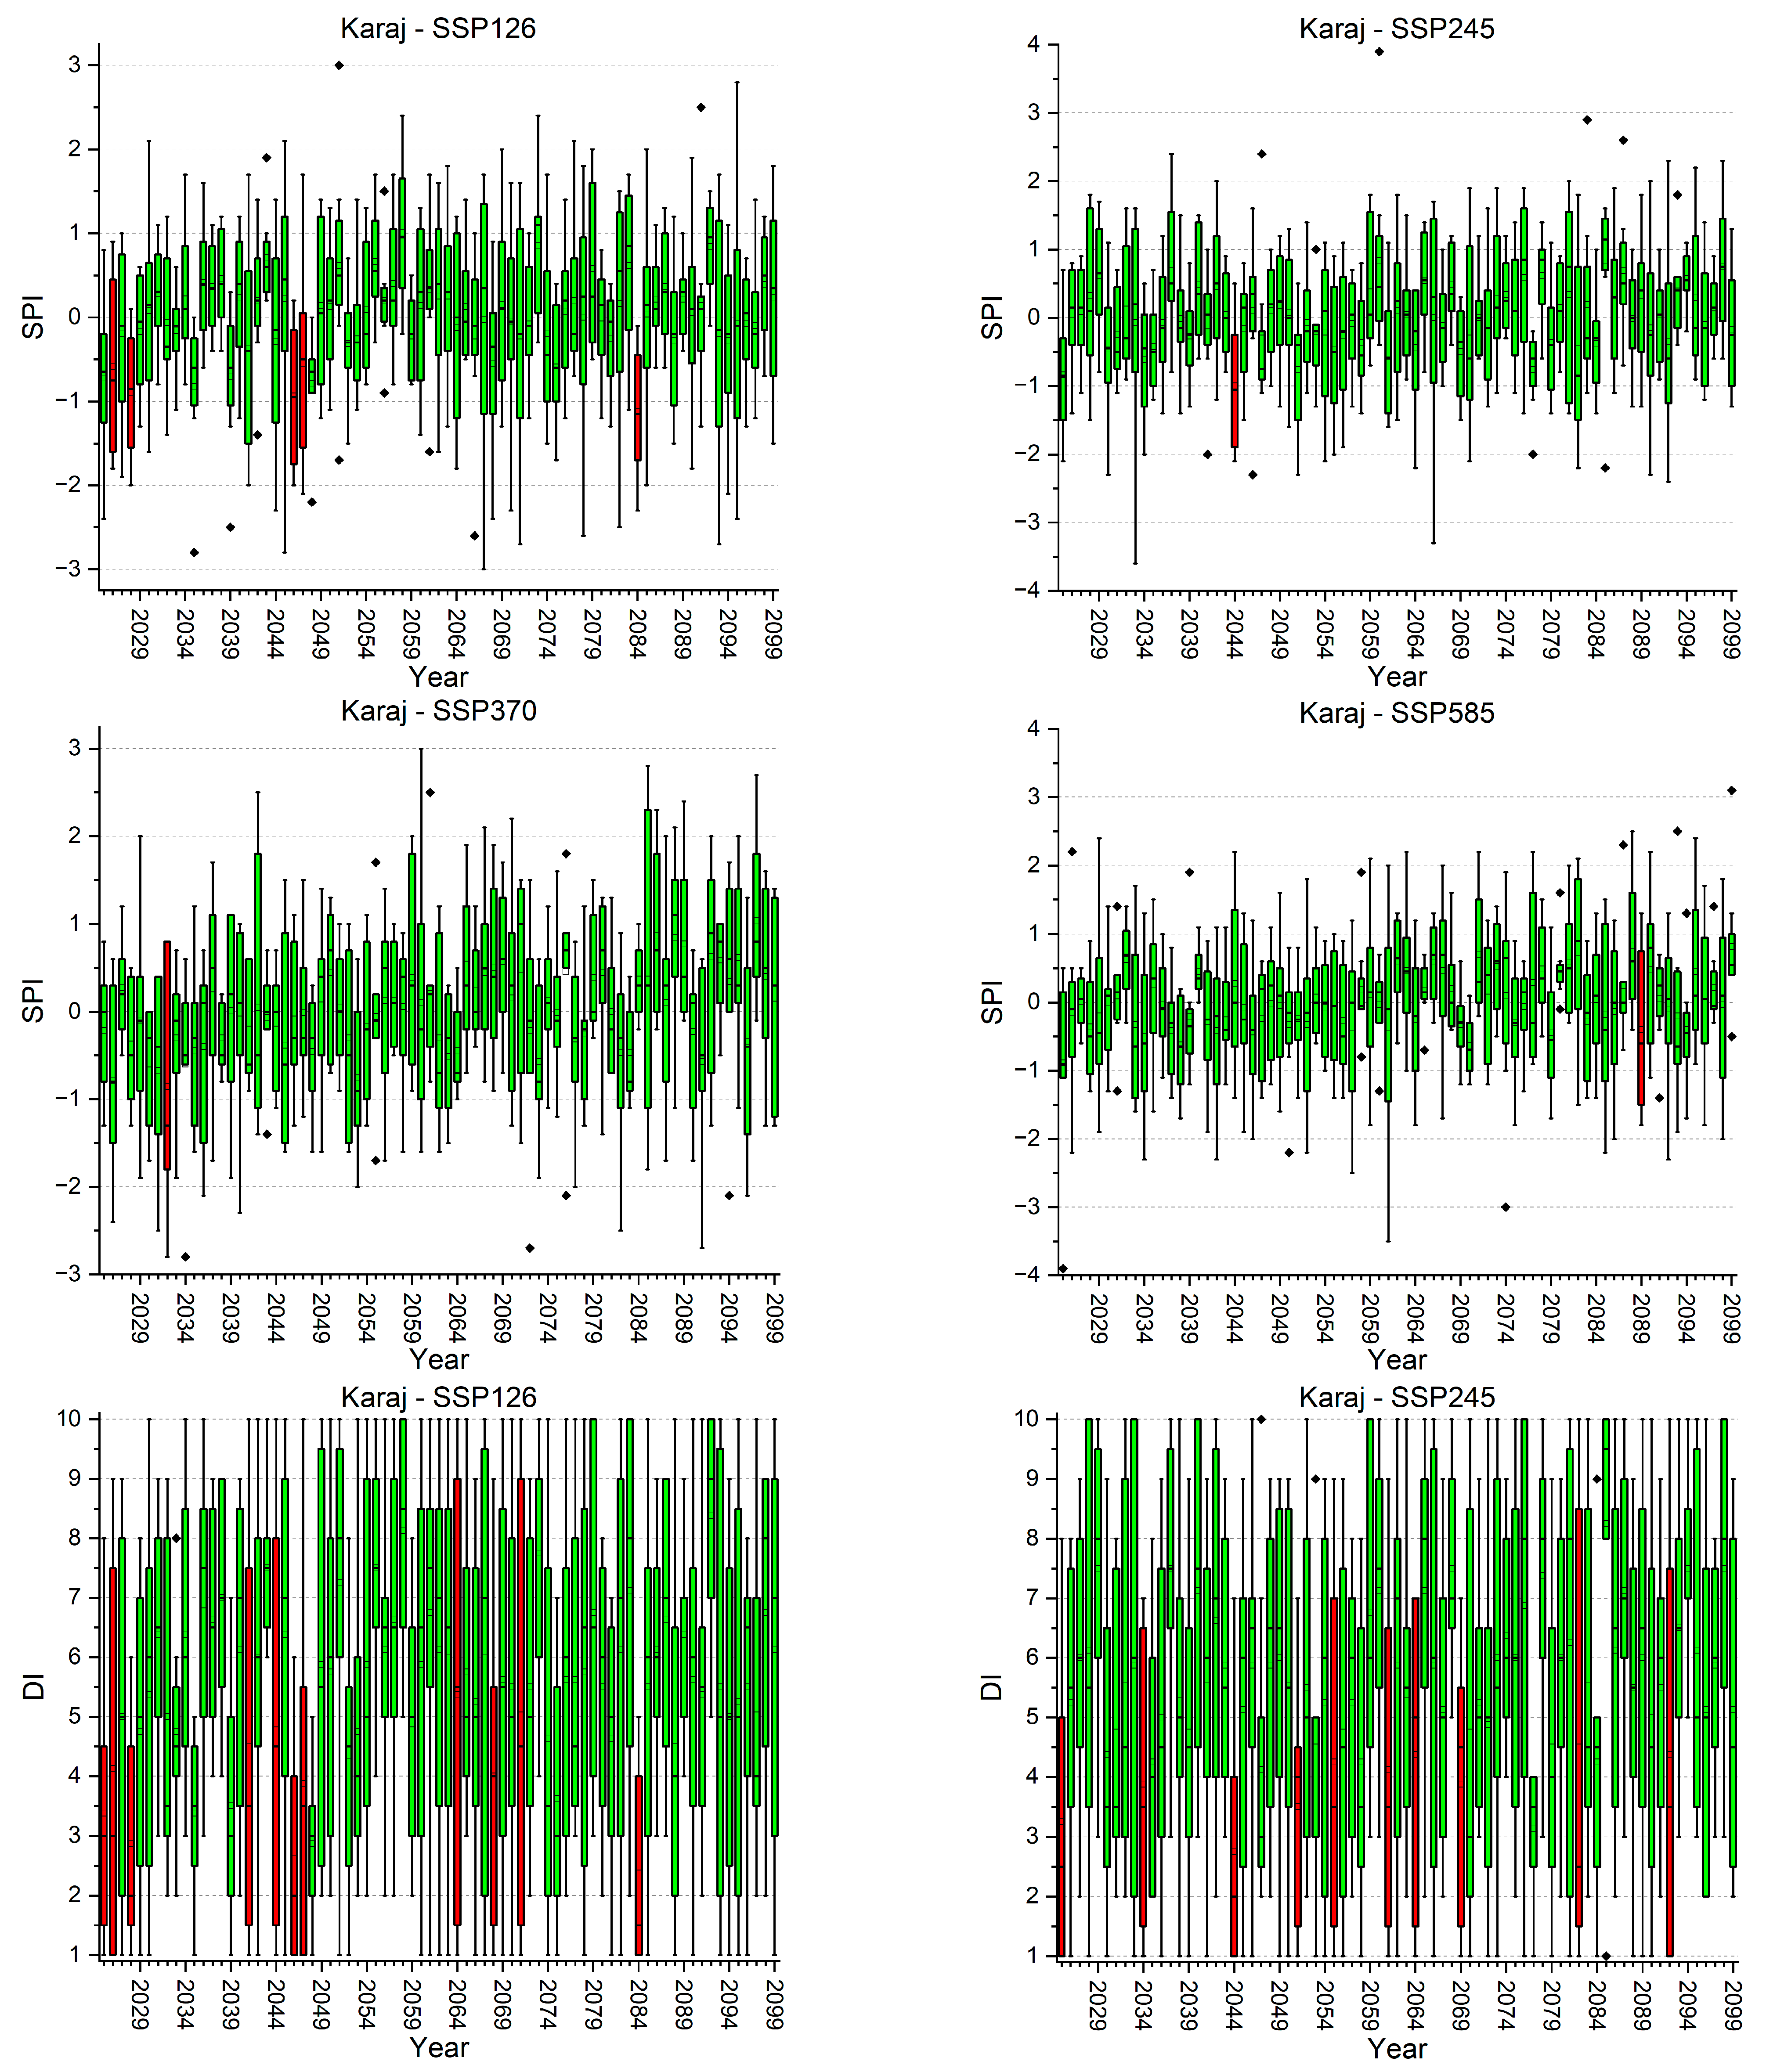
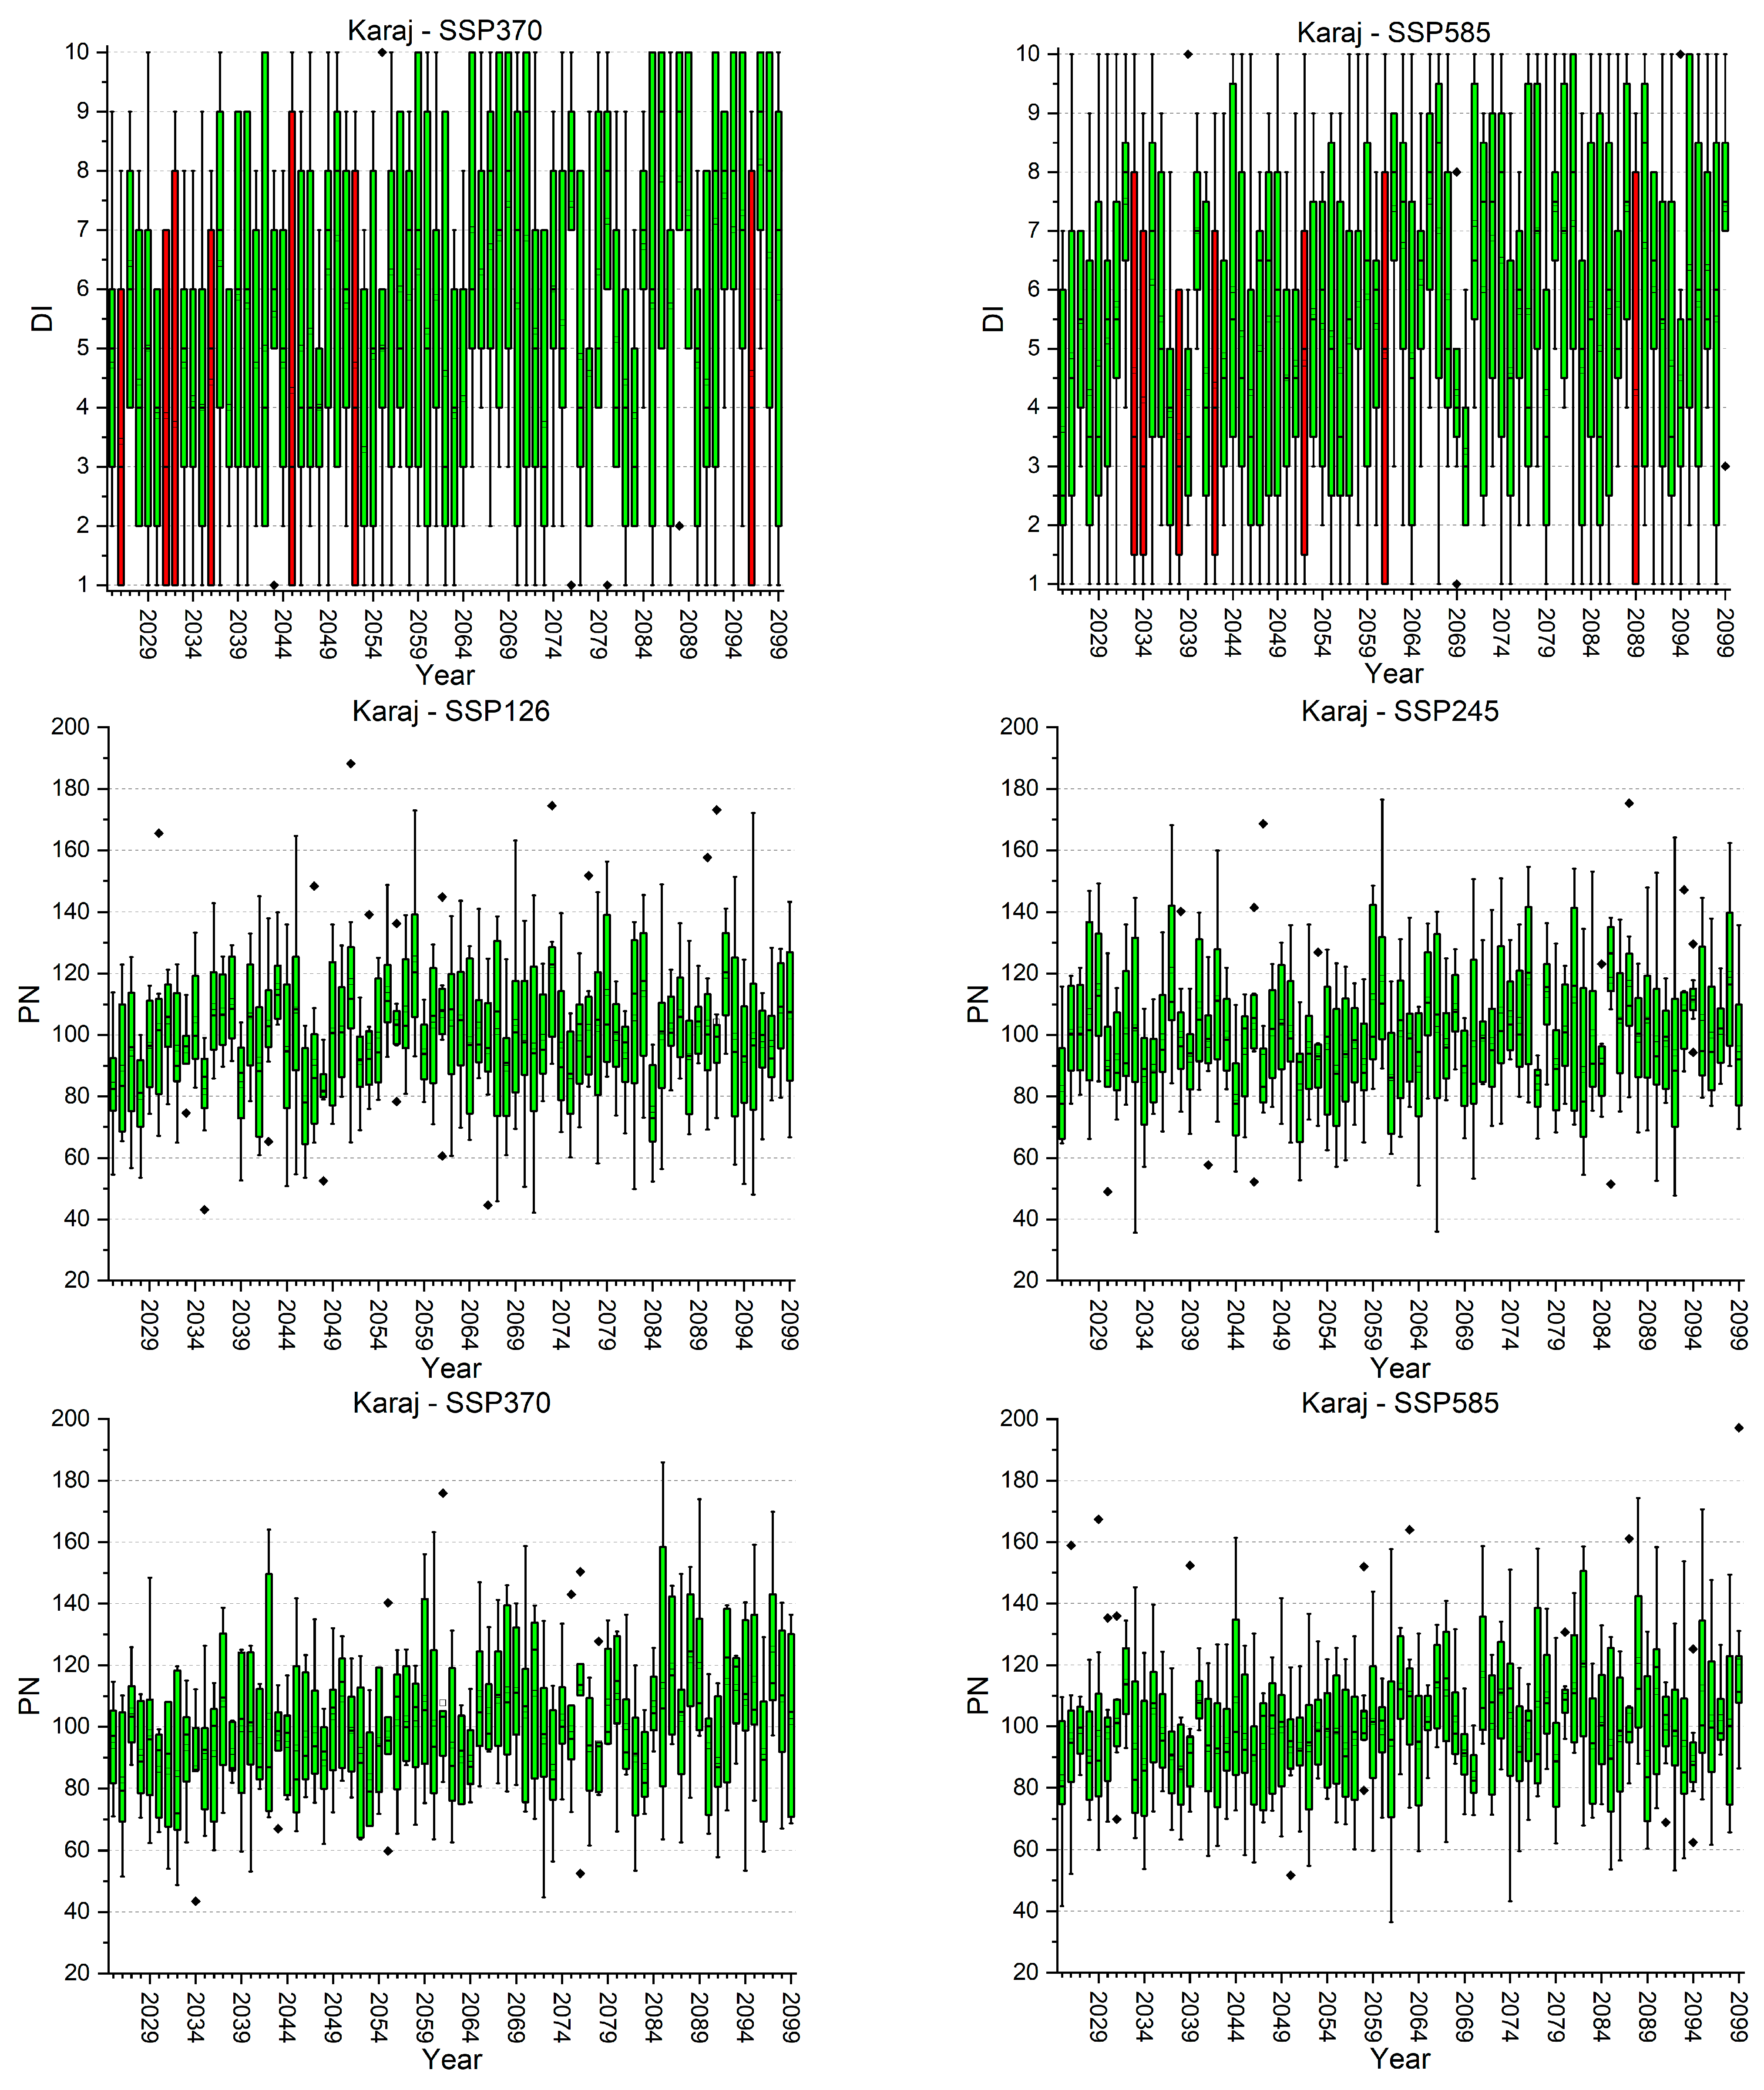
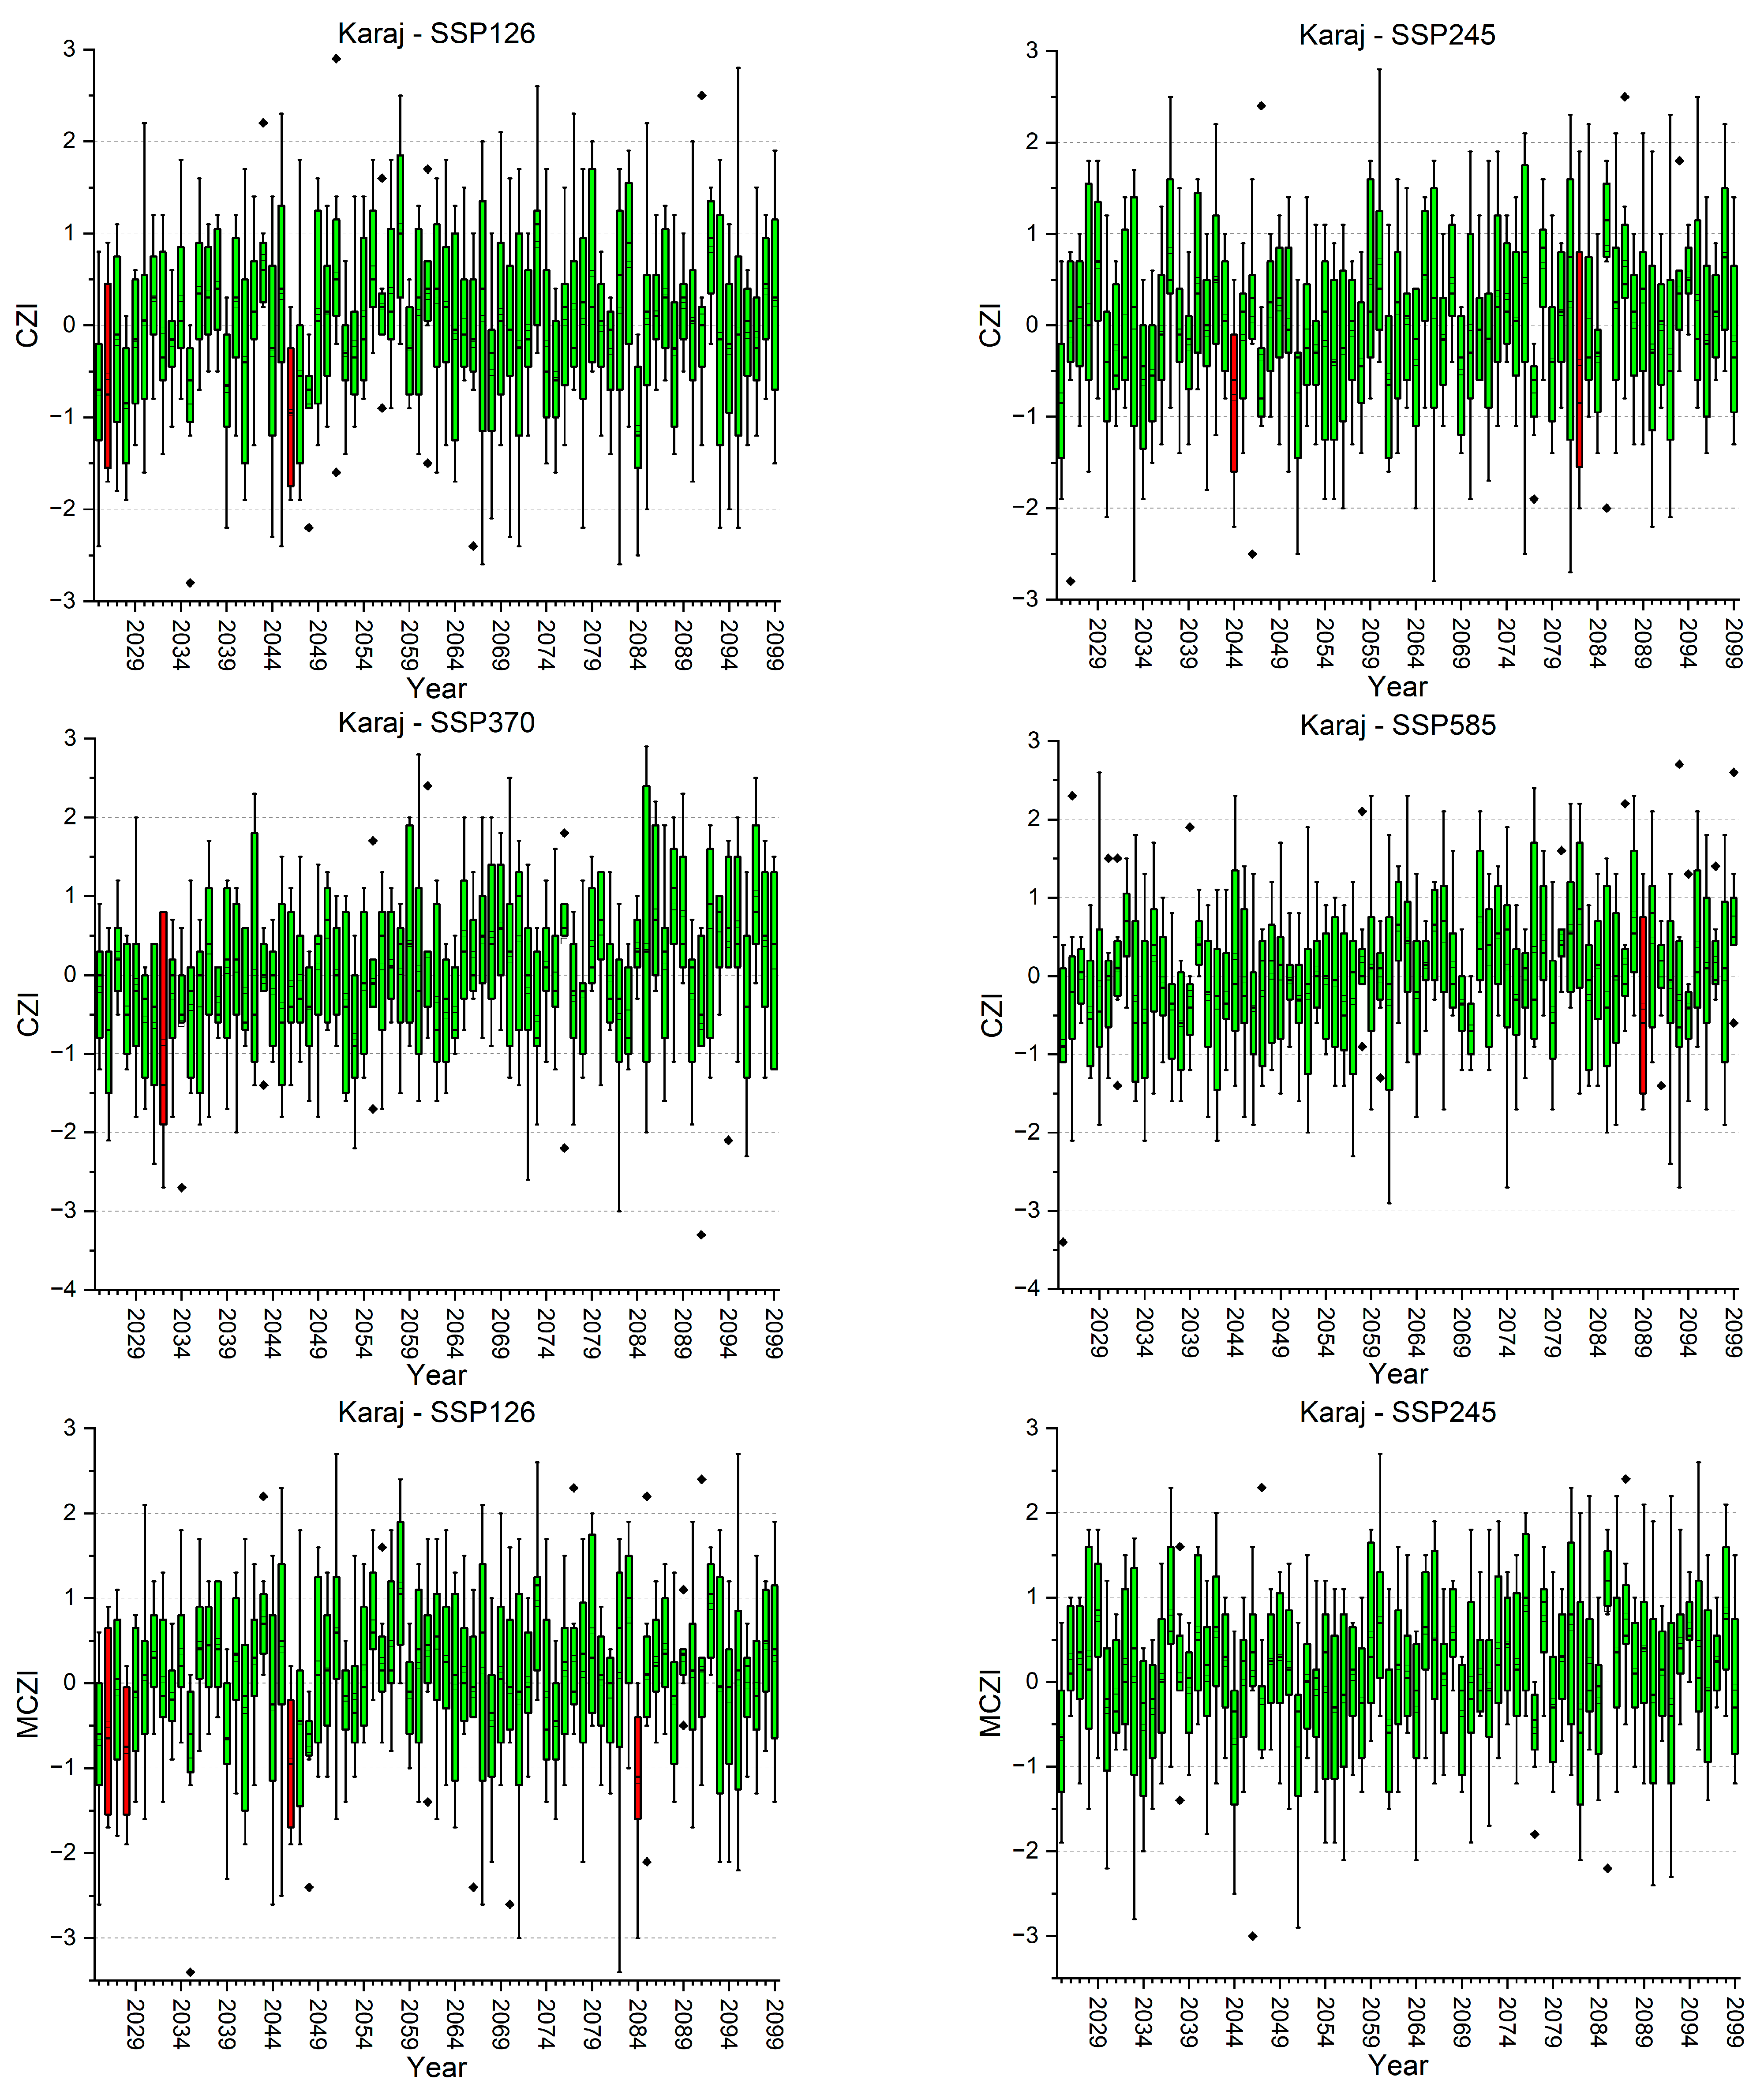
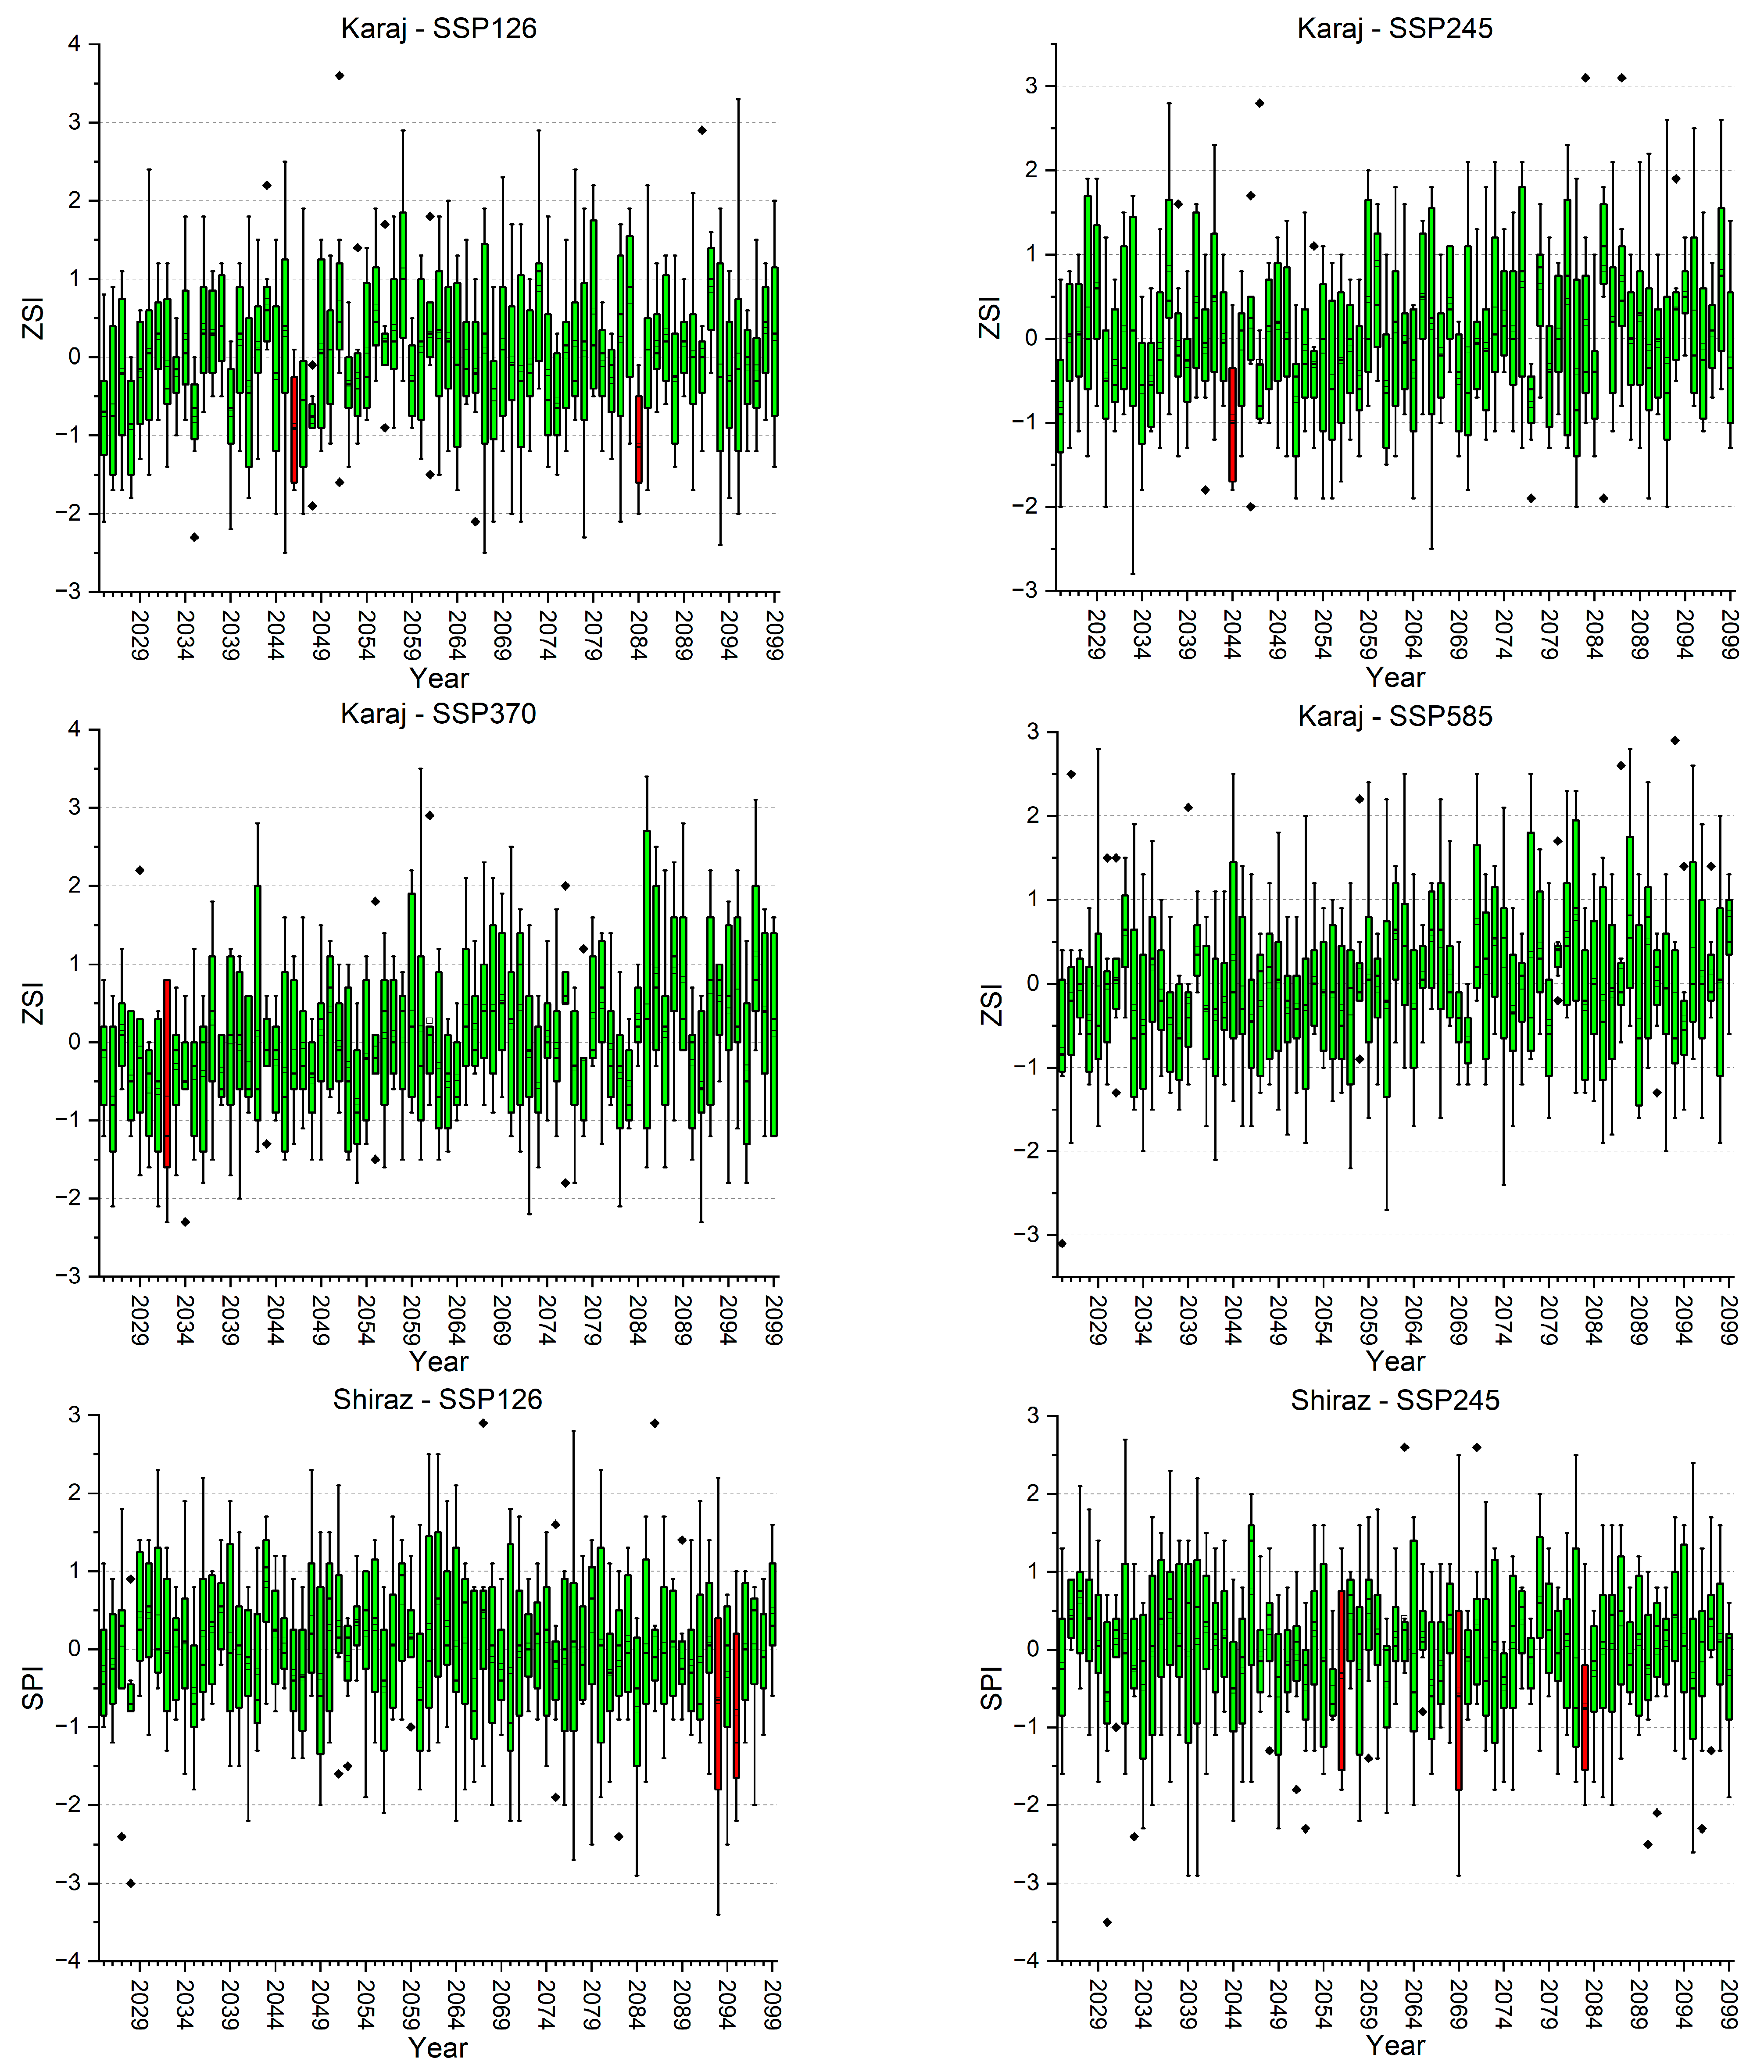
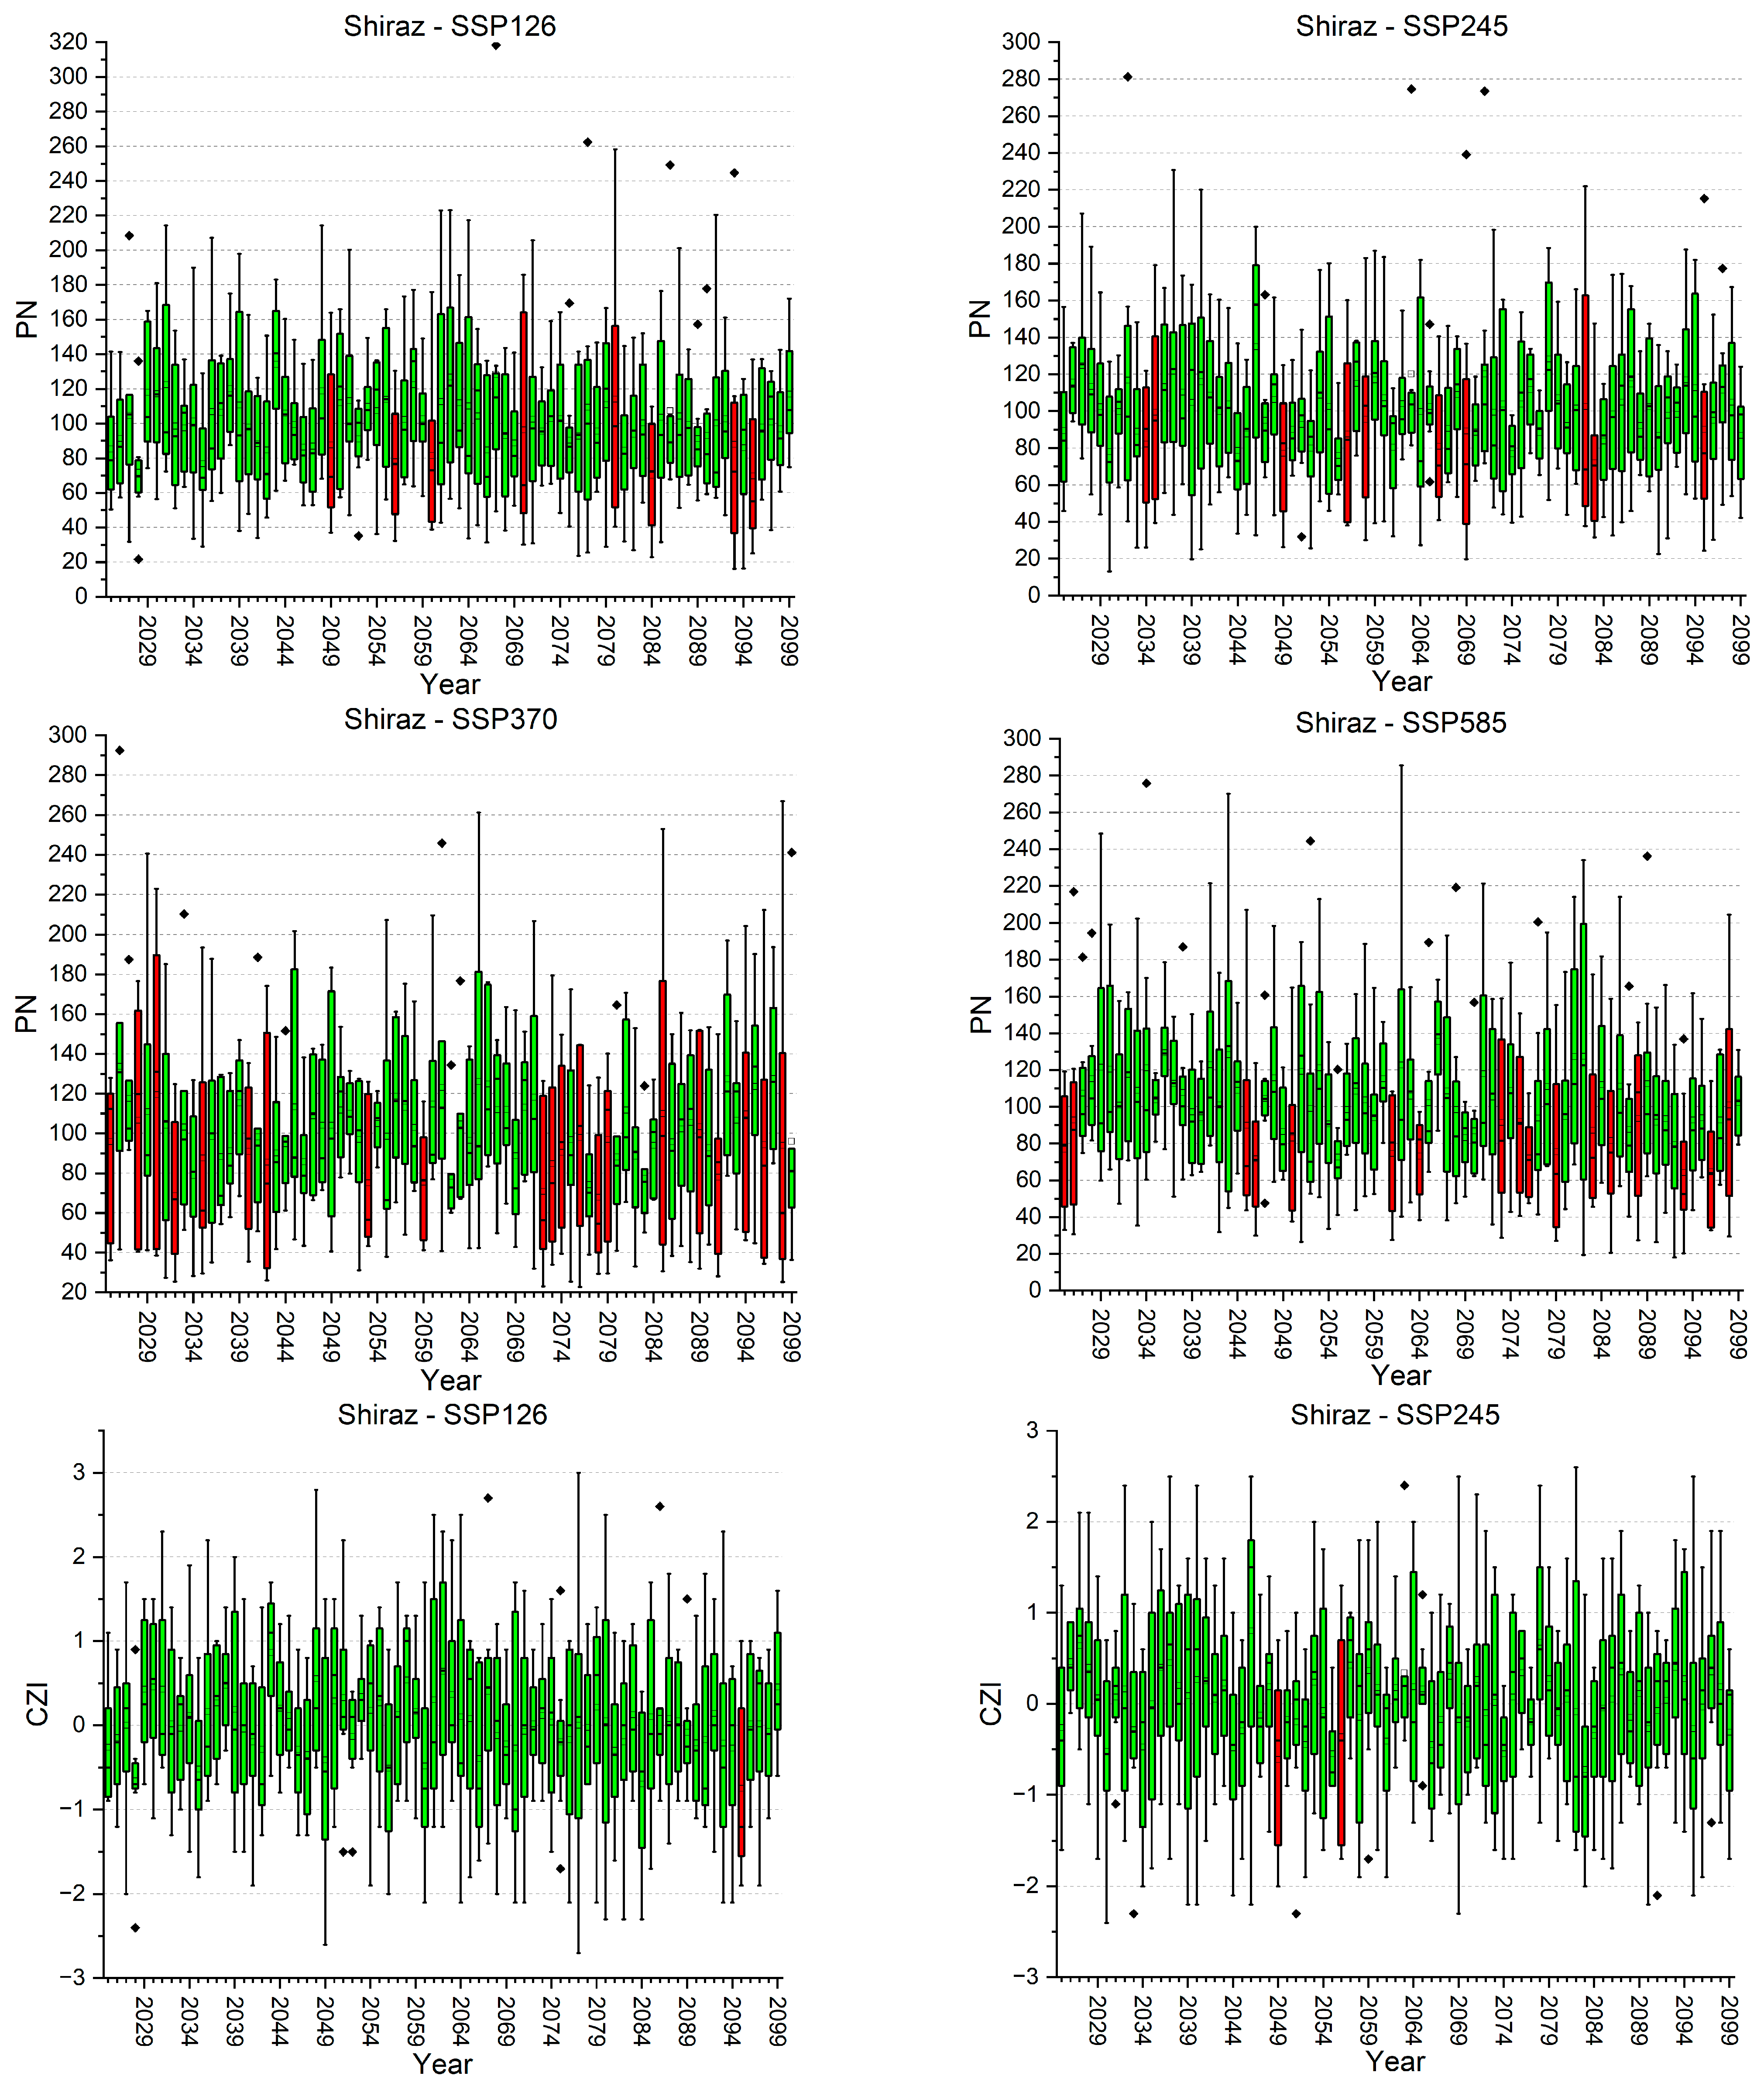
  • SSP126 (Sustainability—Taking the Green Road): Tehran, Karaj, and Tabriz show heightened conditions under the SSP126 scenario. Since SSP126 is a low-emission scenario aiming for sustainability and a smaller climate footprint, the fact that these cities are highlighted suggests they are sensitive to even the lower end of projected climate changes. It implies that water resource planning and drought mitigation strategies should be considered seriously even under the most optimistic climate outcomes.
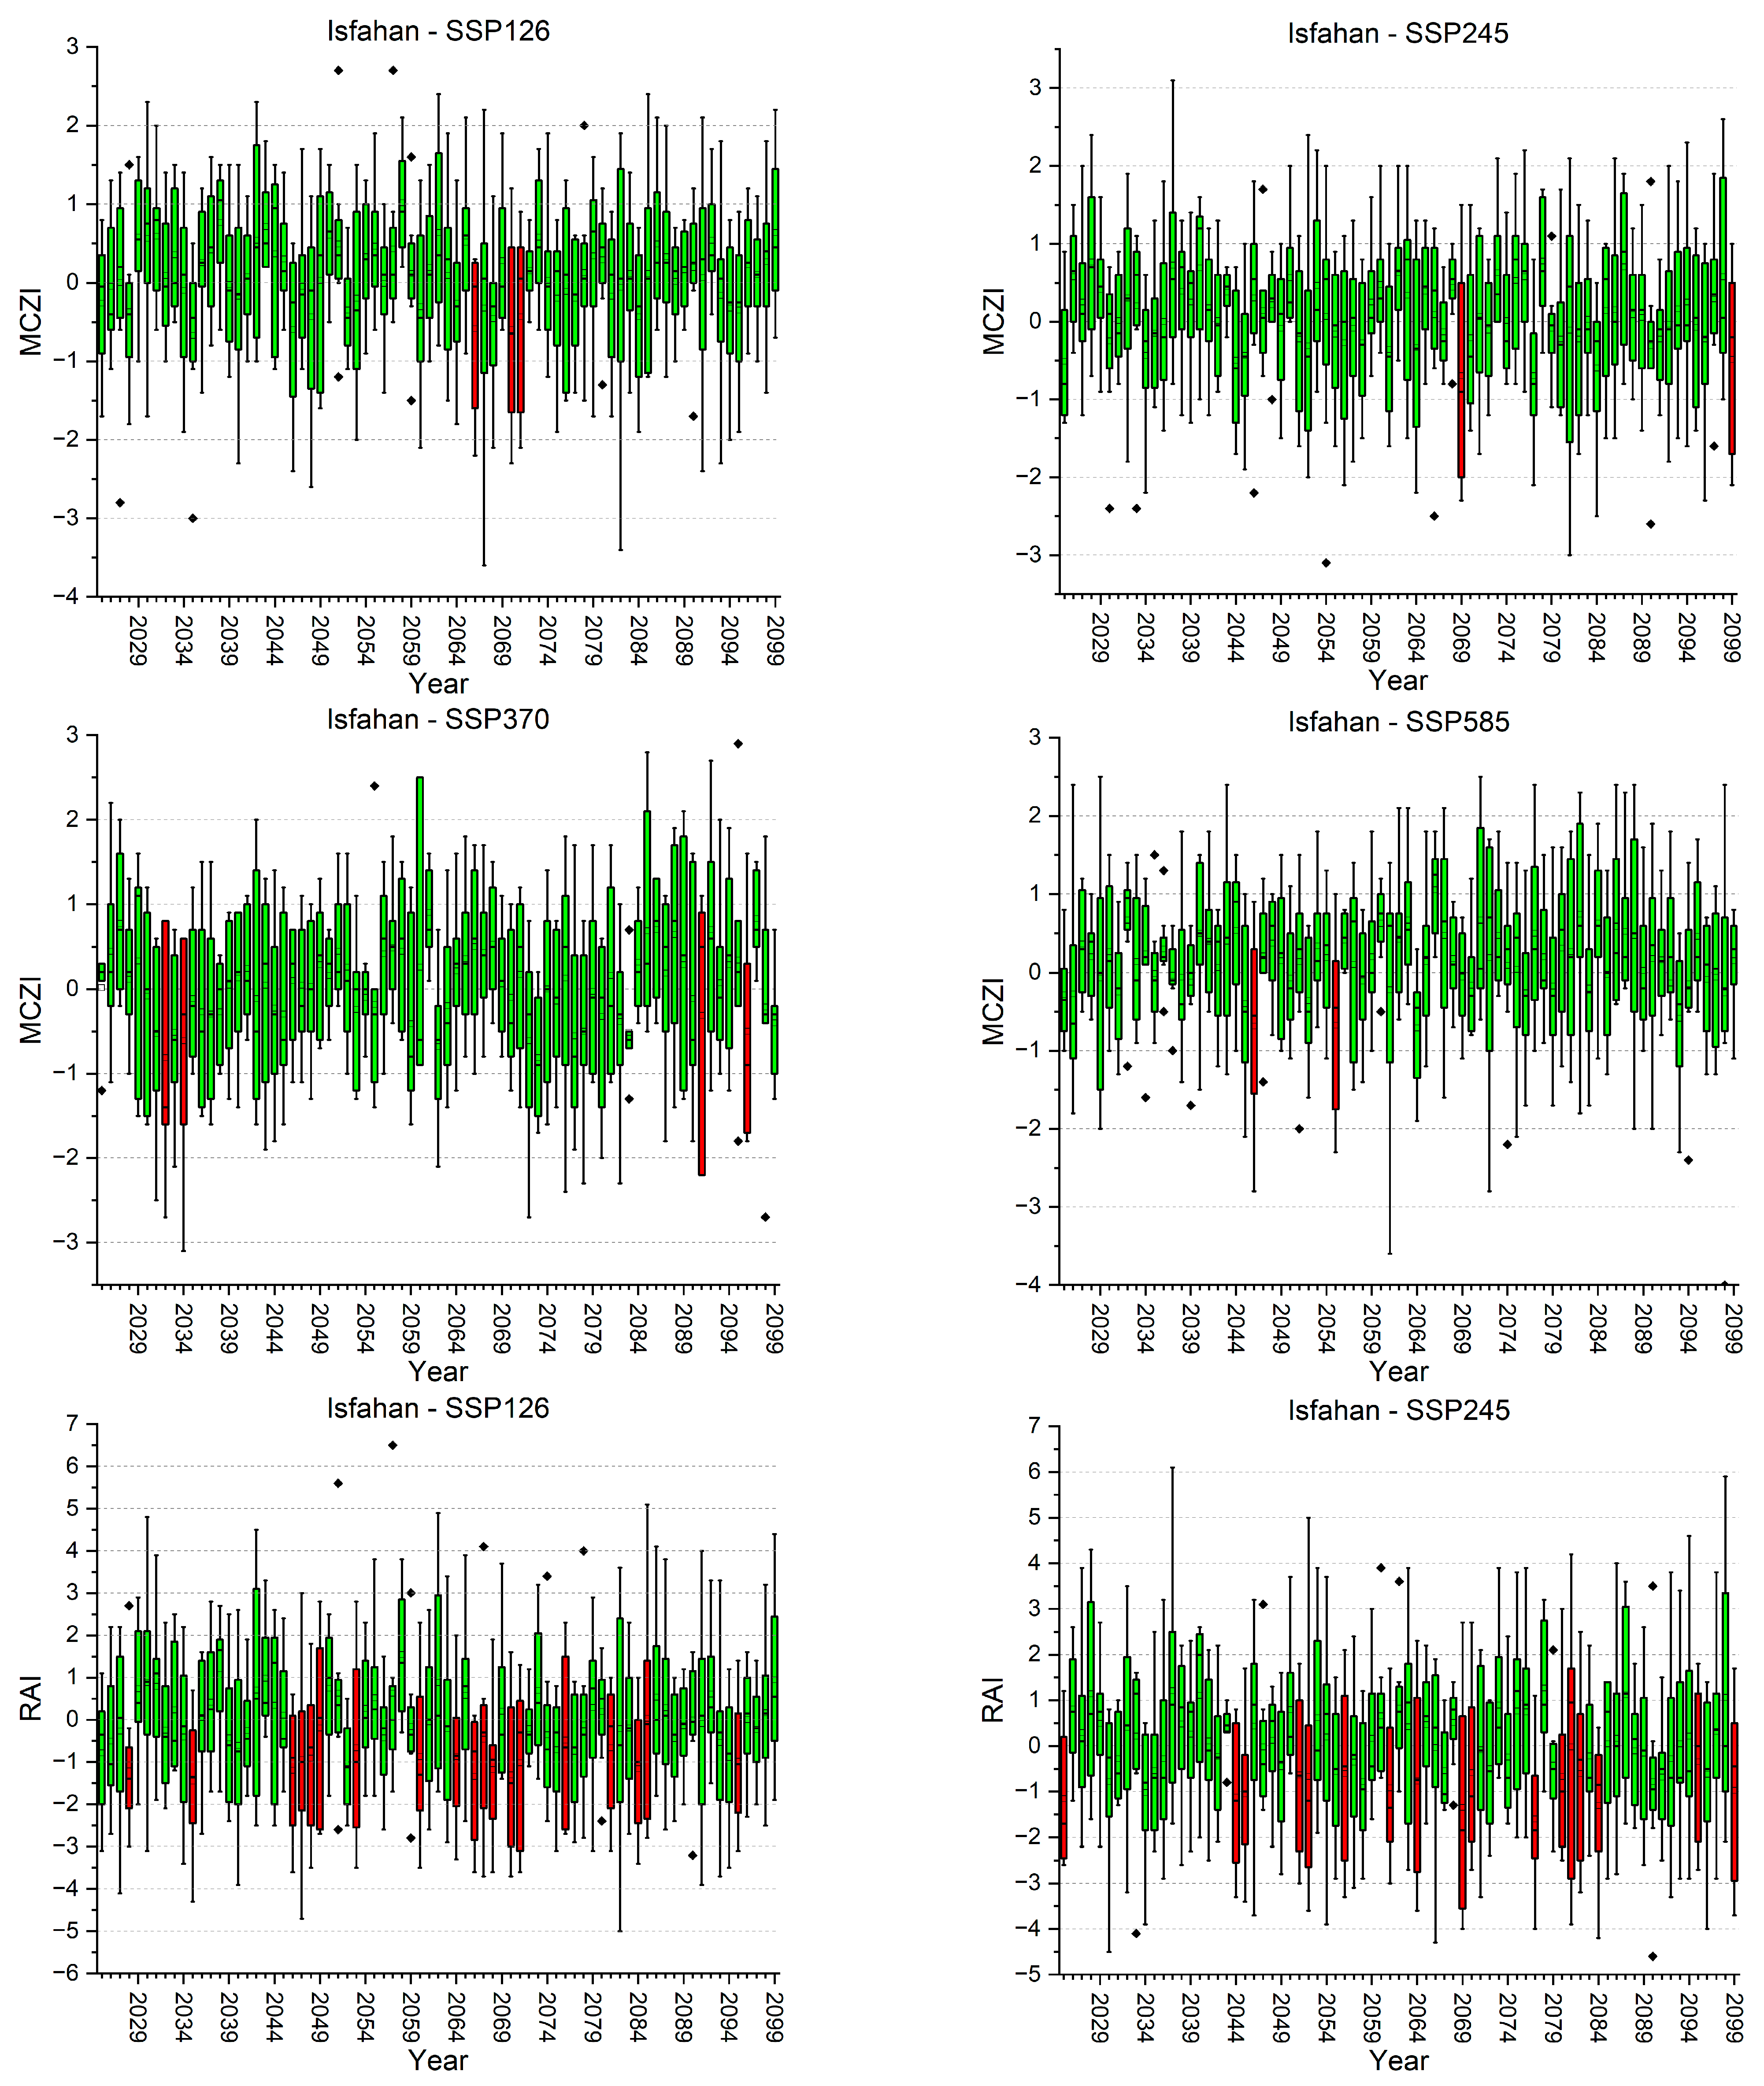
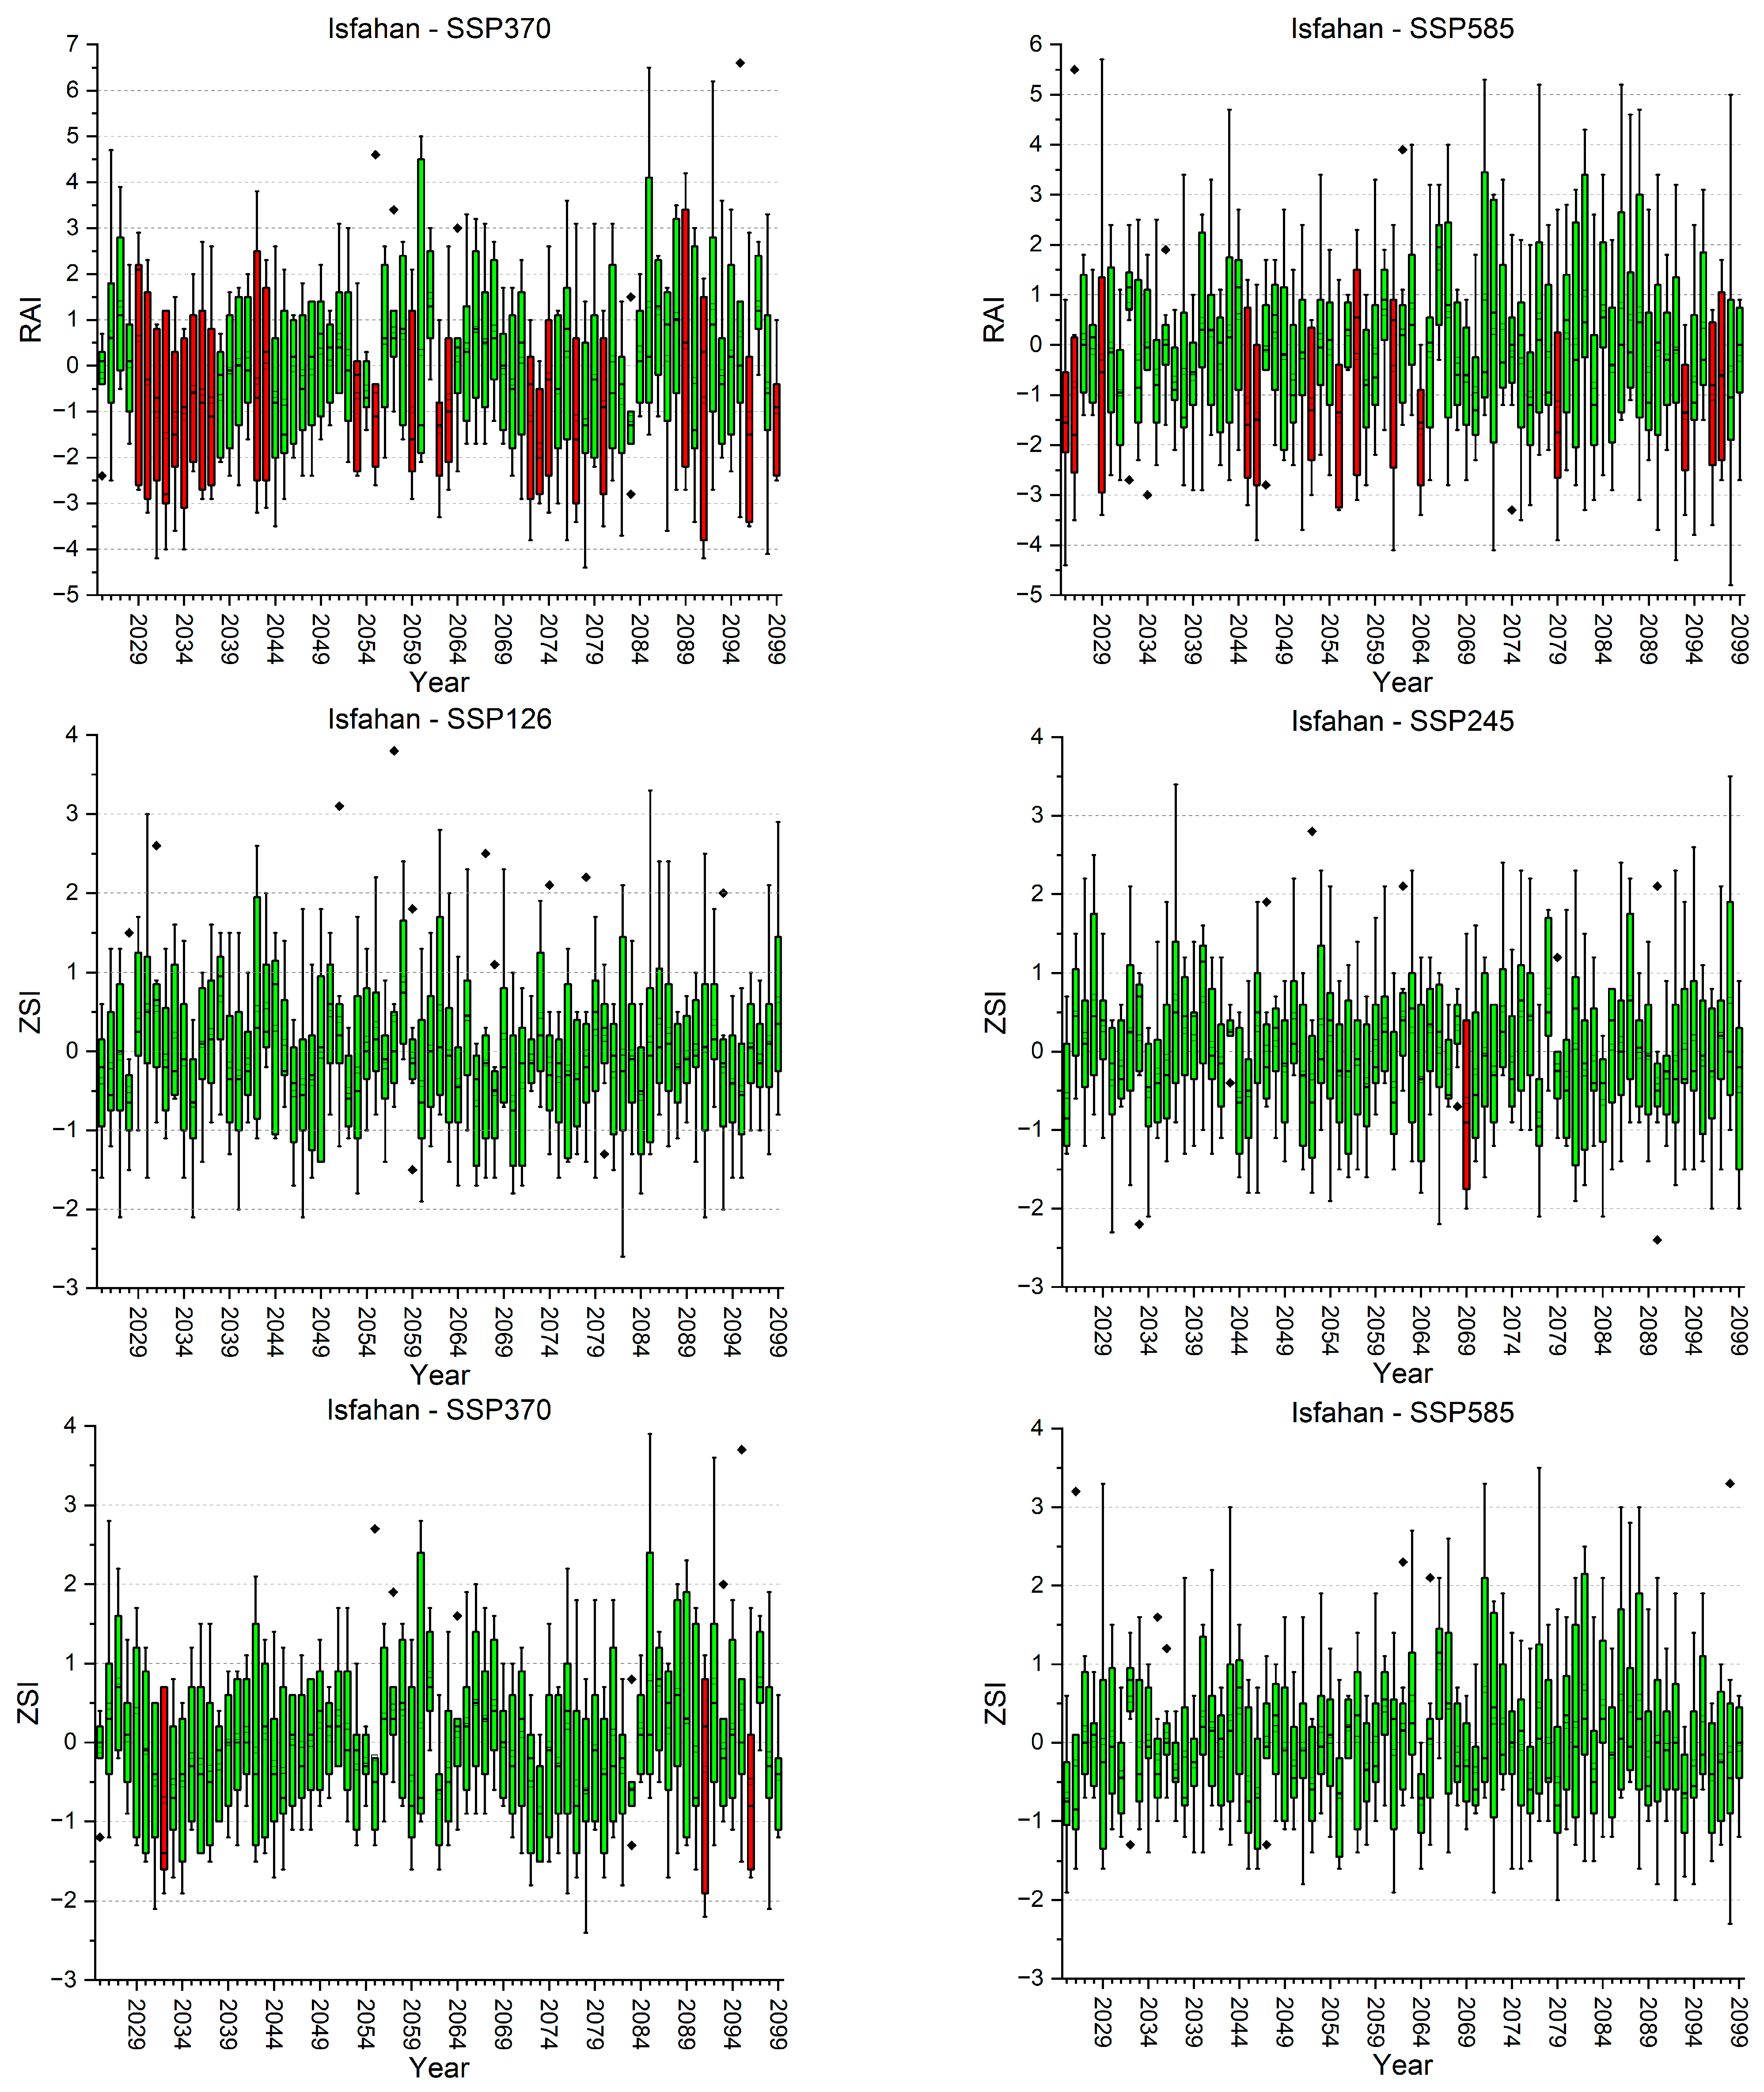
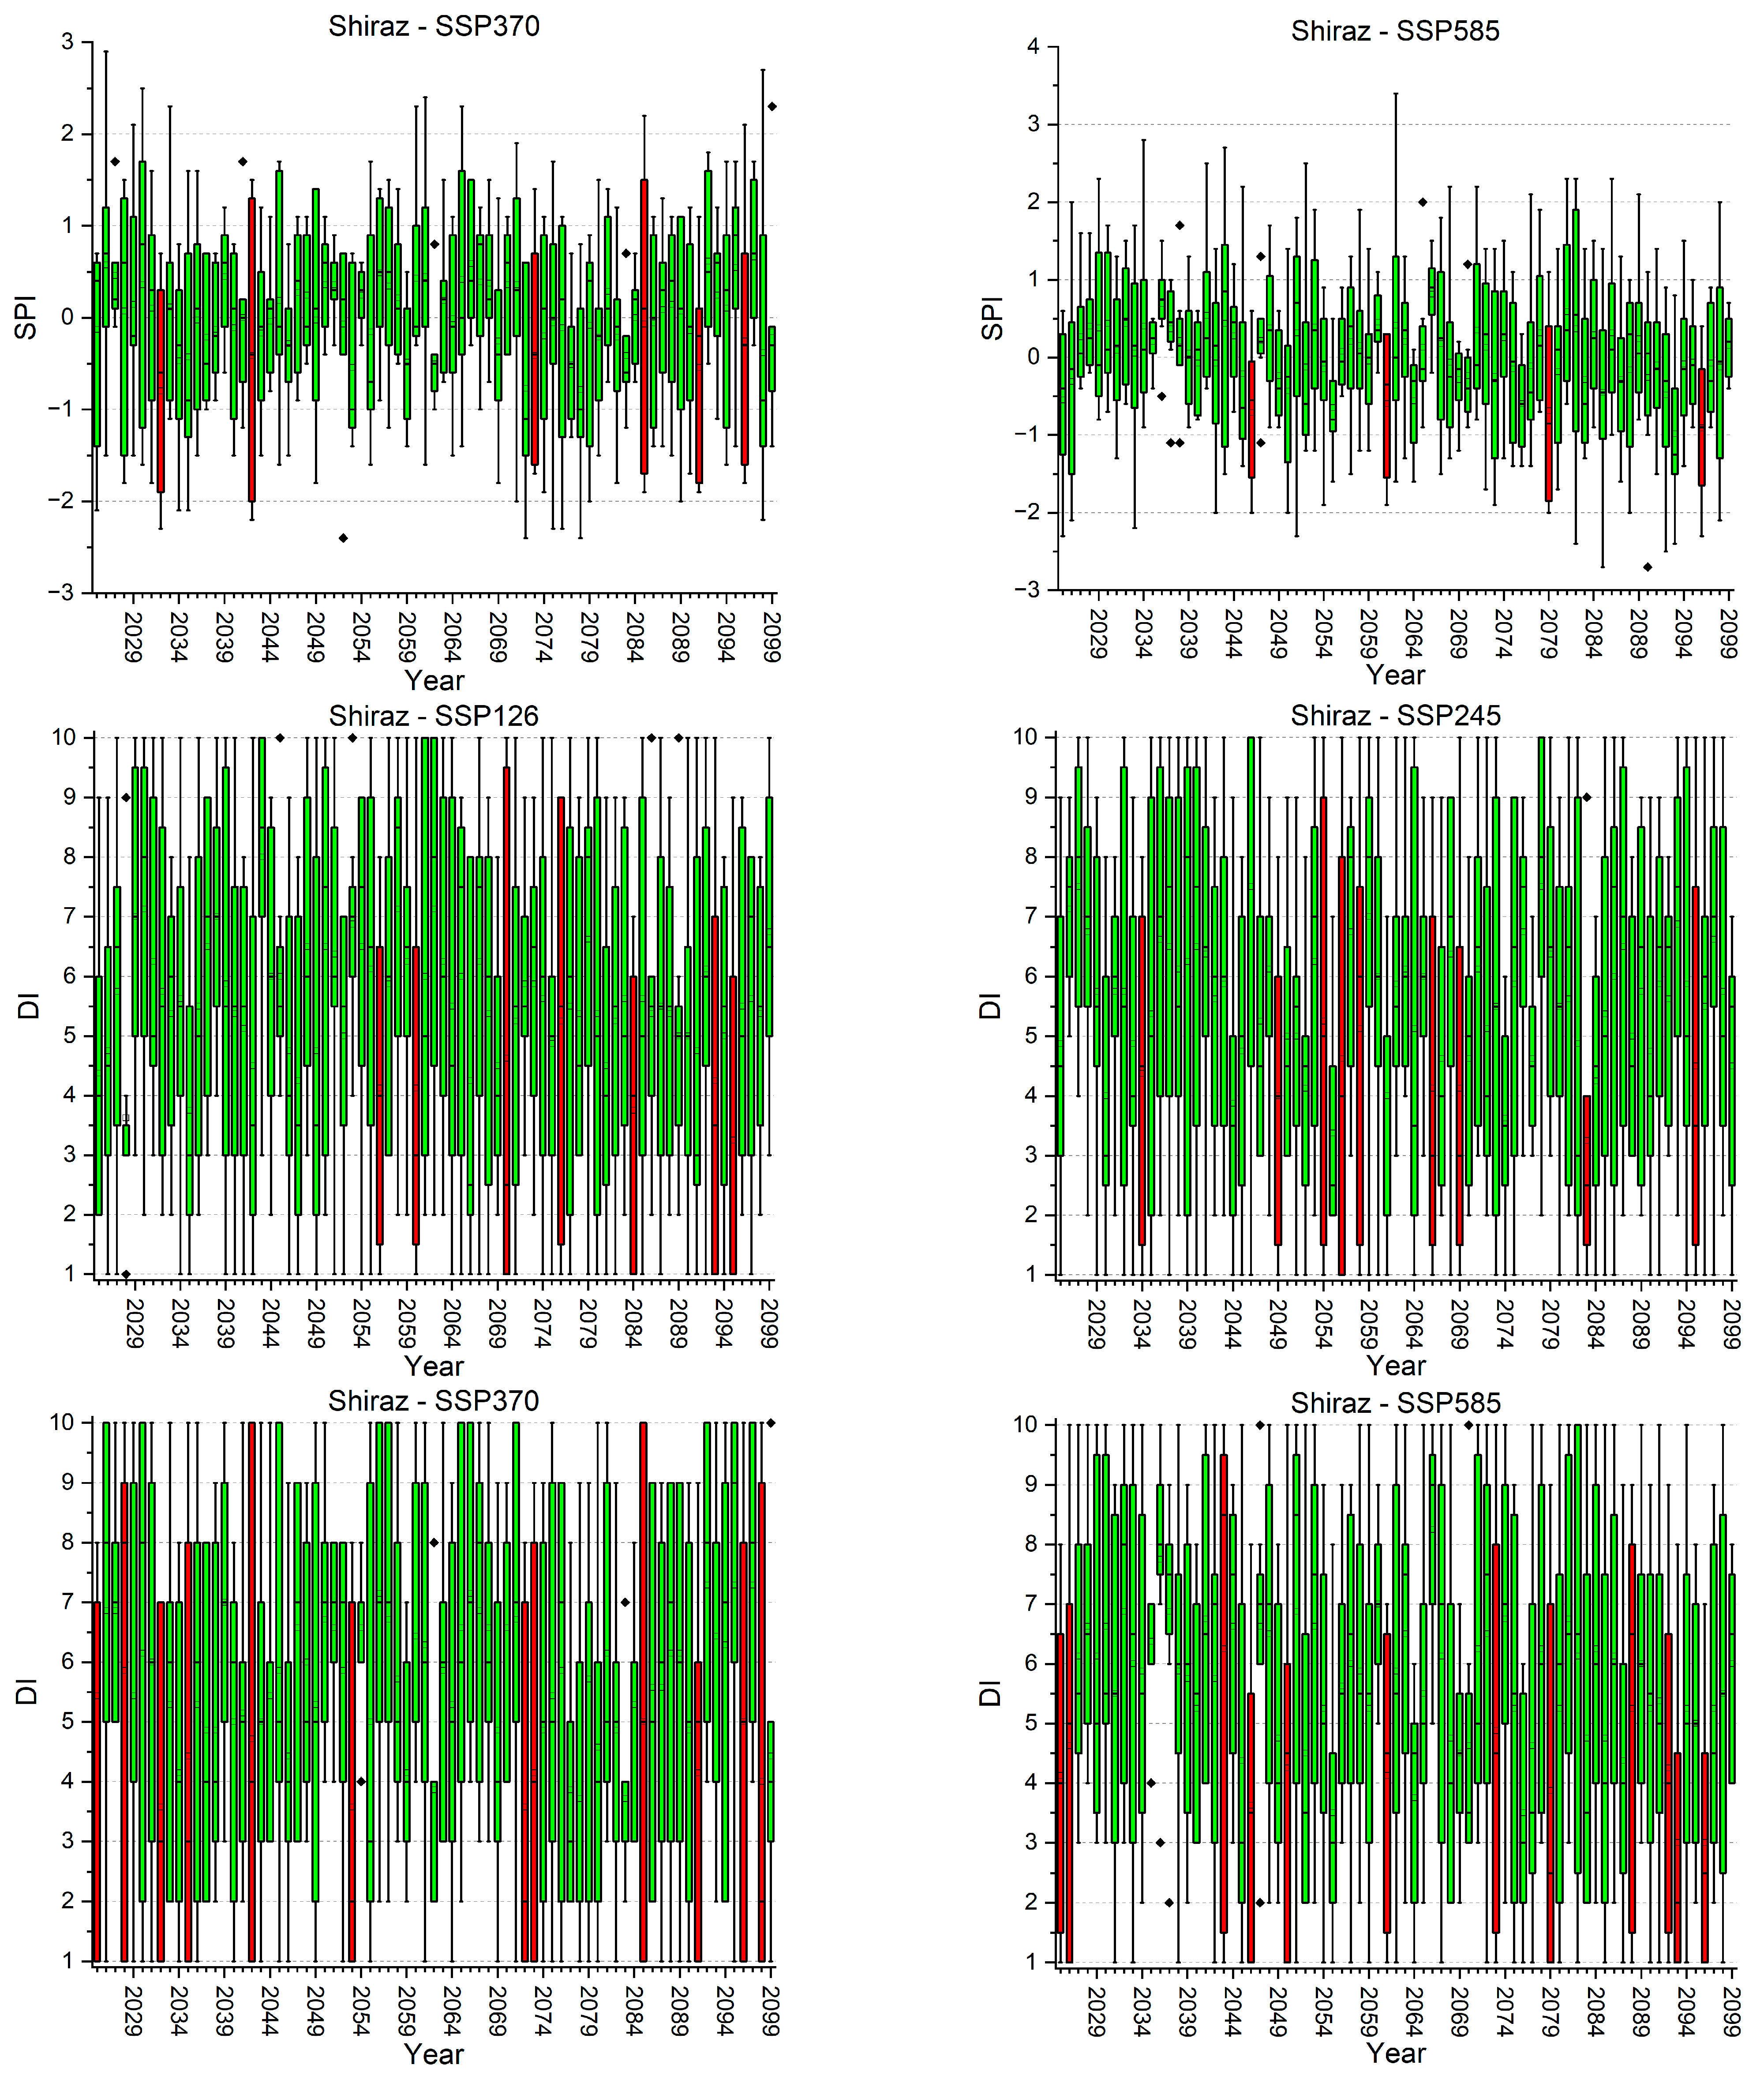
  • SSP245 (Middle of the Road): More critical conditions are indicated under SSP245 for Isfahan and Shiraz. This scenario represents a world that follows a path of moderate emissions without too much deviation from current trends. The signal that Isfahan and Shiraz are areas of concern under this scenario suggests that these cities might be particularly vulnerable to the median range of climate change projections and should prepare for significant impacts on water availability.
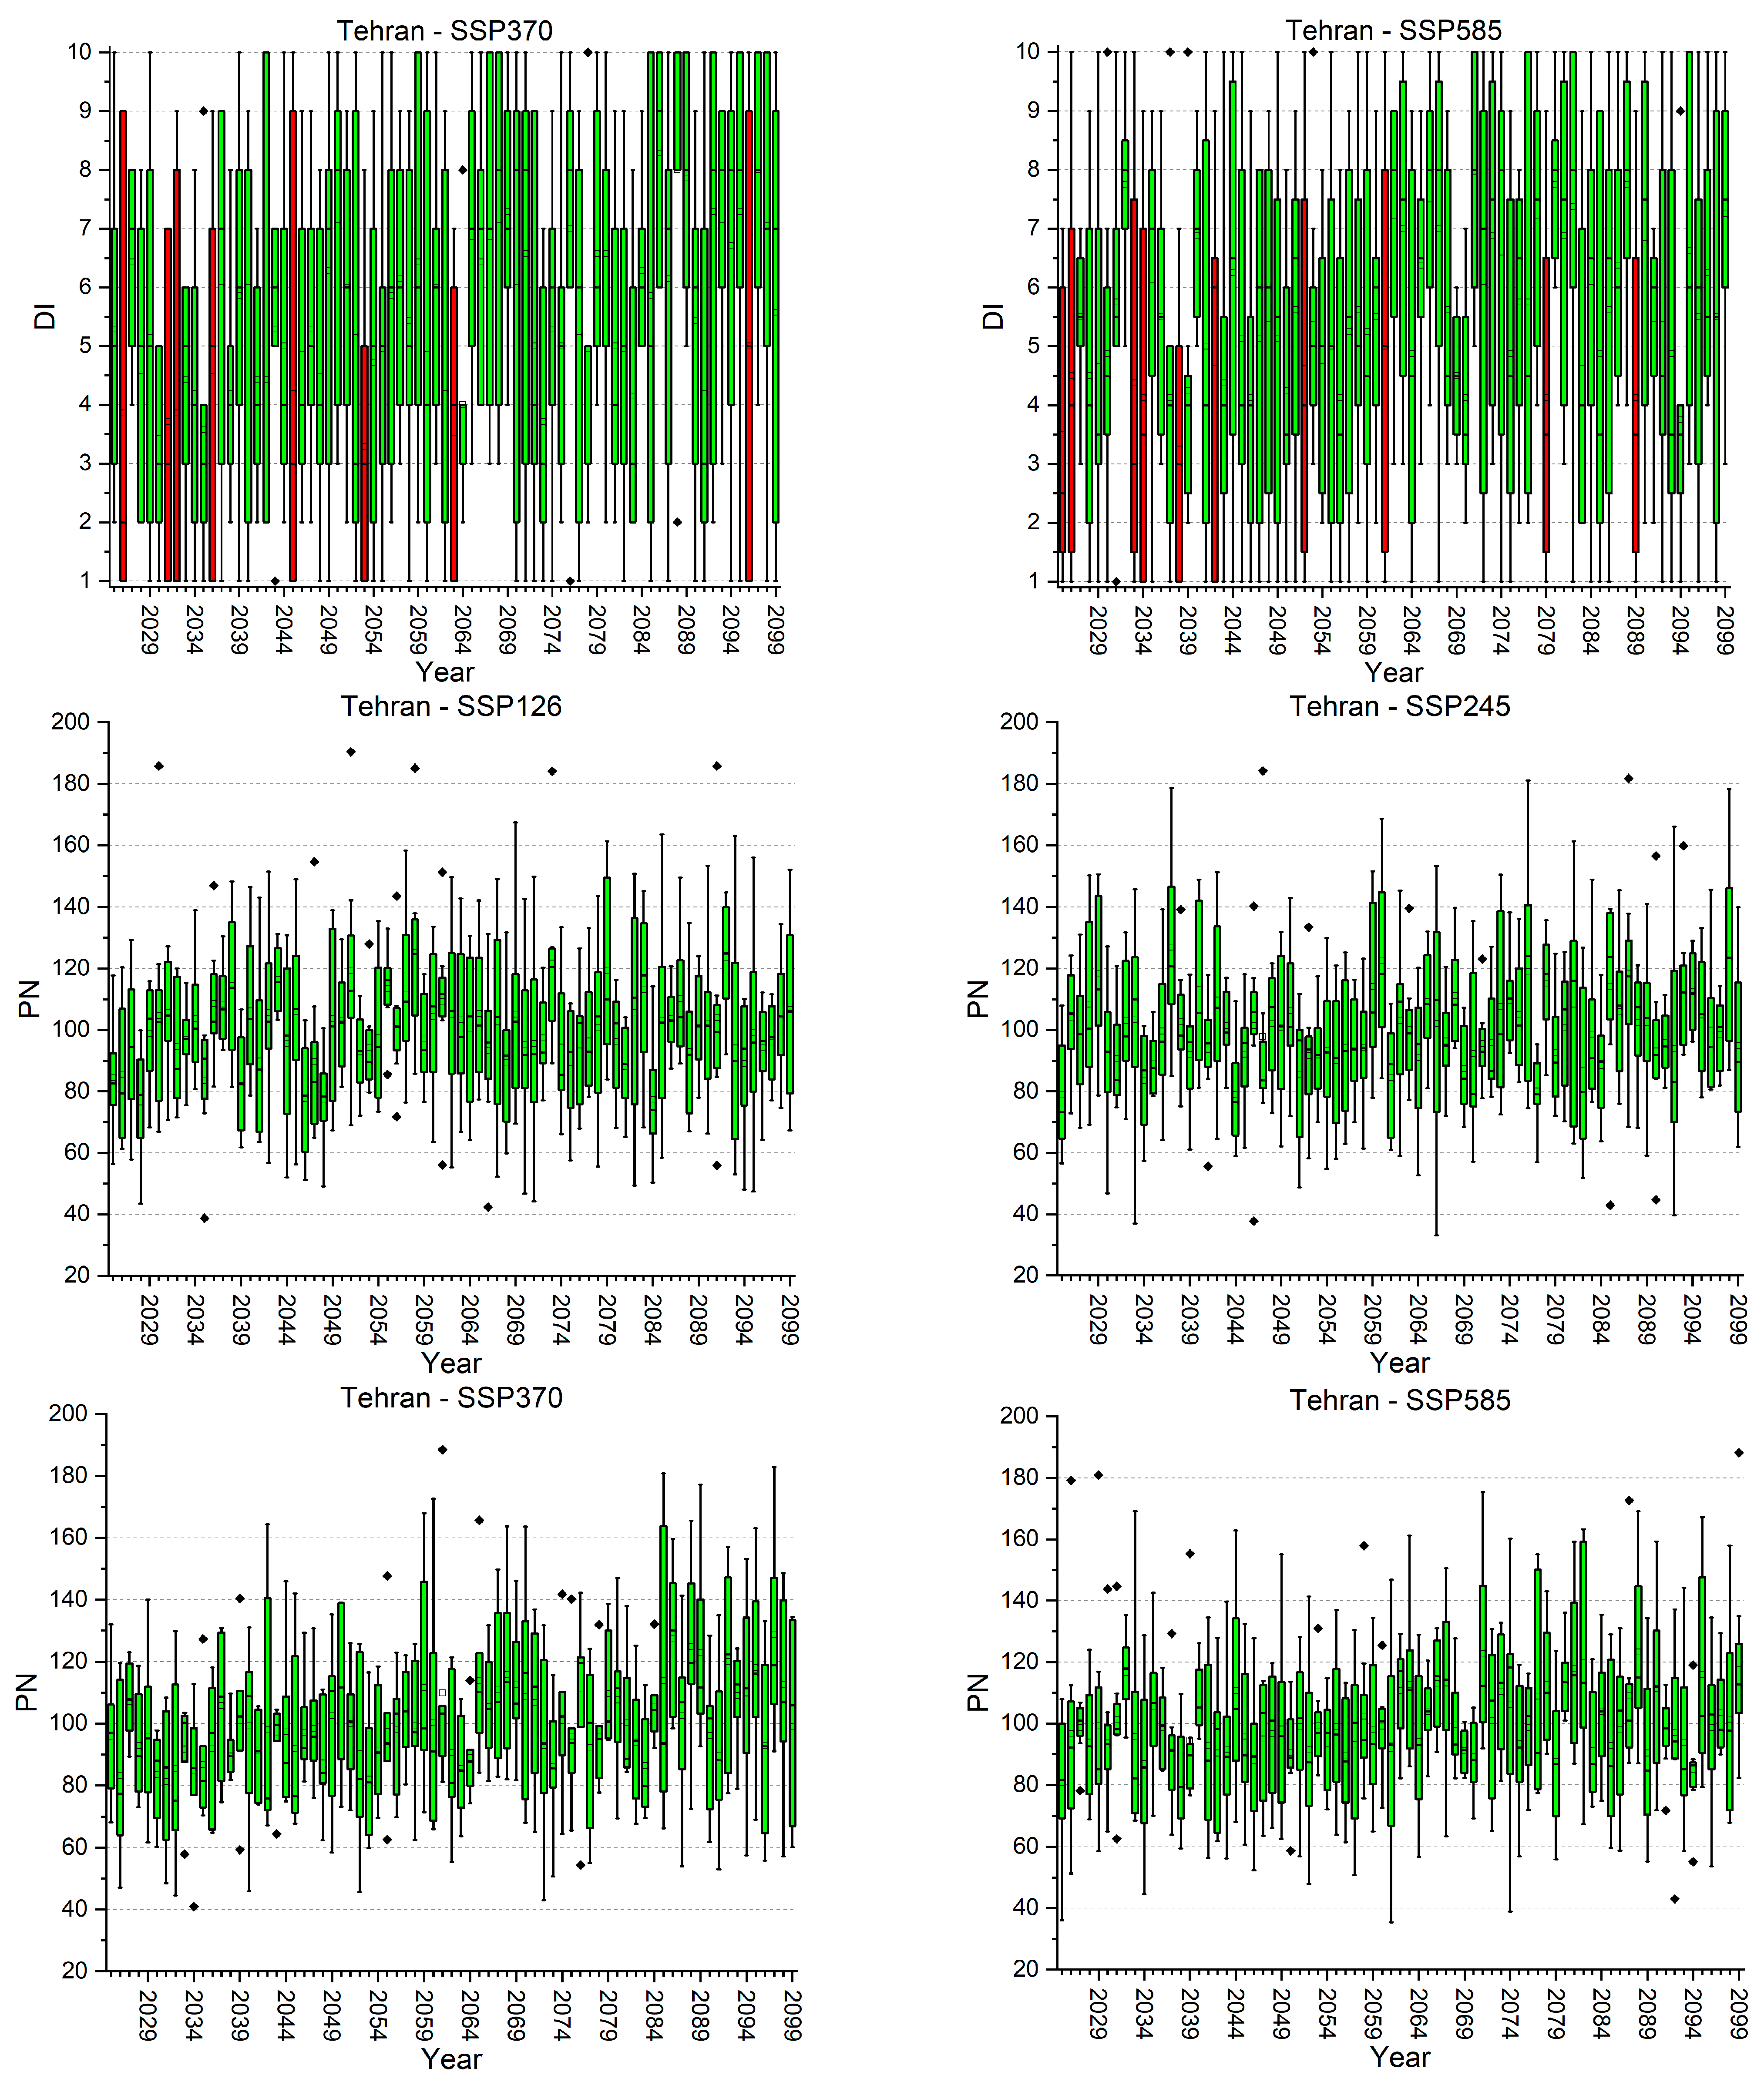
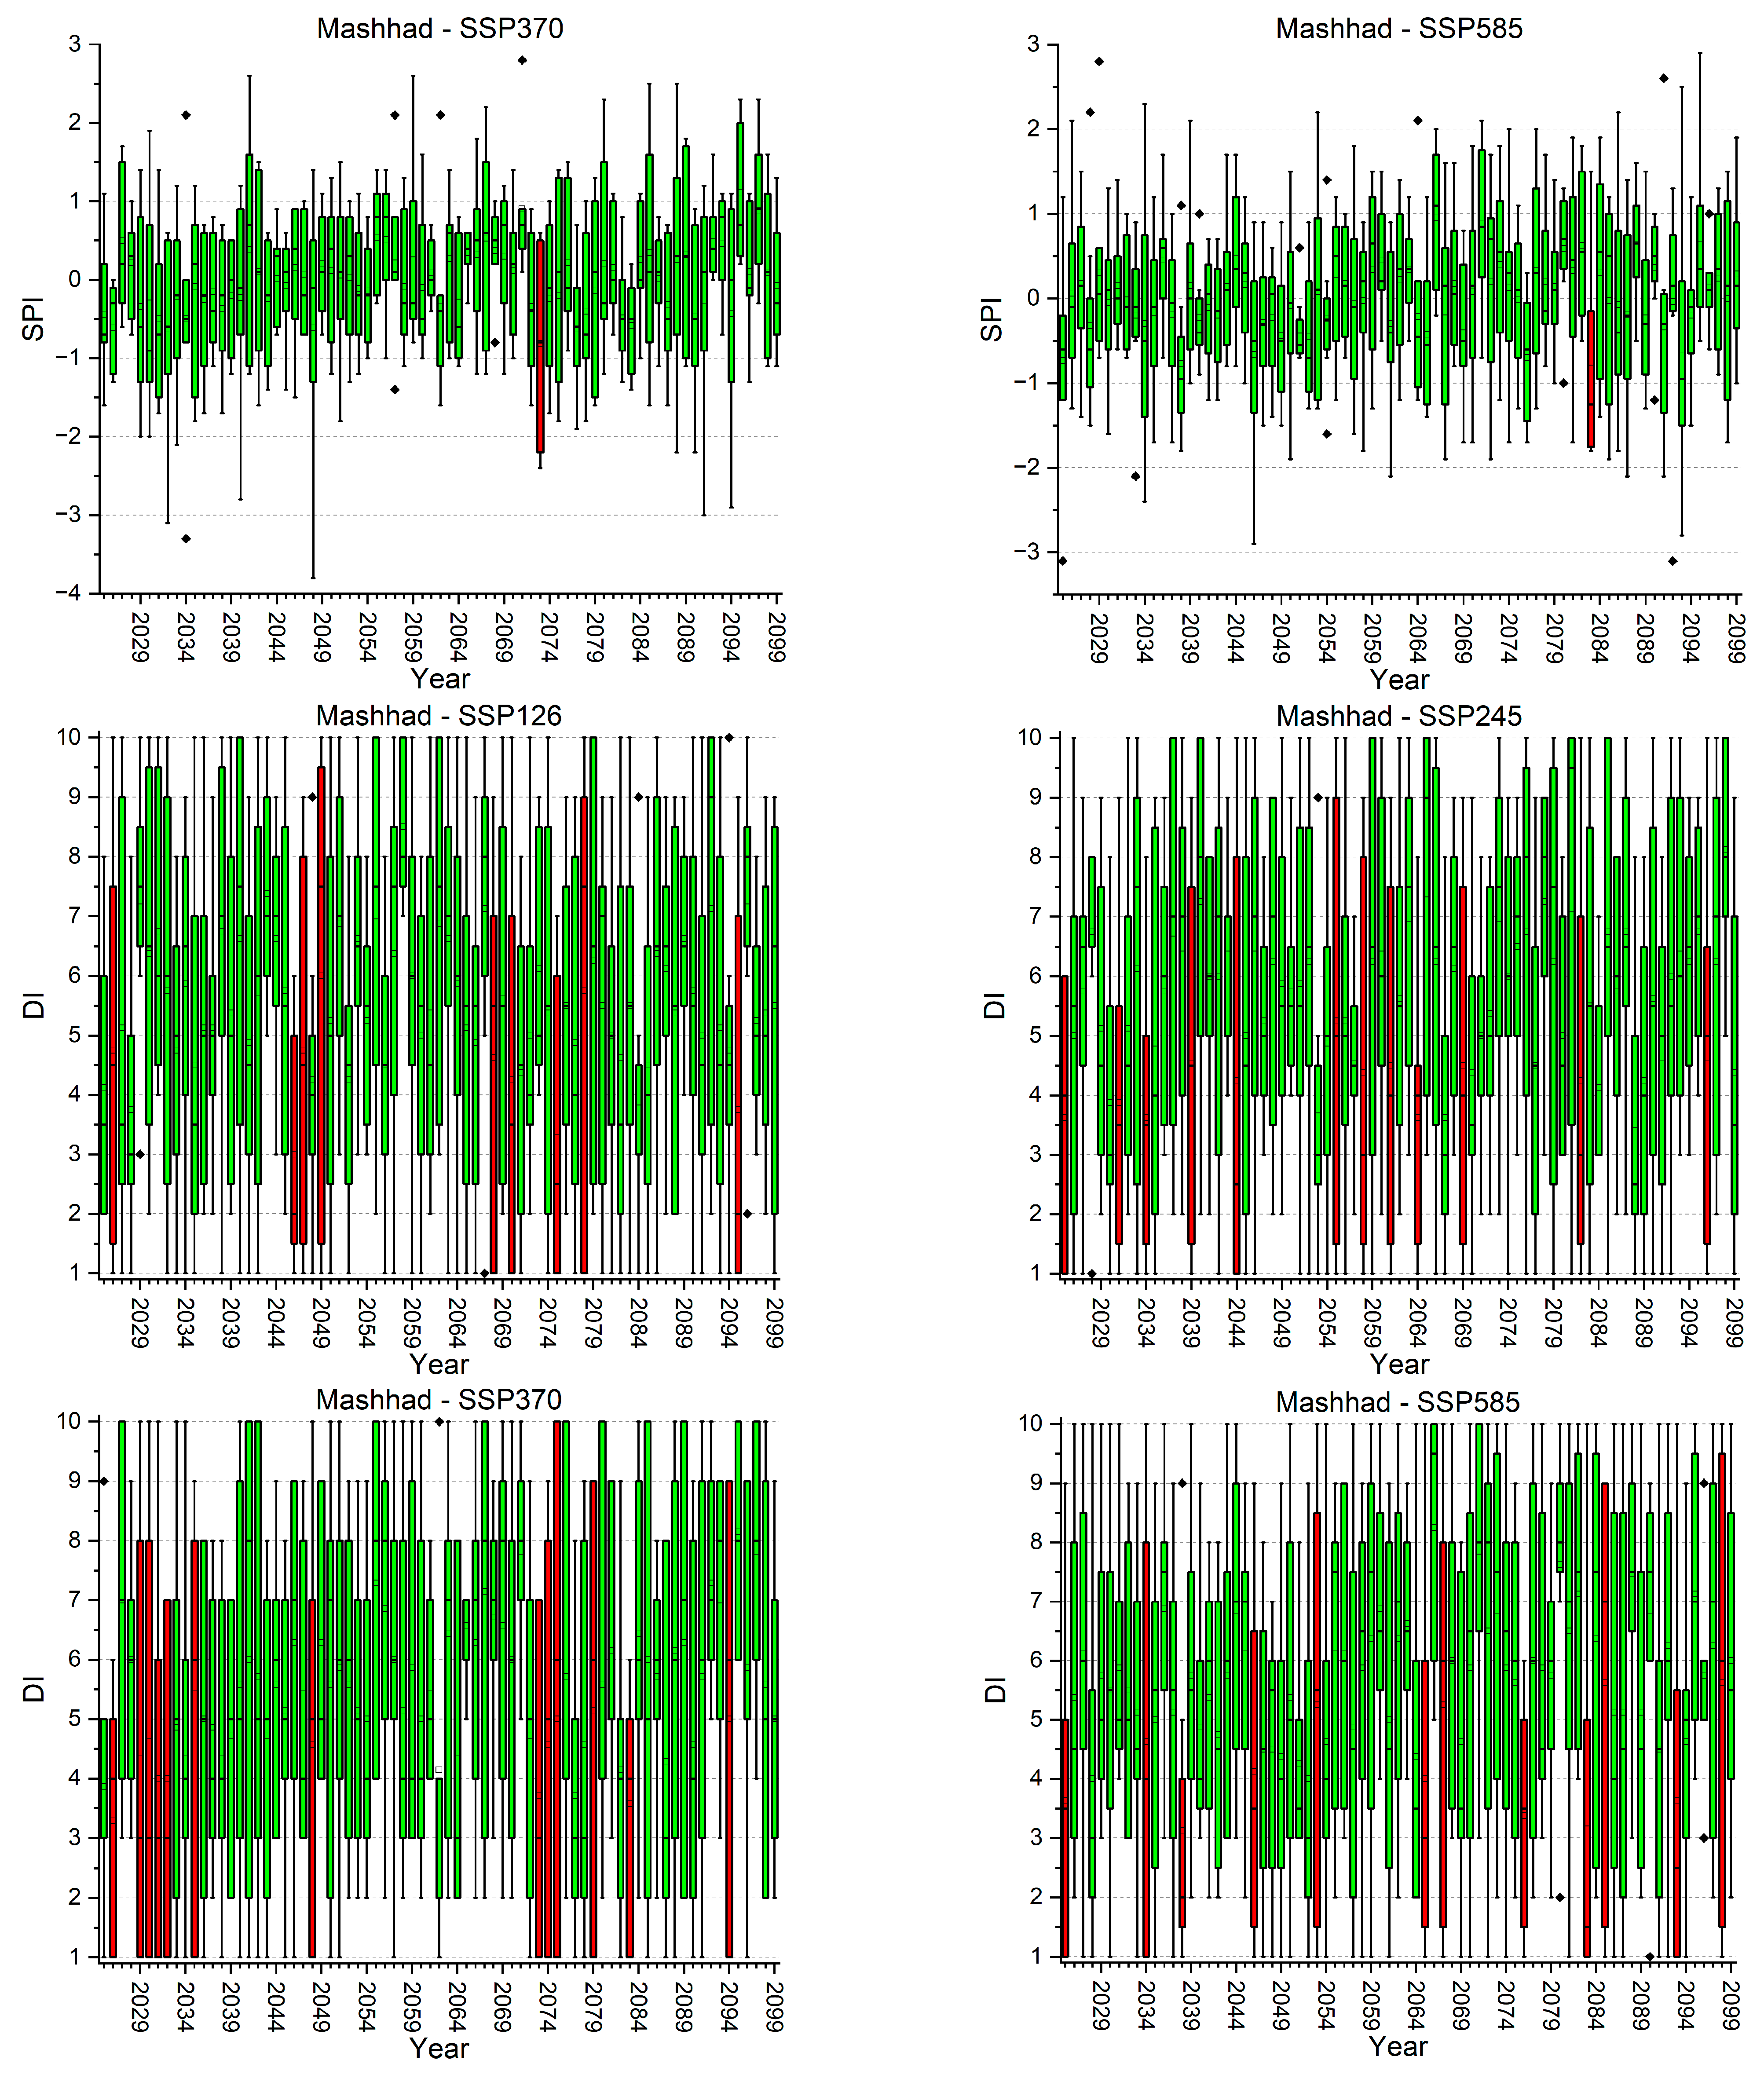
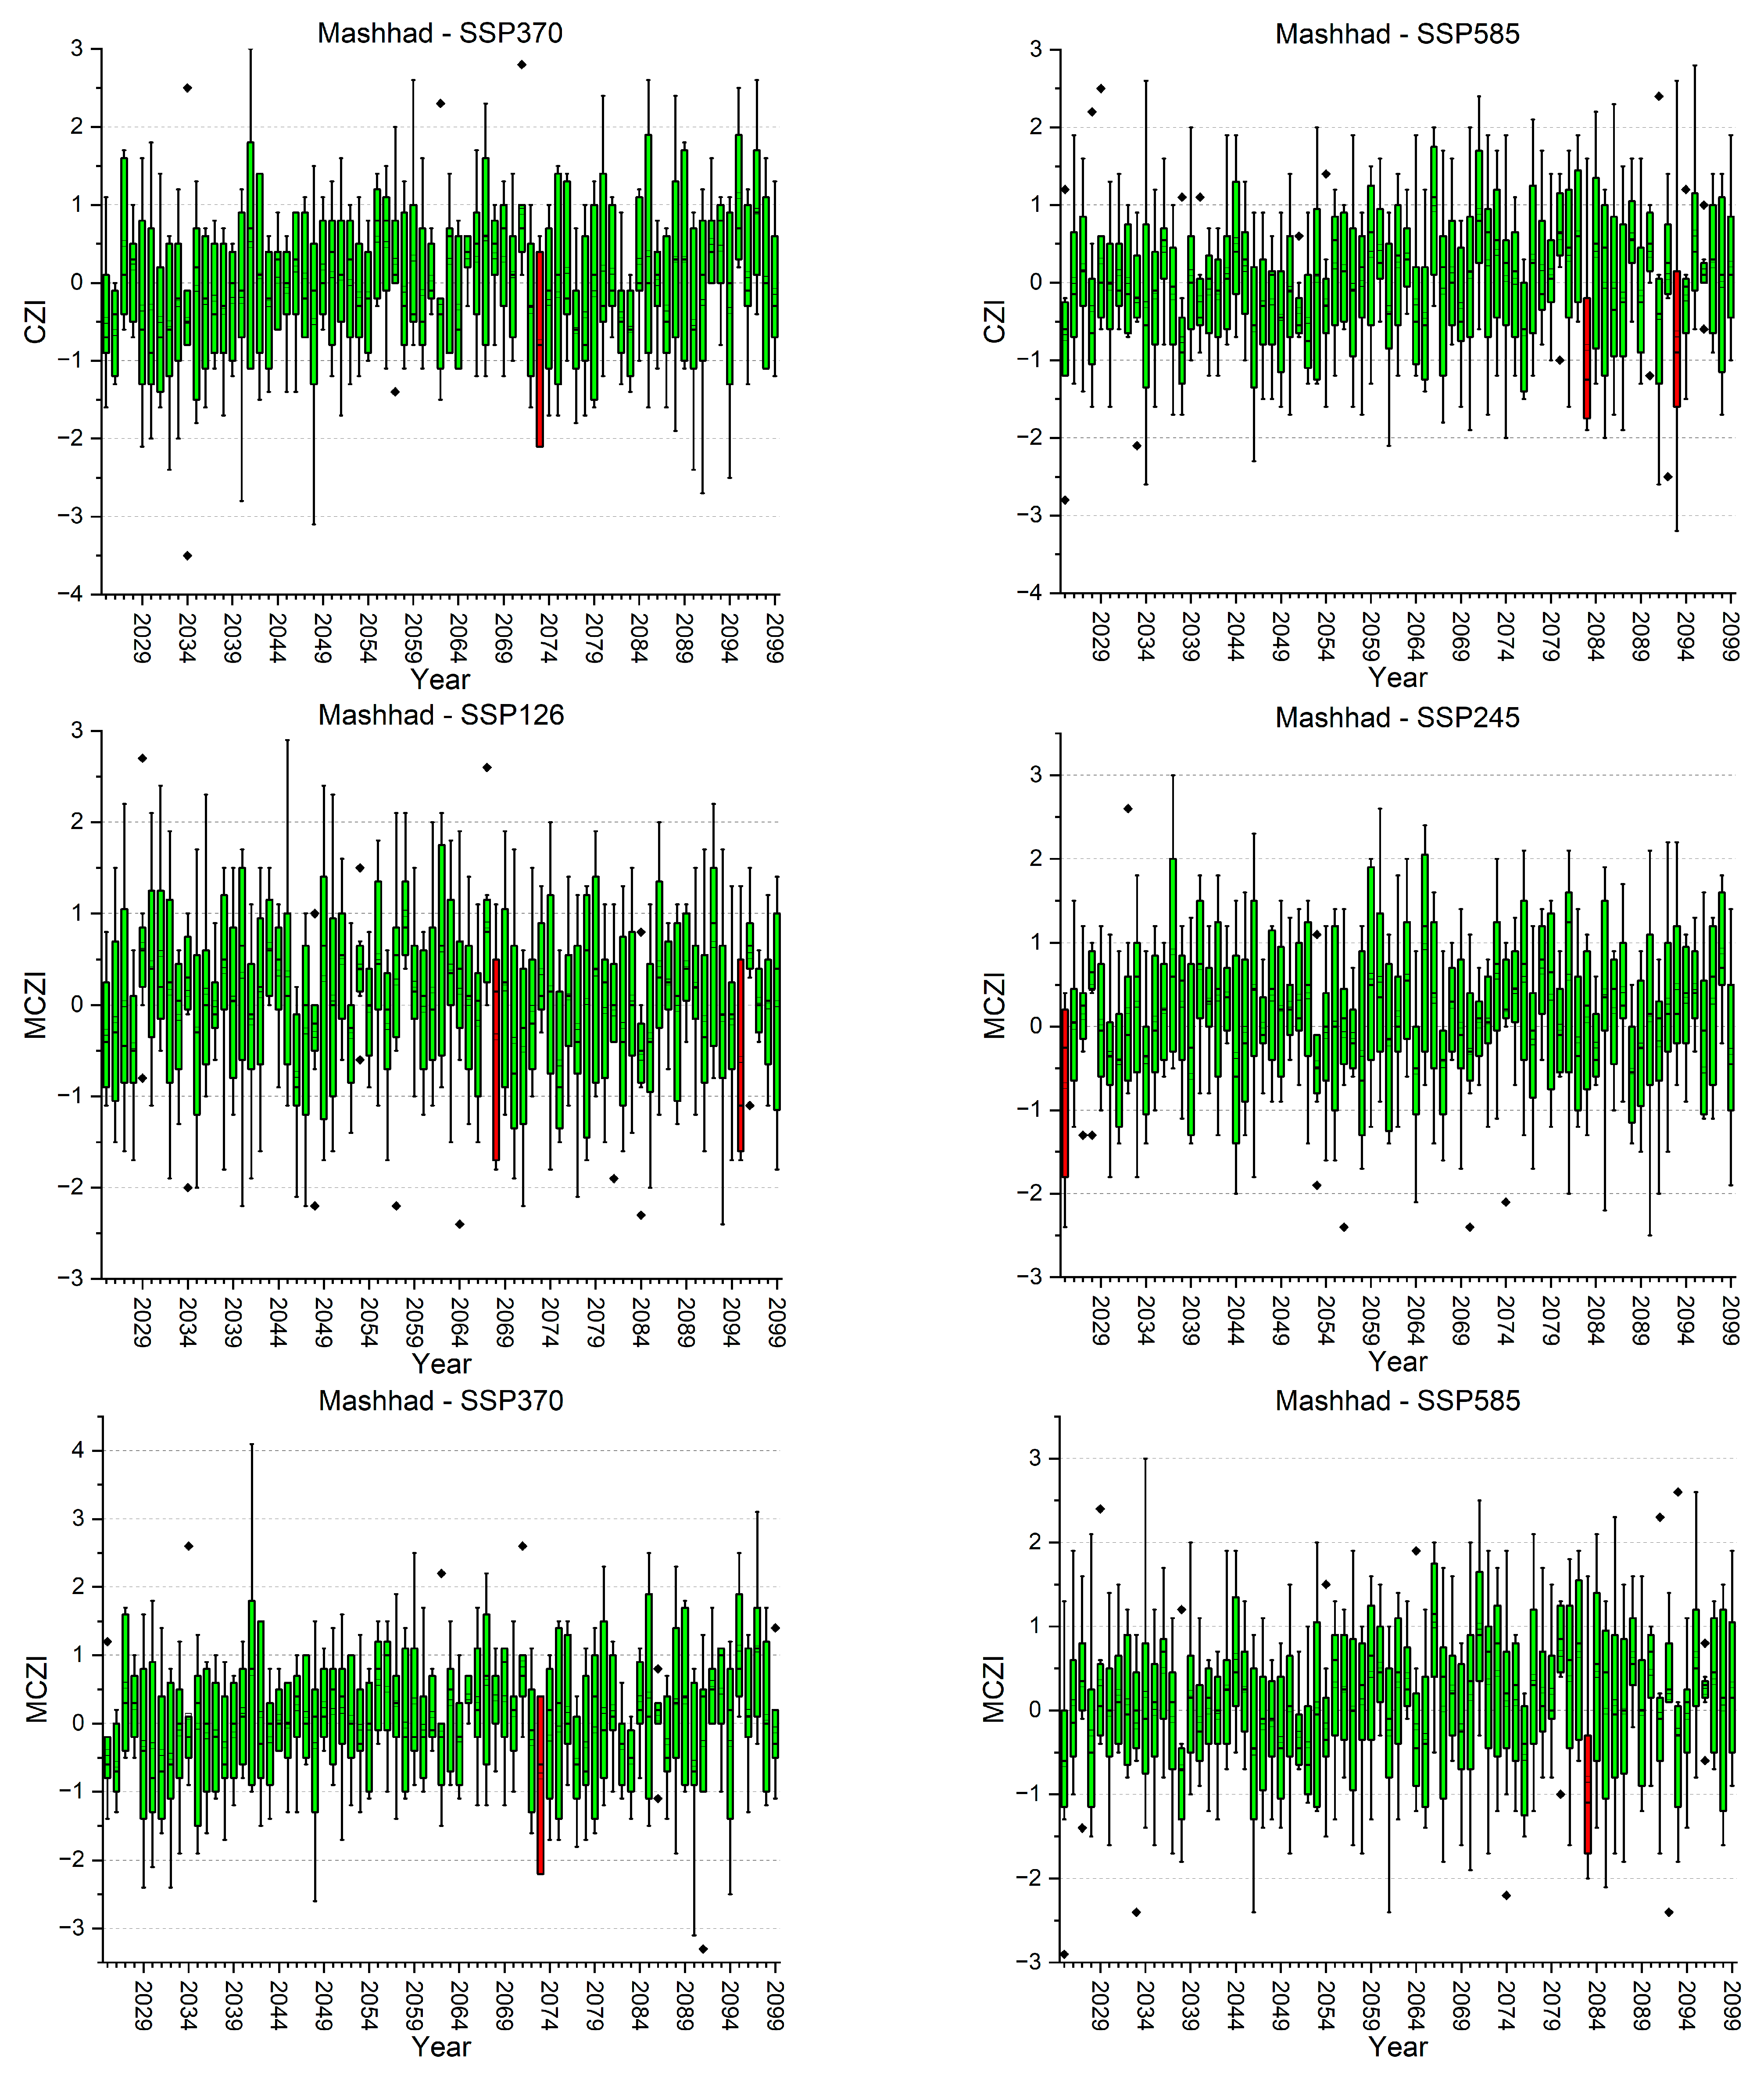
  • SSP370 (Regional Rivalry—A Rocky Road): Mashhad, Isfahan, Shiraz, and Tabriz are marked with critical conditions under SSP370. This scenario assumes higher emissions due to less focus on global policy and more on regional priorities and self-sufficiency. The critical conditions highlighted in these cities indicate a vulnerability to scenarios where international cooperation on climate issues is lower and unilateral national policies dominate, potentially leading to higher emissions and more severe climate impacts.
  • SSP585 (Fossil fuel-fueled Development—Taking the Highway): Particularly critical conditions are evident under SSP585 for Mashhad and Shiraz. SSP585 is a high-emission scenario assuming unmitigated climate change with high energy demand and a heavy reliance on fossil fuels. The severe projections for Mashhad and Shiraz in this scenario suggest these cities could face the most challenging drought conditions, necessitating robust adaptation strategies to combat the potential extreme impacts of climate change.
These findings provide a clear indication of where the efforts to mitigate climate change and adapt to its impacts should be most concentrated. For instance, while Tehran, Karaj, and Tabriz are areas of concern even under the low-emission scenario of SSP126, Mashhad and Shiraz appear consistently across multiple scenarios, highlighting their significant vulnerability to future drought conditions. This information can be used to prioritize investments in adaptive infrastructure, water conservation programs, and policies that encourage sustainable water use to manage future risks effectively.
Furthermore, an in-depth analysis of the climate projections was conducted, encompassing the cumulative number of dry days (days with precipitation < 1 mm), spanning the period from 2025 to 2100, to further analyze the impacts of climate change on Iran’s metropolises. According to Figure 6, Shiraz is projected to experience the highest number of dry days, which suggests that water scarcity could become a critical issue for the city, affecting everything from agriculture to drinking water supplies. After Shiraz, in descending order of severity, Isfahan, Mashhad, Tehran, Karaj, and Tabriz are expected to experience the highest number of dry days.
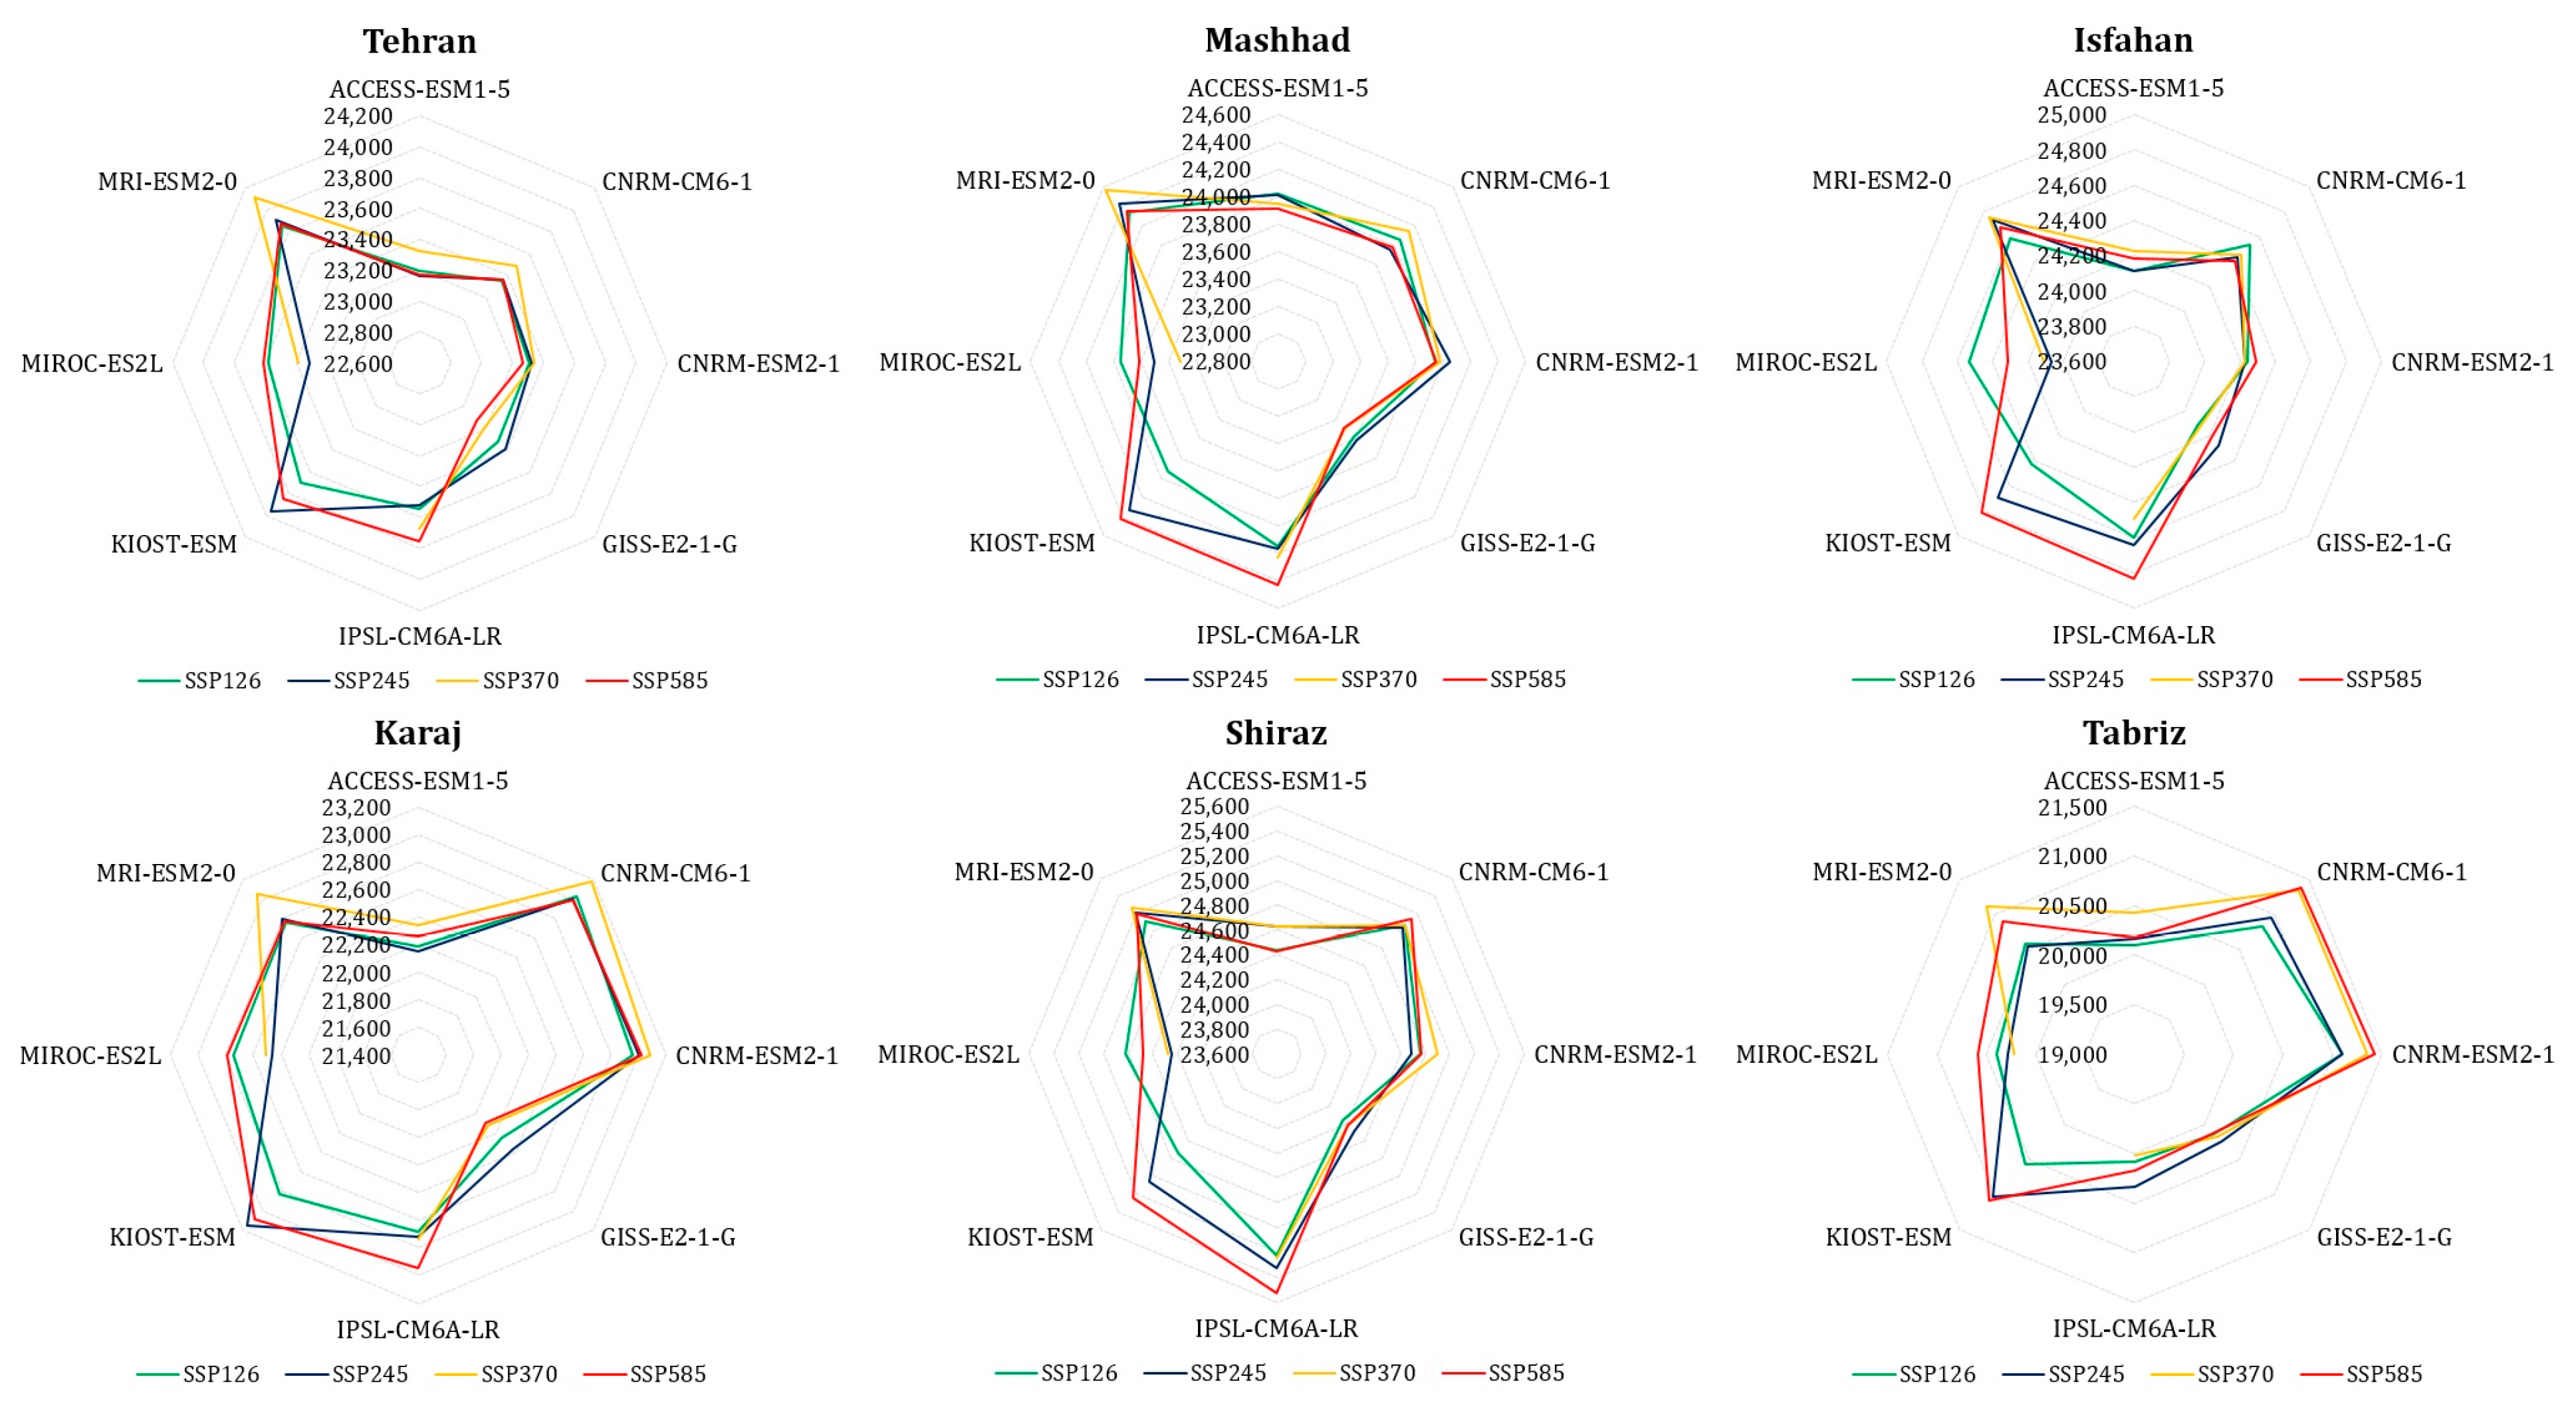
  • Model-wise observations:
    -
    MRI-ESM2-0: This model was shown to predict the highest number of dry days among the GCMs, indicating that its internal parameters may be more sensitive to the drying trends under climate change in Iran.
    -
    CNRM-CM6-1, IPSL-CM6A-LR, CNRM-ESM2-1, MIROC-ES2L, ACCESS-ESM1-5, and GISS-E2-1-G: These models also show a high number of dry days, suggesting agreement among different models about the drying trends, albeit to varying degrees.
    -
    KIOST-ESM: This model predicts fewer dry days compared to the other GCMs.
  • Scenario-wise analysis:
    -
    SSP585 (High-Emission Scenario): On average, this predicts the most severe conditions with the highest number of dry days.
    -
    SSP126 (Low-Emission Scenario): On average, this projects the least severe conditions with the lowest number of dry days.
These findings underscore the need for urgent action to mitigate climate change. Moreover, the consistency across the models in predicting more dry days for certain cities suggests a level of confidence in these projections, making it imperative for policymakers and city planners to develop robust adaptation strategies.
The high number of dry days anticipated for cities such as Shiraz and Isfahan, as highlighted by the climate projections, necessitates immediate attention to water security and climate resilience strategies. These urban centers must explore alternative water sources, bolster water conservation efforts, and integrate sustainable practices within urban planning to mitigate the adverse effects of climate change. Adjustments in agricultural practices, including the selection of crops and farming techniques, will be crucial to maintain productivity in the face of changing precipitation patterns. Additionally, Iran’s metropolises must invest in infrastructure that can adapt to these climatic shifts. Expanding water storage facilities, embracing water recycling methods, and cultivating drought-resistant urban greenery are steps that can enhance the resilience to drought conditions. By proactively addressing these challenges, metropolises can safeguard against water scarcity and ensure a more stable future.
Droughts carry profound implications across various sectors within Iranian cities [66]. The strain on water resources affects not only the daily lives of residents but also the economic vitality of these metropolises. Industries that depend on water are particularly vulnerable, and water scarcity can disrupt both domestic and industrial applications, sometimes necessitating water rationing measures [67]. The agricultural sector is often hit hardest by drought conditions, with reduced crop yields and livestock productivity posing significant threats to food security and the livelihoods of farming communities. The economic strains from such agricultural impacts can ripple throughout the local and national economy [68].
The health of urban populations is also at risk due to drought-induced water scarcity. A lack of an adequate water supply can compromise sanitation and hygiene, leading to an increased incidence of waterborne diseases. Drought conditions can exacerbate nutritional deficits by limiting the availability of fresh produce and clean water [69]. Moreover, severe droughts can have cascading socioeconomic effects, including the displacement of populations. As people migrate from drought-stricken areas to cities with more resources, they bring additional demands on already burdened urban systems, complicating issues of housing, employment, and social services [70]. Environmental degradation is another consequence of prolonged droughts, with soil erosion, biodiversity loss, and desertification altering landscapes and reducing the viability of local ecosystems. Urban green spaces, crucial for maintaining ecological balance and providing residents with recreational areas, are particularly vulnerable [71,72].
The multifaceted impact of droughts in these metropolises underscores the urgent need for comprehensive planning and action to address the myriad challenges posed by climate change. This involves not only adapting to immediate threats but also fostering long-term resilience and sustainability to protect against future environmental uncertainties.

Limitations and Sources of Uncertainty

This study was subject to certain limitations and sources of uncertainty, which are explained below:
-
Model selection and accuracy: This study relied on a subset of GCMs from the CMIP6 series, which might have introduced uncertainty due to differences in model performance in simulating climate patterns.
-
Future scenarios: While this study explored multiple future scenarios, the accuracy of the projections was subject to uncertainties in emission trajectories, socioeconomic development pathways, and climate feedback mechanisms.
-
Drought indices: Although this study employed several drought indices, the choice of indices and their applicability to specific urban contexts might have introduced variability and limitations in assessing drought severity and trends.
-
Data limitations: The accuracy of these findings was contingent upon the availability and quality of input data, which might have varied in completeness and reliability across different cities and time periods.
-
Regional specificity: This study focused solely on six Iranian metropolises, limiting the generalizability of the findings to other regions with distinct climatic, geographical, and socioeconomic characteristics.

4. Conclusions

The imperative pursuit of understanding the impact of climate change on meteorological droughts in metropolitan areas is underscored by the profound consequences such events can have, particularly as cities expand and face increasing pressures. This study delved into the future of six Iranian metropolises (Tehran, Mashhad, Isfahan, Karaj, Shiraz, and Tabriz), and employed 35 GCMs from the CMIP6 series to predict the likelihood of severe droughts from 2025 to 2100. Specifically, the models that demonstrated more accurate historical simulations (ACCESS-ESM1-5, CNRM-CM6-1, CNRM-ESM2-1, GISS-E2-1-G, IPSL-CM6A-LR, KIOST-ESM, MIROC-ES2L, and MRI-ESM2-0) were used to project future climate conditions under varying scenarios (SSP126, SSP245, SSP370, and SSP585). This analysis utilized several drought indices (SPI, DI, PN, CZI, MCZI, RAI, and ZSI) to assess the conditions, generating box plots to visualize the range of drought severities and color-coded heatmaps to depict the probability of severe droughts, thus guiding the preemptive measures for sustainable development and resource management. This study’s findings, highlighting varying degrees of drought risk across the different cities and scenarios, serve as a crucial resource for policymakers. For instance, even under the low-emission SSP126 scenario, Tehran, Karaj, and Tabriz show a concerning susceptibility to drought, necessitating proactive adaptation strategies. The SSP245 and SSP370 scenarios paint a more dire picture for Isfahan and Shiraz, while the high-emission SSP585 scenario suggests that Mashhad and Shiraz could face the most severe drought conditions, underscoring the need for robust mitigation efforts. By examining drought patterns using the indices, this study indicates a clear trend towards greater aridity, which is especially marked under the high-emission scenario. These insights offer an invaluable tool for policymakers, urban planners, and stakeholders at all levels. They provide a clear-eyed view of the potential future that awaits if proactive steps are not taken, enabling informed decisions that can enhance the resilience of these cities. By offering scenario-specific forecasts, this study equips decision-makers with the data necessary to tailor their strategies to the unique vulnerabilities of each city, ensuring that adaptation and mitigation efforts are both efficient and effective in confronting the looming specter of climate-induced aridity. To advance this field of research, it is recommended that future studies consider the following:
  • Delve into the socioeconomic impact of severe droughts on the populations of these cities, analyzing how livelihoods, health, and local economies may be affected.
  • Examine adaptive strategies and policies that can effectively alleviate the impact of droughts in urban settings, focusing on best practices for water use, urban planning, and community engagement.
  • Evaluate the feasibility and efficacy of innovative water management and conservation techniques within these metropolitan areas to address the anticipated drought scenarios.
  • Investigate the potential for technological advancements, such as drought prediction tools or water recycling systems, to improve resilience.
  • Consider the role of education and public awareness programs in promoting water-saving behaviors and supporting policy implementation.
  • Assess the interplay between urban development patterns and drought vulnerability, aiming to integrate climate resilience into future urban planning.
Understanding these facets will empower local authorities to allocate resources with greater efficiency and reinforce the sustainability and adaptability of their cities, equipping them to better withstand climate-induced water scarcity.

Author Contributions

Conceptualization, M.N.-S. and R.A.; methodology, M.N.-S. and R.A.; software, M.N.-S.; validation, M.N.-S., A.H. and R.A.; resources, M.N.-S.; writing—original draft preparation, M.N.-S.; writing—review and editing, M.N.-S., R.A., A.H. and M.K.; and supervision, R.A., A.H. and M.K. All authors have read and agreed to the published version of the manuscript.

Funding

This research received no external funding.

Data Availability Statement

The data presented in this study are available on request from the corresponding author.

Conflicts of Interest

The authors declare no conflicts of interest.

Appendix A

The following box plots show the drought index values, based on the SPI, DI, PN, CZI, MCZI, RAI, and ZSI indices, for Tehran, Mashhad, Isfahan, Karaj, Shiraz, and Tabriz, under the SSP126, SSP245, SSP370, and SSP585 scenarios. Water 16 00711 i001aWater 16 00711 i001bWater 16 00711 i001cWater 16 00711 i001dWater 16 00711 i001eWater 16 00711 i001fWater 16 00711 i001gWater 16 00711 i001hWater 16 00711 i001iWater 16 00711 i001jWater 16 00711 i001kWater 16 00711 i001lWater 16 00711 i001mWater 16 00711 i001nWater 16 00711 i001oWater 16 00711 i001pWater 16 00711 i001qWater 16 00711 i001rWater 16 00711 i001sWater 16 00711 i001tWater 16 00711 i001uWater 16 00711 i001vWater 16 00711 i001wWater 16 00711 i001xWater 16 00711 i001yWater 16 00711 i001zWater 16 00711 i001aaWater 16 00711 i001bb

References

  1. Mao, Y.; Wu, Z.; He, H.; Lu, G.; Xu, H.; Lin, Q. Spatio-temporal analysis of drought in a typical plain region based on the soil moisture anomaly percentage index. Sci. Total Environ. 2017, 576, 752–765. [Google Scholar] [CrossRef]
  2. Zhang, X.; Hao, Z.; Singh, V.P.; Zhang, Y.; Feng, S.; Xu, Y.; Hao, F. Drought propagation under global warming: Characteristics, approaches, processes, and controlling factors. Sci. Total Environ. 2022, 838 Pt 2, 156021. [Google Scholar] [CrossRef]
  3. Qiu, J.; Shen, Z.; Xie, H. Drought impacts on hydrology and water quality under climate change. Sci. Total Environ. 2023, 858 Pt 1, 159854. [Google Scholar] [CrossRef]
  4. IPCC. Climate Change 2021: The Physical Science Basis. Contribution of Working Group I to the Sixth Assessment Report of the Intergovernmental Panel on Climate Change, Cambridge University Press: Cambridge, UK; New York, NY, USA, 2021; in press.
  5. IPCC. Climate Change 2014: Synthesis Report. Contribution of Working Groups I, II and III to the Fifth Assessment Report of the Intergovernmental Panel on Climate Change; Cambridge University Press: Cambridge, UK; New York, NY, USA, 2014. [Google Scholar]
  6. Pedro-Monzonís, M.; Solera, A.; Ferrer, J.; Estrela, T.; Paredes-Arquiola, J. A review of water scarcity and drought indexes in water resources planning and management. J. Hydrol. 2015, 527, 482–493. [Google Scholar] [CrossRef]
  7. Zhou, Z.; Tu, X.; Wang, T.; Singh, V.P.; Chen, X.; Lin, K. Bivariate socioeconomic drought assessment based on a hybrid framework and impact of human activities. J. Clean. Prod. 2023, 409, 137150. [Google Scholar] [CrossRef]
  8. Ahn, S.R.; Jeong, J.H.; Kim, S.J. Assessing drought threats to agricultural water supplies under climate change by combining the SWAT and MODSIM models for the Geum River basin, South Korea. Hydrol. Sci. J. 2016, 61, 2740–2753. [Google Scholar] [CrossRef]
  9. Deng, L.; Peng, C.; Kim, D.; Li, J.; Liu, Y.; Hai, X.; Liu, Q.; Huang, C.; Shangguan, Z.; Kuzyakov, Y. Drought effects on soil carbon and nitrogen dynamics in global natural ecosystems. Earth Sci. Rev. 2021, 214, 103501. [Google Scholar] [CrossRef]
  10. Lisboa, M.S.; Schneider, R.L.; Sullivan, P.J.; Walter, M.T. Drought and post-drought rain effect on stream phosphorus and other nutrient losses in the northeastern USA. J. Hydrol. Region. Stud. 2020, 28, 100672. [Google Scholar] [CrossRef]
  11. Mishra, A.; Alnahit, A.; Campbell, B. Impact of land uses, drought, flood, wildfire, and cascading events on water quality and microbial communities: A review and analysis. J. Hydrol. 2021, 596, 125707. [Google Scholar] [CrossRef]
  12. Khan, S.J.; Deere, D.; Leusch, F.D.L.; Humpage, A.; Jenkins, M.; Cunliffe, D. Extreme weather events: Should drinking water quality management systems adapt to changing risk profiles? Water Res. 2015, 85, 124–136. [Google Scholar] [CrossRef]
  13. Zittis, G.; Almazroui, M.; Alpert, P.; Ciais, P.; Cramer, W.; Dahdal, Y.; Fnais, M.; Francis, D.; Hadjinicolaou, P.; Howari, F.; et al. Climate change and weather extremes in the Eastern Mediterranean and Middle East. Rev. Geophys. 2022, 60, e2021RG000762. [Google Scholar] [CrossRef]
  14. Isinkaralar, O. Spatio-temporal patterns of climate parameter changes in Western Mediterranean basin of Türkiye and implications for urban planning. Air Qual. Atmos. Health 2023, 16, 2351–2363. [Google Scholar] [CrossRef]
  15. Weifeng, L.; Junran, L.; Liang, H.; Jingqiao, M.; Lijian, H. Future climate change and urban growth together affect surface runoff in a large-scale urban agglomeration. Sustain. Cities Soc. 2023, 99, 104970. [Google Scholar] [CrossRef]
  16. Elbeltagi, A.; Kumar, M.; Kushwaha, N.L.; Pande, C.B.; Ditthakit, P.; Vishwakarma, D.K. Drought indicator analysis and forecasting using data driven models: Case study in Jaisalmer, India. Stoch. Environ. Res. Risk Assess. 2023, 37, 113–131. [Google Scholar] [CrossRef]
  17. Pande, C.B.; Al-Ansari, N.; Kushwaha, N.L.; Srivastava, A.; Noor, R.; Kumar, M.; Moharir, K.N.; Elbeltagi, A. Forecasting of SPI and Meteorological Drought Based on the Artificial Neural Network and M5P Model Tree. Land 2022, 11, 2040. [Google Scholar] [CrossRef]
  18. Shah, R.; Bharadiya, N.; Manekar, V. Drought Index Computation Using Standardized Precipitation Index (SPI) Method for Surat District, Gujarat. Aquat. Procedia 2015, 4, 1243–1249. [Google Scholar] [CrossRef]
  19. Merabti, A.; Darouich, H.; Paredes, P.; Meddi, M.; Pereira, L.S. Assessing Spatial Variability and Trends of Droughts in Eastern Algeria Using SPI, RDI, PDSI, and MedPDSI—A Novel Drought Index Using the FAO56 Evapotranspiration Method. Water 2023, 15, 626. [Google Scholar] [CrossRef]
  20. Zaki, M.K.; Noda, K. A Systematic Review of Drought Indices in Tropical Southeast Asia. Atmosphere 2022, 13, 833. [Google Scholar] [CrossRef]
  21. Hooshyaripor, F.; Sardari, J.; Dehghani, M.; Noori, R. A new concept of drought feeling against the meteorological drought. Sci. Rep. 2022, 12, 16711. [Google Scholar] [CrossRef]
  22. Ault, T.R. On the essentials of drought in a changing climate. Science 2020, 368, 256–260. [Google Scholar] [CrossRef]
  23. Cheng, Q.; Gao, L.; Zhong, F.; Zuo, X.; Ma, M. Spatiotemporal variations of drought in the Yunnan-Guizhou Plateau, southwest China, during 1960–2013 and their association with large-scale circulations and historical records. Ecol. Indic. 2020, 112, 106041. [Google Scholar] [CrossRef]
  24. Mathbout, S.; Lopez-Bustins, J.A.; Martin-Vide, J.; Bech, J.; Rodrigo, F.S. Spatial and temporal analysis of drought variability at several time scales in Syria during 1961–2012. Atmos. Res. 2018, 200, 153–168. [Google Scholar] [CrossRef]
  25. Jiang, P.; Yang, Z.; Wang, J.; Huang, C.; Xue, P.; Chakraborty, T.C.; Chen, X.; Qian, Y. Efficient super-resolution of near-surface climate modeling using the Fourier neural operator. J. Adv. Model. Earth Syst. 2023, 15, e2023MS003800. [Google Scholar] [CrossRef]
  26. Ferreira, G.W.d.S.; Reboita, M.S.; Ribeiro, J.G.M.; de Souza, C.A. Assessment of Precipitation and Hydrological Droughts in South America through Statistically Downscaled CMIP6 Projections. Climate 2023, 11, 166. [Google Scholar] [CrossRef]
  27. Yao, N.; Li, L.; Feng, P.; Feng, H.; Liu, D.L.; Liu, Y.; Jiang, K.; Hu, X.; Li, Y. Projections of drought characteristics in China based on a standardized precipitation and evapotranspiration index and multiple GCMs. Sci. Total Environ. 2020, 704, 135245. [Google Scholar] [CrossRef] [PubMed]
  28. Al-Kafy, A.; Bakshi, A.; Saha, M.; Al-Faisal, A.; Almulhim, A.I.; Rahaman, Z.A.; Mohammad, P. Assessment and prediction of index based agricultural drought vulnerability using machine learning algorithms. Sci. Total Environ. 2023, 867, 161394. [Google Scholar] [CrossRef]
  29. Hameed, M.M.; Razali, S.F.M.; Mohtar, W.H.M.W.; Rahman, N.A.; Yaseen, Z.M. Machine learning models development for accurate multi-months ahead drought forecasting: Case study of the Great Lakes, North America. PLoS ONE 2023, 18, e0290891. [Google Scholar] [CrossRef] [PubMed]
  30. Eini, M.R.; Najminejad, F.; Piniewski, M. Direct and indirect simulating and projecting hydrological drought using a supervised machine learning method. Sci. Total Environ. 2023, 898, 165523. [Google Scholar] [CrossRef]
  31. Mullapudi, A.; Vibhute, A.D.; Mali, S.; Patil, C.H. A review of agricultural drought assessment with remote sensing data: Methods, issues, challenges and opportunities. Appl. Geomat. 2023, 15, 1–13. [Google Scholar] [CrossRef]
  32. Wang, F.; Lai, H.; Li, Y.; Feng, K.; Tian, Q.; Guo, W.; Zhang, W.; Di, D.; Yang, H. Dynamic variations of terrestrial ecological drought and propagation analysis with meteorological drought across the mainland China. Sci. Total Environ. 2023, 896, 165314. [Google Scholar] [CrossRef]
  33. Islamic Republic of Iran Meteorological Organization. Available online: https://www.irimo.ir (accessed on 8 April 2023).
  34. Nazari-Sharabian, M.; Taheriyoun, M.; Ahmad, S.; Karakouzian, M.; Ahmadi, A. Water Quality Modeling of Mahabad Dam Watershed–Reservoir System under Climate Change Conditions, Using SWAT and System Dynamics. Water 2019, 11, 394. [Google Scholar] [CrossRef]
  35. NASA. Earth Exchange Global Daily Downscaled Projections (NEX-GDDP-CMIP6) Portal. Available online: https://www.nccs.nasa.gov/services/data-collections/land-based-products/nex-gddp-cmip6 (accessed on 8 April 2023).
  36. Riahi, K.; van Vuuren, D.P.; Kriegler, E.; Edmonds, J.; O’Neill, B.C.; Fujimori, S.; Bauer, N.; Calvin, K.; Dellink, R.; Fricko, O.; et al. The Shared Socioeconomic Pathways and their energy, land use, and greenhouse gas emissions implications: An overview. Glob. Environ. Chang. 2017, 42, 153–168. [Google Scholar] [CrossRef]
  37. Singh, U.; Agarwal, P.; Sharma, P.K. Meteorological drought analysis with different indices for the Betwa River basin, India. Theor. Appl. Climatol. 2022, 148, 1741–1754. [Google Scholar] [CrossRef]
  38. McKee, T.B.; Doesken, N.J.; Kleist, J. The relationship of drought frequency and duration to time scales. In Proceedings of the 8th Conference on Applied Climatology, Anaheim, CA, USA, 17–22 January 1993; Volume 17, pp. 179–183. [Google Scholar]
  39. Wu, H.; Hayes, M.J.; Weiss, A.; Hu, Q. An evaluation of the Standardized Precipitation Index, the China-Z Index and the statistical Z-Score. Int. J. Climatol. J. R. Meteorol. Soc. 2001, 21, 745–758. [Google Scholar] [CrossRef]
  40. Gibbs, W.J.; Maher, J.V. Rainfall Deciles as Drought Indicators, Bureau of Meteorology Bulletin No. 48; Commonwealth of Australia: Melbourne, Australia, 1967; p. 29. [Google Scholar]
  41. Natarajan, N.; Vasudevan, M.; Ahash Raja, S.; Mohanpradaap, K.; Sneha, G.; Joshna Shanu, S. An assessment methodology for drought severity and vulnerability using precipitation-based indices for the arid, semi-arid and humid districts of Tamil Nadu, India. Water Supply 2023, 23, 54–79. [Google Scholar] [CrossRef]
  42. Willeke, G.; Hosking, J.R.M.; Wallis, J.R.; Guttman, N.B. The National Drought Atlas; Institute for Water Resources Report: Alexandria, VA, USA, 1994; Volume 94. [Google Scholar]
  43. Wilson, E.B.; Hilferty, M.M. The distribution of chi-square. Proc. Natl. Acad. Sci. USA 1931, 17, 684–688. [Google Scholar] [CrossRef]
  44. Van Rooy, M.P. A rainfall anomaly index independent of time and space. NOTOS 1965, 14, 43–48. [Google Scholar]
  45. Mann, H.B. Non-Parametric Test against Trend. Econometrica 1945, 13, 245–259. [Google Scholar] [CrossRef]
  46. Kendall, M.G. Rank Correlation Methods, 4th ed.; Charles Griffin: London, UK, 1975. [Google Scholar]
  47. Hipel, K.W.; McLeod, A.I. Time Series Modelling of Water Resources and Environmental Systems; Elsevier: Amsterdam, The Netherlands, 1994. [Google Scholar]
  48. Agbo, E.P.; Nkajoe, U.; Edet, C.O. Comparison of Mann–Kendall and Şen’s innovative trend method for climatic parameters over Nigeria’s climatic zones. Clim. Dyn. 2023, 60, 3385–3401. [Google Scholar] [CrossRef]
  49. Helsel, D.R.; Frans, L.M. Regional Kendall Test for Trend. Environ. Sci. Technol. 2006, 40, 4066–4073. [Google Scholar] [CrossRef]
  50. Stefanidis, S.; Rossiou, D.; Proutsos, N. Drought Severity and Trends in a Mediterranean Oak Forest. Hydrology 2023, 10, 167. [Google Scholar] [CrossRef]
  51. Khanmohammadi, N.; Rezaie, H.; Behmanesh, J. Investigation of Drought Trend on the Basis of the Best Obtained Drought Index. Water Resour. Manag. 2022, 36, 1355–1375. [Google Scholar] [CrossRef]
  52. Nash, J.E.; Sutcliffe, J.V. River flow forecasting through conceptual models part I—A discussion of principles. J. Hydrol. 1970, 10, 282–290. [Google Scholar] [CrossRef]
  53. Krause, P.; Boyle, D.P.; Base, F. Comparison of different efficiency criteria for hydrologic models. Adv. Geosci. 2005, 5, 89–97. [Google Scholar] [CrossRef]
  54. Nazari-Sharabian, M.; Taheriyoun, M. Climate Change Impact on Water Quality in the Integrated Mahabad Dam Watershed-Reservoir System. J. Hydro-Environ. Res. 2020, 40, 28–37. [Google Scholar] [CrossRef]
  55. Shojaei, S.M.; Vahabpour, A.; Saifoddin, A.A.; Ghasempour, R. Estimation of greenhouse gas emissions from Iran’s gas flaring by using satellite data and combustion equations. Integr. Environ. Assess. Manag. 2023, 19, 735–748. [Google Scholar] [CrossRef] [PubMed]
  56. Rashid, H.A. Forced changes in El Niño–Southern Oscillation due to global warming and the associated uncertainties in Access-ESM1.5 large ensembles. Front. Clim. 2022, 4, 954449. [Google Scholar] [CrossRef]
  57. Nooni, I.K.; Hagan, D.F.T.; Ullah, W.; Lu, J.; Li, S.; Prempeh, N.A.; Gnitou, G.T.; Lim Kam Sian, K.T.C. Projections of Drought Characteristics Based on the CNRM-CM6 Model over Africa. Agriculture 2022, 12, 495. [Google Scholar] [CrossRef]
  58. Tang, J.; Zhao, X. Forecasting the combined effects of future climate and land use change on the suitable habitat of Davidia involucrata Baill. Ecol. Evol. 2022, 12, e9023. [Google Scholar] [CrossRef] [PubMed]
  59. Nazarenko, L.S.; Tausnev, N.; Russell, G.L.; Rind, D.; Miller, R.L.; Schmidt, G.A.; Bauer, S.E.; Kelley, M.; Ruedy, R.; Ackerman, A.S.; et al. Future climate change under SSP emission scenarios with GISS-E2.1. J. Adv. Model. Earth Syst. 2022, 14, e2021MS002871. [Google Scholar] [CrossRef]
  60. Noyelle, R.; Yiou, P.; Faranda, D. Investigating the typicality of the dynamics leading to extreme temperatures in the IPSL-CM6A-LR model. Clim Dyn 2024, 62, 1329–1357. [Google Scholar] [CrossRef]
  61. Di Virgilio, G.; Ji, F.; Tam, E.; Nishant, N.; Evans, J.P.; Thomas, C.; Riley, M.L.; Beyer, K.; Grose, M.R.; Narsey, S.; et al. Selecting CMIP6 GCMs for CORDEX dynamical downscaling: Model performance, independence, and climate change signals. Earths Future 2022, 10, e2021EF002625. [Google Scholar] [CrossRef]
  62. HamadAmin, B.A.; Khwarahm, N.R. Mapping Impacts of Climate Change on the Distributions of Two Endemic Tree Species under Socioeconomic Pathway Scenarios (SSP). Sustainability 2023, 15, 5469. [Google Scholar] [CrossRef]
  63. Peng, S.; Wang, C.; Li, Z.; Mihara, K.; Kuramochi, K.; Toma, Y.; Hatano, R. Climate change multi-model projections in CMIP6 scenarios in Central Hokkaido, Japan. Sci. Rep. 2023, 13, 230. [Google Scholar] [CrossRef]
  64. Dawson, R. How Significant is a Boxplot Outlier? J. Stat. Educ. 2011, 19, 2. [Google Scholar] [CrossRef]
  65. Gu, Z. Complex Heatmap Visualization. iMeta 2022, 1, e43. [Google Scholar] [CrossRef]
  66. Yazdani, M.h.; Amininia, K.; Safarianzengir, V.; Soltani, N.; Parhizkar, H. Analyzing climate change and its effects on drought and water scarcity (case study: Ardabil, Northwestern Province of Iran, Iran). Sustain. Water Resour. Manag. 2021, 7, 16. [Google Scholar] [CrossRef]
  67. Shahpari, G.; Sadeghi, H.; Ashena, M.; García-León, D. Drought effects on the Iranian economy: A computable general equilibrium approach. Environ. Dev. Sustain. 2022, 24, 4110–4127. [Google Scholar] [CrossRef]
  68. Behrang Manesh, M.; Khosravi, H.; Heydari Alamdarloo, E.; Saadi Alekasir, M.; Gholami, A.; Singh, V.P. Linkage of agricultural drought with meteorological drought in different climates of Iran. Theor. Appl. Climatol. 2019, 138, 1025–1033. [Google Scholar] [CrossRef]
  69. Mehdipour, S.; Nakhaee, N.; Khankeh, H.; Haghdoost, A.A. Impacts of drought on health: A qualitative case study from Iran. Int. J. Disaster Risk Reduct. 2022, 76, 103007. [Google Scholar] [CrossRef]
  70. Qeidari, H.S.; Shayan, H.; Soleymani, Z. Analysis of the Impact of Environmental Unsustainability on Social Unsustainability in Iran: Tensions and Social Damages Caused by Drought in Rural Areas. J. Res. Rural. Plan. 2022, 11, 1–19. [Google Scholar] [CrossRef]
  71. Safarianzengir, V.; Fatahi, A.; Sobhani, B.; Doumari, S.A. Temporal and spatial analysis and monitoring of drought (meteorology) and its impacts on environment changes in Iran. Atmos. Sci. Lett. 2022, 23, e1080. [Google Scholar] [CrossRef]
  72. Rafiei-Sardooi, E.; Azareh, A.; Joorabian Shooshtari, S.; Parteli, E.J.R. Long-term assessment of land-use and climate change on water scarcity in an arid basin in Iran. Ecol. Model. 2022, 467, 109934. [Google Scholar] [CrossRef]
Figure 1. The framework of this study.
Water 16 00711 g001
Figure 2. Geographical locations of the metropolises in Iran.
Water 16 00711 g002
Figure 3. (a) Historical average temperature trends, and (b) historical precipitation trends in each city.
Water 16 00711 g003
Figure 4. Sample box plots for Tehran, based on the RAI index.
Water 16 00711 g004
Figure 5. Heatmap for each city, showing the probability of the severity of drought.
Water 16 00711 g005
Figure 6. Number of dry days in each city, from 2025 to 2100.
Water 16 00711 g006
Table 1. GCMs used in this study and the corresponding scenarios.
#ModelResolution (lon × lat)Scenarios
1ACCESS-CM2192 × 144SSP126, SSP245, SSP370, and SSP585
2ACCESS-ESM1-5192 × 145SSP126, SSP245, SSP370, and SSP585
3BCC-CSM2-MR320 × 160SSP126, SSP245, SSP370, and SSP585
4CanESM5128 × 64SSP126, SSP245, SSP370, and SSP585
5CESM2288 × 192SSP126, SSP245, SSP370, and SSP585
6CESM2-WACCM288 × 192SSP245 and SSP585
7CMCC-CM2-SR5288 × 192SSP126, SSP245, SSP370, and SSP585
8CMCC-ESM2288 × 192SSP126, SSP245, SSP370, and SSP585
9CNRM-CM6-1720 × 360SSP126, SSP245, SSP370, and SSP585
10CNRM-ESM2-1256 × 128SSP126, SSP245, SSP370, and SSP585
11EC-Earth3512 × 256SSP126, SSP245, SSP370, and SSP585
12EC-Earth3-Veg-LR320 × 160SSP126, SSP245, SSP370, and SSP585
13FGOALS-g3180 × 80SSP126, SSP245, SSP370, and SSP585
14GFDL-CM4360 × 180SSP245 and SSP585
15GFDL-CM4_gr2720 × 360SSP245 and SSP585
16GFDL-ESM4360 × 180SSP126, SSP245, SSP370, and SSP585
17GISS-E2-1-G144 × 90SSP126, SSP245, SSP370, and SSP585
18HadGEM3-GC31-LL192 × 144SSP126, SSP245, and SSP585
19HadGEM3-GC31-MM432 × 324SSP126 and SSP585
20IITM-ESM192 × 94SSP126, SSP245, SSP370, and SSP585
21INM-CM4-8180 × 120SSP126, SSP245, SSP370, and SSP585
22INM-CM5-0180 × 120SSP126, SSP245, SSP370, and SSP585
23IPSL-CM6A-LR144 × 143SSP126, SSP245, SSP370, and SSP585
24KACE-1-0-G192 × 144SSP126, SSP245, SSP370, and SSP585
25KIOST-ESM192 × 96SSP126, SSP245, and SSP585
26MIROC6256 × 128SSP126, SSP245, SSP370, and SSP585
27MIROC-ES2L128 × 64SSP126, SSP245, SSP370, and SSP585
28MPI-ESM1-2-HR384 × 192SSP126, SSP245, SSP370, and SSP585
29MPI-ESM1-2-LR192 × 96SSP126, SSP245, SSP370, and SSP585
30MRI-ESM2-0320 × 160SSP126, SSP245, SSP370, and SSP585
31NESM3192 × 96SSP126, SSP245, and SSP585
32NorESM2-LM144 × 96SSP126, SSP245, SSP370, and SSP585
33NorESM2-MM288 × 192SSP126, SSP245, SSP370, and SSP585
34TaiESM1288 × 192SSP126, SSP245, SSP370, and SSP585
35UKESM1-0-LL192 × 144SSP126, SSP245, SSP370, and SSP585
Table 2. Drought indices used in this study (Standardized Precipitation Index (SPI), Deciles Index (DI), Percent of Normal (PN) Precipitation, China Z-Index (CZI), Modified China Z-Index (MCZI), Rainfall Anomaly Index (RAI), Z-score Index (ZSI)), and their classifications.
SPI/CZI/MCZIPNDIRAIZSI
RangeClassificationRangeClassificationRangeClassificationRangeClassificationRangeClassification
2.0+Extremely wet120+Very wet9–10Very wet4+Extremely wet2.0+Extremely wet
1.5 to 1.99Very wet100 to 120Wet7–8Wet2 to 4Very wet1.5 to 1.99Very wet
1.0 to 1.49Moderately wet80 to 100Normal5–6Near normal0 to 2Wet1.0 to 1.49Moderately wet
−0.99 to 0.99Near normal70 to 80Slightly dry3–4Dry−2 to 0Dry−0.99 to 0.99Near
normal
−1.0 to −1.49Moderately dry55 to 70Moderately dry1–2Severely dry−4 to −2Severely dry−1.0 to −1.49Moderately dry
−1.5 to −1.99Severely dry40 to 55Severely dry −4 and lessExtremely dry−1.5 to −1.99Severely dry
−2.0 and lessExtremely dry40 and lessExtremely dry −2.0 and lessExtremely dry
Table 3. The M-K trend test results.
CityVariableNM-K StatisticsStandard ErrorZ ValueProb > |Z|AlphaSgnTrend
TehranAvg. Temp.721494205.717.263.93 × 10−130.051Upward
Prec.7290205.710.430.670.050-
MashhadAvg. Temp.721526205.717.411.23 × 10−130.051Upward
Prec.72−102205.71−0.490.620.050-
IsfahanAvg. Temp.721472205.717.158.62 × 10−130.051Upward
Prec.72180205.710.870.380.050-
KarajAvg. Temp.3815979.541.990.050.051Upward
Prec.38−579.54−0.050.960.050-
ShirazAvg. Temp.721448205.717.032 × 10−120.051Upward
Prec.72−272205.71−1.320.190.050-
TabrizAvg. Temp.721300205.716.312.71 × 10−100.051Upward
Prec.72−544205.71−2.640.010.051Downward
Table 4. The NS and MNS efficiency values for observed vs. simulated data.
GCMVariableTehranKarajTabrizMashhadIsfahanShirazAverage
ACCESS-CM2Temp (NS)0.940.930.920.910.940.920.93
PCP (MNS)0.180.10−0.110.18−0.090.210.08
ACCESS-ESM1-5Temp (NS)0.950.930.930.910.940.920.93
PCP (MNS)0.200.15−0.100.200.010.250.12
BCC-CSM2-MRTemp (NS)0.940.930.930.900.940.920.93
PCP (MNS)0.180.11−0.100.18−0.060.220.09
CanESM5Temp (NS)0.940.940.920.910.940.930.93
PCP (MNS)0.190.08−0.060.19−0.050.200.09
CESM2Temp (NS)−1.45−1.51−1.45−1.40−1.45−1.42−1.45
PCP (MNS)−0.37−0.40−0.66−0.49−0.53−0.27−0.45
CESM2-WACCMTemp (NS)−1.45−1.49−1.46−1.40−1.46−1.43−1.45
PCP (MNS)−0.34−0.42−0.66−0.46−0.50−0.26−0.44
CMCC-CM2-SR5Temp (NS)0.710.780.820.710.820.800.77
PCP (MNS)0.110.09−0.140.14−0.150.120.03
CMCC-ESM2Temp (NS)0.950.930.930.920.940.930.93
PCP (MNS)0.160.12−0.140.08−0.070.130.05
CNRM-CM6-1Temp (NS)0.940.930.920.900.930.920.92
PCP (MNS)0.200.13−0.070.210.010.260.12
CNRM-ESM2-1Temp (NS)0.930.920.900.900.920.910.91
PCP (MNS)0.240.12−0.100.21−0.060.210.10
EC-Earth3Temp (NS)0.930.930.920.910.920.910.92
PCP (MNS)0.130.03−0.150.12−0.020.190.05
EC-Earth3-Veg-LRTemp (NS)0.930.930.920.910.930.910.92
PCP (MNS)0.130.09−0.150.14−0.060.180.06
FGOALS-g3Temp (NS)0.790.780.780.780.800.780.79
PCP (MNS)0.150.13−0.060.17−0.020.150.09
GFDL-CM4Temp (NS)0.790.770.780.770.800.780.78
PCP (MNS)0.120.04−0.180.11−0.060.200.04
GFDL-CM4_gr2Temp (NS)0.800.790.790.780.800.780.79
PCP (MNS)0.140.07−0.130.14−0.040.200.06
GFDL-ESM4Temp (NS)0.800.780.800.790.810.780.79
PCP (MNS)0.140.07−0.160.16−0.070.210.06
GISS-E2-1-GTemp (NS)0.950.930.930.920.940.920.93
PCP (MNS)0.210.16−0.070.230.000.210.12
HadGEM3-GC31-LLTemp (NS)−1.16−1.60−1.24−1.08−1.18−1.12−1.23
PCP (MNS)−0.37−0.54−0.53−0.42−0.57−0.24−0.45
HadGEM3-GC31-MMTemp (NS)−1.15−1.62−1.25−1.09−1.18−1.12−1.23
PCP (MNS)−0.33−0.51−0.52−0.38−0.53−0.21−0.41
IITM-ESMTemp (NS)0.940.930.920.900.930.930.93
PCP (MNS)0.170.06−0.110.20−0.040.220.08
INM-CM4-8Temp (NS)0.950.930.930.920.940.920.93
PCP (MNS)0.100.00−0.150.16−0.060.150.03
INM-CM5-0Temp (NS)0.950.940.930.920.940.920.93
PCP (MNS)0.150.11−0.140.170.010.150.08
IPSL-CM6A-LRTemp (NS)0.940.930.920.900.930.910.92
PCP (MNS)0.200.16−0.080.23−0.010.190.12
KACE-1-0-GTemp (NS)−1.16−1.60−1.26−1.07−1.19−1.13−1.23
PCP (MNS)−0.18−0.36−0.39−0.31−0.82−0.26−0.39
KIOST-ESMTemp (NS)0.950.940.930.930.940.930.94
PCP (MNS)0.200.14−0.080.19−0.070.220.10
MIROC6Temp (NS)0.940.930.930.910.940.920.93
PCP (MNS)0.180.08−0.100.18−0.060.170.08
MIROC-ES2LTemp (NS)0.950.930.940.930.940.920.93
PCP (MNS)0.250.12−0.070.280.020.210.14
MPI-ESM1-2-HRTemp (NS)0.950.930.930.910.940.920.93
PCP (MNS)0.110.04−0.180.14−0.030.170.04
MPI-ESM1-2-LRTemp (NS)0.950.930.930.900.940.920.93
PCP (MNS)0.160.07−0.140.12−0.120.140.04
MRI-ESM2-0Temp (NS)0.940.930.930.900.930.920.92
PCP (MNS)0.190.07−0.070.18−0.010.250.10
NESM3Temp (NS)0.910.870.880.880.900.890.89
PCP (MNS)0.170.07−0.150.10−0.150.120.03
NorESM2-LMTemp (NS)−1.42−1.52−1.42−1.33−1.42−1.39−1.42
PCP (MNS)−0.33−0.42−0.61−0.44−0.55−0.30−0.44
NorESM2-MMTemp (NS)−1.41−1.48−1.43−1.32−1.41−1.38−1.41
PCP (MNS)−0.36−0.36−0.61−0.46−0.52−0.27−0.43
TaiESM1Temp (NS)−1.70−1.69−1.57−1.43−1.40−1.37−1.53
PCP (MNS)−0.37−0.47−0.62−0.50−0.57−0.29−0.47
UKESM1-0-LLTemp (NS)−1.17−1.65−1.25−1.09−1.21−1.16−1.25
PCP (MNS)−0.35−0.53−0.51−0.39−0.58−0.24−0.43
Strong correlation: Green; Moderately correlated: Yellow; Weak correlation: Red.
Table 5. Drought index values for Tehran, in 2050, under the SSP585 scenario.
2050—SSP585
ACCESS-ESM1-5IPSL-CM6A-LR
SPIDIPNCZIMCZIRAIZSISPIDIPNCZIMCZIRAIZSI
−0.5387.4−0.6−0.4−1.1−0.6−0.3489.3−0.3−0.2−0.8−0.4
CNRM-CM6-1KIOST-ESM
SPIDIPNCZIMCZIRAIZSISPIDIPNCZIMCZIRAIZSI
−1.9158.7−2.3−2.5−3.5−1.60.26102.60.20.20.20.1
CNRM-ESM2-1MIROC-ES2L
SPIDIPNCZIMCZIRAIZSISPIDIPNCZIMCZIRAIZSI
0.16100.20.10.300−0.6383.9−0.6−0.5−1.2−0.6
GISS-E2-1-GMRI-ESM2-0
SPIDIPNCZIMCZIRAIZSISPIDIPNCZIMCZIRAIZSI
−0.5388.7−0.6−0.5−1.1−0.60.68113.60.50.50.80.5
Disclaimer/Publisher’s Note: The statements, opinions and data contained in all publications are solely those of the individual author(s) and contributor(s) and not of MDPI and/or the editor(s). MDPI and/or the editor(s) disclaim responsibility for any injury to people or property resulting from any ideas, methods, instructions or products referred to in the content.

