
Assessing the Impact of Weirs on Water Quality and Phytoplankton Dynamics in the South Han River: A Two-Year Study
by
 ,
,
Young-Hyo Kim
1,2,†,
In-Hwan Cho
2,3,†,
Ha-Kyung Kim
2,4,
Eun-A Hwang
2,5,
Byung-Hun Han
2 and
Baik-Ho Kim
2,6,* 1
Youngsan-River Environmental Management Office, Ministry of Environment, Gwangju 61945, Republic of Korea
2
Department of Environmental Science, Hanyang University, Seoul 04763, Republic of Korea
3
Migang E&C Co., Ltd., Gyeonggi 14057, Republic of Korea
4
Water Environmental Engineering Research Division, National Institute of Environmental Research, Inchon 22689, Republic of Korea
5
Han River Environment Research Center, National Institute of Environmental Research, Gyeonggi 12585, Republic of Korea
6
Department of Life Science and Research Institute for Natural Sciences, Hanyang University, Seoul 04763, Republic of Korea
*
Author to whom correspondence should be addressed.
†
These authors contributed equally to this this work.
Water 2024, 16(6), 833; https://doi.org/10.3390/w16060833
Submission received: 13 February 2024
/
Revised: 7 March 2024
/
Accepted: 7 March 2024
/
Published: 13 March 2024
(This article belongs to the Section Biodiversity and Functionality of Aquatic Ecosystems)
Abstract
:This study investigates the ecological effects of weirs on water quality and phytoplankton communities in the South Han River (SHR) over a two-year period. By focusing on three key weirs—Kangcheon Weir, Yeoju Weir, and Ipo Weir—the research examines how artificial structures influence river hydrodynamics, nutrient cycles, and algal growth patterns. Utilizing water quality measurements, phytoplankton analysis, and environmental factor assessments, the study identifies significant fluctuations in water quality parameters and phytoplankton abundance across the surveyed points. The analysis reveals a direct correlation between environmental conditions such as temperature, flow rates, and nutrient concentrations, particularly nitrogen and phosphorus, and the proliferation of harmful cyanobacteria, notably Microcystis. This research highlights the critical role of comprehensive management strategies that consider hydraulic residence time, nutrient balance, and temperature regulation to mitigate the impacts of weirs on river ecosystems and improve water quality in the SHR.
1. Introduction
Significant repercussions have followed the introduction of artificial structures, such as weirs, into natural river systems. These systems have been transformed into constrained water bodies, leading to the obstruction of pollutant dispersion, disruption of natural flow patterns, and promotion of the accumulation of soluble substances, which diminishes the self-purification capacity of rivers, causes sediment build-up, eutrophication, and threatens aquatic ecosystems [1,2,3,4,5].
The construction of dams and weirs has been associated with widespread ecological impacts, altering river flow dynamics, temperature, sediment transport, and oxygen levels, adversely affecting habitat, fish spawning, and water quality, and transforming water chemistry, which impacts nutrient cycling, eutrophication, the proliferation of algal blooms, and disrupts the migratory patterns of aquatic species [6,7,8,9,10,11,12,13,14].
The changes in physical, chemical, and biological aspects due to these constructions impact water depth, storage capacity, habitat connectivity, and nutrient balance, affecting the ecosystems of the South Han River (SHR), including algal growth, especially during severe droughts [15,16,17,18,19,20,21,22,23,24,25,26]. Addressing these challenges requires interdisciplinary approaches that integrate ecological, hydrological, and geomorphic considerations into sustainable management strategies to improve SHR ecosystems [27,28,29].
In response to concerns over harmful algae in the SHR, South Korea has implemented a comprehensive water pollution control system targeting total nitrogen and phosphorus, constructed three reservoirs, and introduced an algae forecasting system to manage chlorophyll-a and algae concentrations. These measures aim to control the proliferation of harmful cyanobacterial species that affect human health and ecosystems [30,31,32,33,34,35,36].
This study aims to understand the relationship between potentially harmful algal species and their environmental drivers, focusing on the inverse relationship between cyanobacterial abundance and river flow rates under weir-regulated conditions [37,38,39,40,41]. By examining two years of data on phytoplankton fluctuations in relation to Kangcheon Weir, Yeoju Weir, and Ipo Weir, this study seeks to identify environmental factors and mechanisms for water quality preservation in the SHR.
2. Materials and Methods
2.1. Study Sites and Period
The downstream catchment area of the Seoul Han River (SHR), spanning approximately 2072.72 square kilometers and stretching for about 300.5 km, was the focus of the study conducted. This geographical region extends from 127°17′8″ to 127°50′40″ in east longitude and from 36°56′3″ to 37°35′59″ in north latitude. Situated in Seoul, the Paldang Dam, which is the central point of this river system, boasts an impressive water storage capacity of 244 million metric tons. The significant role of the SHR in influencing the inflow of Paldang Lake, which covers a basin of 23,859 km2 and stretches for 375 km, was noted, especially during both flood and drought periods. The operation of the upstream Chungju Lake floodgates was found to directly impact the water quality of Paldang Lake [4,5].
A 30-km segment of the SHR, starting from Munam-ri, Jeomdong-myeon, Yeoju-gun, and Gyeonggi-do, where three downstream weirs are located, and extending to Oepyeong-ri, Geumsa-myeon, Yeoju-gun, and Gyeonggi-do, was selected for the study. This section was chosen due to its representation of the river’s dynamic nature and significant alterations to its main channel brought about by the construction of major structures like the KCW, YJW, and IPW, as well as dredging activities conducted between 2010 and 2011.
The investigation covered the SHR’s origin in the Taebaeksan Mountain area, its southward flow from the Yeongwol, Gangwon-do, intersection with the Seomgang River and Cheongmicheon Stream, and ultimate merge with Chungjuho Lake before proceeding to YJW, Gyeonggi-do. At this juncture, its convergence with the Yanghwacheon and Bokhacheon streams was observed. The introduction of artificial weirs (KCW, YJW, and IPW) downstream as part of the government’s river revitalization initiative was also documented (Figure 1 and Table 1).
The survey was conducted through weekly observations at the same location between May and October in both 2019 and 2020. Measurements were recorded weekly to monitor the occurrence of specific phytoplankton species. Sample collection was occasionally delayed or disrupted due to adverse weather conditions, such as typhoons or heavy rainfall, in the interest of safety. Data on the location, basin area, height, and length of KCW, YJW, and IPW were collected throughout the survey period. The focus was on the junctions of small tributaries with the mainstream of the SHR, where phytoplankton shifts caused by changes in water quality were evaluated, with a particular emphasis on the three weirs within the SHR. Three locations along the mainstream were included in the study, where phytoplankton samples were consistently collected using an automated water quality measurement network. The surveys were conducted on a weekly basis, with the biological and environmental data being compiled monthly. These figures and tables represent the average outcomes derived from the weekly surveys.
2.2. Water Analysis
To assess water quality comprehensively, various methodologies were employed. Measurements of water temperature, dissolved oxygen (DO), pH, electrical conductivity, and turbidity were conducted in situ using a portable device (Horiba D-55, Orion 5-star, Kyoto, Japan). Surface water was used for water collection. A Van Dorn Sampler (M1140-H42, Wildco, Saginaw, MI, USA) was used to collect water samples throughout the sampling process. However, if the water depth exceeded 5 m, a sample from 0–1 m was collected and mixed with a column water sampler and then a combined sample was utilized. If the water depth was less than 5 m, a sample from 0–50 cm was utilized. These samples were then stored in 2-L plastic bottles, refrigerated, and transported to the laboratory to ensure their integrity was maintained. In the laboratory, the water samples were analyzed to determine the concentrations of biochemical oxygen demand (BOD), nitrate nitrogen (NO3-N), ammonia nitrogen (NH3-N), total nitrogen (TN), phosphate phosphorus (PO4-P), and total phosphorus (TP), following the American Public Health Association (APHA) guidelines [42].
According to the standards set by the Korean River Water Quality Environment, the average nutrient concentration levels observed in the water of three dams over a two-year survey period were classified as Grade 2, indicating “good” water quality (http://www.wamis.go.kr/wke/wke_wqbase_lst.do#menu02, accessed on 11 February 2024).
Data from various sources, including the Ministry of Environment’s Water Environment Information System, Korea Water Resources Corporation’s multipurpose beam measurement network, daily flow rate information from KCW and IPW, and weather data from the Icheon Meteorological Observatory, were incorporated into the analysis. These data sources allowed for an examination of weather patterns, water quality, and phytoplankton dynamics. Water parameter data were obtained from the Ministry of Environment’s Water Environment Information System (http://water.nier.go.kr/web, accessed on 11 February 2024). Weather, maintenance, and hydrological data for the three SHR basins (KCW, YJW, and IPW) were sourced from the Korea Water Resources Corporation’s website (https://www.water.or.kr/kor/realtime/sumun/index.do?mode=mult&menuId=13_91_93_98, accessed on 11 February 2024). The hydrological residence time (HRT) was calculated by dividing the reservoir volume by the discharge rate, using data from automatic measurement devices for each reservoir also obtained from the Korea Water Resources Corporation’s website. HRT was computed as the storage volume (million m3) divided by the total discharge (m3/s), multiplied by 86,400 s per day.
2.3. Phytoplankton Analysis
A comprehensive analysis of phytoplankton was carried out, with data collection spanning from 2019 to 2020 at three weirs (KCW, YJW, and IPW). In total, 186 water samples were gathered and examined. To evaluate phytoplankton abundance, water samples were collected at the surface 0~50 cm using a Van Dorn Sampler (M1140-H42, Wildco, Saginaw, MI, USA) throughout the sampling process. These samples were then preserved with Lugol’s solution to a final concentration of 1%, facilitating an effective assessment of phytoplankton abundance. After preservation, the samples were refrigerated and transported to the lab for further examination. Phytoplankton enumeration was conducted using a Sedgewick-Rafter chamber (Paul Marienfeld GmbH & Co. KG, Lauda-Königshofen, Germany) and an inverted microscope (Olympus CKX41, Tokyo, Japan), with the average values determined from 10 counts per sample. The chamber measures 50 mm in length, 20 mm in width, and 1 mm in depth and features a base grid of 1000 × 1 mm squares. When filled and covered with a 60 × 30 × 1 mm glass slide, the chamber holds a 1 mL volume of liquid. Diatoms from each site underwent acid treatment and were then encapsulated using Pleulax (Wako, Japan) as per Simonsen’s classification system [43,44,45,46]. A variety of sources [47,48,49,50] were consulted for phytoplankton identification. To explore temporal shifts in the phytoplankton community at the study sites, dominant species were identified and key indices, including the dominance index [51], diversity index [52], richness index [53], and evenness index [54], were calculated.
2.4. Data Analysis
The influence of environmental factors on the abundance of phytoplankton across the three weirs from 2019 to 2020 was meticulously determined by examining a comprehensive list of 15 factors, which included water temperature. To analyze the intricate relationships and variations between water quality and phytoplankton within this array of environmental factors, a standard correlation analysis was conducted utilizing SPSS (version 18). Furthermore, to attain a more profound insight into the interplay among various sets of variables, canonical correlation analysis (CCA) was employed, utilizing the PC-Ord program [55]. This approach facilitated an enhanced comprehension of the complex interactions between environmental factors and the dynamics of phytoplankton.
3. Results
3.1. Water Environment at Three Weirs
At the three survey points along the SHR, significant fluctuations in water quality were observed between 2019 and 2020, as shown in Figure 2. These fluctuations were found to be influenced by factors such as precipitation patterns, water temperature fluctuations, and human activities in the surrounding areas. The conditions at the three weirs, KCW, YJW, and IPW, were specifically examined.
A remarkable decrease in residence time was noted at KCW, coinciding with increased rainfall in 2020, which led to higher flow rates and improved river purification. The water temperature at the tributary was observed to range from 12.8 to 28.6 °C in 2019, with an average temperature of 18.49 °C. Additionally, a spike in SS concentrations in July 2020 was primarily attributed to the initial heavy rainfall. Fluctuations were seen in pH levels between 7.6 and 9.6, while DO concentrations varied from 7.4 to 12.8 mg/L. Similar patterns were observed in nitrogenous (TN and NO3-N) and phosphorus (TP and PO4-P) nutrients, which increased during high-temperature periods and decreased at cooler temperatures. DO levels were found to decrease during high-temperature periods but rebounded from September to October. An increase in the presence of organic substances, as indicated by COD concentrations, was notably seen in July 2020, while the Chl-a concentration peaked in August.
YJW and IPW also saw similar trends, with both experiencing reduced residence times, averaging 1.5 days in 2019 and 0.9 days in 2020. Patterns in water temperature, SS concentrations, pH levels, DO concentrations, nutrient concentrations, and Chl-a levels were consistent across all three weir tributaries.
3.2. Phytoplankton Abundance and Community Dynamics
From May to October for both 2019 and 2020, dynamic shifts in the dominant phytoplankton species and abundance at consecutive weirs along the SHR were observed. Depending on the sampling time and location, variations in the dominant phytoplankton species, their relative abundance (%), and harmful cyanobacteria (Microcystis, Anabaena, Oscillatoria, and Aphanizomenon) at each weir were noted, as depicted in Figure 3 and detailed in Table 2.
Over two years, distinct differences in the abundance of phytoplankton and cyanobacteria across three weirs on the SHR were noted (Figure 3).
It was unveiled that distinct variations in the abundance of phytoplankton existed; at KCW, a range from 450 to 4821 cells/mL (with an average of 1932 cells/mL) was observed, while at YJW and IPW, the ranges were noted to be from 220 to 7880 cells/mL (averaging 2443 cells/mL) and from 240 to 13,910 cells/mL (averaging 3714 cells/mL), respectively. A higher abundance of phytoplankton at IPW, compared to the other two weirs, was recorded. The significant increase in the abundance of harmful cyanobacteria during July and August was observed as a consequence of elevated water temperatures at all sites.
Observations were also made on the variations in cyanobacterial abundance: at KCW, a range from 0 to 1334 cells/mL (averaging 163.7 cells/mL) was observed, while at YJW and IPW, the ranges were from 0 to 334 cells/mL (with an average of 61.9 cells/mL) and from 0 to 2410 cells/mL (with an average of 282.6 cells/mL), respectively. Similar to phytoplankton, a higher abundance of cyanobacteria in August at IPW, compared to the other two weirs, was observed.
Overall, the abundance of phytoplankton in the three weirs over the two-year period was observed to be normally distributed, centering on July. However, a significantly higher abundance at IPW in 2019 compared to 2020 was recorded, with the high abundance primarily being attributed to the cyanobacteria Microcystis.
The abundance trend from KCW to IPW was linked closely to the downstream water residence times and nutrient influx. A diverse array of phytoplankton species dominated the weirs in 2019, with different species prevailing on specific dates. In contrast, 2020 saw a distinct set of phytoplankton species flourishing at the weirs, primarily because of increased rainfall. The shifts in dominant phytoplankton species between the two years are highlighted in Table 2. Changes in phytoplankton species among the weirs and over time reflected changes in environmental conditions, such as nutrient availability, and other influencing factors.
To assess the phytoplankton communities at the three consecutive weirs along the SHR comprehensively, a survey using ecological indices was conducted from May 2019 to October 2020, as presented in Figure 4. In 2019, the dominance index (DI) at KCW fluctuated, while the diversity index (H′), richness index (j), and evenness index (e) showed various patterns of changes. Similar trends were observed at YJW and IPW in 2019. In 2020, comparable trends were seen at KCW, with minor differences at YJW. IPW displayed a more consistent pattern in 2020. The average fluctuations in cluster indices between 2019 and 2020 were compared, revealing that 2019 experienced more pronounced fluctuations, attributed to the higher rainfall levels in 2020, which contributed to a more stable environment for phytoplankton growth.
3.3. Environmental Influences on Phytoplankton Dynamics
The study of phytoplankton interactions with environmental variables at the South Han River’s Kangcheon Weir (KCW), Yeoju Weir (YJW), and Ipo Weir (IPW) during the summer periods of 2019 and 2020 has unveiled notable environmental fluctuations, especially in pH levels and nitrogen/phosphorus (N/P) ratios (Table 3).
It was observed that KCW exhibited a significantly elevated pH and N/P ratio in comparison to YJW and IPW, highlighting a distinctive aquatic habitat at KCW. Despite these variations, the prevalence of harmful cyanobacteria, alongside total nitrogen, phosphorus, and overall phytoplankton counts, remained consistent across the locations.
Extending beyond initial findings, further analysis indicated that the differences between the weirs were not confined to pH and N/P ratios alone. Additional factors, such as water temperature and the diversity within phytoplankton communities (including Bacillariophyceae, Chlorophyceae, and other non-cyanobacterial phytoplankton groups), also varied, though not uniformly statistically significant. Specifically, water temperature was found to gradually increase from KCW to IPW, with a concurrent rise in phytoplankton diversity noted from KCW towards IPW.
The Canonical Correspondence Analysis (CCA) outlined the environmental factors predominantly shaping phytoplankton behavior across three sections (Figure 5). Throughout the summers of 2019 and 2020, factors such as temperature, hydraulic retention time (HRT), chlorophyll-a (Chl-a), and total phosphorus (TP) were significant influencers of phytoplankton and harmful cyanobacteria. Additionally, rainfall, ammonia nitrogen (NH3-N), phosphate phosphorus (PO4-P), and total nitrogen (TN) had pronounced impacts on species like Anabaena and Oscillatoria, while dissolved oxygen (DO) and nitrate nitrogen (NO3-N) affected Aphanizomenon and green algae, among other algae types. Importantly, axis 1 of the CCA showed a strong correlation with the presence of harmful cyanobacteria like Microcystis, Oscillatoria, and Aphanizomenon, linked to environmental parameters such as water temperature, DO, NH3-N, and chemical oxygen demand (COD), whereas axis 2 did not present significant correlations. The findings ultimately highlighted that water temperature and nitrogen levels play a critical role in the proliferation of harmful cyanobacteria.
This study explored the impact of environmental factors on Microcystis dynamics in the SHR, particularly when Microcystis concentrations exceeded 1000 cells/mL, and their relationship with water quality conditions (Figure 6). The average values for these factors during the study were 20.2 °C and 47.1 and 1.11 days. During Microcystis proliferation, these values increased to 23.8 °C and 62.9 and 1.3 days. These changes were linked to shifts in the N/P ratio, water temperature, and HRT over three sequential weirs along the South Han River.
4. Discussion
Significant fluctuations in water quality at three survey points within the South Han River (SHR) between 2019 and 2020 were identified in this study. These variations primarily stemmed from changes in rainfall patterns, resulting in increased flow rates, higher suspended solids (SS) levels, and alterations in nutrient concentrations. Elevated temperatures also played a significant role, leading to higher levels of chlorophyll-a (Chl-a) and decreased dissolved oxygen (DO) concentrations [56,57,58,59,60]. Furthermore, this study explored the influence of residence time on water quality, with a specific focus on the observed decrease at the KCW Tributary in 2020, which correlated with increased rainfall and river purification efforts. While substantial rainfall during the rainy season and typhoons had a positive impact on river water quality by reducing phytoplankton levels, sedimentation from suspended solids, especially runoff, counteracted this effect [61,62,63,64,65]. The observed increase in phosphorus concentration after rainfall suggests that it is caused by the release of P accumulated in the bottom and the inflow from non-point pollution sources. Flow regulation and non-point pollution management are necessary for gradual nutrient management [66]. It cannot be accurately determined from this study as to whether the fluctuations in nutrient salts are due to strong internal production or an external sewage influx. pH fluctuations were influenced by factors such as ion inflow, water temperature, and phytoplankton photosynthesis, particularly after intense rainfall events. The increase in DO concentration in 2019 was attributed to the release of oxygen during phytoplankton photosynthesis. In summary, the significant variability in water quality between 2019 and 2020 was primarily driven by fluctuations in rainfall and temperature, with implications for the health and sustainability of the SHR ecosystem.
Significant variations in the distribution, abundance, and dominant species of phytoplankton across the three survey points in the SHR water system from 2019 to 2020 were observed. These fluctuations closely correlated with environmental factors such as temperature, rainfall, and water residence time [67,68,69]. Notably, there was a substantial increase in the occurrence of cyanobacteria in July across all survey points, attributed to elevated temperatures, while diatom species predominated at lower temperatures. These findings underscore the dynamic nature of aquatic ecosystems and the intricate relationship between phytoplankton species and their environments [70,71,72,73]. The dominance of different phytoplankton species across the weirs in 2019 and 2020 indicates the significant impact of environmental conditions and nutrient availability on these fluctuations, highlighting the dynamic relationships between environmental factors and aquatic ecosystem responses [74,75,76,77]. The two-year survey provides insights into the competitive dynamics among phytoplankton species across the three SHR reservoirs, with diatoms prevailing in spring and winter and cyanobacteria dominating in summer.
The analysis revealed that fluctuations in the phytoplankton community were significantly influenced by weather conditions. In 2019, reduced rainfall and elevated water temperatures primarily contributed to the prevalence of Microcystis species across the surveyed points, resulting in a decline in diversity, abundance, and evenness indices [78,79,80,81]. When comparing the average fluctuations in the cluster indices between 2019 and 2020, it was observed that 2019 exhibited more pronounced fluctuations, possibly due to higher rainfall in 2020, creating a more stable environment for phytoplankton growth [82,83]. Specifically, H′ and e showed smaller fluctuations in 2020, suggesting a more balanced phytoplankton community in response to increased rainfall. To sum up, changes in the phytoplankton community indices across the surveyed points over the two-year period were primarily driven by fluctuations in weather conditions, with 2019 showing more pronounced variations.
This study underscores the intricate relationship between phytoplankton and various environmental factors in different aquatic ecosystems. Water temperature plays a crucial role in shaping the distribution and abundance of phytoplankton, particularly harmful Microcystis cyanobacteria [84,85,86]. The occurrence of Microcystis during July and August in the three weirs ecosystem is positively correlated with water temperature, suggesting favorable conditions for their growth during these months. Seasonal variations in phytoplankton occurrence are related to water temperature, influencing phytoplankton and cyanobacteria abundance. The complex nature of these interactions is highlighted by the correlations between phytoplankton and environmental factors in the three reservoirs. Various phytoplankton groups exhibit complex correlations with water temperature, TP, and COD, similar to cyanobacteria, illustrating the interplay between multiple environmental factors in shaping phytoplankton communities. The strong correlation between harmful Microcystis cyanobacteria and water temperature, as well as nitrogen, indicates the key drivers of harmful blooms. Overall, this discussion underscores the complex relationships between phytoplankton and environmental factors, with an emphasis on the roles of seasonality, nutrient availability, and temperature in shaping phytoplankton dynamics in aquatic ecosystems [87,88,89,90].
This study examined the impact of environmental factors, specifically the N/P ratio, water temperature, and hydraulic residence time (HRT), on Microcystis population dynamics in aquatic ecosystems, particularly the SHR. Nitrogenous nutrients, such as NH3-N and NO3-N, play crucial roles in cyanobacterial growth. Temporal variations in these nutrients significantly affect Microcystis proliferation [91,92,93,94]. This study monitored changes in phytoplankton species composition and distribution patterns, with a focus on harmful cyanobacteria such as Microcystis, and found significant correlations with both water temperature and nutrient concentrations. The N/P ratio, water temperature, and HRT were identified as the primary drivers of Microcystis growth in the SHR and were directly linked to the increased proliferation and downstream growth of harmful cyanobacteria [95,96,97,98]. A substantial (23%) improvement in water quality conditions was observed concurrently with Microcystis proliferation, highlighting a direct correlation between these environmental factors and the overall health of the ecosystem. To address cyanobacterial blooms and enhance water quality, this study recommends a comprehensive approach that includes reducing nitrogen levels, optimizing HRT, and moderating water temperature [86,99,100,101].
It is generally known that nitrogen and phosphorus concentrations in cascade reservoir systems decrease gradually [102,103]. Significant differences and variations in nutrients among the three dams were not observed in our study. In future research, it will be clarified whether an increase in phosphorus or nitrogen nutrients along the river is due to strong internal production or an external sewage influx. This would make a significant contribution to the development of ecosystem management strategies and water resource management. The need for further research is deemed crucial for the refinement of control strategies and for assessing their effectiveness under varying conditions, as well as for understanding their potential synergies with other ecosystem management practices.
5. Conclusions
The investigation into the effects of weirs on the SHR ecosystem over a two-year timeframe has elucidated the profound impacts of artificial structures on river hydrology, water quality, and phytoplankton community dynamics. Our findings demonstrate that weirs significantly alter water flow, residence time, and nutrient concentrations (TP), leading to variations in water quality and promoting the growth of harmful cyanobacteria. The study identifies key environmental factors, including water temperature, nutrient ratios (TN:TP), and hydraulic residence time, as significant influencers of phytoplankton dynamics and Microcystis proliferation. The observed increase in cyanobacterial blooms underlines the need for targeted management strategies aimed at optimizing water quality through nutrient reduction, flow regulation, temperature control, and non-point pollution management. Future research should focus on integrated ecosystem management approaches that address the multifaceted impacts of artificial structures on riverine ecosystems. This study contributes valuable insights towards sustainable water resource management and the preservation of aquatic ecosystems in regions impacted by artificial weirs.
Author Contributions
Y.-H.K., I.-H.C., H.-K.K. and B.-H.K. conceptualized the research; Y.-H.K., I.-H.C., H.-K.K., B.-H.H. and E.-A.H. performed the fieldwork; Y.-H.K., I.-H.C., B.-H.H. and B.-H.K. analyzed the data; Y.-H.K., I.-H.C. and B.-H.K. wrote and edited the manuscript. All authors have read and agreed to the published version of the manuscript.
Funding
The research was provided the National Institute of Environmental Research (NIER).
Data Availability Statement
The data that support the findings of this study are available from the corresponding author, upon reasonable request.
Acknowledgments
We express our sincere gratitude to the reviewers for their contributions to enhancing the scientific quality of our manuscript.
Conflicts of Interest
Author In-Hwan Cho was employed by the company Migang E&C Co. The remaining authors declare that the research was conducted in the absence of any commercial or financial relationships that could be construed as a potential conflict of interest.
References
- Baxter, R.M. Environmental effects of dams and impoundments. Annu. Rev. Ecol. Syst. 1977, 8, 255–283. [Google Scholar] [CrossRef]
- Muhar, S.; Sendzimir, J.; Jungwirth, M.; Hohensinner, S. Restoration in integrated river basin management. In Riverine Ecosystem Management: Science for Governing towards a Sustainable Future; Schmutz, S., Sendzimir, J., Eds.; Springer International Publishing: Cham, Switzerland, 2018; pp. 273–299. [Google Scholar]
- Tang, H.; Yuan, S.; Cao, H. Theory and practice of hydrodynamic reconstruction in plain river networks. Engineering 2023, 24, 202–211. [Google Scholar] [CrossRef]
- Kong, D.S. Water quality modeling of the eutrophic transition zone in a river-type reservoir Paldang. J. Korean Soc. Water Environ. 2014, 30, 429–440. [Google Scholar] [CrossRef]
- Park, H.K.; Byeon, M.S.; Choi, M.J.; Kim, Y.J. The effect factors on the growth of phytoplankton and the sources of organic matters in downstream of Namhan-River. J. Korean Soc. Water Environ. 2008, 24, 556–562. [Google Scholar]
- Doyle, M.W.; Stanley, E.H.; Orr, C.H.; Selle, A.R.; Sethi, S.A.; Harbor, J.M. Stream ecosystem response to small dam removal: Lessons from the Heartland. Geomorphology 2005, 71, 227–244. [Google Scholar] [CrossRef]
- Petts, G.E.; Gurnell, A.M. Dams and geomorphology: Research progress and future directions. Geomorphology 2005, 71, 27–47. [Google Scholar] [CrossRef]
- Ward, J.V.; Stanford, J.A. The serial discontinuity concept: Extending the model to floodplain rivers. Regul. Rivers Res. MGMT 1995, 10, 159–168. [Google Scholar] [CrossRef]
- Carpenter, S.R.; Caraco, N.F.; Correll, D.L.; Howarth, R.W.; Sharpley, A.N.; Smith, V.H. Nonpoint pollution of surface waters with phosphorus and nitrogen. Ecol. Appl. 1998, 8, 559–568. [Google Scholar] [CrossRef]
- Wohl, E.; Bledsoe, B.P.; Jacobson, R.B.; Poff, N.L.; Rathburn, S.L.; Walters, D.M.; Wilcox, A.C. The natural sediment regime in rivers: Broadening the foundation for ecosystem management. BioScience 2015, 65, 358–371. [Google Scholar] [CrossRef]
- Vörösmarty, C.J.; McIntyre, P.B.; Gessner, M.O.; Dudgeon, D.; Prusevich, A.; Green, P.; Glidden, S.; Bunn, S.E.; Sullivan, C.A.; Liermann, C.R.; et al. Global threats to human water security and river biodiversity. Nature 2010, 467, 555–561. [Google Scholar] [CrossRef] [PubMed]
- Richter, B.D.; Braun, D.P.; Mendelson, M.A.; Master, L.L. Threats to imperiled freshwater fauna. Conserv. Biol. 1997, 11, 1081–1093. [Google Scholar] [CrossRef]
- Pringle, C.M.; Naiman, R.J.; Bretschko, G.; Karr, J.R.; Oswood, M.W.; Webster, J.R.; Welcomme, R.L.; Winterbourn, M.J. Patch dynamics in lotic systems: The stream as a mosaic. J. N. Am. Benthol. Soc. 1988, 7, 503–524. [Google Scholar] [CrossRef]
- Cooper, A.R.; Infante, D.M.; Wehrly, K.E.; Wang, L.; Brenden, T.O. Identifying indicators and quantifying large-scale effects of dams on fishes. Ecol. Indic. 2016, 61, 646–657. [Google Scholar] [CrossRef]
- Humborg, C.; Ittekkot, V.; Cociasu, A.; Bodungen, B. Effect of Danube River dam on Black Sea biogeochemistry and ecosystem structure. Nature 1997, 386, 385–388. [Google Scholar] [CrossRef]
- Bain, M.B.; Finn, J.T.; Booke, H.E. Stream flow regulation and fish community structure. Ecology 1998, 69, 382–392. [Google Scholar] [CrossRef]
- Poff, N.L.; Ward, J.V. Implications of streamflow variability and predictability for lotic community structure: A regional analysis of streamflow patterns. Can. J. Fish. Aquat. Sci. 1989, 46, 1805–1818. [Google Scholar] [CrossRef]
- Kelly, V.J. Influence of reservoirs on solute transport: A regional-scale approach. Hydrol. Process. 2001, 15, 1227–1249. [Google Scholar] [CrossRef]
- Li, Z.; Wang, S.; Guo, J.; Fang, F.; Gao, X.; Long, M. Responses of phytoplankton diversity to physical disturbance under manual operation in a large reservoir, China. Hydrobiologia 2012, 684, 45–56. [Google Scholar] [CrossRef]
- Bouterfas, R.; Belkoura, M.; Dauta, A. Light and temperature effects on the growth rate of three freshwater algae isolated from a eutrophic lake. Hydrobiologia 2002, 489, 207–217. [Google Scholar] [CrossRef]
- Burford, M.A.; Webster, I.T.; Revill, A.T.; Kenyon, R.A.; Whittle, M.; Curwen, G. Controls on phytoplankton productivity in a wet–dry tropical estuary. Estuar. Coast. Shelf Sci. 2012, 113, 141–151. [Google Scholar] [CrossRef]
- Cao, J.; Chu, Z.; Du, Y.; Hou, Z.; Wang, S. Phytoplankton dynamics and their relationship with environmental variables of Lake Poyang. Hydrol. Res. 2016, 47, 249–260. [Google Scholar] [CrossRef]
- Lázár, A.N.; Wade, A.J.; Whitehead, P.G.; Neal, C.; Loewenthal, M. Reconciling observed and modelled phytoplankton dynamics in a major lowland UK river, the Thames. Hydrol. Res. 2012, 43, 576–588. [Google Scholar] [CrossRef]
- Zhang, C.; Lai, S.; Gao, X.; Xu, L. Potential impacts of climate change on water quality in a shallow reservoir in China. Environ. Sci. Pollut. Res. Int. 2015, 22, 14971–14982. [Google Scholar] [CrossRef] [PubMed]
- Kim, J.; Seo, D.; Jones, J.R. Harmful algal bloom dynamics in a tidal river influenced by hydraulic control structures. Ecol. Modell. 2022, 467, 109931. [Google Scholar] [CrossRef]
- Kim, J.S.; Jun, K.S. Flood Level Mitigation Effect of River Dredging. Korean Soc. Civ. Eng. 2010, 2, 139–146. [Google Scholar]
- Pringle, C. What is hydrologic connectivity and why is it ecologically important? Hydrol. Process. 2003, 17, 2685–2689. [Google Scholar] [CrossRef]
- Lu, Y.; Zhu, W.-Y.; Liu, Q.-Y.; Li, Y.; Tian, H.-W.; Cheng, B.-X.; Zhang, Z.-Y.; Wu, Z.-H.; Qing, J.; Sun, G.; et al. Impact of low-head dam removal on river morphology and habitat suitability in mountainous rivers. Int. J. Environ. Res. Public Health 2022, 19, 11743. [Google Scholar] [CrossRef]
- Wymore, A.S.; Ward, A.S.; Wohl, E.; Harvey, J.W. Viewing river corridors through the lens of critical zone science. Front. Water. 2023, 5, 1147561. [Google Scholar] [CrossRef]
- Bae, D.H.; Jung, I.I.; Han, H.J. Climate Change Impact Assessment and Adaptation Strategy on Water Resources in the Han River Basin. Gyunggi Nondan 2007, 9, 95–115. [Google Scholar]
- Lee, S.; Lee, D. Four Major South Korea’s Rivers Using Deep Learning Models. Int. J. Environ. Res. Public Health 2018, 15, 1322. [Google Scholar] [CrossRef]
- Kim, M.S.; Chung, Y.R.; Suh, E.H.; Song, W.W. Eutrophication of Nakdong River and statistical analysis of environmental factors. Algae 2002, 17, 105–115. [Google Scholar] [CrossRef]
- Yoo, Y.S. Evaluation of Chungju Lake Water Quality Using SWAT and CE-QUAL-W2 Model. Master’s Thesis, Konkuk University, Seoul, Republic of Korea, 2013. [Google Scholar]
- Paerl, H.W.; Fulton, R.S., III; Moisander, P.H.; Dyble, J. Harmful freshwater algal blooms, with an emphasis on cyanobacteria. Sci. World J. 2001, 1, 76–113. [Google Scholar] [CrossRef]
- Sukenik, A.; Kaplan, A. Cyanobacterial harmful algal blooms in aquatic ecosystems: A comprehensive outlook on current and emerging mitigation and control approaches. Microorganisms 2021, 9, 1472. [Google Scholar] [CrossRef] [PubMed]
- Zhang, Y.; Whalen, J.K.; Cai, C.; Shan, K.; Zhou, H. Harmful cyanobacteria-diatom/dinoflagellate blooms and their cyanotoxins in freshwaters: A nonnegligible chronic health and ecological hazard. Water Res. 2023, 233, 119807. [Google Scholar] [CrossRef]
- Mitrovic, S.M.; Oliver, R.L.; Rees, C.; Bowling, L.C.; Buckney, R.T. Critical flow velocities for the growth and dominance of Anabaena circinalis in some turbid freshwater rivers. Freshw. Biol. 2003, 48, 164–174. [Google Scholar] [CrossRef]
- Chae, S.K.; Oh, S.E.; Chun, S.H.; Ahn, H.K. Study on change of algae occurrence before & after Gangcheon and Ipoh weir construction at Namhan River. J. Wetl. Res. 2016, 18, 394–400. [Google Scholar]
- He, Y.; Chen, Z.; Feng, X.; Wang, G.; Wang, G.; Zhang, J. Daily samples revealing shift in phytoplankton community and its environmental drivers during summer in Qinhuangdao coastal area, China. Water 2022, 14, 1625. [Google Scholar] [CrossRef]
- Díaz-Torres, O.; de Anda, J.; Lugo-Melchor, O.Y.; Pacheco, A.; Orozco-Nunnelly, D.A.; Shear, H.; Senés-Guerrero, C.; Gradilla-Hernández, M.S. Rapid changes in the phytoplankton community of a subtropical, shallow, hypereutrophic lake during the rainy season. Front. Microbiol. 2021, 12, 617151. [Google Scholar] [CrossRef] [PubMed]
- Mangolte, I.; Lévy, M.; Dutkiewicz, S.; Clayton, S.; Jahn, O. Plankton community response to fronts: Winners and losers. J. Plankton Res. 2022, 44, 241–258. [Google Scholar] [CrossRef]
- APHA. Standard Method for the Examination of Water and Wastewater; American Public Health Association, American Water Works Association and Water Environmental Federation: Washington, DC, USA, 1998; p. 1220. [Google Scholar]
- Krammer, K.; Lange-Bertalot, H. Bacillariophyceae. In Siij3wasserfiora von Mitteleuropa; Ettl, H., Gerloff, J., Heynig, H., Mollenhauer, D., Eds.; Gustav Fischer: Stuttgart, Germany; Jena, Germany, 1986; Volume 2/1, p. 876. [Google Scholar]
- Krammer, K.; Lange-Bertalot, H. Bacillariophyceae. In Siij3wasserfiora von Mitteleuropa; Ettl, H., Gerloff, J., Heynig, H., Mollenhauer, D., Eds.; Gustav Fischer: Stuttgart, Germany; Jena, Germany, 1988; Volume 2/2, p. 596. [Google Scholar]
- Krammer, K.; Lange-Bertalot, H. Bacillariophyceae. In Siij3wasserfiora von Mitteleuropa; Ettl, H., Gerloff, J., Heynig, H., Mollenhauer, D., Eds.; Gustav Fischer: Stuttgart, Germany; Jena, Germany, 1991; Volume 2/3, p. 576. [Google Scholar]
- Krammer, K.; Lange-Bertalot, H. Bacillariophyceae. Teil: Achnanthaceae. Kritische Erganzungen zu Navicula (Lineolatae) und Gomphonema. In Susswasserflora von Mitteleuropa; Ettl, H., Gartner, G., Gerloff, J., Heynig, H., Mollenhauer, D., Eds.; Gustav Fischer: Stuttgart, Germany; Jena, Germany, 1988; Volume 2/4, p. 437. [Google Scholar]
- Hirose, H.; Akiyama, M.; Ioriya, T.; Imahori, K.; Kasaki, H.; Kumano, S.; Kobayashi, H.; Takahashi, E.; Tsumura, K.; Hirano, M.; et al. Illustration of the Japanese Freshwater Algae; Uchida Rokakuho Publishing Co.: Tokyo, Japan, 1977; p. 932. [Google Scholar]
- Yamagishi, T.; Akiyama, M. Photomicrographs of the Freshwater Algae; Uchida Rokakuho Publishing Co.: Tokyo, Japan, 1984; pp. 1–20. [Google Scholar]
- Jung, J. Illustration of the Korea Freshwater Algae; Academic Publishing Co., Ltd.: Seoul, Republic of Korea, 1993; p. 496. [Google Scholar]
- Prescott, G.W. How to Know the Freshwater Algae; W.M.C. Company Publishers: Dubuque, IA, USA, 1964; p. 272. [Google Scholar]
- McNaughton, S.J. Relationship among functional properties of California grassland. Nature 1967, 216, 168–169. [Google Scholar] [CrossRef]
- Shannon, C.E.; Weiner, W. The Mathematical Theory of Communication; University of Illinois Press: Urbana, IL, USA, 1963. [Google Scholar]
- Margalef, R. Information theory in biology. Gen. Syst. Yearb. 1958, 3, 36–71. [Google Scholar]
- Pielou, E.C. The measurement of diversity in different types of biological collections. J. Theor. Biol. 1966, 13, 131–144. [Google Scholar] [CrossRef]
- McCune, B.; Mefford, M.J. PC-ORD Multivariate Analysis of Ecological Data, Version 4; MjM Software Design: Gleneden Beach, OR, USA, 1999. [Google Scholar]
- Dvoretsky, V.G.; Vodopianova, V.V.; Bulavina, A.S. Effects of climate change on chlorophyll a in the Barents Sea: A long-term assessment. Biology 2023, 12, 119. [Google Scholar] [CrossRef]
- Mudaliar, A.; Pandya, U. Assessment of cyanobacterial chlorophyll a as an indicator of water quality in two wetlands using multi-temporal Sentinel-2 images. Environ. Sci. Proc. 2023, 25, 68. [Google Scholar] [CrossRef]
- Song, Y.; Wang, C.; Sun, D. Both dissolved oxygen and chlorophyll explain the large-scale longitudinal variation of deep scattering layers in the tropical Pacific Ocean. Front. Mar. Sci. 2022, 9, 782032. [Google Scholar] [CrossRef]
- Sun, J.Z.; Wang, T.; Huang, R.; Yi, X.; Zhang, D.; Beardall, J.; Hutchins, D.A.; Liu, X.; Wang, X.; Deng, Z.; et al. Enhancement of diatom growth and phytoplankton productivity with reduced O2 availability is moderated by rising CO2. Commun. Biol. 2022, 5, 54. [Google Scholar] [CrossRef] [PubMed]
- Zennaro, F.; Furlan, E.; Canu, D.; Alcazar, L.A.; Rosati, G.; Solidoro, C.; Aslan, S.; Critto, A. Venice lagoon chlorophyll-a evaluation under climate change conditions: A hybrid water quality machine learning and biogeochemical-based framework. Ecol. Indic. 2023, 157, 111245. [Google Scholar] [CrossRef]
- Hou, Z.; Jiang, Y.; Liu, Q.; Alcazar, L.A.; Rosati, G.; Solidoro, C.; Aslan, S.; Critto, A. Impacts of environmental variables on a phytoplankton community: A case study of the tributaries of a subtropical river, Southern China. Water 2018, 10, 152. [Google Scholar] [CrossRef]
- Li, X.; Huang, T.; Ma, W.; Sun, X.; Zhang, H. Effects of rainfall patterns on water quality in a stratified reservoir subject to eutrophication: Implications for management. Sci. Total Environ. 2015, 521–522, 27–36. [Google Scholar] [CrossRef]
- Naik, S.; Mishra, R.K.; Sahu, K.C.; Lotliker, A.A.; Panda, U.S.; Mishra, P. Monsoonal influence and variability of water quality, phytoplankton abundance in the tropical coastal waters–A multivariate statistical approach. Front. Mar. Sci. 2020, 7, 648. [Google Scholar] [CrossRef]
- Thompson, P.A.; Paerl, H.W.; Campbell, L.; Yin, K.; McDonald, K.S. Tropical cyclones: What are their impacts on phytoplankton ecology? J. Plankton Res. 2023, 45, 180–204. [Google Scholar] [CrossRef]
- Yaqoob, M.M.; Somlyai, I.; Berta, C.; Bácsi, I.; Al-Tayawi, A.N.; Al-Ahmady, K.K.; Mohammed, R.H.; Alalami, O.; Grigorszky, I. The impacts of land use and seasonal effects on phytoplankton taxa and physical-chemical variables in the Tigris River within the City of Mosul. Water 2023, 15, 1062. [Google Scholar] [CrossRef]
- Reza, A.; Eum, J.; Jung, S.; Choi, Y.; Owen, J.S.; Kim, B. Export of non-point source suspended sediment, nitrogen, and phosphorus from sloping highland agricultural fields in the East Asian monsoon region. Environ. Monit. Assess. 2016, 188, 692. [Google Scholar] [CrossRef]
- Cho, Y.-C.; Im, J.-K.; Han, J.; Kim, S.-H.; Kang, T.; Lee, S. Comprehensive water quality assessment using Korean water quality indices and multivariate statistical techniques for sustainable water management of the Paldang reservoir, South Korea. Water 2023, 15, 509. [Google Scholar] [CrossRef]
- Kim, D.; Sung, J.W.; Kim, T.-H.; Cho, H.-M.; Kim, J.; Park, H.J. Comparative seasonality of phytoplankton community in two contrasting temperate estuaries on the western coast of Korea. Front. Mar. Sci. 2023, 10, 1257904. [Google Scholar] [CrossRef]
- Sun, Y.; Youn, S.-H.; Oh, H.J.; Joo, H.-T.; Kim, Y.; Kang, J.J.; Lee, D.; Kim, K.; Jang, H.K.; Jo, N.; et al. Spatial and temporal distribution of phytoplankton community in relation to environmental factors in the southern coastal waters of Korea. Front. Mar. Sci. 2022, 9, 950234. [Google Scholar] [CrossRef]
- Behrenfeld, M.J.; Boss, E.S.; Halsey, K.H. Phytoplankton community structuring and succession in a competition-neutral resource landscape. ISME Commun. 2021, 1, 12. [Google Scholar] [CrossRef]
- Chang, C.W.; Miki, T.; Ye, H.; Souissi, S.; Adrian, R.; Anneville, O.; Agasild, H.; Ban, S.; Beeri-Shlevin, Y.; Chiang, Y.R.; et al. Causal networks of phytoplankton diversity and abundance are modulated by environmental context. Nat. Commun. 2022, 13, 1140. [Google Scholar] [CrossRef]
- Heinrichs, M.E.; Mori, C.; Dlugosch, L. Complex interactions between aquatic organisms and their chemical environment elucidated from different perspectives. In YOUMARES 9–The Oceans: Our Research, Our Future; Jungblut, S., Liebich, V., Bode-Dalby, M., Eds.; Springer: Cham, Switzerland, 2020. [Google Scholar] [CrossRef]
- Loerracher, A.K.; Schmidt, J.; Ebke, P.; Schmolke, A.; Abi-Akar, F.; Galic, N.; Ashauer, R. Characterization of patterns and variability in the dynamics of outdoor aquatic mesocosms: Exploring the capabilities and challenges in data supporting aquatic system models. Ecotoxicology 2023, 32, 782–801. [Google Scholar] [CrossRef]
- Nguyen, J.; Lara-Gutiérrez, J.; Stocker, R. Environmental fluctuations and their effects on microbial communities, populations and individuals. FEMS Microbiol. Rev. 2021, 45, fuaa068. [Google Scholar] [CrossRef]
- Kim, D.; Lim, J.H.; Chun, Y.; Nayna, O.K.; Begum, M.S.; Park, J.H. Phytoplankton nutrient use and CO2 dynamics responding to long-term changes in riverine N and P availability. Water Res. 2021, 203, 117510. [Google Scholar] [CrossRef]
- Li, X.; Huang, M.; Li, N.; Zhao, H.; Yang Pu, Y.; Huang, J.; Yang, S.; Qin, X.; Dong, K.; Li, M.; et al. Effects of environmental factors on mycoplankton diversity and trophic modes in coastal surface water. Ecol. Indic. 2023, 146, 109778. [Google Scholar] [CrossRef]
- Guy, W.; Núria, B.; Brown Lee, E.; Death, R.G.; Durance, I.; Gray, C.; Hladyz, S.; Ledger, M.E.; Milner, A.M.; Ormerod, S.J.; et al. The effects of climatic fluctuations and extreme events on running water ecosystems. Phil. Trans. R. Soc. B. 2016, 371, 20150274. [Google Scholar] [CrossRef]
- Cho, I.-H.; Kim, H.-K.; Lee, M.-H.; Kim, Y.-J.; Lee, H.; Kim, B.-H. The effect of monsoon rainfall patterns on epilithic diatom communities in the Hantangang River, Korea. Water 2020, 12, 1471. [Google Scholar] [CrossRef]
- de Lima Pinheiro, M.M.; Temponi Santos, B.L.; Vieira Dantas Filho, J.; Perez Pedroti, V.; Cavali, J.; Brito Dos Santos, R.; Oliveira Carreira Nishiyama, A.C.; Guedes, E.A.C.; de Vargas Schons, S. First monitoring of cyanobacteria and cyanotoxins in freshwater from fish farms in Rondônia state, Brazil. Heliyon 2023, 9, e18518. [Google Scholar] [CrossRef] [PubMed]
- Wang, Z.; Li, Q.; Tian, Y.; Li, X.; Chen, X.; Tian, Y.; Xue, J. Effect of land use and environmental variables on phytoplankton community structure in high-elevation river, upper Yangtze River, China. Front. Environ. Sci. 2023, 11, 1084461. [Google Scholar] [CrossRef]
- Gomes, A.L.; Cunha, C.J.; Lima, M.O.; Sousa, E.B.; Costa-Tavares, V.B.; Martinelli-Lemos, J.M. Biodiversity and interannual variation of cyanobacteria density in an estuary of the Brazilian Amazon. An. Acad. Bras. Ciências 2021, 93, e20191452. [Google Scholar] [CrossRef]
- Han, H.; Xiao, R.; Gao, G.; Yin, B.; Liang, S.; Lv, X. Influence of a heavy rainfall event on nutrients and phytoplankton dynamics in a well-mixed semi-enclosed bay. J. Hydrol. 2023, 617, 128932. [Google Scholar] [CrossRef]
- Jargal, N.; An, K.-G. Seasonal and interannual responses of blue-green algal taxa and chlorophyll to a monsoon climate, flow regimes, and N:P ratios in a temperate drinking-water reservoir. Sci. Total Environ. 2023, 896, 165306. [Google Scholar] [CrossRef]
- Liu, X.; Lu, X.; Chen, Y. The effects of temperature and nutrient ratios on Microcystis blooms in Lake Taihu, China: An 11-year investigation. Harmful Algae 2011, 10, 337–343. [Google Scholar] [CrossRef]
- Trombetta, T.; Vidussi, F.; Mas, S.; Parin, D.; Simier, M.; Mostajir, B. Water temperature drives phytoplankton blooms in coastal waters. PLoS ONE 2019, 14, e0214933. [Google Scholar] [CrossRef]
- Su, M.; Zhu, Y.; Andersen, T.; Andersen, T.; Wang, X.; Yu, Z.; Lu, J.; Song, Y.; Cao, T.; Yu, J.; et al. Light-dominated selection shaping filamentous cyanobacterial assemblages drives odor problem in a drinking water reservoir. NPJ Clean Water 2022, 5, 37. [Google Scholar] [CrossRef]
- Bonilla, S.; Aguilera, A.; Aubriot, L.; Huszar, V.; Almanza, V.; Haakonsson, S.; Izaguirre, I.; O’Farrell, I.; Salazar, A.; Becker, V.; et al. Nutrients and not temperature are the key drivers for cyanobacterial abundance in the Americas. Harmful Algae 2023, 21, 102367. [Google Scholar] [CrossRef]
- Wagner, N.D.; Quach, E.; Buscho, S.; Ricciardelli, A.; Kannan, A.; Naung, S.W.; Phillip, G.; Sheppard, B.; Ferguson, L.; Allen, A.; et al. Nitrogen form, concentration, and micronutrient availability affect microcystin production in cyanobacterial blooms. Harmful Algae 2021, 103, 102002. [Google Scholar] [CrossRef] [PubMed]
- Su, X.; Xue, Q.; Steinman, A.D.; Zhao, Y.; Xie, L. Spatiotemporal dynamics of microcystin variants and relationships with environmental parameters in Lake Taihu, China. Toxins 2015, 7, 3224–3244. [Google Scholar] [CrossRef] [PubMed]
- Chorus, I.; Fastner, J.; Welker, M. Cyanobacteria and Cyanotoxins in a Changing Environment: Concepts, Controversies, Challenges. Water 2021, 13, 2463. [Google Scholar] [CrossRef]
- Krausfeldt, L.E.; Farmer, A.T.; Castro, H.F.; Krausfeldt, L.E.; Farmer, A.T.; Castro, H.F.; Boyer, G.L.; Campagna, S.R.; Wilhelm, S.W. Nitrogen flux into metabolites and microcystins changes in response to different nitrogen sources in Microcystis aeruginosa NIES-843. Environ. Microbiol. 2020, 22, 2419–2431. [Google Scholar] [CrossRef] [PubMed]
- Chen, Q.; Wang, M.; Zhang, J.; Shi, W.; Mynett, A.E.; Yan, H.; Hu, L. Physiological effects of nitrate, ammonium, and urea on the growth and microcystins contamination of Microcystis aeruginosa: Implication for nitrogen mitigation. Water Res. 2019, 163, 114890. [Google Scholar] [CrossRef] [PubMed]
- Peng, G.; Martin, R.M.; Dearth, S.P.; Sun, X.; Boyer, G.L.; Campagna, S.R.; Lin, S.; Wilhelm, S.W. Seasonally relevant cool temperatures interact with N chemistry to increase microcystins produced in lab cultures of Microcystis aeruginosa NIES-843. Environ. Sci. Technol. 2018, 52, 4127–4136. [Google Scholar] [CrossRef] [PubMed]
- Yang, N.; Li, Z.; Wu, Z.; Liu, X.; Zhang, Y.; Sun, T.; Wang, X.; Zhao, Y.; Tong, Y. Differential effects of nitrate and ammonium on the growth of algae and microcystin production by nitrogen-fixing Nostoc sp. and non-nitrogen-fixing Microcystis aeruginosa. Water Sci. Technol. 2023, 88, 136–150. [Google Scholar] [CrossRef] [PubMed]
- Kuwata, A.; Miyazaki, T. Effects of ammonium supply rates on competition between Microcystis novacekii (Cyanobacteria) and Scenedesmus quadricauda (Chlorophyta): Simulation study. Ecol. Modell. 2000, 135, 81–87. [Google Scholar] [CrossRef]
- Dashkova, V.; Malashenkov, D.V.; Baishulakova, A.; Davidson, T.A.; Vorobjev, I.A.; Jeppesen, E.; Barteneva, N.S. Changes in phytoplankton community composition and phytoplankton cell size in response to nitrogen availability depend on temperature. Microorganisms 2022, 10, 1322. [Google Scholar] [CrossRef] [PubMed]
- Tarafdar, L.; Mohapatra, M.; Muduli, P.R.; Kumar, A.; Mishra, D.R.; Rastogi, G. Co-occurrence patterns and environmental factors associated with rapid onset of Microcystis aeruginosa bloom in a tropical coastal lagoon. J. Environ. Manag. 2023, 325, 116580. [Google Scholar] [CrossRef] [PubMed]
- Wang, X.; Wang, L.; Shang, M.; Song, L.; Shan, K. Revealing physiochemical factors and zooplankton influencing Microcystis Bloom toxicity in a large-shallow lake using bayesian machine learning. Toxins 2022, 14, 530. [Google Scholar] [CrossRef] [PubMed]
- Paerl, H.W.; Xu, H.; McCarthy, M.J.; Zhu, G.; Qin, B.; Li, Y.; Gardner, W.S. Controlling harmful cyanobacterial blooms in a hyper-eutrophic lake (Lake Taihu, China): The need for a dual nutrient (N & P) management strategy. Water Res. 2011, 45, 1973–1983. [Google Scholar] [CrossRef] [PubMed]
- Liu, S.; Johnson, F.; Tamburic, B.; Crosbie, N.D.; Glamore, W. The effectiveness of global constructed shallow waterbody design guidelines to limit harmful algal blooms. Water Resour. Res. 2021, 57, e2020WR028918. [Google Scholar] [CrossRef]
- Levy, S. Microcystis rising: Why phosphorus reduction isn’t enough to stop CyanoHABs. Environ. Health Perspect. 2017, 125, A34–A39, Erratum in Environ. Health Perspect. 2017, 125, A62. [Google Scholar] [CrossRef]
- Straškraba, M.; Tundisi, J.G.; Duncan, A. State-of-the-art of reservoir limnology and water quality management. Comp. Reserv. Limnol. Water Qual. Manag. Kluwer Dev. Hydrobiol. 1993, 77, 213–288. [Google Scholar] [CrossRef]
- Kennedy, R.H. Considerations for Establishing Nutrient Criteria for Reservoirs. Lake Reserv. Manag. 2001, 17, 175–187. [Google Scholar] [CrossRef]
Figure 1.
Designated monitoring stations for assessing water quality and phytoplankton at the three sequential weirs along the South Han River, Korea, from May 2019 to October 2020. The weirs are identified as Kangcheon Weir (KCW), Yeoju Weir (YJW), and Ipo Weir (IPW).
Figure 1.
Designated monitoring stations for assessing water quality and phytoplankton at the three sequential weirs along the South Han River, Korea, from May 2019 to October 2020. The weirs are identified as Kangcheon Weir (KCW), Yeoju Weir (YJW), and Ipo Weir (IPW).
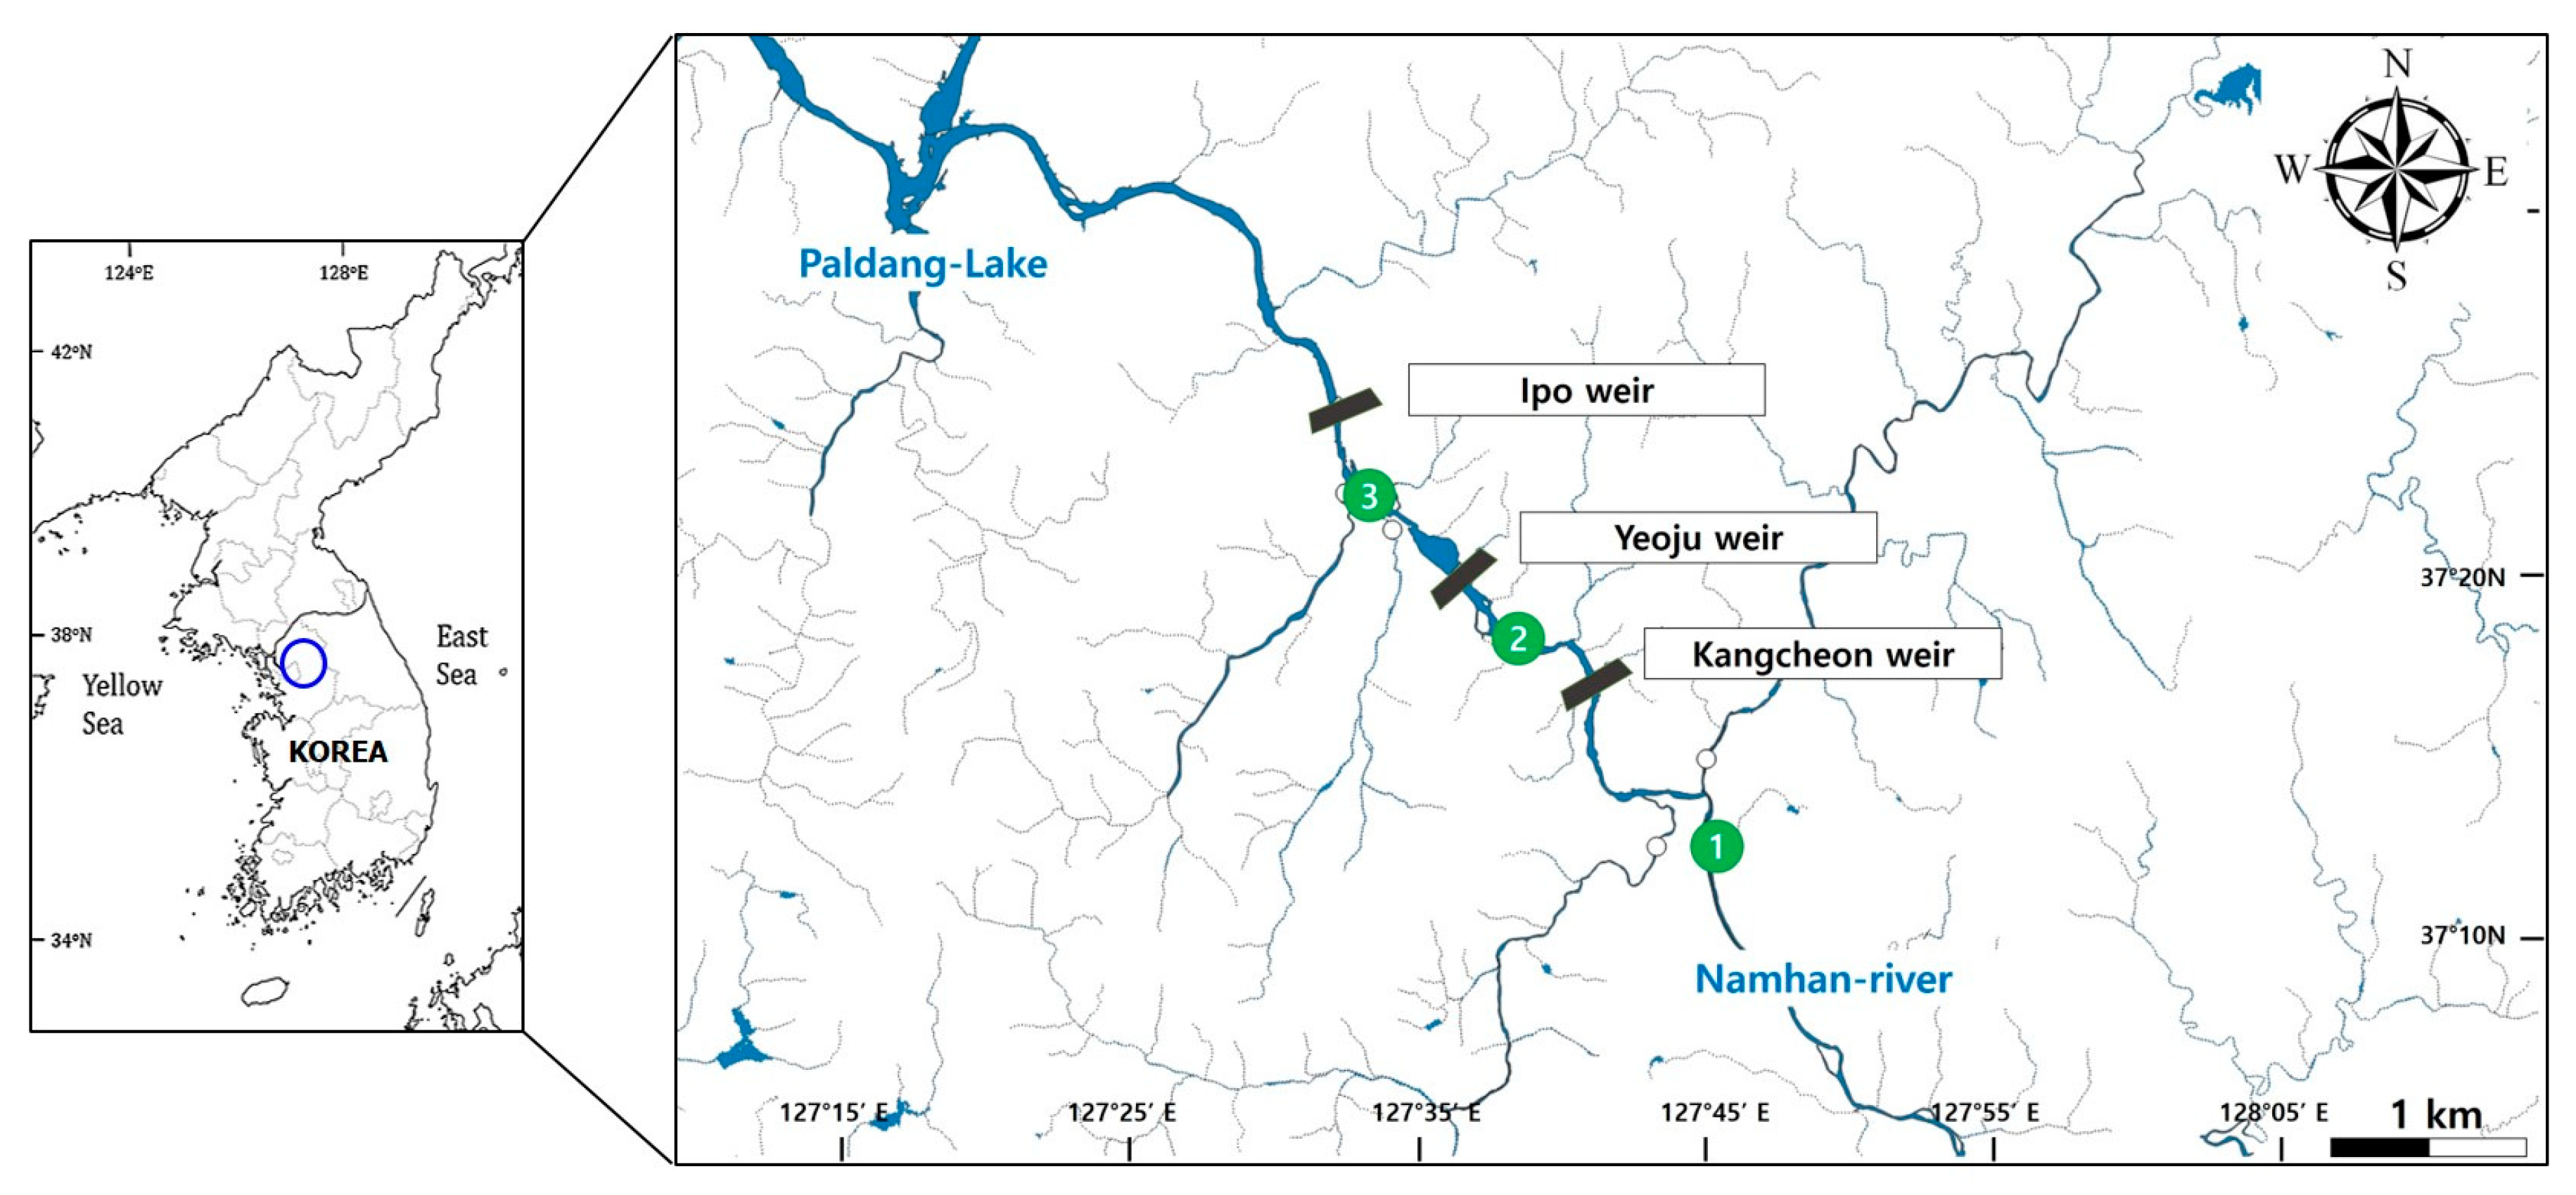
Figure 2.
Monthly fluctuations in water parameters at the three sequential weirs along the South Han River, Korea, from May 2019 to October 2020. The weirs are identified as Kangcheon Weir (KCW), Yeoju Weir (YJW), and Ipo Weir (IPW). Parameters are hydraulic retention time (HRT, (a)), water temperature (WT, (b)), suspended solids (SS, (c)), pH (d), total nitrogen (TN, (e)), total phosphorus (TP, (f)), nitrate nitrogen (NO3-N, (g)), phosphate (PO4-P, (h)) levels, dissolved oxygen (DO, (i)), chlorophyll-a (Chl-a, (j)), and chemical oxygen demand (COD, (k)).

Figure 3.
Monthly fluctuations in phytoplankton abundance and harmful cyanobacteria (Microcystis, Anabaena, Oscillatoria, and Aphanizomenon) at the three sequential weirs along the South Han River, Korea, from May 2019 to October 2020. The weirs are identified as Kangcheon Weir (KCW), Yeoju Weir (YJW), and Ipo Weir (IPW).

Figure 4.
Monthly variations in ecological indices of phytoplankton communities at the three sequential weirs along the South Han River, Korea, from May 2019 to October 2020. The weirs are identified as Kangcheon Weir (KCW), Yeoju Weir (YJW), and Ipo Weir (IPW). (a) DI: dominant index, (b) H′: diversity index, (c) J: richness index, (d) e: evenness index.

Figure 5.
Canonical correspondence analysis (CCA) showed the relationship between phytoplankton (a) and environmental parameters (b) at the three sequential weirs along the South Han River, Korea, from May 2019 to October 2020. Cyanobacteria (Cyano), Chlorophyceae (Chloro), Bacillariophyceae (Bacill), Microcystis (Micro), Anabaena (Anabae), Oscillatoria (Oscill), Aphanizomenon (Aphano), and others; total phytoplankton excluding cyanobacteria. Hydraulic retention time (HRT), water temperature (temp), pH, dissolved oxygen (DO), biochemical oxygen demand (BOD), chemical oxygen demand (COD), suspended solids (SS), chlorophyll-a (Chl-a), total nitrogen (TN), nitrate (NO3-N), ammonia (NH3-N), total phosphorus (TP), and phosphate (PO4-P).

Figure 6.
Comparative analysis of key water quality parameters, namely the N/P ratio, water temperature (°C), and hydraulic retention time (HRT), in relation to instances where the concentration of Microcystis, a harmful cyanobacteria species, exceeded 1000 cells/mL at the three sequential weirs along the South Han River, Korea, from May 2019 to October 2020.


Table 1.
Geo-physical characteristics at the three sequential weirs along the South Han River, Korea, from May 2019 to October 2020. The weirs are identified as Kangcheon Weir (KCW), Yeoju Weir (YJW), and Ipo Weir (IPW).
Table 1.
Geo-physical characteristics at the three sequential weirs along the South Han River, Korea, from May 2019 to October 2020. The weirs are identified as Kangcheon Weir (KCW), Yeoju Weir (YJW), and Ipo Weir (IPW).
| Items | KCW | YJW | IPW |
|---|---|---|---|
| Latitude N | 37°16′37.6″ | 37°19′37.12″ | 37°24′17.68″ |
| Longitude E | 127°40′54.87″ | 127°36′22.14″ | 127°32′1.68″ |
| Catchment (km2) | 10,972 | 11,115 | 11,803 |
| Type | Concrete Gravity | Concrete Gravity | Concrete Gravity |
| Height (m) | 8 | 8 | 6 |
| Length (m) | 440 | 513 | 521 |
| Volume (106 m3) | 8.7 | 11.3 | 14.3 |
| Real time water quality site | Wonju | Yeoju1 | Yeoju2 |
| HRT (h) * | 17.5 | 18.0 | 23.0 |
| Distance (km) ** | 11.2 1 | 10.0 2 | 11.8 3 |
Note(s): * Chae et al. [38], ** 1 Distance from the mainstream of Seom River to KCW, 2 Distance between KCW and YJW, 3 Distance between YJW and IPW.
Table 2.
Dominant phytoplankton species and relative abundance (%) at the three sequential weirs along the South Han River, Korea, from May 2019 to October 2020. The weirs are identified as Kangcheon Weir (KCW), Yeoju Weir (YJW), and Ipo Weir (IPW).
Table 2.
Dominant phytoplankton species and relative abundance (%) at the three sequential weirs along the South Han River, Korea, from May 2019 to October 2020. The weirs are identified as Kangcheon Weir (KCW), Yeoju Weir (YJW), and Ipo Weir (IPW).
| Yr | Month | KCW | YJW | IPW |
|---|---|---|---|---|
| 2019 | May | Nitzschia acicularis (13) | Stephanodiscus hantzschii (20) | Stephanodiscus hantzschii (20) |
| June | Merismopedia glauca (52) | Pandorina morum (52) | Pandorina morum (31) | |
| July | Aphanocapsa sp. (56) | Aphanocapsa sp. (33) | Aphanocapsa sp. (51) | |
| August | Microcystis aeruginosa (31) | Pseudanabaena limnetica (45) | Microcystis aeruginosa (38) | |
| September | Oscillatoria sp. (13) | Merismopedia glauca (44) | Aulacoseira granulata (14) | |
| October | Melosira varians (10) | Nitzschia palea (11) | Navicula viridula var. rostellata (12) | |
| 2020 | May | Rhodomonas lacustris (17) | Stephanodiscus hantzschii (9) | Navicula cryptocephala (11) |
| June | Aulacoseira granulata (13) | Aphanocapsa sp. (25) | Pandorina morum (37) | |
| July | Aphanocapsa muscicola (61) | Aphanocapsa sp. (64) | Merismopedia glauca (27) | |
| August | Micractinium pusillum (22) | Pseudanabaena limnetica (20) | Pandorina morum (20) | |
| September | Volvox sp. (45) | Skeletonema potamos (17) | Merismopedia glauca (33) | |
| October | Westella botryoides (19) | Actinastrum hantzschii (18) | Skeletonema potamos (25) |
Table 3.
ANOVA of phytoplankton and environmental parameters at the three sequential weirs along the South Han River, Korea, from May 2019 to October 2020. The weirs are identified as Kangcheon Weir (KCW), Yeoju Weir (YJW), and Ipo Weir (IPW).
Table 3.
ANOVA of phytoplankton and environmental parameters at the three sequential weirs along the South Han River, Korea, from May 2019 to October 2020. The weirs are identified as Kangcheon Weir (KCW), Yeoju Weir (YJW), and Ipo Weir (IPW).
| Parameters * | KCW | YJW | IPW | F | p |
|---|---|---|---|---|---|
| HRT | 0.9 ± 0.1 | 1.1 ± 0.1 | 1.2 ± 0.1 | 1.530 | 0.232 |
| WT | 18.6 ± 0.8 | 20.3 ± 0.9 | 21.8 ± 1.0 | 3.252 | 0.051 |
| SS | 14.2 ± 8.0 | 7.4 ± 1.3 | 10.8 ± 2.5 | 0.484 | 0.620 |
| pH | 8.6 ± 0.1 b | 8.1 ± 0.1 a | 8.1 ± 0.1 a | 11.964 | 0.000 |
| TN | 2.36 ± 0.06 | 2.25 ± 0.08 | 2.11 ± 0.12 | 1.935 | 0.160 |
| TP | 0.05 ± 0.01 | 0.04 ± 0.01 | 0.05 ± 0.01 | 0.127 | 0.881 |
| N/P ratio | 47.2 ± 6.0 ab | 56.3 ± 8.0 a | 42.2 ± 12.0 b | 4.112 | 0.033 |
| DO | 10.2 ± 0.3 | 9.6 ± 0.2 | 9.9 ± 0.4 | 1.159 | 0.326 |
| BOD | 0.9 ± 0.1 | 0.9 ± 0.1 | 1.2 ± 0.2 | 1.540 | 0.229 |
| COD | 3.7 ± 0.3 | 3.8 ± 0.1 | 4.2 ± 0.1 | 1.571 | 0.223 |
| Chl-a | 6.2 ± 1 | 7.4 ± 1.2 | 6.9 ± 1.1 | 0.297 | 0.745 |
| CYANO | 688.9 ± 262.4 | 871.8 ± 429.3 | 1689.6 ± 1011.4 | 0.668 | 0.520 |
| BACILL | 713.2 ± 103.8 | 773.3 ± 108.2 | 1085.1 ± 158.5 | 2.512 | 0.097 |
| CHLORO | 541.4 ± 172.9 | 714.4 ± 284.9 | 881.1 ± 291.5 | 0.441 | 0.647 |
| Other | 88.2 ± 17.9 b | 121.8 ± 31.3 a | 207.4 ± 50.4 a | 2.950 | 0.066 |
| Microcystis | 143.4 ± 120.3 | 24.1 ± 16.5 | 494.9 ± 444.0 | 0.848 | 0.437 |
| Anabaena | 12.5 ± 12.5 | 3.3 ± 3.3 | - | 0.751 | 0.480 |
| Oscillatoria | 4.4 ± 4.4 | - | 12.5 ± 12.5 | 0.684 | 0.511 |
| Aphanizomenon | - | 11.7 ± 11.7 | - | 1.000 | 0.379 |
Note(s): * Parameters are hydraulic retention time (HRT, day), water temperature (WT, °C), suspended solids (SS, mg/L), pH, total nitrogen (TN, mg/L), total phosphorus (TP, ug/L), N/P ratio (TN/TP), dissolved oxygen (DO, mg/L), chlorophyll-a (Chl-a, mg/m3), and chemical oxygen demand (COD, mg/L). Other total phytoplankton excluded Cyanobacteria (CYANO), Bacillariophyceae (BACILL), and Chlorophyceae (CHLORO); four cyanobacterial density (cells/mL). In the table, post-hoc test results are indicated by small letters such as ‘a’, ‘b’, and ‘ab’. It is shown by these letters whether the average value of the parameter for each weir is significantly different compared to the average value for other weirs.
Disclaimer/Publisher’s Note: The statements, opinions and data contained in all publications are solely those of the individual author(s) and contributor(s) and not of MDPI and/or the editor(s). MDPI and/or the editor(s) disclaim responsibility for any injury to people or property resulting from any ideas, methods, instructions or products referred to in the content. |
© 2024 by the authors. Licensee MDPI, Basel, Switzerland. This article is an open access article distributed under the terms and conditions of the Creative Commons Attribution (CC BY) license (https://creativecommons.org/licenses/by/4.0/).
Share and Cite
MDPI and ACS Style
Kim, Y.-H.; Cho, I.-H.; Kim, H.-K.; Hwang, E.-A.; Han, B.-H.; Kim, B.-H. Assessing the Impact of Weirs on Water Quality and Phytoplankton Dynamics in the South Han River: A Two-Year Study. Water 2024, 16, 833. https://doi.org/10.3390/w16060833
AMA Style
Kim Y-H, Cho I-H, Kim H-K, Hwang E-A, Han B-H, Kim B-H. Assessing the Impact of Weirs on Water Quality and Phytoplankton Dynamics in the South Han River: A Two-Year Study. Water. 2024; 16(6):833. https://doi.org/10.3390/w16060833
Chicago/Turabian StyleKim, Young-Hyo, In-Hwan Cho, Ha-Kyung Kim, Eun-A Hwang, Byung-Hun Han, and Baik-Ho Kim. 2024. "Assessing the Impact of Weirs on Water Quality and Phytoplankton Dynamics in the South Han River: A Two-Year Study" Water 16, no. 6: 833. https://doi.org/10.3390/w16060833
Note that from the first issue of 2016, this journal uses article numbers instead of page numbers. See further details here.