
Monetization of Ecosystem Services from Nature-Based Solutions for Agricultural Diffuse Pollution Control: Simplified Value Transfer Method at European Scale

 , , and
Abstract
:1. Introduction
2. Material and Methods
2.1. Literature-Based Review of Benefits
2.2. Literature-Based Review of Economic Valuation
- the economic valuations must have addressed only study sites located in regions at similar latitudes and which share similar socio-economic characteristics with the target areas of the application of the methodology (i.e., EU and North America were considered);
- the environmental goods and services valued must be relevant to the benefits of the policy sites, thus economic valuations of the ecosystem services benefits deriving from the implementation of NBS for diffuse pollution control have been preferred. Some exceptions have been allowed for those benefits that report comparable values even in the case of generic ES valuations (as for Water Quality) and other exceptions have been allowed for those benefits of interest that have not been extensively assessed in previous NBS studies (i.e., Nuisance and Awareness/Education).
- summary studies, such as meta-analyses or value transfers of primary valuation literature using either conventional or non-conventional environmental valuation techniques;
- primary empirical analyses that use conventional techniques to determine individual preferences on environmental services;
- non peer-reviewed publications (master and doctoral thesis, technical reports and proceedings).
2.3. Value Transfer Methodology
- NBS characteristics;
- The monetary valuation technique used to calculate the economic value; ref. [50] claim that the introduction of a rank ordering on monetary valuation techniques allows to better compare different studies, guiding the valuation process;
- The indicator used to quantify the extent of the benefits.
- 1 when confidence level final scores [(i) + (ii) + (iii)] is 7
- 0.9 when confidence level final scores [(i) + (ii) + (iii)] is 6
- 0.8 when confidence level final scores [(i) + (ii) + (iii)] is 5
- 0.7 when confidence level final scores [(i) + (ii) + (iii)] is 4
- 0.5 when confidence level final scores [(i) + (ii) + (iii)] is less than 4
- is the value transfer of the ecosystem service in the policy site (PS) for the NBS of interest in 2021, expressed in EUR (VT steps 1 + 2 + 3 + 4 + 5)
- is the value transfer of the ecosystem service in the study site (SS) for the NBS of interest in 2021, expressed in USD (VT steps 1 + 2)
- is the Correction Factor assumed by the decision maker (VT step 3)
- is the GDP per PPP for the SS country, expressed in USD (VT step 4)
- is the Gross Domestic Product (GDP) per capita based on Purchasing Power Parity (PPP) for the PS country, expressed in USD (VT step 4)
- is the Dollar to Euro exchange rate in 2021, equal to 0.845494 EUR/USD (VT step 5)
2.4. Case Study Application
3. Results
3.1. ES Identification and Classification
3.2. Study Site Collection
3.3. Application of Adjusted Value Transfer Methodology—VT Steps (1) to (3)
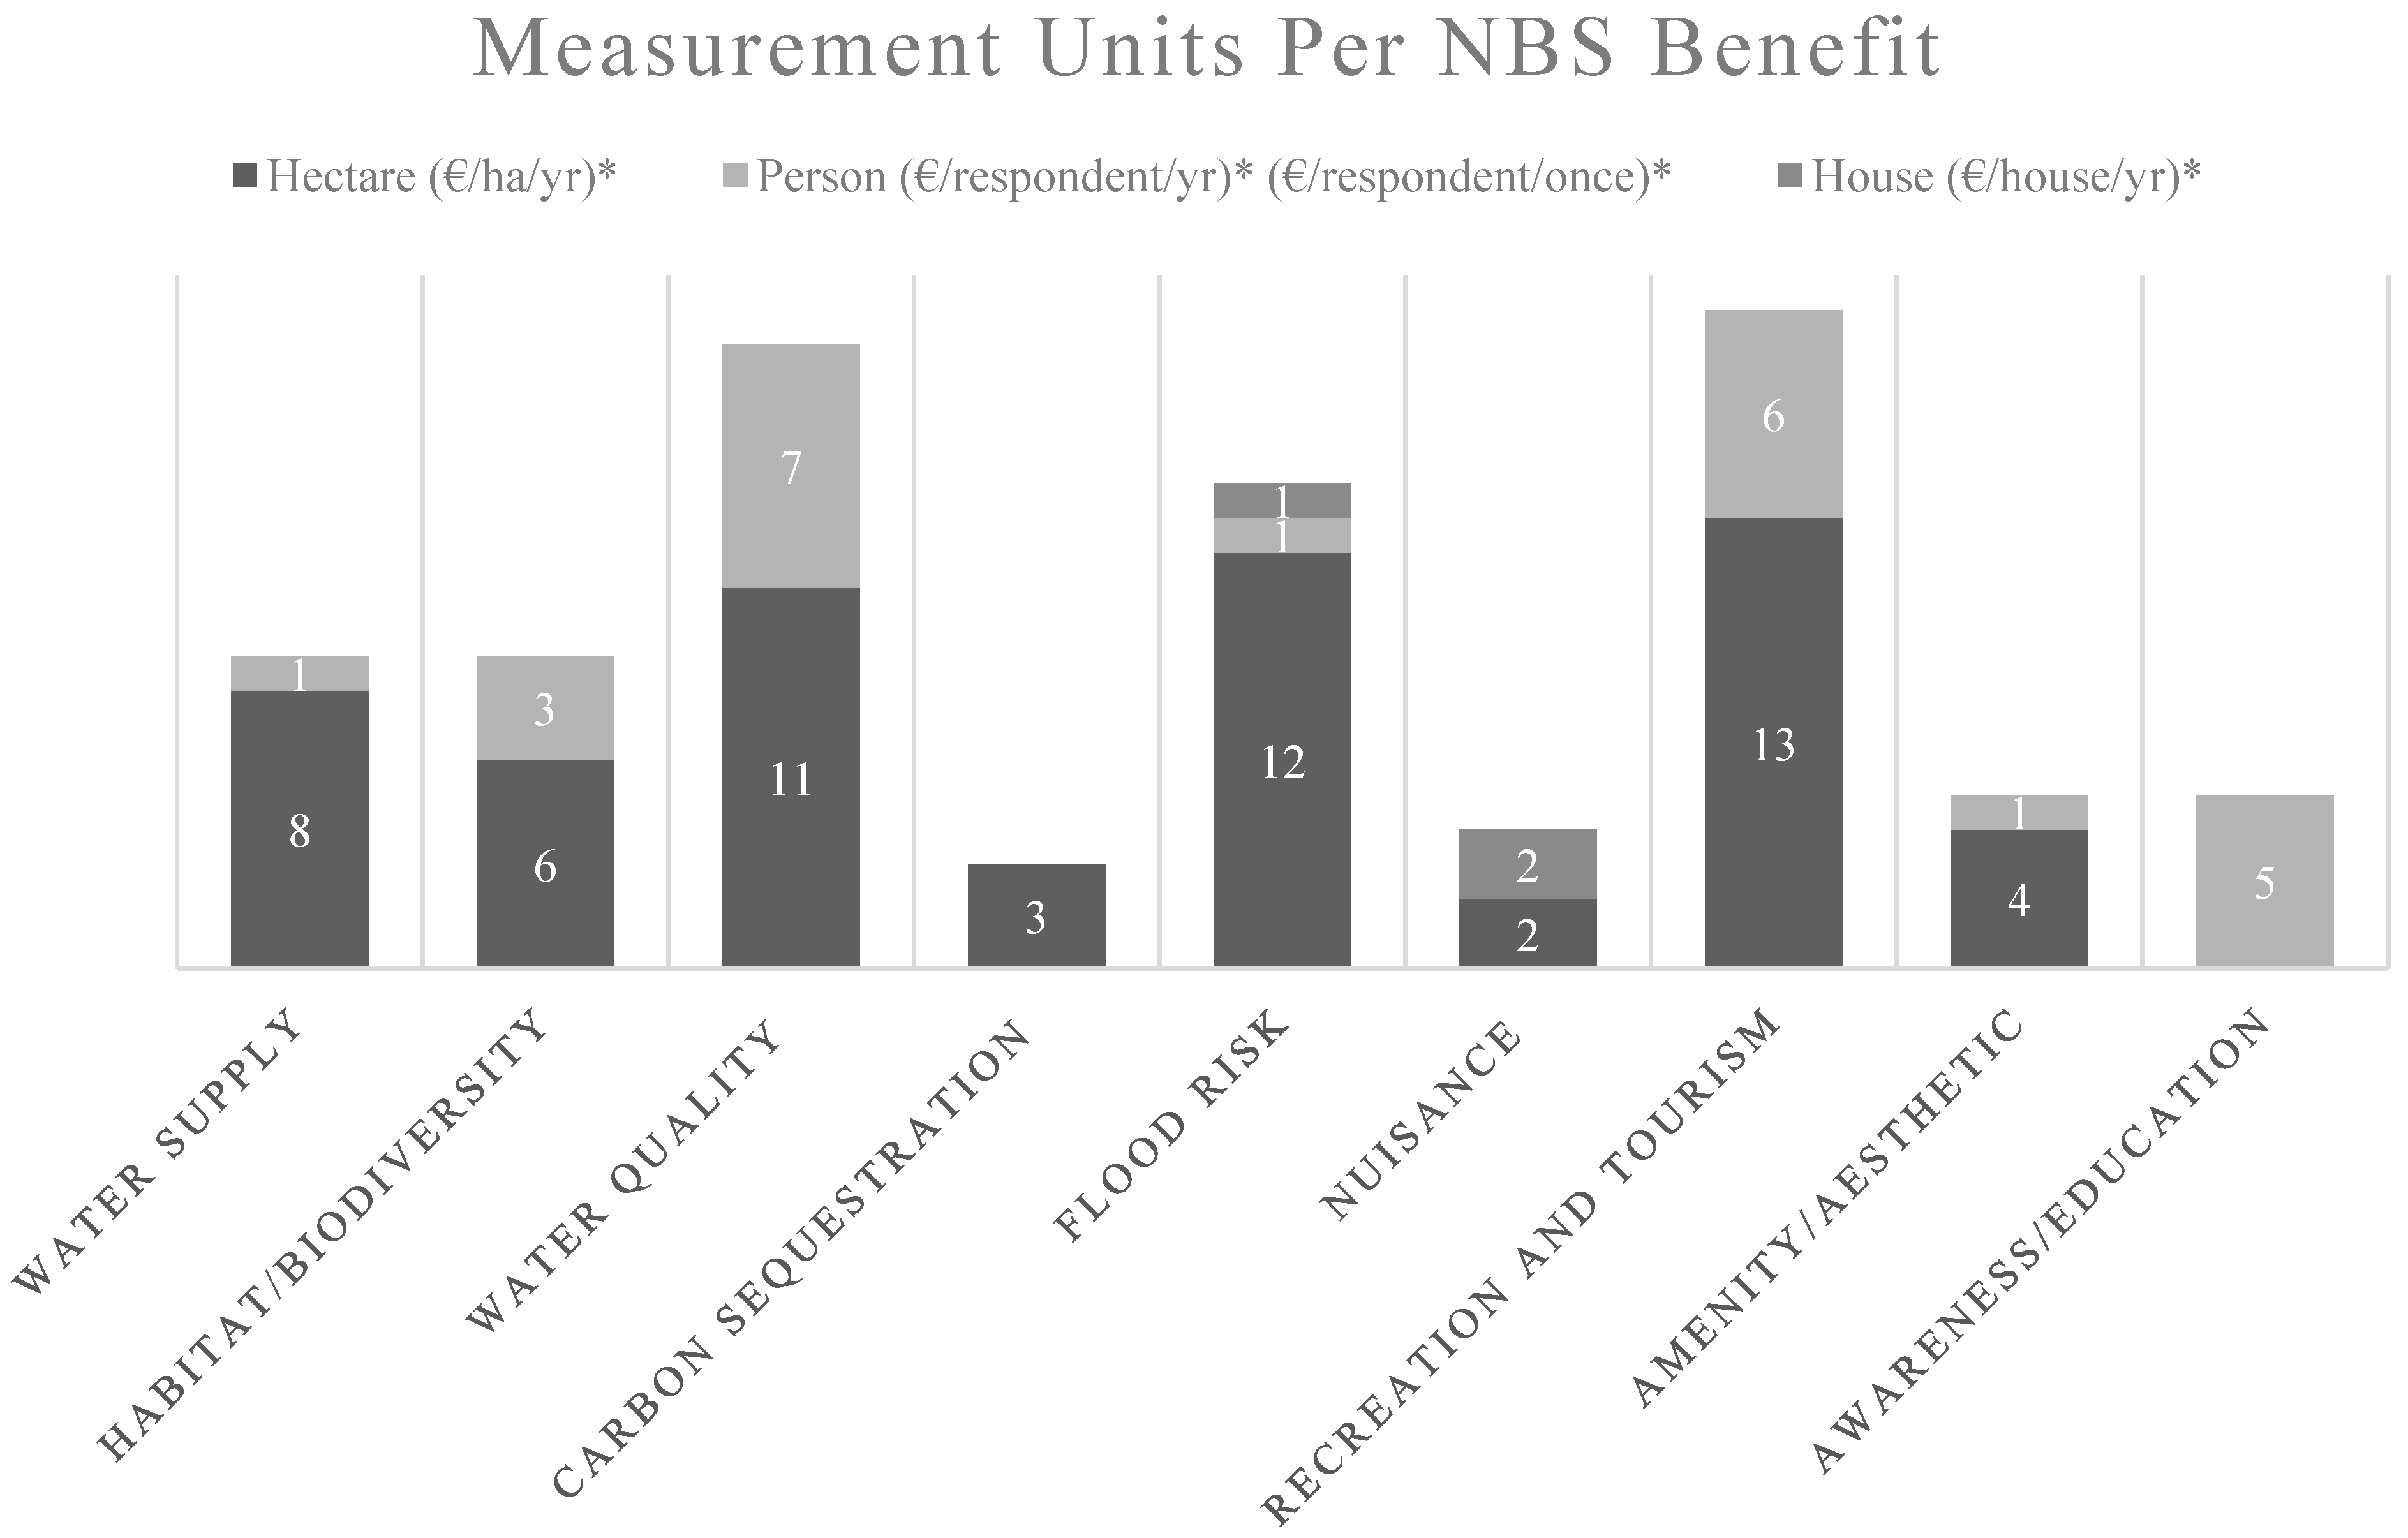
- values expressed in per hectare per year have been preferred; this is because the benefits computed through monetary valuation techniques based on stated preference method (i.e., Contingent Valuation and Choice Experiment) are based on subjective measures and represent more demand for ES (involving preferences) rather than supply [48]. In the case of Awareness/Education, the per beneficiary unit has uniquely been considered the most appropriate. Both the unit per beneficiary and the per hectare per year were gathered for the Recreation and tourism benefit. In the case of Nuisance, the unit EUR/house/year has also been kept.
- study site characteristics such as the type of wetland, surrounding environment, and threats to ecosystem stability have been weighted, reflecting the confidence level of the attribute; to this end, we tried not to select study sites with a low policy-site-fit values.
- the year of calculation of the value also assumed great importance in the choice. Since calculation methods vary over time, and so do people and preferences, recent studies have been preferred over older ones.
3.4. Application of the Adjusted Value Transfer Methodology Steps (4) to (5)—Case Study
4. Discussion
5. Conclusions
Supplementary Materials
Author Contributions
Funding
Data Availability Statement
Acknowledgments
Conflicts of Interest
References
- EC. Towards an EU Research and Innovation Policy Agenda for Nature-Based Solutions & Re-Naturing Cities: Final Report of the Horizon 2020 Expert Group on “Nature-Based Solutions and Re-Naturing Cities”; Publications Office of the European Union: Luxembourg, 2015. [CrossRef]
- Vidon, P.G.; Welsh, M.K.; Hassanzadeh, Y.T. Twenty years of riparian zone research (1997–2017): Where to next? J. Environ. Qual. 2019, 48, 248–260. [Google Scholar] [CrossRef] [PubMed]
- Ioannidou, V.; Stefanakis, A.I. The Use of Constructed Wetlands to Mitigate Pollution from Agricultural Runoff. In Contaminants in Agriculture; Naeem, M., Ansari, A., Gill, S., Eds.; Springer: Cham, Switzerland, 2020; pp. 233–246. [Google Scholar] [CrossRef]
- Mancuso, G.; Bencresciuto, G.F.; Lavrnić, S.; Toscano, A. Diffuse Water Pollution from Agriculture: A Review of Nature-Based Solutions for Nitrogen Removal and Recovery. Water 2021, 13, 1893. [Google Scholar] [CrossRef]
- Rizzo, A.; Sarti, C.; Nardini, A.; Conte, G.; Masi, F.; Pistocchi, A. Nature-based solutions for nutrient pollution control in European agricultural regions: A literature review. Ecol. Eng. 2023, 186, 106772. [Google Scholar] [CrossRef]
- Somarakis, G.; Stagakis, S.; Chrysoulakis, N.; Mesimäki, M.; Lehvävirta, S. Think Nature Nature-Based Solutions Handbook; European Union: Brussels, Belgium, 2019. [Google Scholar] [CrossRef]
- Liquete, C.; Udias, A.; Conte, G.; Grizzetti, B.; Masi, F. Integrated valuation of a nature-based solution for water pollution control. Highlighting hidden benefits. Ecosyst. Serv. 2016, 22, 392–401. [Google Scholar] [CrossRef]
- Maes, J.; Jacobs, S. Nature-based solutions for Europe’s sustainable development. Conserv. Lett. 2017, 10, 121–124. [Google Scholar] [CrossRef]
- Viti, M.; Löwe, R.; JDSørup, H.; Rasmussen, M.; Arnbjerg-Nielsen, K.S.; McKnight, U. Knowledge gaps and future research needs for assessing the non-market benefits of Nature-Based Solutions and Nature-Based Solution-like strategies. Sci. Total Environ. 2022, 841, 156636. [Google Scholar] [CrossRef] [PubMed]
- Laurans, Y.; Rankovic, A.; Billé, R.; Pirard, R.; Mermet, L. Use of ecosystem services economic valuation for decision making: Questioning a literature blindspot. J. Environ. Manag. 2013, 119, 208–219. [Google Scholar] [CrossRef]
- Mok, S.; Mačiulytė, E.; Bult, P.H.; Hawxwell, T. Valuing the Invaluable (?)—A Framework to Facilitate Stakeholder Engagement in the Planning of Nature-Based Solutions. Sustainability 2021, 13, 2657. [Google Scholar] [CrossRef]
- Rizzo, A.; Conte, G.; Masi, F. Adjusted unit value transfer as a tool for raising awareness on ecosystem services provided by constructed wetlands for water pollution control: An italian case study. Int. J. Environ. Res. Public Health 2021, 18, 1531. [Google Scholar] [CrossRef]
- Macháč, J.; Trantinová, M.; Zaňková, L. Externalities in agriculture: How to include their monetary value in decision-making? Int. J. Environ. Sci. Technol. 2021, 18, 3–20. [Google Scholar] [CrossRef]
- Brander, L. Guidance Manual on Value Transfer Methods for Ecosystem Services; UNEP: Nairobi, Kenya, 2013. [Google Scholar] [CrossRef]
- Rolfe, J.; Johnston, R.J.; Rosenberger, R.S.; Brouwer, R. Introduction: Benefit Transfer of Environmental and Resource Values. In Benefit Transfer of Environmental and Resource Values. The Economics of Non-Market Goods and Resources; Johnston, R., Rolfe, J., Rosenberger, R., Brouwer, R., Eds.; Springer: Dordrecht, Germany, 2022. [Google Scholar] [CrossRef]
- Barton, D.N. Value Transfer Method. Metod Factsheet. In Integrated Valuation of Ecosystem Services. Guidelines and Experiences; European Commission FP7. OpenNESS Project Deliverable 3.3-4.4; Barton, D.N., Harrison, P.A., Eds.; European Commission: Brussels, Belgium, 2017. [Google Scholar]
- Boyle, K.; Bergstrom, J. Benefit transfer studies: Myths, pragmatism and idealism. Water Resour. Res. 1992, 28, 657–663. [Google Scholar] [CrossRef]
- Bennett, J. Introduction. In Choice Modelling and the Transfer of Environmental Values; Rolfe, J., Bennett, J., Eds.; Edward Elgar: Cheltenham, UK, 2006; pp. 1–9. Available online: https://hdl.handle.net/10018/24812 (accessed on 20 November 2021).
- Balana, B.B.; Lago, M.; Baggaley, N.; Castellazzi, M.; Sample, J.; Stutter, M.; Slee, B.; Vinten, A. Integrating economic and biophysical data in assessing cost-effectiveness of buffer strip placement. J. Environ. Qual. 2012, 41, 380–388. [Google Scholar] [CrossRef]
- Barling, R.D.; Moore, I.D. Role of buffer strips in management of waterway pollution: A review. Environ. Manag. 1994, 18, 543–558. [Google Scholar] [CrossRef]
- Borin, M.; Passoni, M.; Thiene, M.; Tempesta, T. Multiple functions of buffer strips in farming areas. Eur. J. Agron. 2010, 32, 103–111. [Google Scholar] [CrossRef]
- Brander, L.; Brouwer, R.; Wagtendonk, A. Economic valuation of regulating services provided by wetlands in agricultural landscapes: A meta-analysis. Ecol. Eng. 2013, 56, 89–96. [Google Scholar] [CrossRef]
- Clarkson, B.R.; Ausseil, A.G.E.; Gerbeaux, P. Wetland Ecosystem Services. Ecosystem Services in New Zealand: Conditions and Trends; Manaaki Whenua Press: Lincoln, New Zealand, 2013; pp. 192–202. [Google Scholar] [CrossRef]
- Cole, L.J.; Brocklehurst, S.; Robertson, D.; Harrison, W.; McCracken, D.I. Riparian buffer strips: Their role in the conservation of insect pollinators in intensive grassland systems. Agric. Ecosyst. Environ. 2015, 211, 207–220. [Google Scholar] [CrossRef]
- Endreny, T.A. Forest buffer strips: Mapping the water quality benefits. J. For. 2002, 100, 35–40. [Google Scholar]
- Fischer, R.A.; Fischenich, J.C. Design Recommendations for Riparian Corridors and Vegetated Buffer Strips (No. ERDC-TN-EMRRP-SR-24); Engineer Research and Development Center: Vicksburg, MS, USA, 2002. [Google Scholar]
- Ghermandi, A.; van den Bergh, J.C.; Brander, L.M.; de Groot, H.L.; Nunes, P.A. The Economic Value of Wetland Conservation and Creation: A Meta-Analysis; FEEM Working Paper No. 79; SSRN: Rochester, NY, USA, 2008. [Google Scholar] [CrossRef]
- Ghermandi, A.; Van Den Bergh, J.C.; Brander, L.M.; de Groot, H.L.; Nunes, P.A. Values of natural and human-made wetlands: A meta-analysis. Water Resour. Res. 2010, 46, 1–12. [Google Scholar] [CrossRef]
- Haddaway, N.R.; Brown, C.; Eales, J.; Eggers, S.; Josefsson, J.; Kronvang, B.; Randall, N.; Uusi-Kämppä, J. The multifunctional roles of vegetated strips around and within agricultural fields. Environ. Evid. 2018, 7, 14. [Google Scholar] [CrossRef]
- He, J.; Moffette, F.; Fournier, R.; Revéret, J.P.; Théau, J.; Dupras, J.; Boyer, J.-P.; Varin, M. Meta-analysis for the transfer of economic benefits of ecosystem services provided by wetlands within two watersheds in Quebec, Canada. Wetl. Ecol. Manag. 2015, 23, 707–725. [Google Scholar] [CrossRef]
- Hickey, M.B.C.; Doran, B. A review of the efficiency of buffer strips for the maintenance and enhancement of riparian ecosystems. Water Qual. Res. J. 2004, 39, 311–317. [Google Scholar] [CrossRef]
- Marczak, L.B.; Sakamaki, T.; Turvey, S.L.; Deguise, I.; Wood, S.L.; Richardson, J.S. Are forested buffers an effective conservation strategy for riparian fauna? An assessment using meta-analysis. Ecol. Appl. 2010, 20, 126–134. [Google Scholar] [CrossRef] [PubMed]
- Martín, E.G.; Costa, M.M.; Máñez, K.S. An operationalized classification of Nature Based Solutions for water-related hazards: From theory to practice. Ecol. Econ. 2020, 167, 106460. [Google Scholar] [CrossRef]
- McVittie, A.; Norton, L.; Martin-Ortega, J.; Siameti, I.; Glenk, K.; Aalders, I. Operationalizing an ecosystem services-based approach using Bayesian Belief Networks: An application to riparian buffer strips. Ecol. Econ. 2015, 110, 15–27. [Google Scholar] [CrossRef]
- Meli, P.; Benayas, J.M.R.; Balvanera, P.; Ramos, M.M. Restoration enhances wetland biodiversity and ecosystem service supply, but results are context-dependent: A meta-analysis. PLoS ONE 2014, 9, e93507. [Google Scholar] [CrossRef]
- Mitsch, W.J.; Bernal, B.; Hernandez, M.E. Ecosystem services of wetlands. Int. J. Biodivers. Sci. Ecosyst. Serv. Manag. 2015, 11, 1–4. [Google Scholar] [CrossRef]
- Mitsch, W.J.; Bernal, B.; Nahlik, A.M.; Mander, Ü.; Zhang, L.; Anderson, C.J.; Jørgensen, S.E.; Brix, H. Wetlands, carbon, and climate change. Landsc. Ecol. 2013, 28, 583–597. [Google Scholar] [CrossRef]
- Norris, V.O.L. The use of buffer zones to protect water quality: A review. Water Resour. Manag. 1993, 7, 257–272. [Google Scholar] [CrossRef]
- Stutter, M.I.; Chardon, W.J.; Kronvang, B. Riparian buffer strips as a multifunctional management tool in agricultural landscapes: Introduction. J. Environ. Qual. 2012, 41, 297–303. [Google Scholar] [CrossRef]
- Uggeldahl, K.C.; Olsen, S.B. Public preferences for co-benefits of riparian buffer strips in Denmark: An economic valuation study. J. Environ. Manag. 2019, 239, 342–351. [Google Scholar] [CrossRef]
- Woodward, R.T.; Wui, Y.S. The economic value of wetland services: A meta-analysis. Ecol. Econ. 2001, 37, 257–270. [Google Scholar] [CrossRef]
- Xiong, M.; Sun, R.; Chen, L. Effects of soil conservation techniques on water erosion control: A global analysis. Sci. Total Environ. 2018, 645, 753–760. [Google Scholar] [CrossRef] [PubMed]
- Van der Ploeg, S.; De Groot, R.S.; Wang, Y. The TEEB Valuation Database: Overview of Structure, Data and Results; Foundation for Sustainable Development: Wageningen, The Netherlands, 2010. [Google Scholar]
- De Groot, R.; Brander, L.; Van Der Ploeg, S.; Costanza, R.; Bernard, F.; Braat, L.; Christie, M.; Crossmang, N.; Ghermandi, A.; Hein, L.; et al. Global estimates of the value of ecosystems and their services in monetary units. Ecosyst. Serv. 2012, 1, 50–61. [Google Scholar] [CrossRef]
- OECD. Inflation (CPI) (Indicator). 2022. Available online: https://doi.org/10.1787/eee82e6e-en (accessed on 25 August 2022).
- OECD. Exchange Rates (Indicator). 2022. Available online: https://doi.org/10.1787/037ed317-en (accessed on 25 August 2022).
- WB. World Development Indicators, GDP per Capita, PPP (Current International $). Available online: https://data.worldbank.org/indicator/NY.GDP.PCAP.PP.CD (accessed on 25 August 2022).
- Schmidt, S.; Manceur, A.M.; Seppelt, R. Uncertainty of monetary valued ecosystem services–value transfer functions for global mapping. PLoS ONE 2016, 11, e0148524. [Google Scholar] [CrossRef]
- CIRIA. Benefits of SuDS Tool: Guidance to Assess the Benefits of Blue and Green Infrastructure Using B£ST; CIRIA: London, UK, 2017. [Google Scholar]
- De Groot, R.; Stuip, M.; Finlayson, M.; Davidson, N. Valuing wetlands: Guidance for valuing the benefits derived from wetland ecosystem services (No. H039735). In Ramsar Technical Report No. 3 CBD Technical Series No. 27; International Water Management Institute: Colombo, Sri Lanka, 2006. [Google Scholar]
- Pistocchi. Nature-Based Solutions for Agricultural Water Management; JRC Science for Policy Report; European Union: Brussels, Belgium, 2022; Available online: https://doi.org/10.2760/343927 (accessed on 13 December 2022).
- Gumiero, B.; Boz, B. How to stop nitrogen leaking from a Cross compliant buffer strip? Ecol. Eng. 2017, 103, 446–454. [Google Scholar] [CrossRef]
- Gumiero, B.; Boz, B.; Cornelio, P.; Casella, S. Shallow groundwater nitrogen and denitrification in a newly afforested, subirrigated riparian buffer. J. Appl. Ecol. 2011, 48, 1135–1144. [Google Scholar] [CrossRef]
- Boz, B.; Rahman, M.M.; Bottegal, M.; Basaglia, M.; Squartini, A.; Gumiero, B.; Casella, S. Vegetation, soil and hydrology management influence denitrification activity and the composition of nirK-type denitrifier communities in a newly afforested riparian buffer. New Biotechnol. 2013, 30, 675–684. [Google Scholar] [CrossRef]
- Mastrocicco, M.; Boz, B.; Colombani, N.; Carrer, G.M.; Bonato, M.; Gumiero, B. Modelling groundwater residence time in a sub-irrigated buffer zone. Ecohydrology 2014, 7, 1054–1063. [Google Scholar] [CrossRef]
- MEA. Ecosystems and Human Wellbeing: Synthesis; Island Press: Washington, DC, USA, 2005; p. 137. [Google Scholar]
- TEEB. The Economics of Ecosystems and Biodiversity: Mainstreaming the Economics of Nature: A Synthesis of the Approach, Conclusions and Recommendations of TEEB; TEEB: Potsdam, Germany, 2010. [Google Scholar]
- Potschin, M.; Haines-Young, R. Defining and measuring ecosystem services. In Routledge Handbook of Ecosystem Services; Routledge: London, UK, 2022; pp. 25–44. [Google Scholar]
- Alfranca, O.; García, J.; Varela, H. Economic valuation of a created wetland fed with treated wastewater located in a peri-urban park in Catalonia, Spain. Water Sci. Technol. 2011, 63, 891–898. [Google Scholar] [CrossRef]
- Amacher, G.S.; Brazee, R.J.; Bulkley, J.W.; Moll, R.A. Application of Wetland Valuation Techniques: Examples from Great Lakes Coastal Wetlands (No. PB-90-112319/XAB); Institute of Water Research; Michigan State University: East Lansing, MI, USA, 1989. [Google Scholar]
- Anielski, M.P. Counting Canada’s Natural Capital: Assessing the Real Value of Canada’s Boreal Ecosystems; Canadian Electronic Library; Pembina Institute: Calgary, AL, Canada, 2005; Available online: https://policycommons.net/artifacts/1198845/counting-canadas-natural-capital/1751969/ (accessed on 20 November 2021).
- Birol, E.; Karousakis, K.; Koundouri, P. Using a choice experiment to account for preference heterogeneity in wetland attributes: The case of Cheimaditida wetland in Greece. Ecol. Econ. 2006, 60, 145–156. [Google Scholar] [CrossRef]
- Brenner Guillermo, J. Valuation of Ecosystem Services in the Catalan Coastal Zone. Ph.D. Thesis, UPC, Department Enginyeria Hidràulica, Mirítima i Ambiental, Barcelona, Spain, 2007. Available online: http://hdl.handle.net/2117/93710 (accessed on 20 November 2021).
- Brouwer, R.; Martin-Ortega, J.; Berbel, J. Spatial preference heterogeneity: A choice experiment. Land Econ. 2010, 86, 552–568. [Google Scholar] [CrossRef]
- Brouwer, R.; Sheremet, O. The economic value of river restoration. Water Resour. Econ. 2017, 17, 1–8. [Google Scholar] [CrossRef]
- Cable, T.T.; Knudson, D.M.; Stewart, D.J. The economic benefits to visitors of an interpretive facility. J. Environ. Educ. 1984, 15, 32–37. [Google Scholar] [CrossRef]
- Costanza, R.; Arge, R.; De Groot, R.; Farber, S.; Grasso, M.; Hannon, B.; Limburg, K.; Naee’, S.; Neill, R.V.; Paruelo, J.; et al. The value of world’s ecosystem services and natural capital. Nature 1997, 387, 253–260. [Google Scholar] [CrossRef]
- Creel, M.; Loomis, J. Recreation value of water to wetlands in the San Joaquin Valley: Linked multinomial logit and count data trip frequency models. Water Resour. Res. 1992, 28, 2597–2606. [Google Scholar] [CrossRef]
- Dehnhardt, A. The Replacement Value of Flood Plains as Nutrient Sinks: A Case Study of the River Elbe; Working Paper; Institute of Ecological Economy Research (IOW): Berlin, Germany, 2002. [Google Scholar]
- Ledoux, L. Wetland Valuation: State of the Art and Opportunities for Further Development; CSERGE: Norwich, UK, 2004. [Google Scholar]
- Dias, V.; Belcher, K. Value and provision of ecosystem services from prairie wetlands: A choice experiment approach. Ecosyst. Serv. 2015, 15, 35–44. [Google Scholar] [CrossRef]
- Dubgaard, A.; Kallesøe, M.F.; Petersen, M.L.; Ladenburg, J. Cost-Benefit Analysis of the Skjern River Restoration Project; Department of Economics and Natural Resources, Royal Veterinary and Agricultural University Copenhagen: Copenhagen, Denmark, 2002; p. 42. [Google Scholar]
- Everard, M.; Jevons, S. Ecosystem Services Assessment of Buffer Zone Installation on the Upper Bristol Avon, Wiltshire; Environment Agency: Bristol, UK, 2010. [Google Scholar]
- Eyckmans, J.; De Jaeger, S.; Rousseau, S. Hedonic valuation of odor nuisance using field measurements: A case study of an animal waste processing facility in Flanders. Land Econ. 2013, 89, 53–75. [Google Scholar] [CrossRef]
- Folke, C. The societal value of wetland life-support. In Linking the Natural Environment and the Economy; Folke, C., Kåberger, T., Eds.; Springer Science & Business Media: Berlin/Heidelberg, Germany, 1991; pp. 141–171. [Google Scholar]
- Ghermandi, A.; Fichtman, E. Cultural ecosystem services of multifunctional constructed treatment wetlands and waste stabilization ponds: Time to enter the mainstream? Ecol. Eng. 2015, 84, 615–623. [Google Scholar] [CrossRef]
- Gren, M.; Groth, K.H.; Sylvén, M. Economic values of Danube floodplains. J. Environ. Manag. 1995, 45, 333–345. [Google Scholar] [CrossRef]
- Gren, M.; Söderqvist, T. Economic Valuation of Wetlands: A Survey (No. 54); Beijer International Institute of Ecological Economics, The Royal Swedish Academy of Sciences: Stockholm, Sweden, 1994. [Google Scholar]
- Grygoruk, M.; Mirosław-Świątek, D.; Chrzanowska, W.; Ignar, S. How much for water? Economic assessment and mapping of floodplain water storage as a catchment-scale ecosystem service of wetlands. Water 2013, 5, 1760–1779. [Google Scholar] [CrossRef]
- Hutcheson, W.; Hoagland, P.; Jin, D. Valuing environmental education as a cultural ecosystem service at Hudson River Park. Ecosyst. Serv. 2018, 31, 387–394. [Google Scholar] [CrossRef]
- Ibrahim, Y.A.; Amir-Faryar, B. Strategic Insights on the Role of Farm Ponds as Nonconventional Stormwater Management Facilities. J. Hydrol. Eng. 2018, 23, 04018023. [Google Scholar] [CrossRef]
- Jenkins, W.A.; Murray, B.C.; Kramer, R.A.; Faulkner, S.P. Valuing ecosystem services from wetlands restoration in the Mississippi Alluvial Valley. Ecol. Econ. 2010, 69, 1051–1061. [Google Scholar] [CrossRef]
- Kataria, M.; Bateman, I.; Christensen, T.; Dubgaard, A.; Hasler, B.; Hime, S.; Ladenburg, J.; Levin, G.; Martinsen, L.; Nissen, C. Scenario realism and welfare estimates in choice experiments–A non-market valuation study on the European water framework directive. J. Environ. Manag. 2012, 94, 25–33. [Google Scholar] [CrossRef]
- Kosz, M. Valuing riverside wetlands: The case of the “Donau-Auen” national park. Ecol. Econ. 1996, 16, 109–127. [Google Scholar] [CrossRef]
- Lant, C.L.; Roberts, R.S. Greenbelts in the cornbelt: Riparian wetlands, instrinsic values and market failure. Environ. Plan. A 1990, 22, 1375–1388. [Google Scholar] [CrossRef]
- Leschine, T.M.; Wellman, K.F.; Green, T.H. The Economic Value of Wetlands: Wetlands’ Role in Flood Protection in Western Washington; Washington State Department of Ecology, Ecology Publication: Lacey, WA, USA, 1997; pp. 97–100. [Google Scholar]
- Meyerhoff, J.; Dehnhardt, A. The European Water Framework Directive and Economic Valuation of Wetlands: The Restoration of Floodplains Along the River Elbe. Eur. Environ. 2007, 17, 18–36. [Google Scholar] [CrossRef]
- Oglethorpe, D.R.; Miliadou, D. Economic valuation of the non-use attributes of a wetland: A case-study for Lake Kerkini. J. Environ. Plan. Manag. 2000, 43, 755–767. [Google Scholar] [CrossRef]
- Rep. E3475/01/001; Posford Duvivier Environment, River Ancholme Flood Storage Area Progression. Environment Agency: Peterborough, UK, 1999.
- Ragkos, A.; Psychoudakis, A.; Christofi, A.; Theodoridis, A. Using a functional approach to wetland valuation: The case of Zazari–Cheimaditida. Reg. Environ. Change 2006, 6, 193–200. [Google Scholar] [CrossRef]
- Rein, F.A. An economic analysis of vegetative buffer strip implementation. Case study: Elkhorn Slough, Monterey Bay, California. Coastal Manag. 1999, 27, 377–390. [Google Scholar] [CrossRef]
- Scherrer, S. Evaluation Économique des Aménités Récréatives D’une Zone Humide Intérieure: Le Cas du Lac du Der; IFOP Rep. 03-E05; Ministère de l’Écologie et du Développement Durable: Paris, France, 2003. [Google Scholar]
- Thibodeau, F.R.; Ostro, B.D. An economic analysis of wetland protection. J. Environ. Manag. 1981, 12, 19–30. [Google Scholar]
- Watson, K.B.; Ricketts, T.; Galford, G.; Polasky, S.; O’Niel-Dunne, J. Quantifying flood mitigation services: The economic value of Otter Creek wetlands and floodplains to Middlebury, VT. Ecol. Econ. 2016, 130, 16–24. [Google Scholar] [CrossRef]
- De Groot, R.S.; Wilson, M.A.; Boumans, R.M. A typology for the classification, description and valuation of ecosystem functions, goods and services. Ecol. Econ. 2002, 41, 393–408. [Google Scholar] [CrossRef]
- Plummer, M.L. Assessing benefit transfer for the valuation of ecosystem services. Front. Ecol. Environ. 2009, 7, 38–45. [Google Scholar] [CrossRef]
- Plan Bleu. Methods and Socioeconomic Assessment Tools for Goods and Services Provided by Mediterranean Forest Ecosystems; Technical Report prepared by the CTFC and EFIMED, French GEF Project, Component 2: Assessment of the socio-economic value of goods and services provided by Mediterranean forest ecosystems, Economic valuation methods; Plan Bleu: Marseille, France, 2022. [Google Scholar]
- Brouwer, R. Environmental value transfer: State of the art and future prospects. Ecol. Econ. 2000, 32, 137–152. [Google Scholar] [CrossRef]
- Barton, D.N.; Kelemen, E.; Dick, J.; Martin-Lopez, B.; Gómez-Baggethun, E.; Jacobs, S.; Hendriks, C.M.A.; Termansen, M.; García-Llorente, M.; Primmer, E.; et al. (Dis) integrated valuation—Assessing the information gaps in ecosystem service appraisals for governance support. Ecosyst. Serv. 2018, 29, 529–541. [Google Scholar] [CrossRef]
- Fisher, B.; Turner, K.; Zylstra, M.; Brouwer, R.; De Groot, R.; Farber, S.; Paul Ferraro, P.; Rhys Green, R.; Hadley, D.; Harlow, J.; et al. Ecosystem services and economic theory: Integration for policy-relevant research. Ecol. Appl. 2008, 18, 2050–2067. [Google Scholar] [CrossRef] [PubMed]


| Step | Year | Currency | Country | NBS | Description |
|---|---|---|---|---|---|
| (0) | year of the latest update of the value | currency used in the latest update of the value | study site | study site | Original value from the study site. |
| (1) | 2021 | currency used in the latest update of the value | study site | study site | To account for inflation, values have been adjusted to the general price level of the same year. To compare ecosystem service values computed in different years, they have been harmonized using the annual Consumer Price Index [45] *, with 2015 as the base year, transforming the values in the latest available “original” currency, which corresponds to the year 2021. |
| (2) | 2021 | USD | study site | study site | To control for differences in price levels, values have been transformed into USD 2021, using 2021 exchange rates [46] **, in order to proceed with step number (4) (which involves using a monetary measure expressed in USD). |
| (3) | 2021 | USD | study site | study site | To transfer the value to the NBS of interest, a correction factor was used, capable of taking into account the uncertainties due to the different evaluation contexts, evaluation methods, and indicators used to estimate the value of the ecosystem service. (This is applied after expert selection of the most appropriate study sites.) |
| The final steps in the methodology are left to the single study; when selecting an NBS benefit value, decision-makers should consider that the site-specific application of the methodology requires further adjustments in order to account for some effects. | |||||
| (4) | 2021 | USD | study site | policy site | To control for the effect of income on the demand and value of ecosystem services, estimates have been adjusted for differences in Gross Domestic Product per capita based on Purchasing Power Parity (PPP) [47] *** between study and policy site. |
| (5) | 2021 | EUR (or selected currency) | policy site | policy site | The values have finally been transformed into EUR 2021, using exchange rates [46] **. In the same way the practitioner may select a different currency, relevant to the policy site of interest. |
| To explicate the variability of the estimates, the values can be proposed as ranges: the maximum value corresponding to the adjusted economic value without applying the Correction Factor (the highest value may be chosen in case more than one suitable study site was selected); the minimum value corresponding to the economic value with the application of the Correction Factor (in case more than one study site was selected, the lowest value may be chosen). | |||||
| Confidence Level Attributes | Type | Evaluation Method | |
|---|---|---|---|
| (i) | Evaluation of the suitability of the NBS characteristics of the study site with the NBS of the policy site (object of the application of the methodology). | Categorical Score: 1–5 | Expert-based evaluation 1 = very low 2 = low 3 = sufficient 4 = high 5 = very high |
| (ii) | Monetary valuation technique used for the economic value calculation. | Binary Score: 0–1 | 0 = Value Transfer 1 = Cost-based/direct market pricing if per hectare terms; Contingent Valuation/Choice experiment if per beneficiary terms |
| (iii) | Indicators used to quantify the extent of benefits—ecological, biophysical, or other appropriate indicators such as ES in the case of VT. | Binary Score: 0–1 | Expert-based evaluation 0 = low reliability 1 = high reliability |
| Benefit | Reference | (i) Policy-Site-Fit | (ii) Monetary Valuation Technique | (iii) Biophysical Indicator | Confidence Level | Correction Factor | ||
|---|---|---|---|---|---|---|---|---|
| Water Supply (Wet) | [63] | 5 | Value transfer | 0 | ES. Water supply: Filtering, retention AND storage of fresh water (e.g., aquifers) → Provision of water for consumptive use (e.g., drinking, irrigation, industrial) | 1 | 6 | 90% |
| [79] | 3 | Cost-based | 1 | Total calculated floodplain water storage was multiplied by the unit cost of water storage (EUR/m3/year) assessed on the basis of economic evaluation of artificial reservoirs. | 1 | 5 | 80% | |
| Natural Habitat And Biodiversity Support (Wet) | [63] | 5 | Value transfer | 0 | ES. Suitable living space for wild species → Maintenance of biological AND genetic diversity; thus the basis of most other functions (e.g., community structure of sea grass meadows) AND Suitable reproduction/grow habitat → Maintenance of wild/commercially harvested species (e.g., sea grass meadows, coraligen AND littoral rock for fish juveniles) | 1 | 6 | 90% |
| Water Quality (Wet) | [87] | 5 | Cost-based | 1 | Quantification of nitrogen retention within the flooded area resulting from the decreased running velocity. Two substitutes for the service ‘improvement of water quality’ are considered: (a) the marginal costs of waste water treatment in sewage treatment plants: mean 7.7 EUR/kg N (ranges from 5–8 EUR/kg N) (b) the marginal costs of avoidance of nitrogen loads by agricultural measures: mean 2.5 EUR/kg N (with a wide range depending on measures and production systems considered). | 1 | 7 | 100% |
| [63] | 5 | Value transfer | 0 | ES. Role of vegetation AND biota in removal of xenic compounds → Pollution control, detoxification, decomposition, filtering of particles by bacteria and other organisms; removal of nutrients such as nitrogen and phosphorous; beneficial trophic dynamics; abatement of noise pollution | 0 | 5 | 80% | |
| Carbon Sequestration (Wet) | [82] | 2 | Direct market pricing | 1 | The social welfare value of GHG mitigation captures the value of the damages avoided by mitigating the risks of climate change. This is typically estimated with the use of integrated assessment general equilibrium models to capture the social cost of carbon, or SCC. The stream of total GHG flux per hectare is multiplied by the market and social value prices and then discounted back to the present with a 4% real discount rate. | 1 | 4 | 70% |
| Flood Risk (Wet) | [72] | 4 | Cost-based | 1 | Reduction in house price from external cost caused by odor from an animal waste processing facility depending on odor perception distance. | 0 | 5 | 90% |
| Nuisance (Odours, Rumors, Obstacles To Common Farming Practices) (Wet) | [74] | 5 | Hedonic Pricing | 1 | Reduction in house price from external cost caused by odor from an animal waste processing facility depending on odor perception distance. | 0 | 6 | 90% |
| Recreation and tourism (Wet) | [72] | 4 | Value transfer | 0 | Recreational value: adjusted value transfer of willingness to pay for access | 0 | 4 | 70% |
| [63] | 5 | Value transfer | 0 | ES. Attractive land/seascape features → Enjoyment of scenery (e.g., scenic roads, housing, coastal/seascape) AND Land/seascapes with recreational uses → Travel to natural ecosystems for eco-tourism, rural-tourism AND nature study/enjoy; coast related cultural AND sports events | 1 | 6 | 90% | |
| [59] | 3 | Travel Cost | 1 | Travel costs calculated as: Opportunity costs, which are based on the fact that a person who devotes time for leisure activities is paying for it, because he/she will not receive any wages during this time. Salaries are usually accepted as a proxy variable that reflects the opportunity costs of taking part in this recreational activity and therefore have been used in this study. (minimum interprofessional wage 18 EUR/day) → 1.5 h (time spent to reach the park + time spent at the park) × opportunity cost | 0 | 4 | 70% | |
| Visual impact/Amenity And Aesthetic (Wet) | [63] | 5 | Value transfer | 0 | ES. Natural features with cultural AND artistic value → Use of nature as motive in books, films, painting, folklore, architecture, marketing AND Natural features with spiritual AND historic value → Use of nature for religious or historic purposes (e.g., heritage value of natural ecosystems AND features, small fisherman) | 0 | 5 | 80% |
| Awareness/Education (Wet) | [62] | 2 | Travel cost | 1 | Environmental education: estimate of total cost visit to a national forest interpretive facility | 1 | 4 | 70% |
| Water Supply (BF) | [63] | 4 | Choice Experiment | 1 | Marginal WTP for an improvement in wetland management attribute: educational, research and cultural information that may be derived from the existence of the wetland, including visits by scientists, students, and school children to learn about ecology and nature | 1 | 6 | 90% |
| Natural Habitat And Biodiversity Support (BF) | [73] | 5 | Value transfer | 0 | ES. Water supply: Filtering, retention AND storage of fresh water (e.g., aquifers) → Provision of water for consumptive use (e.g., drinking, irrigation, industrial) | 1 | 6 | 90% |
| Water Quality (BF) | [91] | 1 | Cost-based | 1 | Net benefit from reduced nitrate concentrations (−50%) in shallow groundwater estimated through average annual drinking water costs for the residents | 0 | 2 | 50% |
| Carbon sequestration (bf) | [73] | 4 | Value transfer | 0 | Climate regulation (local temperature/precipitation, GHG sequestration, etc.): transition from values in the literature for permanent grassland towards those derived for wetted, carbon accreting soils or to wet woodland, using a marginal cost of carbon of £27 per tonne | 0 | 4 | 70% |
| Flood risk (bf) | [63] | 5 | Value transfer | 0 | ES. Influence of ecosystem structure on dampening environmental disturbances → Storm protection (e.g., natural beaches, dunes, small bays or calas); flood protection (e.g., wetlands, forest, rieras) | 0 | 5 | 80% |
| Nuisance (odours, rumors, obstacles to common farming practices) (bf) | [74] | 5 | Hedonic Pricing | 1 | Reduction in house price from external cost caused by odor from an animal waste processing facility depending on odor perception distance. | 0 | 6 | 90% |
| Recreation and tourism (bf) | [63] | 5 | Value transfer | 0 | ES. Attractive land/seascape features → Enjoyment of scenery (e.g., scenic roads, housing, coastal/seascape) AND Land/seascapes with recreational uses → Travel to natural ecosystems for eco-tourism, rural-tourism AND nature study/enjoy; coast related cultural AND sports events | 1 | 6 | 90% |
| Visual impact/amenity and aesthetic (bf) | [73] | 4 | Value transfer | 0 | Local amenity and informal enjoyment: attractive river walk alternative of the upper Bristol Avon in its poached state (Assuming that 1 person per week might otherwise drive 10 miles −40 p per mile- for an alternative) | 0 | 4 | 70% |
| Awareness/education (bf) | [80] | 2 | Travel cost | 1 | Environmental education: estimate of tc visit to a national forest interpretive facility | 1 | 4 | 70% |
| Wetlands | Buffer Strips | |||||
|---|---|---|---|---|---|---|
| Value | Units | Value | Units | |||
| Water Supply | 1417 | 7509 | EUR/ha/yr | 8409 | 9343 | EUR/ha/yr |
| Natural Habitat And Biodiversity Support | 494 | 549 | EUR/ha/yr | 16 | 20 | EUR/ha/yr |
| Water Quality | 3261 | 10,157 | EUR/ha/yr | 76 | 151 | EUR/ha/yr |
| Carbon Sequestration | 120 | 223 | EUR/ha/yr | 2261 | 3230 | EUR/ha/yr |
| Flood Risk | 209 | 232 | EUR/ha/yr | 342 | 427 | EUR/ha/yr |
| Nuisance (Odours, Rumors, Obstacles To Common Farming Practices) | 5066 | 49,268 | EUR/house/yr | 5066 | 49,268 | EUR/house/yr |
| Recreation And Tourism | 6154 | 6838 | EUR/ha/yr | 5996 | 6662 | EUR/ha/yr |
| 4 | 6 | EUR/person/visit | - | |||
| Visual Impact/Amenity And Aesthetic | 3462 | 4328 | EUR/ha/yr | 1840 | 2628 | EUR/ha/yr |
| Awareness/education | 19 | 21 | EUR/person/once | 2 | 4 | EUR/student/trip |
| Benefit | Sub-Basins: Marzenego and Dese-Zero | |||
|---|---|---|---|---|
| Wetlands | Buffer Strips | |||
| Min (EUR/Year) | Max (EUR/Year) | Min (EUR/Year) | Max (EUR/Year) | |
| Water Supply | 2,447,604 | 12,967,047 | 6,696,159 | 7,440,176 |
| Natural Habitat and Biodiversity Support | 853,480 | 948,311 | 13,001 | 16,251 |
| Water Quality | 5,631,403 | 17,539,990 | 60,248 | 120,496 |
| Carbon Sequestration | 208,035 | 385,829 | 1,800,662 | 2,572,374 |
| Flood Risk | 360,073 | 400,081 | 272,091 | 340,113 |
| Nuisance (Odours, Rumors, Obstacles to Common Farming Practices) | 8,747,849 | 85,064,599 | 4,033,840 | 39,225,301 |
| Recreation and Tourism | 10,627,201 | 11,808,001 | 4,774,910 | 5,305,455 |
| 88,420 | 197,588 | |||
| Visual Impact/Amenity and Aesthetic | 5,979,457 | 7,474,322 | 1,465,069 | 2,092,956 |
| Awareness/Education | 33,355 | 53,532 | 1892 | 7567 |
Disclaimer/Publisher’s Note: The statements, opinions and data contained in all publications are solely those of the individual author(s) and contributor(s) and not of MDPI and/or the editor(s). MDPI and/or the editor(s) disclaim responsibility for any injury to people or property resulting from any ideas, methods, instructions or products referred to in the content. |
© 2024 by the authors. Licensee MDPI, Basel, Switzerland. This article is an open access article distributed under the terms and conditions of the Creative Commons Attribution (CC BY) license (https://creativecommons.org/licenses/by/4.0/).
Share and Cite
Zanini, S.F.; de Carli, A.; Rizzo, A.; Conte, G.; Masi, F. Monetization of Ecosystem Services from Nature-Based Solutions for Agricultural Diffuse Pollution Control: Simplified Value Transfer Method at European Scale. Water 2024, 16, 898. https://doi.org/10.3390/w16060898
Zanini SF, de Carli A, Rizzo A, Conte G, Masi F. Monetization of Ecosystem Services from Nature-Based Solutions for Agricultural Diffuse Pollution Control: Simplified Value Transfer Method at European Scale. Water. 2024; 16(6):898. https://doi.org/10.3390/w16060898
Chicago/Turabian StyleZanini, Sara Floriana, Alessandro de Carli, Anacleto Rizzo, Giulio Conte, and Fabio Masi. 2024. "Monetization of Ecosystem Services from Nature-Based Solutions for Agricultural Diffuse Pollution Control: Simplified Value Transfer Method at European Scale" Water 16, no. 6: 898. https://doi.org/10.3390/w16060898