Article

Evolution of the Pingluo Section of the Upper Yellow River over the Past 50 Years: Responses to Environmental Change and Human Activity

Key Laboratory of Western China’s Environmental Systems (Ministry of Education), College of Earth and Environmental Sciences, Lanzhou University, Lanzhou 730000, China
*
Author to whom correspondence should be addressed.
Water 2024, 16(6), 911; https://doi.org/10.3390/w16060911
Submission received: 18 February 2024 / Revised: 18 March 2024 / Accepted: 20 March 2024 / Published: 21 March 2024
(This article belongs to the Special Issue Landscape Dynamics and Fluvial Geomorphology)

Abstract

:
The instability of the river channels has increased in response to the combined effects of global warming and human activity. This instability threatens the lives and property of people who live along river courses. This study takes the Pingluo section of the upper Yellow River, which is ~28 km long and ~400 m wide, as its research focus. We studied 11 periods of Landsat remote sensing images from 1973 to 2023 and analyzed the evolutionary characteristics of the Pingluo section over the past 50 years. The channel morphology indices included the channel braiding index (BIT), the bar braiding index (BIB), the average area of the bar (Ab), and the width of the wet channel area (BW). The results showed that there was an overall shrinking trend in this section of the Yellow River; more particularly, fluctuations in indicators such as the river width and the braiding index highlighted an increasing–decreasing–increasing pattern of change. During the 1973–1986 period, the river showed a widening trend, with narrow anabranches cutting through the floodplain and both the river width and the braiding index increasing dramatically over a short period. Over the 1986–2018 period, the area of the wet channel continued to shrink to its lowest level for the past 50 years, the river’s branches were diverted and abandoned, and the channel tended to straighten out. Between 2018 and 2023, the river showed a slightly expanding trend. The evolution of the river channel appears to be related to regional human activity and climate change. For example, after the joint filling of the Longyangxia and Liujiaxia reservoirs in the upper reaches of the Pingluo section of the Yellow River in 1986, runoff and sediment load along this section decreased, flood events became less frequent, and the channel tended to contract. In addition, the increase in extreme precipitation events over the last five years has led to an increase in the magnitude and frequency of peak discharge values in the region, which is the main reason for the increase in the river braiding index and area.

1. Introduction

In recent years, global warming has led to significant changes in the spatiotemporal distribution of water sources [1,2]. Approximately 20% of the world’s rivers have experienced significant changes in geomorphological patterns and increased channel instability [3,4,5]. Globally, some river basins exhibit varying degrees of morphological evolution ranging from 40% to 80%, e.g., in the high mountainous regions of Asia and the Amazonian Plain of South America. Rivers that flow across the Tibetan Plateau and the Pan-Arctic region have widened significantly, whereas rivers in the arid and semi-arid regions of Asia’s interior have tended to narrow [6]. The frequent occurrence of catastrophic floods and the risk of glacial lake outbursts have simultaneously posed a serious threat to the safety of people living and working along river courses [7]. The intensity of human use and regulation of surface water has also increased dramatically [8]; in particular, the construction of dams has often had a major impact on the downstream reaches of rivers [9]. The construction of the Campolattaro Dam in southern Italy, for example, has resulted in a reduction of flow in the lower reaches of the Tammaro River, leading to a significant narrowing of the river channel’s width [10]. The rivers downstream of the Karkheh Dam in southwestern Iran have been affected by the dam, resulting in a 56% decrease in flow and a 21% reduction in river width [11] The closure of the Kingsley Dam in Nebraska, USA, combined with the effects of the droughts suffered in the 1930s and the increased use of water for agricultural and domestic purposes, have led to a rapid narrowing of the channel of the lower Platte River [12]. In addition, the expansion of towns, industrial and agricultural land use, the deforestation of forested land, and other forms of human activity have all intensified surface erosion in the watersheds of the Southern Hemisphere, where the concentration of suspended sand in rivers has increased by 41 ± 7% compared to the 1980s [13]. Understanding the evolution of river channel morphology and the factors influencing it has therefore become an important scientific issue in river management and training [14,15].
Statistical methods of visual observation were first used to study the resulting channel deformation and form a conceptual model to summarize its evolutionary law, such as the semi-quantitative expression of river morphology and median grain size, flow, sediment content, and slope proposed by Lane [16]. With the development of science and technology, the recording of river morphology has gradually shifted from manual measurement to technical detection with remote sensing images as the main means. Earth observation satellite observations of remote and politically sensitive areas greatly compensate for the limitations of manual observations [6]. Currently, the combined use of remote sensing and GIS tools is becoming more common in the assessment of river evolution at different spatial and temporal scales [17], which provides a longer observation period and the possibility of more flexible application for our research.
The Yellow River, known as the ‘cradle of the Chinese nation’, is the second-longest river in China. It has contributed greatly to the country’s economic development and social progress. The average annual sediment flux of the Yellow River is 1.6 billion tons (t) [18], making it the largest river sediment flux in the world. However, severe flooding has also made it ‘China’s Worry’. In the Ning-Meng reach of the upper Yellow River, catastrophic floods have occurred once every two years on average, causing enormous loss of life and property in towns and settlements along the river [19]. Conversely, over recent decades, under the influence of global warming and human activity, discharge of the Ningxia Province section of the Yellow River has fallen [20,21]; however, due to the heterogeneous water and sediment sources in the area [22,23], the river type has become scattered and branched, the amplitude of scouring and siltation has increased, and the evolution of the river channel has been intense, seriously affecting the productivity and livelihood of the people who live along the river course. In order to obtain the evolutionary characteristics of the river channel in this area, this study selected the Pingluo section of the Yellow River in Ningxia Province as its research focus, analyzing the morphological evolution of the Yellow River channel over the past 50 years using Landsat remote sensing imagery as the data source, before discussing the river channel’s evolutionary response to global climate change and human activity.

2. Study Area

The Yellow River originates in the northeastern Tibetan Plateau, crosses the Chinese Loess Plateau and the North China Plain to the east, and finally empties into the Bohai Sea. The river has a total length of 5464 km, an altitudinal drop of 4480 m, and a total basin area of 795,000 km2 (Figure 1a). The study area is located in the Yinchuan Basin in the upper reaches of the Yellow River (Figure 1b), close to the Helan Mountains in the west and the Ordos Plateau in the east; this region is an important Yellow River irrigation area with a dense human population. The region’s mean maximum annual temperature is 32.0 °C, and its mean minimum annual temperature is −14.9 °C. Mean annual precipitation (MAP) is 180 mm, while mean annual potential evaporation is as high as 1755 mm, typical of a temperate but semi-arid climate with a large temperature difference, low precipitation, and high evaporation.
The starting point and endpoint of the Pingluo section are located at 38.82° N, 106.67° E and 39.03° N, 106.86° E, respectively, with a sandy channel length of ~28 km, a specific gradient of ~0.25‰, and no tributary convergence in the section. The mean annual discharge at the outflow of the Pingluo section has been calculated as 276.7 billion m3 (1950–2020) and the mean annual quantity of sediment as 105 million t (1960–2020) (data source: Yellow River Conservancy Commission). The flood season runs from July to October. The Pingluo section experiences an uneven distribution of water and sediment load throughout the year, with mean runoff during the flood season accounting for ~55% of the annual total and mean sediment load accounting for ~76% of the annual total (1952–2003). The Pingluo section has heterogeneous water and sediment sources, and Zhao [24] concluded that more than 90% of the runoff from the upper Yellow River comes from the reaches of the river above Lanzhou, while ~50% of the sediment comes from downstream of Lanzhou.
The channel morphology of the Pingluo section alternates between wide and narrow; the river type is predominantly braided (Figure 1c). More particularly, the upstream section of the river channel at Shijiataizi Village, the section at Beiya–Sankeliu Village, and the downstream section at Yanhe Village exhibit wide channels, typical of a multi-thread river type. The river channel sections at Baiyaizi–Beiya Village and Sankeliu–Yanhe Village are narrower and are either straight or slightly curved in form, representative of a single-channel river type. The bars in the Pingluo section account for ~40% of the total area of the river and are dominated by mostly diamond-shaped and willow-leaf-shaped bars; the angle between the direction of the channel’s long axis and the direction of water flow is <45°. Most of the sediment in the Pingluo section is fine-grained sand, ranging in grain size from 116 to 187 μm, and highly influenced by fluctuations in the river’s water level and changes in flushing and siltation.

3. Methods

3.1. Data Acquisition and Processing

A total of 11 Landsat images from 1973–2023 were acquired from the United States Geological Survey server (USGS, Earth Explorer). To reduce the influence of seasonal water level changes on the water surface, we selected Landsat images captured during the base-flow period (November–March) of the year (see Table 1 and Figure 2a).
The image preprocessing consisted of two stages. First, the image data were radiometrically calibrated and atmospherically corrected using the ENVI 5.3 software (Developed by Exelis Visual Information Solutions, Boulder, CO, USA) (Figure 2b,c) to eliminate errors made by the sensors during the process of acquiring the radiometric values as well as to counter the effects of atmospheric scattering and reflections from the ground. Secondly, we used the ArcGIS 10.8 software developed by Esri to resample the Landsat 1 and Landsat 2 images with an accuracy of 30 m (Figure 2d) so that the raster accuracy of the 11-phase remote sensing images would be unified in the subsequent processing.
The hydrological data in this paper were obtained from the Yellow River Network supervised by the Yellow River Conservancy Commission (https://www.yrcc.gov.cn/, accessed on 2 June 2023). These archives mainly consist of three datasets: the Yellow River Sediment Bulletin, the Yellow River Water Resource Bulletin, and the Yellow River Daily Water Condition Dataset. Meteorological data were obtained from the Statistical Yearbook of the People’s Government of Ningxia Hui Autonomous Region (https://www.nx.gov.cn/, accessed on 14 June 2023) and the Investigation and Assessment Log of Yellow River Water Resources compiled by Zhang et al. [25]. Neither the hydrological nor the meteorological data were preprocessed by other scientists.

3.2. Riverine Shoreline Extraction

The normalized difference water index (NDWI) [26], a new decision tree tool, and visual inspection were used to extract the river shape, thereby effectively improving the accuracy of the river morphology extraction results. The specific steps are outlined below.
First, the green and near-infrared bands of the Landsat remote sensing imagery were calculated after inputting the NDWI in ENVI 5.3 software (Figure 2e), thereby highlighting water feature information through band combinations via the following expression:
N D W I = g r e e n N I R g r e e n + N I R
Second, the gray values of the water and non-water areas of the current image calculated using the NDWI were used as the classification threshold for the band calculation (Band Math), thereby dividing these values into two types of rasters with values of 1 and 0. Then, the water bodies were extracted from the images computed in the above bands using an NDT (Figure 2f).
After dividing the water body and beach using the above formula, the extracted water surface data were successively converted to vector format and shapefile format using a classification to vector tool and a classic EVF to shapefile tool, thereby meeting the ArcGIS file format requirements for further processing.
Third, the water surface vector file was imported into ArcGIS 10.8 and smoothed (using a smooth polygon tool) with a smoothing index of 120 m to smooth the watershed boundary. The river boundary results were then visually checked and corrected (Figure 2g) to artificially extract the fine and narrow watercourses that would not be detected by the above geoprocessing and to correct the incorrectly extracted off-channel watercourses.

3.3. River Morphology Indicators

In order to quantitatively analyze river channel evolution in the Pingluo section of the Yellow River over the last 50 years, two channel morphology parameters, namely, the river area (A) and river width (B), as well as three tributary channel parameters, namely, the channel braid index (BIT), area of wet channel (AW), and width of wet channel (BW), were extracted as the main quantitative indices. The formulas for the calculation of each parameter are shown in Table 2.

4. Results and Discussion

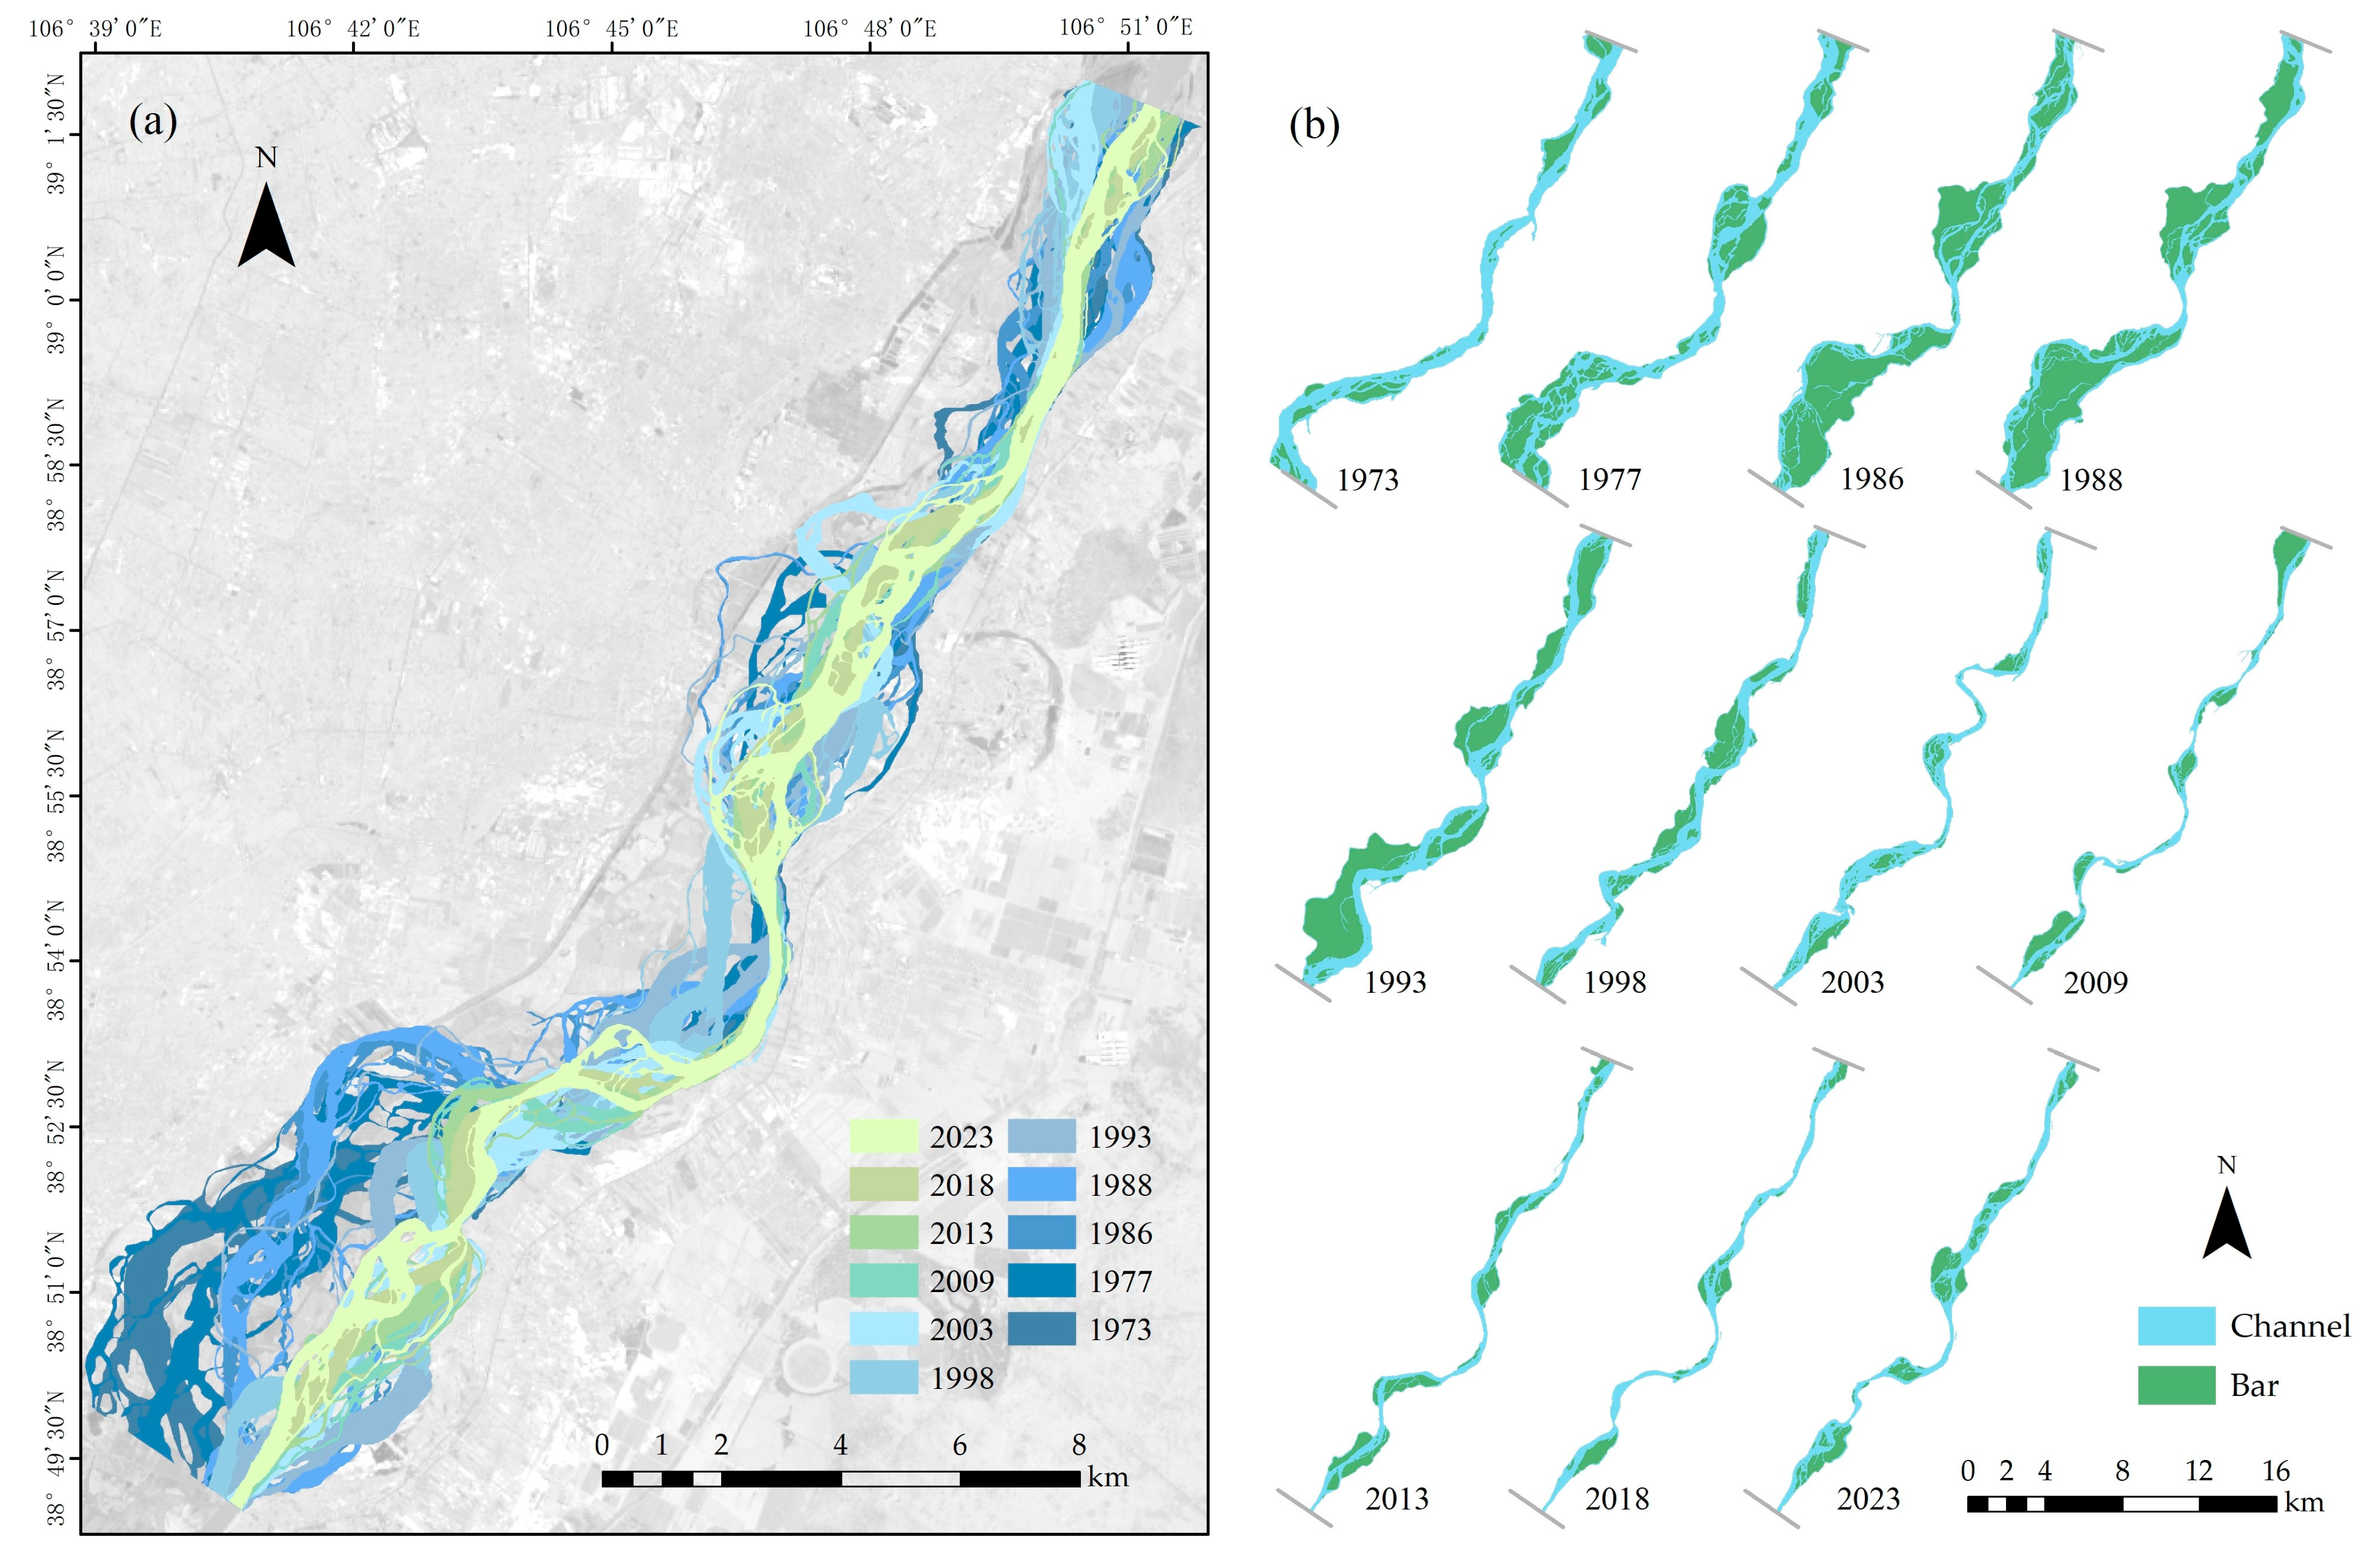
4.1. Characteristics of Channel Evolution

To facilitate the description of river channel morphology and its evolution, the river’s reach analyzed in this study was divided into sub-reaches A-G as follows (upstream to downstream): upstream of Shijiataizi Village, Shijiataizi Village to Baiyizi Village, Baiyizi Village to Beiya Village, Beiya Village to Shuiquan Village, Shuiquan Village to Sankeliu Village, Sankeliu Village to Yanhe Village, and downstream of Yanhe Village (Figure 1c).
Overall, both the area and width of the river contracted from 1973 to 2023 (Figure 3a,b). Additionally, this evolutionary process could be roughly divided into three stages (Figure 4a,b). From 1973 to 1988, the area of the river rapidly expanded from 31.2 km2 to its maximum value in 1988 (54.4 km2). The width also reached its peak (1800 m) during this period. Between 1988 and 2013, the river area and width experienced a gradual decline, reaching their minimum values in 2018 (15.3 km2 and 500 m, respectively), marking the lowest recorded values for the past 50 years. From 2018 to 2023, a slight increase was observed for both of these indicators.
From 1973 to 2023, the braiding index of the river branch showed an overall decreasing trend (Figure 4d), consistent with the river area. There were approximately three stages. Firstly, from 1973 to 1986, the branch braiding index increased significantly from 1.78 to its maximum value for the past 50 years of 3.90. Sub-reaches A, B, and E developed a large number of tributary channels to divide the floodplain, forming a complex multi-thread river type. In 1977, sub-reach A showed typical meandering river characteristics. By 1986, these tributary channels tended to be narrow and far from the thalweg of the river, giving the Pingluo section of the river a greater width but decreased flow area. Secondly, from 1986 to 2018, the river gradually narrowed, the thalweg tended to straighten, and a large number of tributaries were diverted and abandoned. The braiding index for tributaries in the Pingluo section decreased slowly year by year, reaching its minimum value for the past 50 years in 2018 (i.e., 1.70). At this time, the total length of the multi-threaded river section was greatly reduced to about 8.4 km. Except for sub-reaches A, D, and G, the other sub-reaches were mainly single-channel rivers. Finally, from 2018 to 2023, the braiding index of the tributaries increased rapidly. Sub-reaches D and E developed a large number of tributary channels, forming a local meandering type of river. The tributaries during this period principally divided the river’s mid-channel bars.
From 1973 to 2023, although the wet channel width and area showed an overall decrease, there were differences in the hinge time (Figure 4a,b). From 1973 to 1977, the wet channel area and width both rose to their maximum values for the past 50 years. From 1977 to 1986, the tributaries began to divide the river’s point bars rather than its mid-channel bars, and the wet channel area and mean wet channel width decreased. From 1988 to 2009, with the disappearance of a large number of tributary-divided point bars, the river’s flow path width and area reached their lowest levels for the past 50 years, i.e., 271 m and 9.7 km2, respectively. From 2009 to 2023, the wet channel width and area of the Pingluo section both showed an upward trend.

4.2. Characteristics of Tributary Bars

From 1973 to 2023, the total and mean areas of the bars and the bar braiding index of the Pingluo section declined (Figure 4c). This can be divided into three evolutionary stages. Firstly, from 1973 to 1986, a large number of bars developed in the sub-reaches, except for sub-reach C (Baiyizi Village to Beiya Village), and the total and mean areas of these bars rose sharply to 36.4 and 0.4 km2, respectively, reaching their maximum value for the past 50 years. For example, two large bars developed on the eastern shore of sub-reach A (the reaches upstream of Shijiataizi Village), with a total length of 8900 m, resulting in a sharp increase in the bar braiding index to 5.38. Secondly, from 1986 to 2018, the tributary channels on the western shores of sub-reaches A and B (the Shijiataizi Village to Baiyizi Village stretch of the river) and the eastern shore of sub-reaches D–G (downstream of Beiya Village) gradually shrank, resulting in the merger of edge point bars and the riverbank. Here, the bar area decreased rapidly, reaching its minimum value for the past 50 years of 4.2 km2 in 2018; the bar braiding index also reached its minimum value in the same year (1.28). At this time, except for sub-reaches A and D, which retained some small marginal point bars and core bars, the number of bars in other reaches became small. In 2003, affected by an increase in the number of small mid-channel bars, the mean area of bars reached a minimum of 0.06 km2. Finally, from 2018 to 2023, sub-reaches A, D, and E developed bars, and the number of bars increased slightly, as did the area covered by bars.

4.3. Analysis of Factors Influencing River Channel Evolution along the Pingluo Section over the Past 50 Years

The Pingluo section of the Yellow River developed on the 1600 m Quaternary alluvial deposits [29], and the material composition of the riverbed is uniform. Although strike-slip, thrust, and normal faults play a positive role in the geological structure of Ningxia Province [30], there were no significant changes during the study period. Considering the scale of 50 years of research, the morphology of rivers was mainly controlled by climate change and human activities [31].

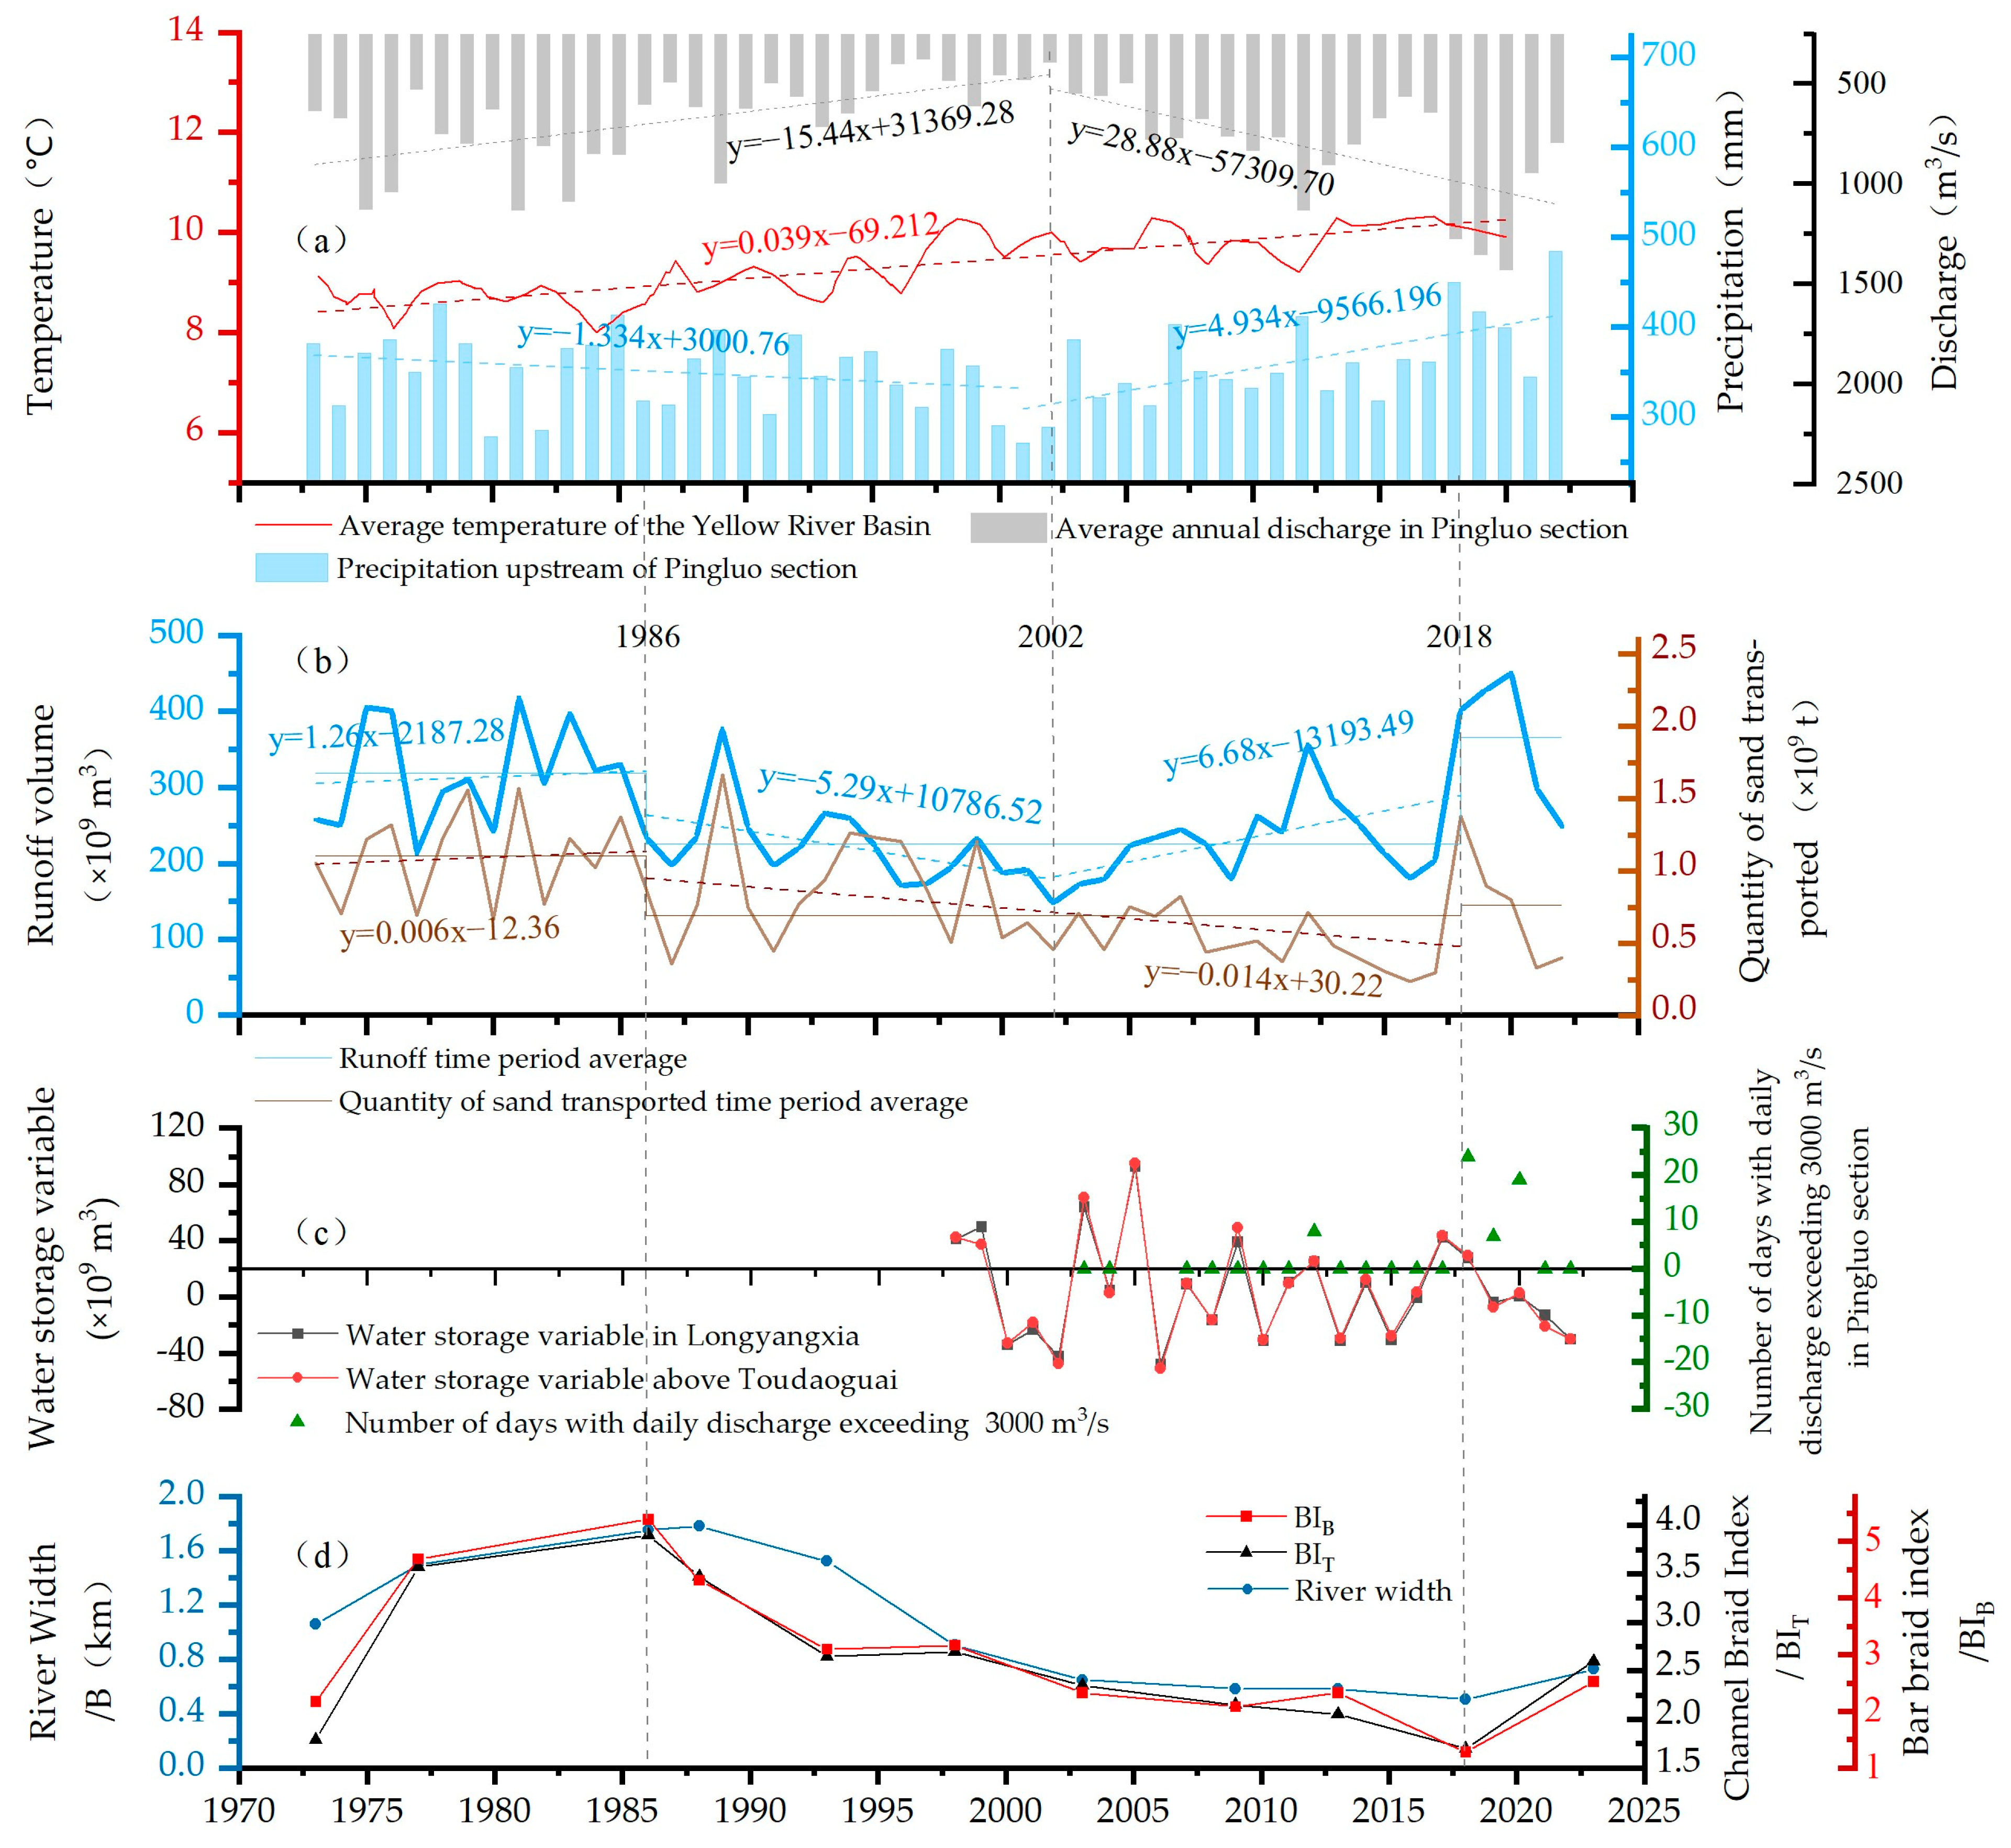
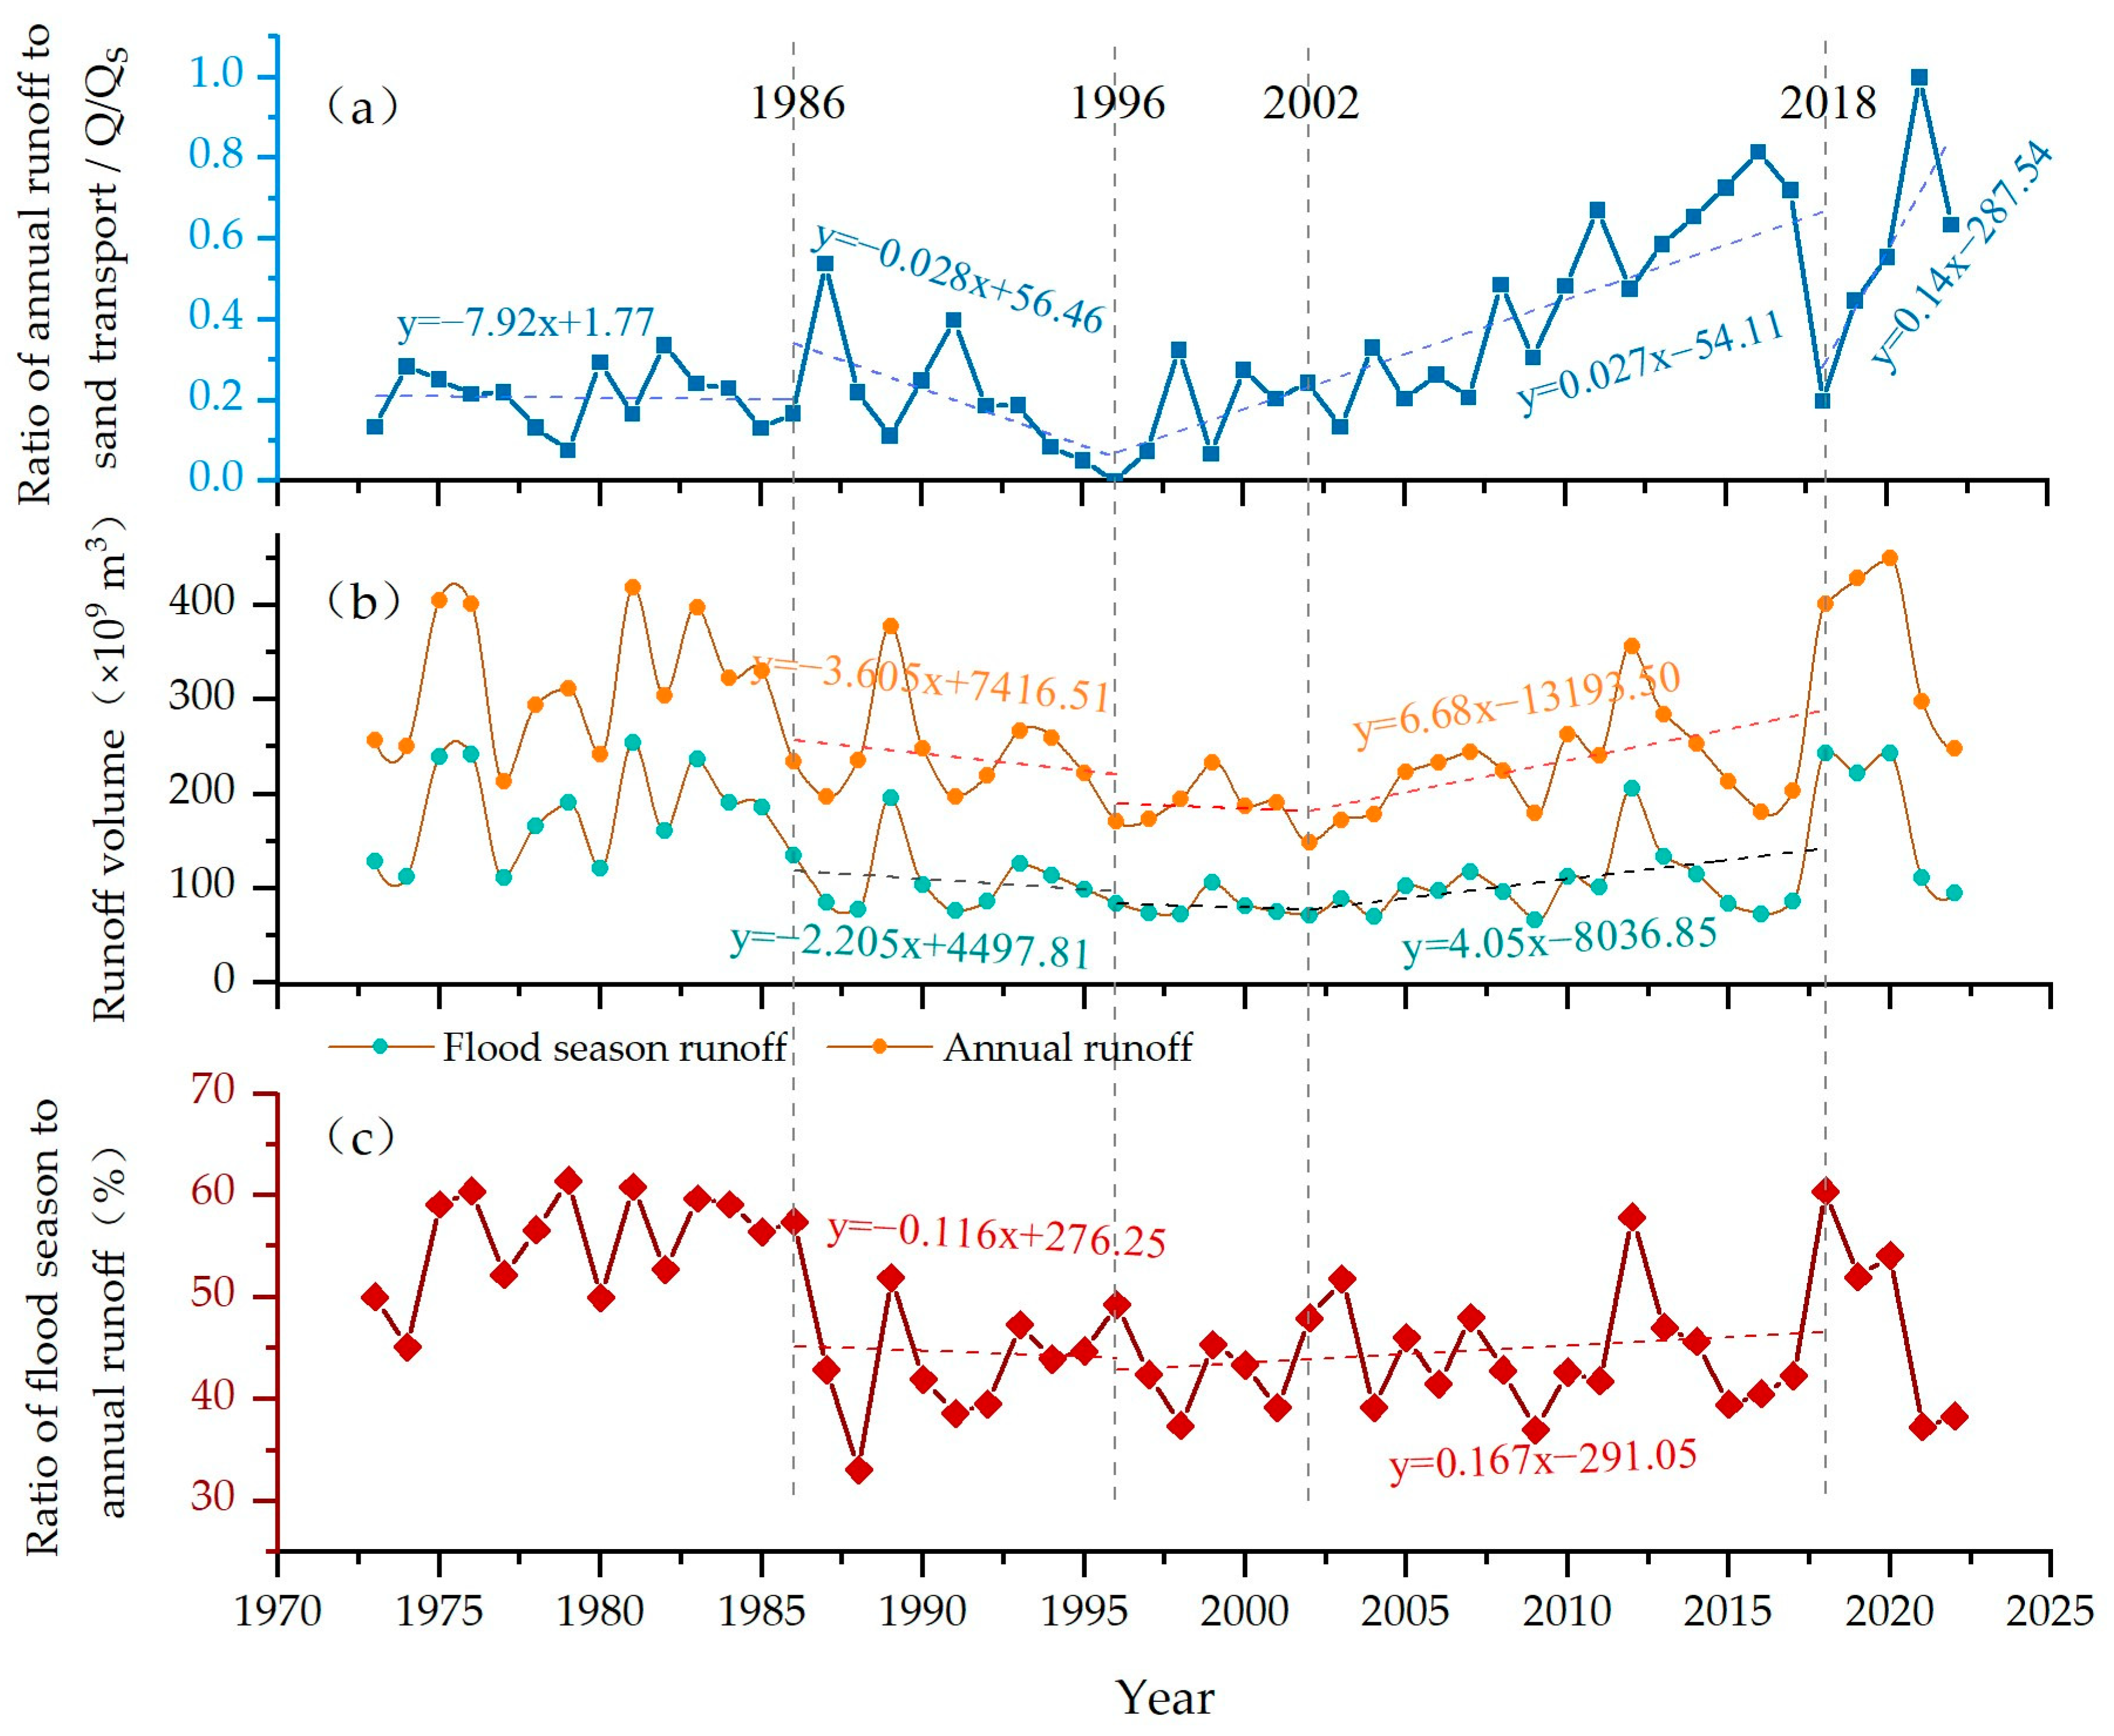
4.3.1. Response of River Channel Evolution to Climate Change

Although global warming will lead to increases in water evaporation and thus change runoff values [32], this process is complex [33,34]. In addition, the water and sediment in the study area have different sources, i.e., ~99% of the runoff comes from cold, alpine areas above Lanzhou [23,35]. The area of confluence for the arid and semi-arid regions downstream of Lanzhou is small, but the sediment content is huge. According to this study’s calculations, the Sperman correlation coefficient between temperature and flow in the Pingluo section for 1973–2020 was just −0.172. It was found from a comprehensive analysis of temperature and river hydrology (Figure 5a) that the impact of temperature change on changes in runoff along the Pingluo section was limited. Basin precipitation was the main source of runoff, and changes in this directly led to changes in the basin’s output flow [1].
On an interannual scale, there is a highly consistent correlation between the flow along the Pingluo section and the high and low upstream precipitation values (Figure 5a); flood events and concentrated precipitation events are especially chronologically well matched. Heavy precipitation can increase river runoff, and rising water levels can drown secondary tributaries, bars, point bars, and other geomorphic units, quickly washing away bars or even the riverbed and thus reshaping the river and altering its location. In 2012, 2018, 2019, and 2020, four large floods with a flow of >3000 m3/s occurred along the Pingluo section (Figure 5d). Taking 2018 as an example, 711 mm of precipitation fell in the upper reaches of the Yellow River, 30% greater than the MAP for 1981–2010, and this caused large floods that had a huge impact on the lower reaches. During this flood, the daily flow was as high as 3470 m3/s (6 October 2018). At this time, the total bar area was 8.97 km2, 37% less than the mean value for the past 50 years, and the wet channel area was 88.43 km2, about 4.5 times higher than the mean value for the past 50 years (Figure 6b). By comparing the river’s morphology before and after the flood, it was found that on December 6 (when there was a daily flow of 929 m3/s), the river in the Shijiataizi Village sub-reach had migrated westward about 350 m compared with June 13 (when there was a daily flow of 918 m3/s), and the bends in the river had widened slightly (Figure 6a).
On an interdecadal scale, river runoff along the Pingluo section and precipitation values upstream exhibited similar variabilities (Figure 5a,b). For example, from 1973 to 1986, precipitation values were high, with a significant interannual variation. Runoff and sediment load showed similar characteristics and increased slightly, and the braided river index increased year by year. In 2002, precipitation and mean runoff were low, and the river contracted. Thereafter, precipitation in the upper reaches of the Yinchuan basin and runoff along the Pingluo section first declined, then increased. An increase in annual precipitation in the upper reaches of the Yinchuan basin over the past five years has led to a significant increase in flow along the Pingluo section (Figure 5a), resulting in a widening of the river and higher channel braiding and bar braiding indices (Figure 5d).

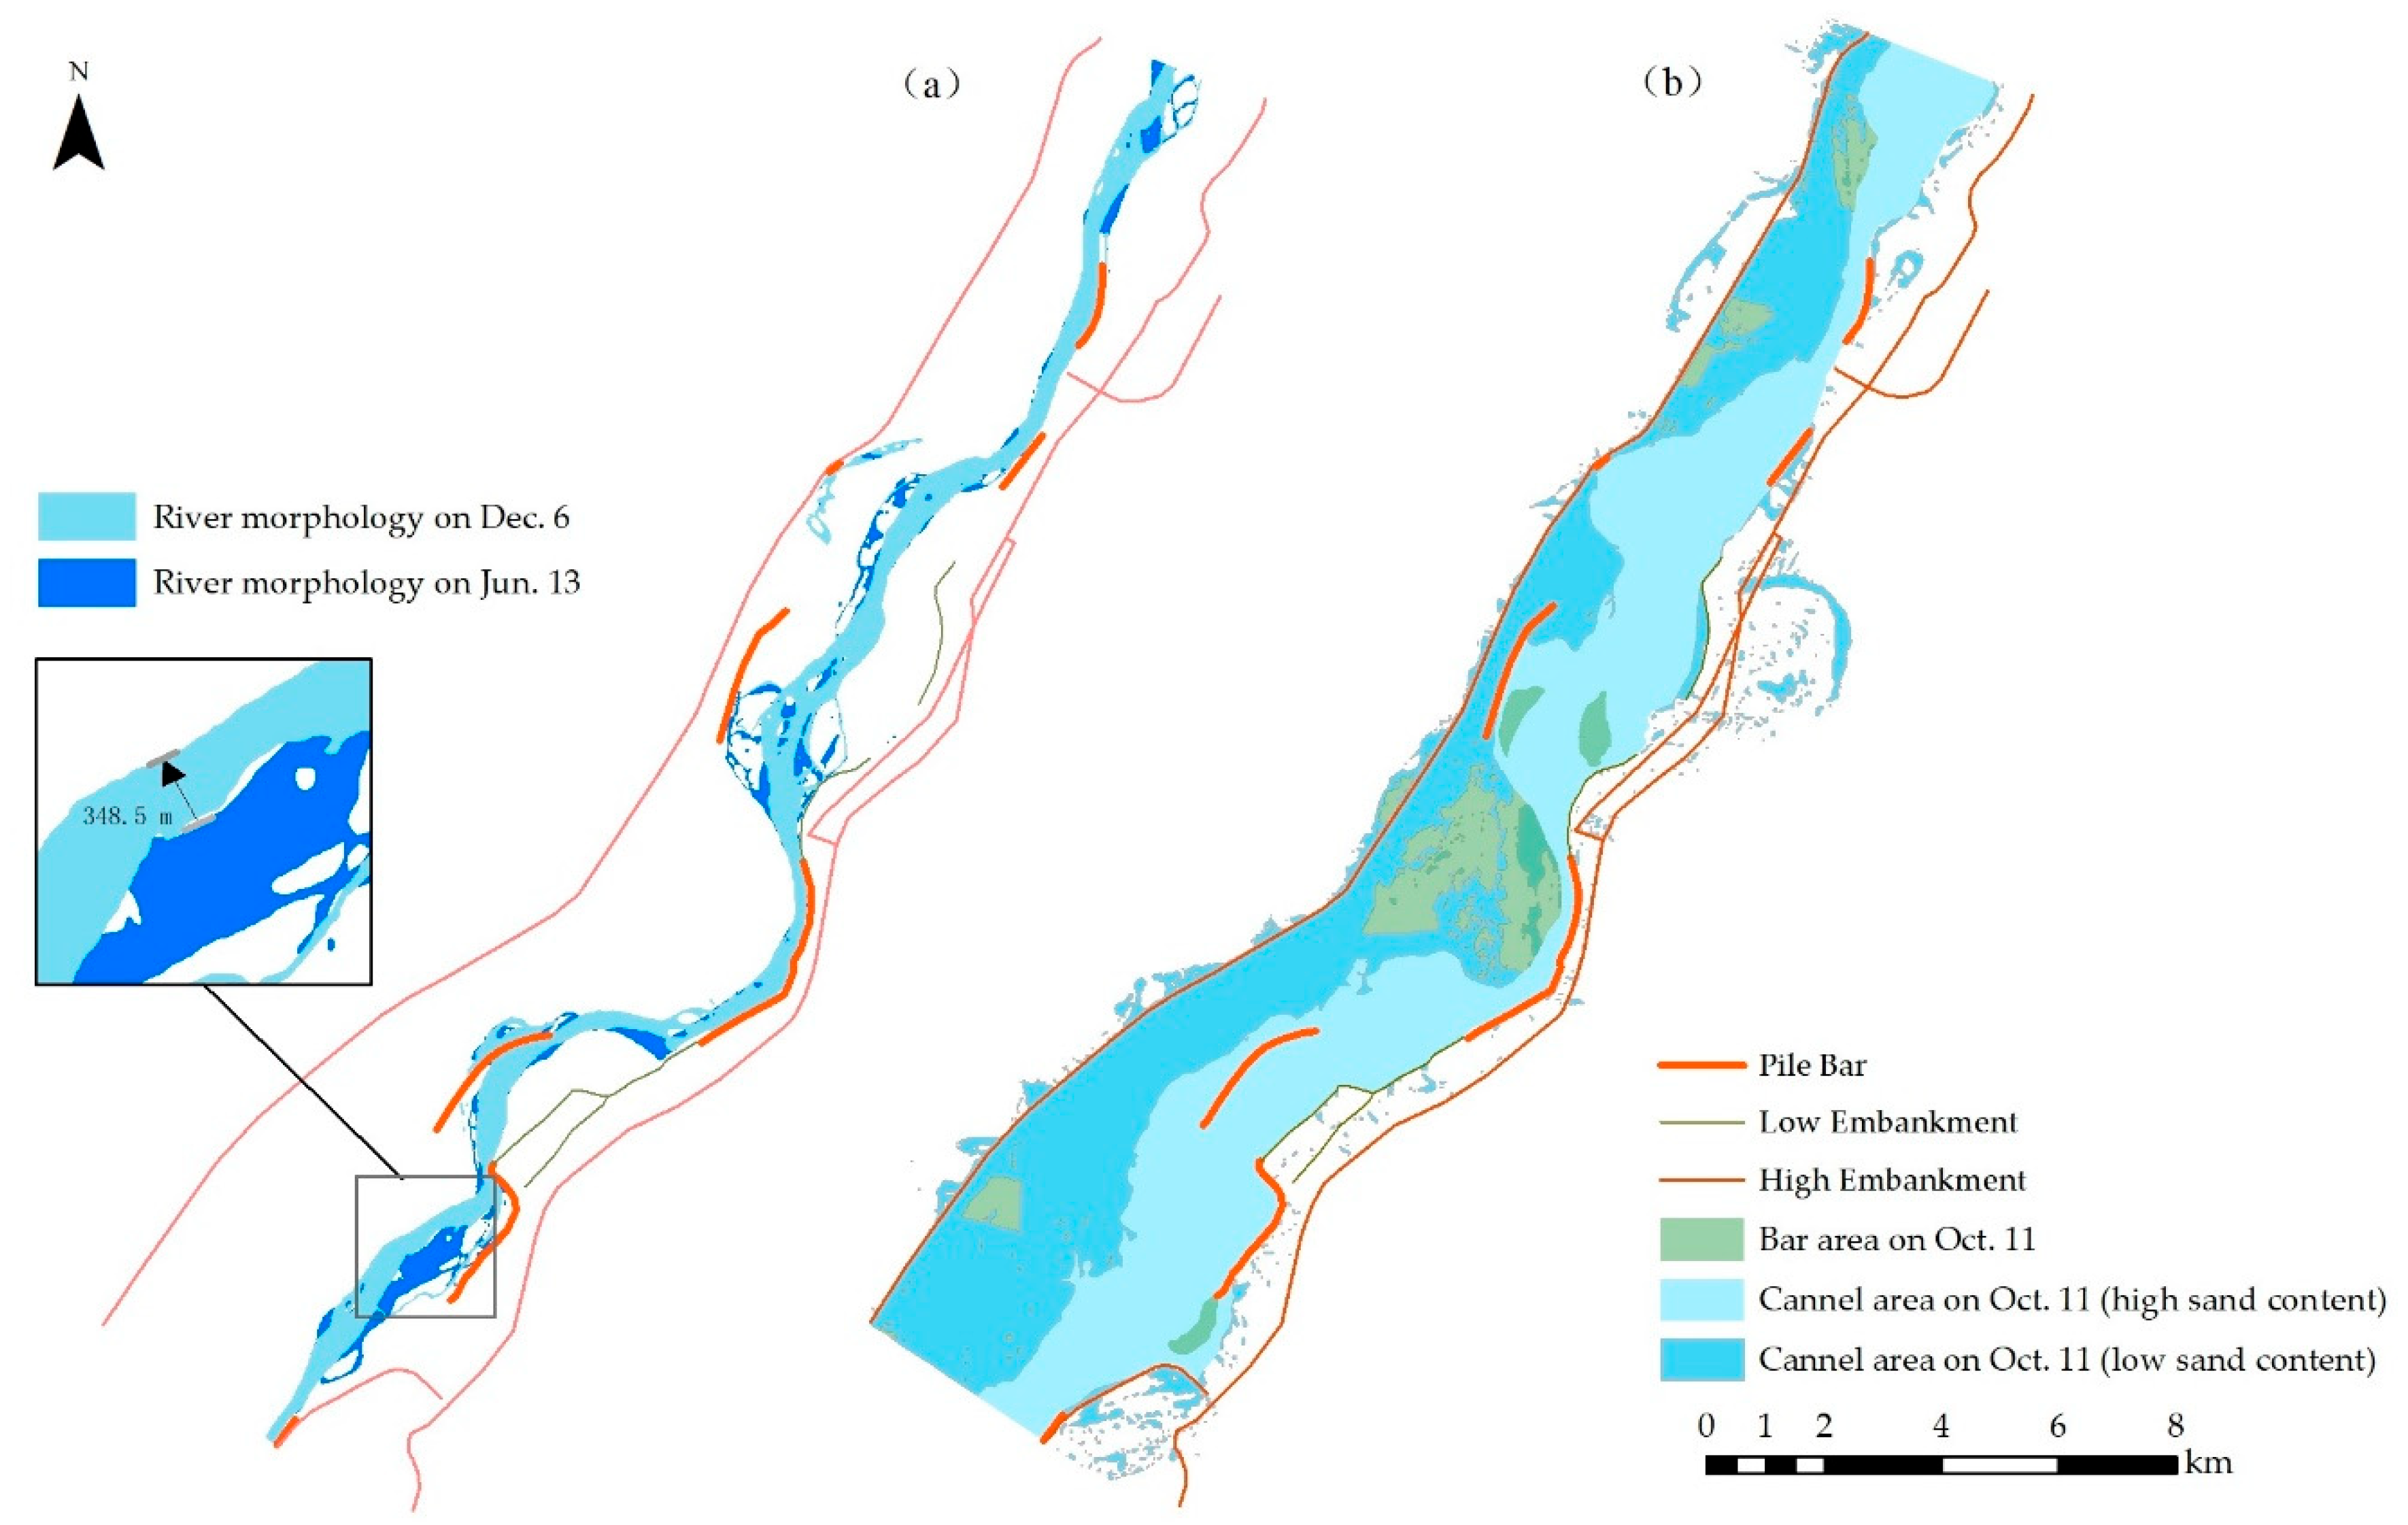
4.3.2. Impact of Human Activity on River Channel Evolution

(1)
Impact of water conservancy facilities
At present, the main water conservancy facilities in the upper reaches of the Pingluo section are the Qingtongxia Reservoir, the Liujiaxia Reservoir, and the Longyangxia Reservoir, which were built and first operated in 1967, 1968, and 1986, respectively [22]. Of these, the Longyangxia Reservoir accounts for ~90% of the storage capacity of all the reservoirs in the upper reaches of the Lanzhou section of the Yellow River (Figure 5c) [36,37].
After the Longyangxia Dam was completed and operated in tandem with the Liujiaxia Reservoir in 1986, sizeable quantities of downstream water and river sediment were retained in the upper reaches of the Yellow River (Figure 5b). From 1986 to 2017, the annual runoff and sediment load along the Pingluo section of the study area decreased from 3.19 × 10¹¹ m3 and 1.1 × 10⁹ t before construction of the Longyangxia Dam to 2.252 × 10¹¹ m3 and 0.7 × 10⁹ t, a year-on-year decrease of 29.4% and 37.4%, respectively, resulting in the contraction and narrowing of the river channel along the Pingluo section of the Yellow River. As a consequence, both the channel and the bar braiding indices, as well as the total area covered by the river, gradually decreased.
Due to increased precipitation in the upper reaches of the Yellow River from 2018 to 2023, the upstream reservoirs all increased their flood storage levels to cope with the higher precipitation and runoff levels. The Longyangxia Reservoir’s floodwater level, for instance, was adjusted to 2594 m for the first time in 2021. As a consequence, the number of days with a daily flow exceeding 3000 m3/s along the Pingluo section increased significantly, as did flood frequency (Figure 5c); flow reached higher levels and lasted longer [38]. Simultaneously, the sediment load decreased, and the river channel was more strongly eroded during the flood season, widening rapidly. The channel’s braiding index and curvature of the tributaries both increased.
(2)
Influence of dike protection facilities
The government has built a large number of flood prevention levees along the studied section [39]. For example, along the river course, a high embankment (~4 m higher than the river’s usual level) was built outside the floodplain (Figure 7a), and a low embankment (~2 m higher than the river’s normal level) was constructed on the floodplain (Figure 7b) to prevent the flooding of fields caused by fluctuations in the river’s water levels. Simultaneously, stone spur dikes (~2.5 m higher than the river’s usual level) were built along narrow stretches of the river (Figure 7c) to reduce lateral erosion of the riverbank.
Over the past 50 years, the river has migrated eastward a little near Shijiataizi Village, Baiyizi Village, and Sankeliu Village, but its position has remained relatively fixed, largely constrained by the abovementioned dikes. These dikes have also prevented water overflow during the flood season and any freak events, meaning that river flushing and siltation have mainly occurred around the dikes, thereby limiting lateral erosion and widening of the river channel.
The response of river channel morphology to human activity over the past 50 years was also analyzed. Except for the catastrophic flood of 1988, the mean annual runoff and sediment load along the Pingluo section decreased significantly from 1986 to 1996 (Figure 8b). The ratio of annual runoff volume (Q) and annual sand transport (QS) also fell significantly over the same period, indicating an increase in the sediment-carrying capacity of the river during these years. Simultaneously, the ‘reduce peaks and stagnate floods’ mechanism of the upstream dams caused a decline in flood season runoff [37,40], resulting in the narrowing of the main river channel and the abandonment of some tributaries.
From 1996 to 2002, although the Q/QS value increased slightly (Figure 8a), the proportion of flood season to annual runoff in this period was the lowest it has been for the past 50 years (Figure 8b,c), resulting in further falls in the braiding index and river width of the Pingluo section of the Yellow River.
From 2002 to 2018, upstream increases in precipitation led to increases in annual runoff, but dam interception and increases in vegetation coverage in the Yinchuan basin caused a continuous decline in river sediment load [41,42,43], and a significant increase in the Q/QS value. The river channel was mainly wash load, and the river’s width continued to shrink. Simultaneously, increases in flood season runoff were less than increases in annual runoff (Figure 8b), but there was no significant change in the proportion of annual runoff to flood season runoff (Figure 8c), meaning that the ability of floodwater to alter the river’s topography was weak.
Some scholars argue that the Yellow River channel began to shrink since the Liujiaxia and Qingtongxia reservoirs were built in 1968 [44]. During 1986–1996, further joint operation of the Longyangxia, and Liujiaxia reservoirs caused severe siltation of the Ningmeng River section, including the Pingluo section [23]. The Shizuishan–Toketo section downstream of the Pingluo section experienced a decrease in water and sand volume and a severe shrinkage of the main channel from 1987 to 2007 [45]. From 2009 to 2019, the annual runoff of the Ningxia section of the Yellow River increased by 139% due to precipitation [46]. This is all very much in line with the conclusions of this paper. In addition, Zhao [23] attributed the main cause of river siltation to the upstream dams storing water and cutting peaks during the flood season, leading to a significant reduction in high-flow conditions and a reduction in the ability of the water to transport sand. Wang [47] argued that the temporal variation in the rate of riparian oscillation in the Yinchuan Plain is mainly constrained by human damming, water storage, and other factors, while the spatial variation is mainly constrained by regional differences in the composition of riparian materials. Xu [37] believes that the weakening of the dilution effect of the incoming water from the upstream clear water area on the highly sandy water flow in the sandy area is also an important reason for the increase in flushing and siltation in the Lanzhou–Toudaoguai section of the river from 1986 to 1996.

5. Conclusions

Using multi-period Landsat series of remote sensing images from 1973 to 2023, this study extracted and analyzed river channel morphometric parameters such as the channel braiding index (BIT), the bar braiding index (BIB), the average bar area (Ab), and the width of the wet channel (BW) along the Pingluo section of the Yellow River. It was found that the river area along this section has contracted over the last 50 years. Parameters such as river width and the braiding index showed a three-phase change that characterized 1986 and 2018 as the main turning points within the overall study period, i.e., between 1973 and 1986, river area, the channel braiding index, and river width increased year on year; during the period 1986–2018, the river experienced a persistent and slow contraction; and during the 2018–2023 period, parameters increased and the river area expanded slightly.
A synthesis of regional climate records and human activity data indicated that climate-induced increases in precipitation likely increased the magnitude and frequency of floods along the Pingluo section between 2018 and 2023, along with the river braiding index and inundation area. Dams built after 1986 intercepted a significant quantity of runoff and sediment, reducing high water level peaks and stagnating floods, resulting in an increase in low and medium flow calendars and possibly a narrowing of the river channel.

Author Contributions

Conceptualization, H.G.; methodology, C.J. and S.L.; validation, T.Y.; formal analysis, S.L. and M.H.; data curation, S.L.; writing—review and editing, S.L., C.J. and F.H. All authors have read and agreed to the published version of the manuscript.

Funding

This study was supported by the National Natural Science Foundation of China (Grant No. 42171002) and the Second Tibetan Plateau Scientific Expedition and Research Program (STEP) (Grant No. 2019QZKK0205).

Data Availability Statement

The data in this study are confidential. Please contact the corresponding author for further details, if necessary.

Acknowledgments

We are grateful to the Yellow River Conservancy Commission for providing data support. We are grateful to Edward Derbyshire for revising the language of the manuscript.

Conflicts of Interest

The authors declare no conflicts of interest.

References

  1. Zhang, J.; Wang, G.; He, R.; Liu, C. Variation trends of runoffs in the Middle Yellow River Basin and its response to climate change. Adv. Water Sci. 2009, 20, 153–158. [Google Scholar]
  2. IPCC. Contribution of Working Groups I, II and III to the Sixth Assessment Report of the Intergovernmental Panel on Climate Change. In Climate Change 2023: Synthesis Report; IPCC: Geneva, Switzerland, 2023. [Google Scholar]
  3. Dewan, A.M.; Robert, J.C.; Saleem, A.; Rahman, M.M.; Haider, M.R.; Rahman, M.M.; Sarker, M.H. Assessing channel changes of the Ganges-Padma River system in Bangladesh using Landsat and hydrological data. Geomorphology 2017, 267, 257–279. [Google Scholar] [CrossRef]
  4. Baniya, S.; Deshar, R.; Chauhan, R.; Thakuri, S. Assessment of channel migration of Koshi River in Nepal using remote sensing and GIS. Environ. Chall. 2023, 11, 100692. [Google Scholar] [CrossRef]
  5. LuoZada, R.O.; Roque, F.O.; Diniz, J.M.S.; Bergier, I. River channel avulsion in the Taquari River megafan of the Brazilian Pantanal: Remote sensing and modeling reveal recent and future changes. Appl. Geogr. 2023, 155, 102955. [Google Scholar] [CrossRef]
  6. Wu, Q.; Ke, L.; Wang, J.; Pavelsky, T.M.; Allen, G.H.; Sheng, Y.; Duan, X.; Zhu, Y.; Wu, J.; Wang, L.; et al. Satellites reveal hotspots of global river extent change. Nat. Commun. 2023, 14, 1587. [Google Scholar] [CrossRef]
  7. Zheng, G.; Allen, S.K.; Bao, A.; Cánovas, J.A.B.; Huss, M.; Zhang, G.; Li, J.; Yuan, Y.; Jiang, L.; Yu, T.; et al. Increasing risk of glacial lake outburst floods from future Third Pole deglaciation. Nat. Clim. Change 2021, 11, 411–417. [Google Scholar] [CrossRef]
  8. Wellmeyer, L.L.; Slattery, M.C.; Phillips, J.D. Quantifying downstream impacts of impoundment on flow regime and channel planform, lower Trinity River, Texas. Geomorphology 2005, 69, 1–13. [Google Scholar] [CrossRef]
  9. Ran, L.; Wang, S.; Fan, X. Channel change at Toudaoguai Station and its responses to the operation of upstream reservoirs in the Upper Yellow River. J. Geogr. Sci. 2010, 20, 231–247. [Google Scholar] [CrossRef]
  10. Magliulo, P.; Bozzi, F.; Leone, G.; Fiorillo, F.; Leone, N.; Russo, F.; Valente, A. Channel adjustments over 140 years in response to extreme floods and land-use change, Tammaro River, southern Italy. Geomorphology 2021, 383, 107715. [Google Scholar] [CrossRef]
  11. Adib, A.; Foladfar, H.; Roozy, A. Role of construction of large dams on river morphology (case study: The Karkheh dam in Iran). Arab. J. Geosci. 2016, 9, 661. [Google Scholar] [CrossRef]
  12. Schumm, S.A. River Variability and Complexity; Cambridge University Press: New York, NY, USA, 2005; pp. 70–73. [Google Scholar]
  13. Dethier, E.N.; Renshaw, C.E.; Magilligan, F.J. Rapid changes to global river suspended sediment flux by humans. Science 2022, 376, 1447–1452. [Google Scholar] [CrossRef] [PubMed]
  14. Gilvear, D.; Winterbottom, S.; Sichingabula, H. Character of channel planform change and meander development: Luangwa River, Zambia. Earth Surf. Proc. Land. 2000, 25, 421–436. [Google Scholar] [CrossRef]
  15. Yang, X.; Damen, M.C.J.; Van Zuidam, R.A. Satellite remote sensing and GIS for the analysis of channel migration changes in the active Yellow River Delta, China. Int. J. Appl. Earth Obs. 1999, 1, 149–157. [Google Scholar] [CrossRef]
  16. Lane, E.W. The Importance of Fluvial Morphology in Hydraulic Engineering. Proc. Am. Soc. Civ. Eng. 1955, 81, 1–17. [Google Scholar] [CrossRef]
  17. Nones, M. Remote sensing and GIS techniques to monitor morphological changes along the middle-lower Vistula river, Poland. Int. J. River Basin. Manag. 2021, 19, 345–357. [Google Scholar] [CrossRef]
  18. Zhang, J.; Shang, Y.; Liu, J.; Fu, J.; Wei, S.; Tong, L. Causes of Variations in Sediment Yield in the Jinghe River Basin, China. Sci. Rep. 2020, 10, 18054. [Google Scholar] [CrossRef]
  19. Yang, S.; Ding, J.; Chen, X.; Zhao, G.; Chen, Y. Analysis on ice flood in Ningxia Section of Yellow River in last 13 years. J. Desert Res. 2005, 25, 141–145. [Google Scholar]
  20. Fan, X.; Shi, C.; Zhou, Y.; Shao, W. Sediment rating curves in the Ningxia-Inner Mongolia reaches of the Upper Yellow River and their implications. Quatern. Int. 2012, 282, 152–162. [Google Scholar] [CrossRef]
  21. Liu, C.; Zhang, X. Causal analysis on actual water flow reduction in the mainstream of the Yellow River. Acta Geogr. Sin. 2004, 59, 323–330. [Google Scholar]
  22. Xu, J. A Study on the coupling relation between the water and sediment yield sub-system and river channel deposition sub-system: An example from the Yellow River. Acta Geogr. Sin. 1997, 52, 39–47. [Google Scholar]
  23. Zhao, W.; Cheng, X.; Hou, S.; Li, H. Analysis of scouring and sedimentation in the channel from Ningxia to Inner Mongolia in the Upper Yellow River. Yellow River 1999, 21, 13–16. [Google Scholar]
  24. Xu, J. Response of bankfull discharge to human activity and climate change: The Inner Mongolia Reach of the Upper Yellow River. Sci. Geogr. Sin. 2016, 36, 837–845. [Google Scholar]
  25. Zhang, X.; Pan, Q. Investigation and Assessment of the Yellow River Water Resources; Yellow River Water Resources Publishing House: Zhengzhou, China, 2006. (In Chinese) [Google Scholar]
  26. McFeeters, S.K. The use of the Normalized Difference Water Index (NDWI) in the delineation of open water features. Int. J. Remote Sens. 1996, 17, 1425–1432. [Google Scholar] [CrossRef]
  27. Hong, L.B.; Davies, T.R.H. A study of stream braiding. Geol. Soc. Am. Bull. 1979, 90, 1839–1859. [Google Scholar] [CrossRef]
  28. Germanoski, D.; Schumm, S.A. Changes in braided river morphology resulting from aggradation and degradation. J. Geol. 1993, 101, 447–462. [Google Scholar] [CrossRef]
  29. Huo, F.; Pan, X.; You, G.; Zheng, Z.; Liao, H.; Zhou, T.; Zhang, G.; Xu, G.; Liu, Z.; Gui, Z. Introduction to Geology of Ningxia, 1st ed.; Science Press: Beijing, China, 1989; p. 5. [Google Scholar]
  30. Deng, Q.; Sung, F.; Zhu, S.; Li, M.; Wang, T.; Zhang, W.; Burchfiel, B.C.; Molar, P.; Zhang, P. Active faulting and tectonics of the Ningxia-Hui Autonomous Region, China. J. Geophys. Res. 1984, 89, 4427–4445. [Google Scholar]
  31. Hickin, E.J. River Channel Changes: Retrospect and Prospect. Mod. Anc. Fluv. Syst. 1983, 6, 61–83. [Google Scholar]
  32. Wang, S.; Yan, Y.; Yan, M.; Zhao, X. Contributions of precipitation and human activities to the runoff change of the Huangfuchuan Drainage Basin: Application of comparative method of the slope changing ratio of cumulative quantity. Acta Geogr. Sin. 2012, 67, 388–397. [Google Scholar]
  33. Condon, L.E.; Atchley, A.L.; Maxwell, R.M. Evapotranspiration depletes groundwater under warming over the contiguous United States. Nat. Commun. 2020, 11, 873. [Google Scholar] [CrossRef]
  34. Humphrey, V.; Zscheischler, J.; Ciais, P.; Gudmundsson, L.; Sitch, S.; Seneviratne, S.I. Sensitivity of atmospheric CO2 growth rate to observed changes in terrestrial water storage. Nature 2018, 560, 628–631. [Google Scholar] [CrossRef]
  35. Zhang, S.; Yu, W.; Zhang, H. Sediment characteristic and the variety trend analysis for upstream Yellow River. J. Water Resour. Water Eng. 2005, 16, 57–61. [Google Scholar]
  36. Shang, H.; Zheng, Y.; Zhang, X. Influence of reservoir operation to the silt-discharge condition of Ning-Meng Section of the Yellow River. Yellow River 2008, 30, 28–30. [Google Scholar]
  37. Xu, J. The influence of dilution on downstream channel sedimentation in large rivers: The Yellow River, China. Earth Surf. Proc. Land. 2014, 39, 450–462. [Google Scholar] [CrossRef]
  38. Yellow River Conservancy Commission of the Ministry of Water Resources. Available online: http://www.yrcc.gov.cn/nishagonggao/2018/index.html#p=1 (accessed on 11 October 2023).
  39. Ningxia Hui Autonomous Region People’s Government. Available online: https://www.nx.gov.cn/zwxx_11337/zwdt/202104/t20210409_2704564.html (accessed on 11 March 2023).
  40. Liu, X.; Hou, S.; Chang, W. Cause of main channel shrinkage occurred to the Inner-Mongolia reaches of Yellow River. J. Hydraul. Engasc. 2009, 40, 1048–1054. [Google Scholar]
  41. Wang, H.; Sun, F. Variability of annual sediment load and runoff in the Yellow River for the last 100 years (1919–2018). Sci. Total Environ. 2021, 758, 143715. [Google Scholar] [CrossRef]
  42. Wu, X.; Wang, S.; Fu, B.; Feng, X.; Chen, Y. Socio-ecological changes on the Loess Plateau of China after Grain to Green Program. Sci. Total Environ. 2019, 678, 565–573. [Google Scholar] [CrossRef]
  43. Han, S.; Ma, Z.; Zhuang, W.; Lu, H.; Liu, T.; Shen, J. Spatial-temporal change of Leaf Area Index (LAI) in the source region of the Yellow River during 2000–2018. J. Irrig. Drain. 2019, 38, 57–62. [Google Scholar]
  44. Fan, X.; Shi, C.; Bai, J.; Yao, H. Study on sediment delivery rate in the Ningxia-Inner Mongolia reaches of the upper Yellow River. Int. J. Sediment. Res. 2015, 6, 27–33. [Google Scholar]
  45. Hou, S.; Wang, P.; Chang, W.; Chu, W. Evaluation on the Volume of Scour and Fill of Inner Mongolia Section of the Yellow River. Yellow River 2007, 29, 21–22. [Google Scholar]
  46. Zhao, Y.; Liu, X.; Luo, J.; Ke, Y.; Zhang, X. Fluctuation Characteristics of Runoff and Sediment in the Trunk River in Ningxia Section of Yellow River from 2009 to 2019. Ningxia J. Agri. Fores 2023, 64, 42–47. [Google Scholar]
  47. Wang, S.; Li, L. Lateral shift rate variation of the river banks in the Yinchuan Plain reach of the Yellow River and its causes. Acta Geogr. Sin. 2014, 699, 399–408. [Google Scholar]
Figure 1. Location of the Pingluo section of the Yellow River. (a) The Yellow River Basin. (b) Overview of the topography of the Pingluo section. (c) Channel geomorphic planform and the sub-reaches of the Pingluo section.
Water 16 00911 g001
Figure 2. Image preprocessing and river data extraction.
Water 16 00911 g002
Figure 3. Morphological changes along the Pingluo section of the Yellow River from 1973 to 2023. (a) Overlapped comparison of the planform of the Pingluo section. (b) The annual planform changes along the Pingluo section.
Water 16 00911 g003
Figure 4. Variation in river parameters along the Pingluo section of the Yellow River from 1973 to 2023. (a) Trends in changes in wet channel area and river area. (b) Trends in changes in river width and wet channel width. (c) Trends in changes in total and average bar areas. (d) Trends in changes in the bar braiding and channel braiding indices.
Water 16 00911 g004
Figure 5. Climatic and environmental changes along the Pingluo section, 1973–2023. (a) Changes in air temperatures in the Yellow River Basin and precipitation in the upstream reaches of the Pingluo section. (b) Changes in runoff and sediment load along the Pingluo section. (c) Variations in the water storage capacities of reservoirs in the upstream Pingluo section and the number of days with daily flow exceeding 3000 m3/s. (d) Trends in river morphology parameters along the Pingluo section.
Water 16 00911 g005
Figure 6. Impact of flooding on channel morphology along the Pingluo section. (a) Channel morphology of the Yellow River’s Pingluo section during the same flow period before and after the flood of October 2018. (b) River morphology during the flood of October 2018 (the high and low sand contents are based on analyses of remote sensing imagery).
Water 16 00911 g006
Figure 7. Levees along the Pingluo section. (a) High embankments. (b) Low embankments. (c) Embankments and spur dikes.
Water 16 00911 g007
Figure 8. Trends in the interannual water quantities and runoff-to-sediment ratios along the Pingluo section, 1973–2023. (a) Ratio of annual runoff to sediment load along the Pingluo section. (b) Flood-season water quantities and annual water quantities along the Pingluo section. (c) Ratio of flood season runoff volume to annual runoff volume along the Pingluo section.
Water 16 00911 g008
Table 1. Image data information sheet.
Data SeriesSensor TypeImaging TimeResolution (m)
Landsat 1MSSDecember 197360
Landsat 2MSSOctober 197760
Landsat 5TMNovember 198630
Landsat 5TMDecember 198830
Landsat 5TMNovember 199330
Landsat 5TMDecember 199830
Landsat 5TMMarch 200330
Landsat 5TMFebruary 200930
Landsat 8OILNovember 201330
Landsat 8OILNovember 201830
Landsat 8OILMarch 202330
Table 2. Definition and calculation of channel morphology parameters.
River Morphology ParametersFormulaDescription of the Formula
River area (A) A = A W + A B A is the total area of the reach of the river, including the area of the wet channel (AW) and the area of all the islands and/or sandbars (AB).
River width (B) B = B i ¯  1Bi is the width of the furthest two sides of the branch on the i-th cross section along the river flow [4].
Channel braiding index (BIT) B I T = N w i ¯ Nwi is the number of branching channels in the i-th cross section along the river flow [27].
Wet channel area (AW)-AW is the total water area of the reach.
Wet channel width (BW) B W = B w i ¯ B = Σ B w i j Bwi is the total width of the river flow path on section i.
Bwi-j is the width of the j-th branch in the i-th cross-section along the flow of the river.
Bar braiding index (BIB) B I B = 2 Σ L b L r + N B L r Lb is the length of each island and/or sandbar in the reach, NB is the total number of islands and/or sandbars in the reach, and Lr is the straight-line distance between the upper and lower ends of the reach [28].
Area of the bar (AB)-AB is the total area of all islands and/or sandbars in the reach.
Average area of the bar (Ab) A b = A B N B Ab is the average area of all islands and/or sandbars in the reach.
Note: 1 The bar above the formula represents the average of the content below it.
Disclaimer/Publisher’s Note: The statements, opinions and data contained in all publications are solely those of the individual author(s) and contributor(s) and not of MDPI and/or the editor(s). MDPI and/or the editor(s) disclaim responsibility for any injury to people or property resulting from any ideas, methods, instructions or products referred to in the content.

