
Study on the Influence of Vegetation Restoration on Evapotranspiration in Mountainous Areas of the Luan River Basin
1
CAS-Key Laboratory of Agricultural Water Resources, Hebei-Key Laboratory of Water Saving Agriculture, Center for Agricultural Resources Research, Institute of Genetics and Developmental Biology, Chinese Academy of Sciences, Shijiazhuang 050022, China
2
Soil and Water Conservation Work Station of Hebei Province, Shijiazhuang 050011, China
3
Hebei Water Resources Planning and Design Institute Co., Ltd., Shijiazhuang 050021, China
4
Department of Water Resources, Beijing Water Science and Technology Institute, Beijing 100048, China
5
State Key Laboratory of Simulation and Regulation of Water Cycle in River Basin, China Institute of Water Resources and Hydropower Research, Beijing 100038, China
*
Authors to whom correspondence should be addressed.
Water 2024, 16(8), 1143; https://doi.org/10.3390/w16081143
Submission received: 6 March 2024
/
Revised: 10 April 2024
/
Accepted: 11 April 2024
/
Published: 18 April 2024
(This article belongs to the Special Issue Socio-Economics of Water Resources Management)
Abstract
:The study employed the PML (Penman–Monteith–Leuning) model to simulate the evolution law of long-sequence evapotranspiration in the mountainous region of the Luan River basin. Additionally, this study conducted a quantitative analysis to determine the effect of restoration on evapotranspiration water consumption. From 1981 to 2020, the results indicated that there were significantly less fluctuations in precipitation in the mountainous region of the Luan River basin than there were fluctuations in discharge. The restoration of vegetation in the mountainous region of the Luan River basin caused a mean annual growth rate of 3.47 mm in evapotranspiration. A linear positive correlation was observed between the evapotranspiration and vegetation NDVIs (normalized difference vegetation indexes) in mountainous regions. Specifically, for each 0.01 increase in the NDVI, there was an approximate 8.3 mm increase in evapotranspiration. When comparing the time periods of 1995–2001 and 2002–2020, it was observed that evapotranspiration increased by 70 mm. Furthermore, the evapotranspiration rate in the southeastern region exhibits significant variation, peaking at over 50 mm per year. In contrast, the northwest experiences variations of less than 10 mm per year. A quantitative analysis of the relationship between the evolution of mountain evapotranspiration and the response law of vegetation restoration is presented in this study; this information can be used as a guide when developing practical vegetation restoration strategies.
1. Introduction
Large-scale vegetation restoration and its effect on basin hydrological processes are current research focuses [1,2]. China has implemented a series of ecological construction projects, including the “Green Wall of China” project, since the 1980s. The “Green Wall of China” project achieved a cumulative afforestation and conservation area of 30.14 million hectares by the year 2020, resulting in an increase in vegetation coverage from 5.05% to 13.57% in the project area [3], establishing an ecological barrier made of green materials. Recent research has established a correlation between the growth of vegetation in water-scarce regions and a notable decrease in runoff in mountainous areas [4]. This correlation has been verified in the Yellow River Basin [5,6] and Hai River Basin [7] in relation to the rapid increase in vegetation coverage in northern China. The mountainous area of the Luan River Basin is one of the areas with the highest vegetation NDVI in the mountainous area of the Hai River Basin, and it is also the area with the most significant vegetation restoration [8]. At present, some studies have pointed out that due to climate warming, the growing season of vegetation becomes longer, resulting in an increase in evapotranspiration in mountainous areas, which in turn leads to a decline in runoff in the mountainous area of the Luan River Basin [9]. In addition to vegetation phenology changes, soil and water conservation measures are also the main reasons for the vegetation growth in the Luan River Basin. Therefore, further research is needed from a comprehensive perspective to study the relationship between vegetation restoration and mountainous runoff evolution to guide future rational vegetation restoration planning, and this is a pressing issue that needs to be addressed.
For a long time, there has been controversy among different sectors regarding the hydrological effects of vegetation restoration. Some scholars [10,11] believe that one tree is like a “small reservoir,” while others [12,13] consider it a “water pump”. The disagreement lies in how to define the resource attributes of water. The “small reservoir” viewpoint believes that vegetation restoration increases water retention capacity; although it reduces flood runoff, it increases non-flood runoff and neutralizes the annual runoff process [14,15]. The “water pump” viewpoint, on the other hand, posits that vegetation restoration undoubtedly increases evapotranspiration in mountainous areas; from the total water balance account, the runoff is reduced [16,17], exacerbating the competition between ecological water use and socio-economic water use in water-deficient regions. However, scholars with different views [18,19] also advocate for moderate vegetation restoration measures and advise against large-scale human interventions in water-deficient areas, which may lead to inappropriate vegetation arrangements and affect ecological functions.
Studying the response relationship between vegetation restoration and evapotranspiration is key to determining the appropriate restoration scale in water-deficient regions and is a current research hotspot. Currently, there is more research on the Loess Plateau, where large-scale vegetation restoration and water conservation engineering measures have increased water consumption in mountainous areas and are important reasons for reduced runoff in the Loess Plateau [20,21]. Especially since 2000, large-scale vegetation restoration in the Loess Plateau has led to a significant increase in evapotranspiration [22]. Although rainfall has increased at a rate of 5.16 mm/year during the same period, in the 16 sub-watersheds with intense vegetation restoration, surface runoff still shows a continuous downward trend, with an average decrease of −1.45 mm/year [23]. In addition to directly increasing soil water consumption, mountain vegetation also increases crown interception and surface roughness. As the vegetation restoration age increases, the surface soil bulk density decreases, and the water-holding capacity and infiltration capacity improve, leading to a decline in runoff in mountainous areas [24]. Currently, research on the relationship between vegetation restoration and runoff in the Loess Plateau is mostly based on the statistical analysis of data [25,26], and the response mechanism of vegetation change and runoff still lack in-depth exploration. Bao et al. [27] used machine learning algorithms to evaluate the sensitivity of the NDVI in the Huang-Huai-Hai Region to temperature and precipitation changes. They found that the NDVI in the basin had a positive response to temperature and precipitation changes, and climate indirectly influenced runoff by changing vegetation conditions. Feng et al. [6] believed that the increased evapotranspiration in the Loess Plateau has significantly reduced the proportion of runoff to basin rainfall (p < 0.001). Considering the water resources endowment of the Loess Plateau, vegetation restoration has reached its limit. Zhang et al. [28] compared the relationship between NDVI changes and surface runoff in the Huang-Huai-Hai Region using the elasticity coefficient method, and found that an increase in the NDVI in the Huang-Huai-Hai Region weakens runoff, with an average decrease of 8.3% for every 10% increase in the NDVI. Currently, there is no similar study on the Hai River Basin, and the decline in water resources in the Hai River Basin is more severe than that in the Yellow River Basin. Based on this, this study takes the mountainous area of the Luan River as the research object, and conducts research on the changing law of the vegetation index from 1981 to 2020 and the corresponding relationship with evapotranspiration water consumption. We then provide technical support for formulating reasonable vegetation restoration plans.
2. Study Area and Method
2.1. Study Area
The research area is located the mountainous area of the Luan River Basin, as shown in Figure 1. Its geographical location is between 115°34′ E and 119°50′ E, with a total area of approximately 530,000 km2. The Mountainous area of the Luan River Basin is situated in the northern part of Hebei Province, within the jurisdiction of Zhangjiakou City, at the northern foot of Bayan Gultu Mountain. The terrain slopes from northwest to southeast. The climate in the basin varies significantly from north to south, transitioning from a cold, temperate arid and semi-arid climate to a warm, temperate semi-humid climate. The average annual precipitation in the entire basin ranges from 300 to 800 mm, with large interannual variations and uneven distribution throughout the year. The rainy season accounts for 60% to 80% of the annual precipitation. The average annual temperature in the basin ranges from −3 °C to 11 °C, gradually decreasing from southeast to northwest, the minimum temperature in winter can reach −25 °C, and the temperature in the vegetation growing season is usually higher than 0 °C. The annual average pan evaporation in the basin is 950–1150 mm, with the maximum occurring in the Qian’an and Qianxi areas, generally exceeding 600 mm and decreasing significantly toward the north. The minimum occurs in the Bashang area, at around 400 mm.
2.2. Method and Data
2.2.1. Method
In this study, the Penman–Monteith–Leuning (PML) model was used to calculate the changes in evapotranspiration after vegetation restoration. The PML model (2008), based on the Penman–Monteith theory, introduces the “surface resistance” parameter, which allows for the direct estimation of evapotranspiration under non-saturated surface conditions based on changes in the vegetation leaf area index [29]. This method divides surface evapotranspiration into two components, soil evaporation and vegetation transpiration, which is suitable for calculating the change in evapotranspiration water consumption in mountainous areas after vegetation restoration. It has been successfully applied in regions such as the Loess Plateau and the Heihe River Basin in China [26]. The basic calculation formula is as follows:
where ETa is the actual evapotranspiration in the mountainous region, in mm; λ is the latent heat of vaporization, in MJ/kg; Δ is the ratio of the slope of the temperature-saturated vapor pressure curve to the wet and dry gauge constant, in kPa/°C; ρa is the air density, in kg/m3; cp is the specific heat capacity of air at constant pressure, in J/kg/°C; A is the available energy, the difference between net radiation and soil heat flux, in MJ; Da is the reference height’s saturated water vapor pressure difference, in kPa; Ga is the aerodynamic conductance, Ga = 0.033 m/s; and Gs is the surface conductance, in m/s, calculated from Equation (2):
where Gc is the canopy conductance, in m/s, calculated from Equation (5), , where kA is the proportion of available energy allocated on the LAI, ε = Δ/γ, is the soil evaporation coefficient, which characterizes the soil water supply in the study area, and is the “climatological” conductance defined by Monteith [30] and Duan [31]; the formula is as follows:
In the PML model, reflects the supply of soil water. When = 1, it means that the soil water supply is sufficient, and the soil evaporation is not constrained by water. When = 0, it means that the soil is extremely dry. Zhang [32] pointed out that in areas with better vegetation conditions, has less of an effect on the simulated results of evapotranspiration. is usually calculated using the following formula:
where Pn is rainfall, in mm/d; Eeq,s,n is the average evaporation rate of the soil surface, in mm/d. For details, please refer to the empirical formula provided by Zhang [26]:
where Qh is the flux density of visible radiation at the top of the canopy (approximately half of the incoming solar radiation). Q50 is the visible light radiation flux above the canopy, in m/s; Q50 and D50 are the visible light radiation flux and water vapor pressure difference when the stomatal conductance is gs = gsx/2, usually 2.6 MJ/m2/d and 0.8 kPa; KQ is the short-wave radiation attenuation coefficient, usually 0.6;
In the PML model, gsx needs to be calibrated and verified through the simulation of evapotranspiration and measured data. gsx represents the maximum stomatal conductance of the vegetation canopy and is a calibrated parameter, typically ranging from 0.002 to 0.015.
Since it is difficult to obtain actual evapotranspiration data and there are no long-term observation data from flux towers in the Luan River Basin, the water balance method was used to verify the accuracy of the simulated actual evapotranspiration. Considering that the northern part of the Luan River mountainous area is dominated by grassland, the central area is dominated by arbor irrigation forests, and the southern area has more rainfall where vegetation develops into arbor forests, the water balance of these small watersheds was used to calibrate and verify the parameters (Equation (7)), and the calibrated parameters were then applied to three sub-regions within the Luan River Basin; as shown in Figure 2, the three statistical charts on the right of the figure are the verification results of the ETa of the three small catchments. The horizontal coordinate is the ETa calculated under the PML model, and the vertical coordinate is the ETa calculated using the water balance method. The same gsx value was used for all three sub-regions; on an annual scale, the water balance was used to verify the entire Luan River Basin, and the results are shown in Section 3.3.
where ETa is the actual evapotranspiration on an annual scale; P is the precipitation observed from the meteorological station; R is the runoff monitored by the hydrological station. Considering that the study area is a mountainous area and that the soil layer capable of storing water is thin, the change in soil water storage is ignored on the annual scale.
2.2.2. Data
The meteorological data (rainfall, radiation, wind speed, relative humidity, temperature, etc.) used in the study were obtained from 13 surface meteorological stations distributed in the Luan River Basin. Leaf area index (LAI) data were obtained from the GLASS (The Global Land Surface Satellite Product) dataset (http://www.glass.umd.edu/Download.html, accessed on 13 February 2024), produced from 1981 to 2018 using AVHRR remote sensing products. The 2019–2020 data were produced via MODIS remote sensing product interpolation extension. NDVI data were obtained from the National Earth System Science Data Center (http://www.geodata.cn/data/datadetails.html?dataguid=239118756960240, accessed on 13 February 2024), which provides NDVI product data from 1981 to 2020, extracted from the global NOAA_CDR_AVHRR_NDVI_V5 dataset. Arcpy software (Arcgis 10.5) was used to process spatial remote sensing data and conduct statistical analysis. Runoff data were obtained from the third Luan River Basin Water Resources Survey and Assessment (1956–2016), and the data series was extended to 2020 through the annual Water Resources Bulletin.
3. Results
3.1. Evolutionary Pattern of Runoff in the Mountainous Area of Luan River Basin
Since the 1980s, runoff in the mountainous area of the Luan River Basin has shown a trend of initial increase, followed by a decrease, and then a slow increase, as shown in Figure 3. The variation in runoff in this mountainous area can be roughly divided into three stages: from 1981 to 1994, the runoff showed an increasing trend with a growth rate of about 260 million m3 per year; from 1995 to 2001, the runoff decreased sharply with a decline rate of 1.06 billion m3 per year; from 2002 to 2020, the runoff in the mountainous area slowly increased with a growth rate of about 110 million m3 per year. In the long series from 1981 to 2020, the runoff in the mountainous area still shows a declining trend, with a decline rate of 30 million m3 per year. The average runoff in the three periods was 3.37 billion m3, 3.88 billion m3, and 2.01 billion m3, respectively. From 2001 to 2020, the runoff in the mountainous area of the Luan River Basin decreased by 40% and 48% compared with that in the previous two periods.
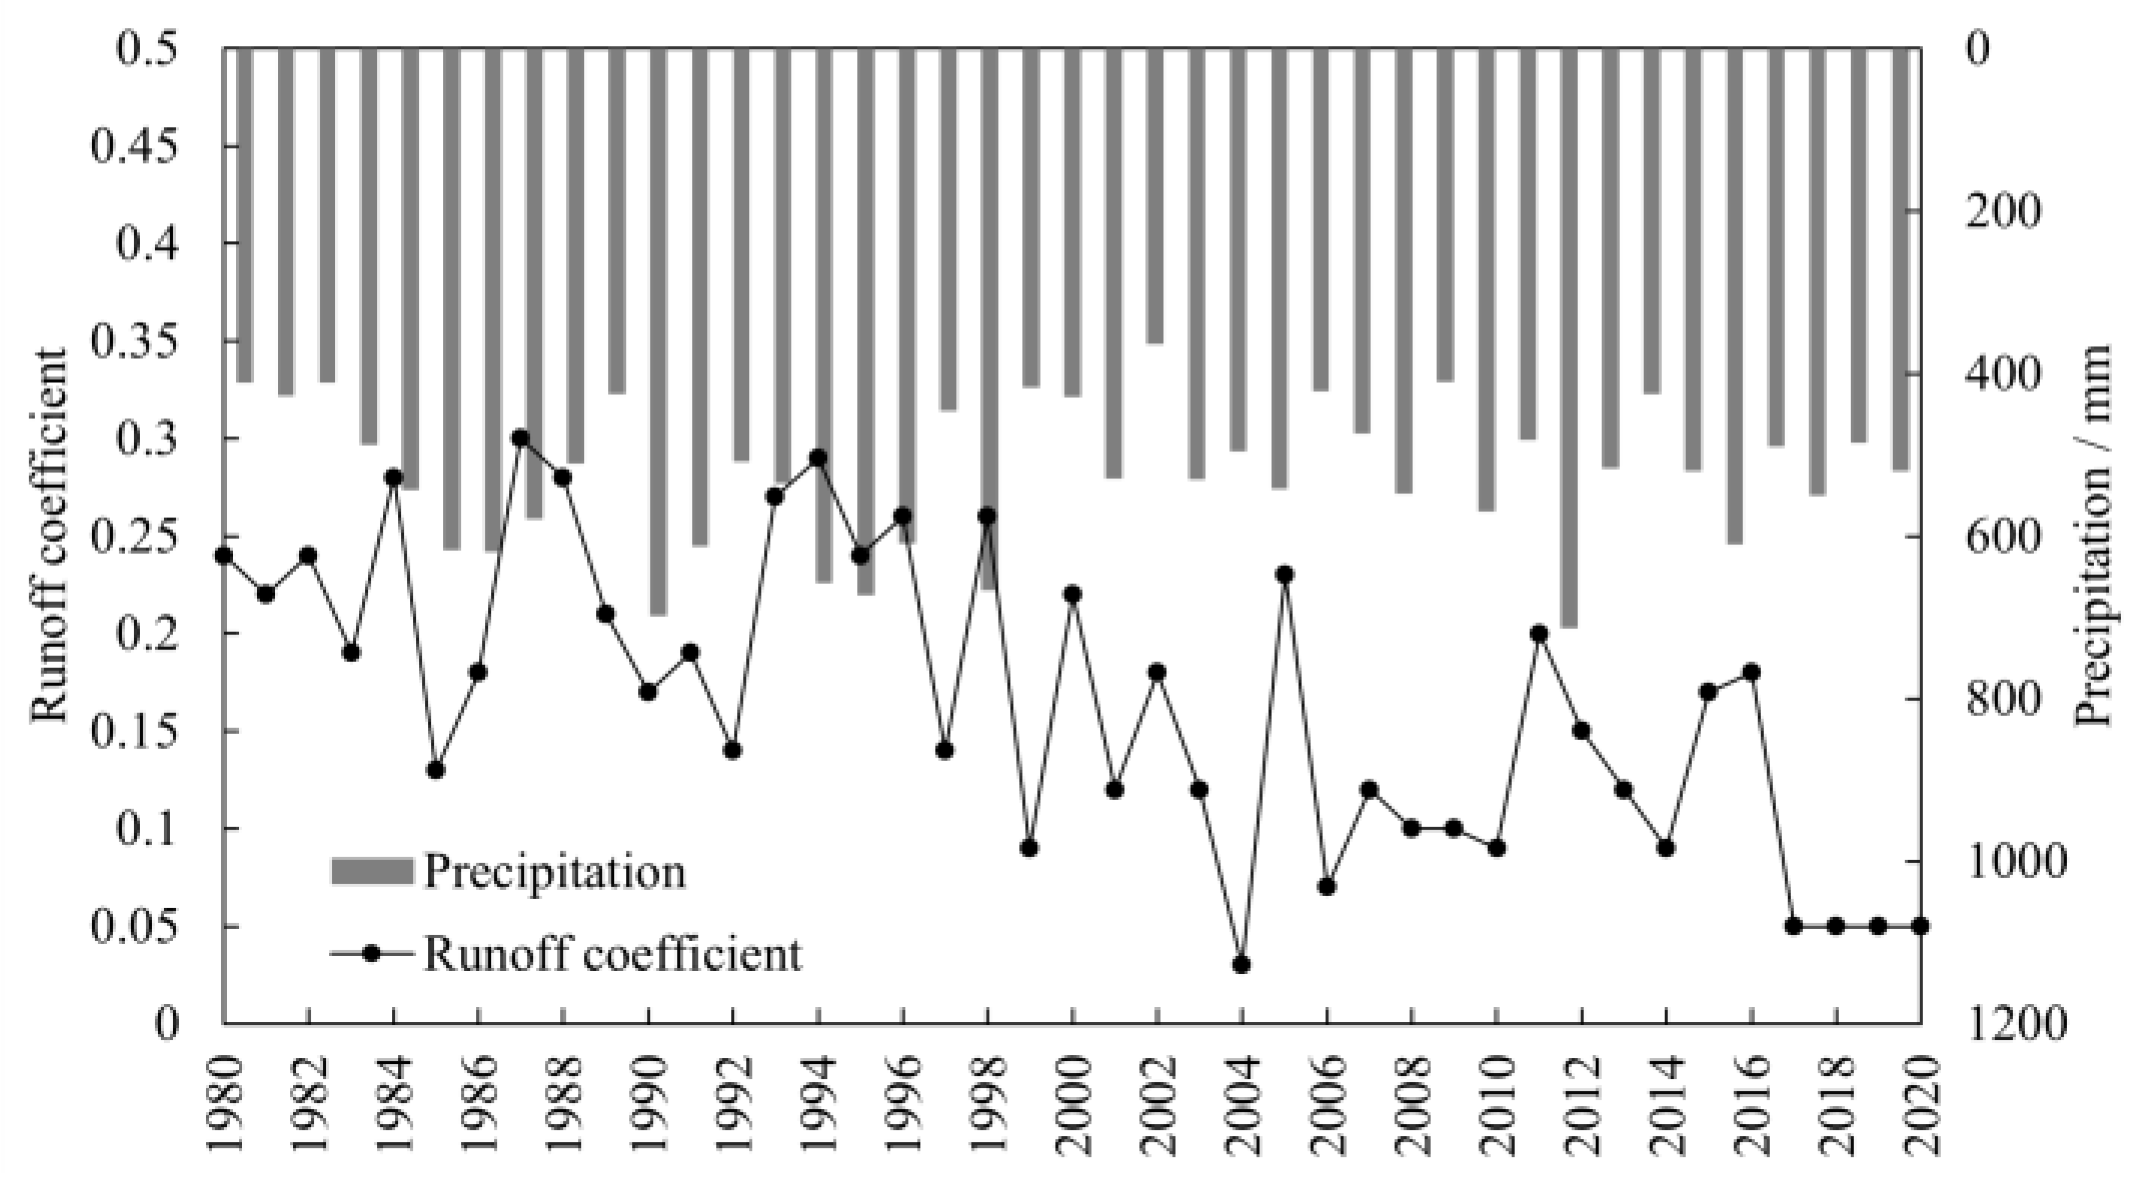
The runoff in the mountainous area of the Luan River Basin is influenced by the precipitation of the current year. To reflect the impact of non-precipitation factors more clearly, the runoff coefficient (runoff/precipitation) is compared with precipitation for analysis, as shown in Figure 4. Since 1981, the precipitation in the mountainous area has not shown a significant change. The average annual precipitation (1981–2020) is 524 mm, with a change rate of −0.18 mm/year. However, the runoff coefficient has shown a continuous decreasing trend, with an average annual decrease rate of 0.004. It has decreased from the peak value of 0.3 to the current value of 0.05. The decrease in runoff in the mountainous area is influenced by both changes in rainfall and changes in vegetation and land use, especially the large-scale construction of terraced fields in the Hai mountainous area, which intercepts and consumes rainfall resources, leading to a significant decline in runoff.
3.2. Evolutionary Pattern of NDVI in the Mountainous Area of Luan River Basin
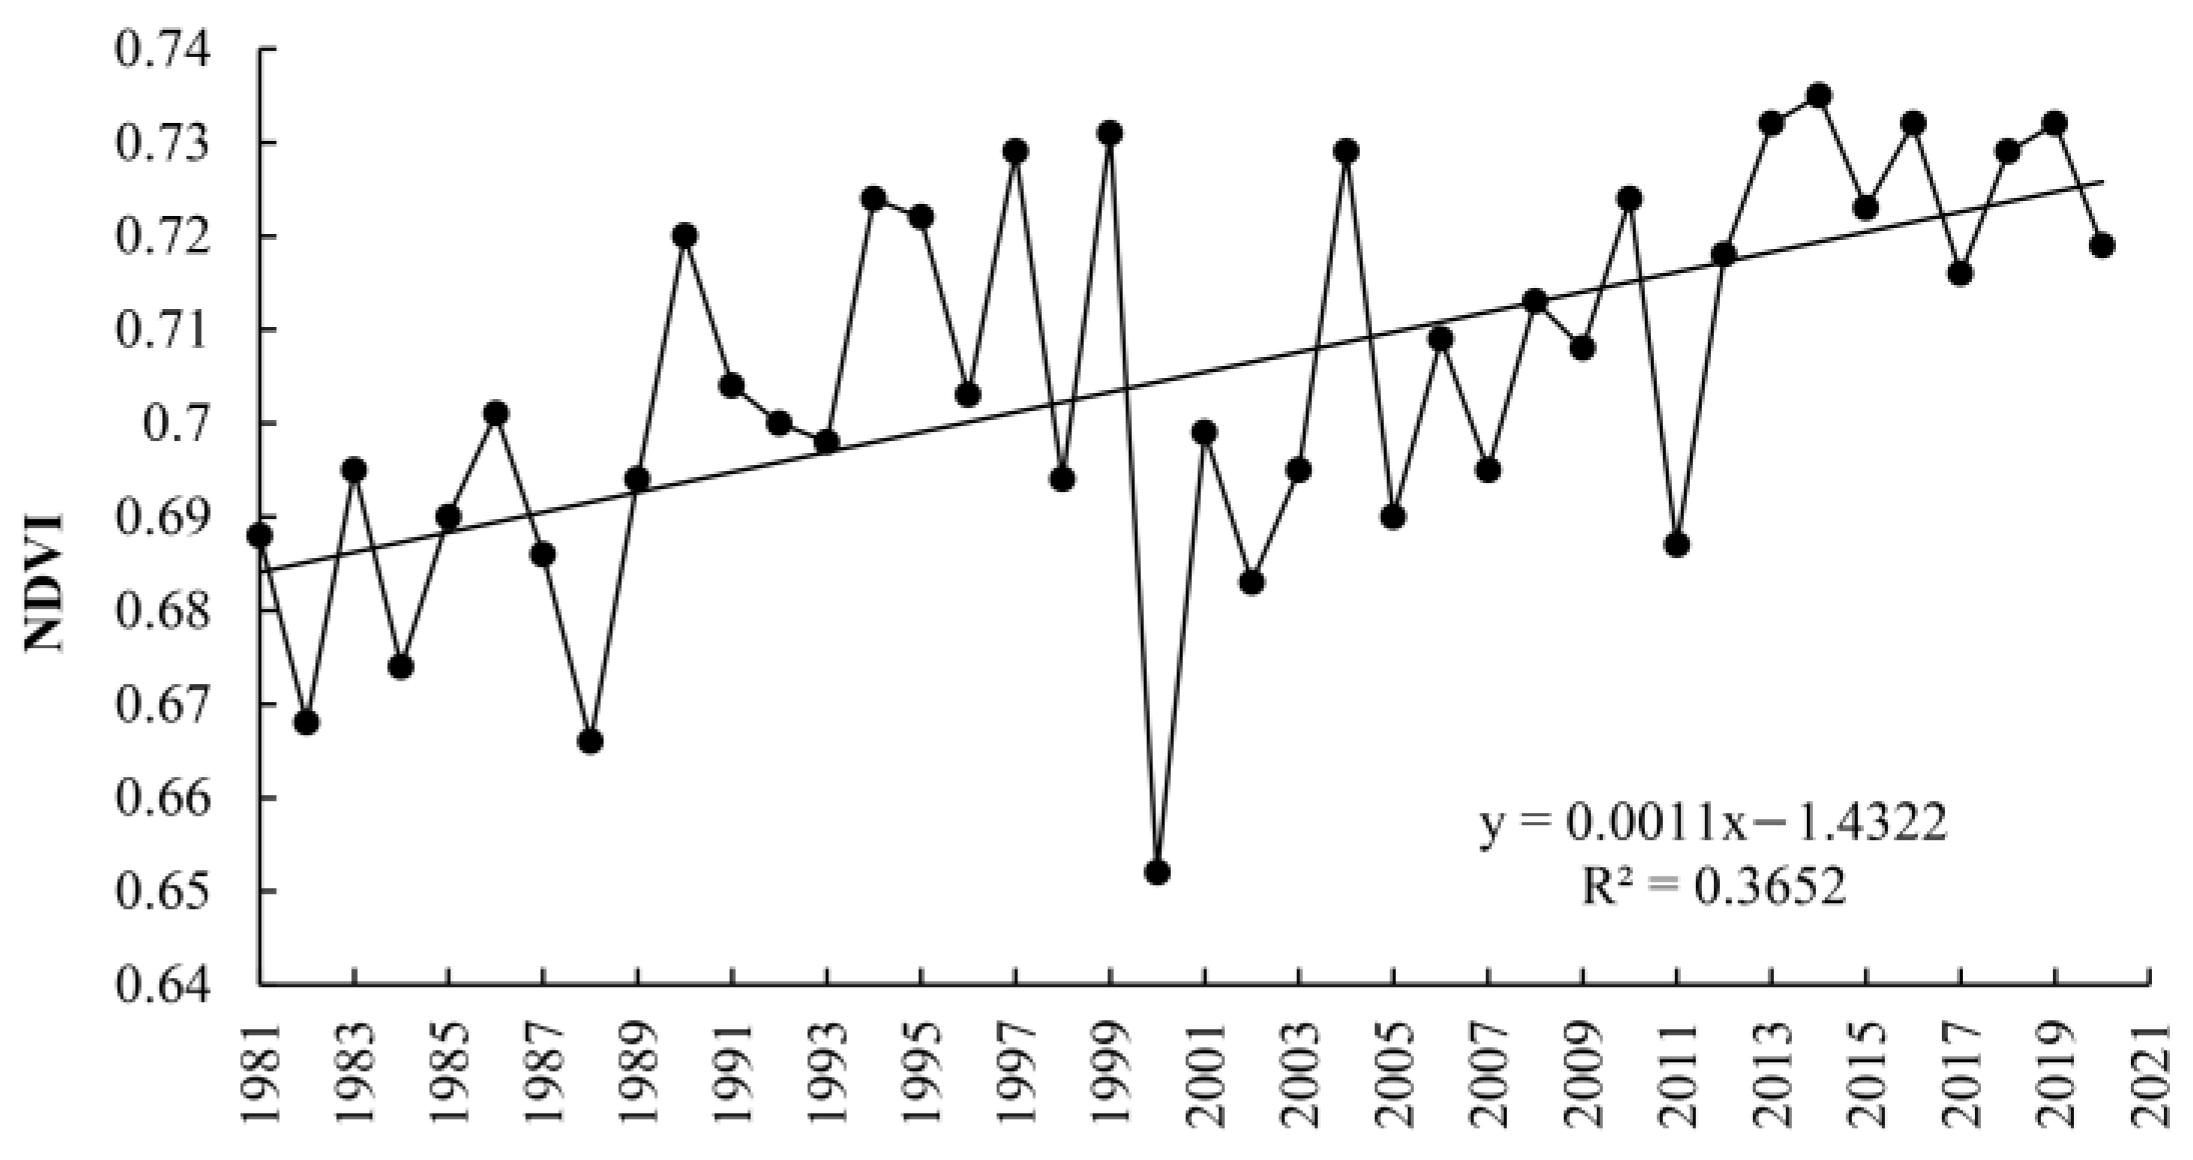
Since the 1980s, vegetation restoration measures have been gradually carried out in the mountainous area of the Luan River Basin, and the vegetation quality in the mountainous area has significantly improved. Based on vegetation remote sensing data (Figure 5), the vegetation NDVI in the mountainous area of the Luan River Basin has shown a continuous increasing trend. The annual growth rate is 0.0011. Except for the year 1999, when the whole basin encountered a severe drought with an annual precipitation of 337 mm, only 57% of the average precipitation from 1956 to 2016, the vegetation quality sharply decreased. In the remaining years, the vegetation showed a fluctuating upward trend influenced by climate and underlying surface factors. The average NDVI increased from 0.68 in the early 1980s to 0.712 in 2020, with the highest value occurring in 2014 at 0.738. In 2014, there was abundant rainfall, which was conducive to vegetation growth.
From the spatial distribution of the NDVI, as shown in Figure 6a, the vegetation coverage is better in Watershed II and III of the mountainous area of the Luan River Basin, where the precipitation exceeds 600 mm and the temperature is higher than that in Watershed I. In Watershed I in the upper reaches of the Luan River, with an elevation of over 2000 m and lower temperatures, the rainfall is around 300 mm, and the vegetation is primarily grassland with lower coverage. The spatial variation rate of the NDVI, as shown in Figure 6b, demonstrates that most areas in the mountainous area of the Luan River Basin have an increasing trend in vegetation, with only 7% of the grid cells showing a degradation trend, possibly influenced by urbanization or land use changes. Similarly, the vegetation coverage rate in the smaller watersheds in Watersheds II and III of the mountainous area increased at a higher rate than did that in Watershed I. The southernmost region of the Luan River mountainous area has transitioned into the plain area and is a watershed of urban development. Influenced by urban expansion, the NDVI of vegetation there shows a declining trend.
3.3. Evolutionary Pattern of ET in the Luan River Mountainous Area
The most direct impact of increased vegetation coverage on the hydrological process in mountainous areas is the increase in evapotranspiration water consumption. By constructing a PML regional evapotranspiration model, the impact of enhanced vegetation coverage on evapotranspiration water consumption in mountainous areas is simulated. Since there are no direct observed data for evapotranspiration, the simulation results are validated through water balance verification in three small watersheds and further validated on a yearly scale in the entire mountainous area of the Luan River Basin, as seen in Figure 7a. The simulated evapotranspiration and annual-scale water balance evapotranspiration are distributed on both sides of the 1:1 line and have a correlation coefficient of 0.87, indicating that the simulation results meet the research requirement. The relationship between the NDVI and evapotranspiration in the mountainous area of Luan River Basin is shown in Figure 7b. As the NDVI increases, evapotranspiration also increases, and the two variables roughly follow a linear positive correlation. On average, for every 0.01 increase in the NDVI, evapotranspiration in the mountainous area increases by approximately 8.3 mm. However, the fitted linear relationship has a Pearson correlation coefficient of only 0.15, indicating that evapotranspiration is not only influenced by vegetation but also by various climate factors such as rainfall, precipitation patterns, temperature, and radiation.
From 1981 to 2020, there was an increasing trend in evapotranspiration water consumption in the mountainous area of the Luan River Basin, as shown in Figure 8. The average annual evapotranspiration is 443 mm, with a growth rate of 3.47 mm/year. Based on the division of periods of abrupt change in runoff in the mountainous area, the mean evapotranspiration from 1981 to 1994 was 424 mm, and from 1995 to 2001, the mean evapotranspiration was 417 mm, which decreased by 1.5% compared to that in the period from 1981 to 1994. The mean evapotranspiration increased to 487 mm from 2002 to 2020, representing a 15% increase compared to that in the period from 1981 to 1994. In terms of spatial distribution, evapotranspiration in the mountainous area of the Luan River Basin exhibits a similar pattern to that of NDVI distribution, with higher values in the southeast and lower values in the northwest [Figure 9a]. The region with the highest evapotranspiration water consumption is in Watershed III, with average evapotranspiration exceeding 520 mm. From the southeast to the northwest, evapotranspiration decreases gradually, with Watershed I having less than 300 mm of evapotranspiration. The spatial distribution of evapotranspiration change rates [Figure 9b] shows that Watershed III also has the largest rate of change, exceeding 50 mm/year, while the rate of change in Watershed I is less than 10 mm/year. Vegetation restoration mainly occurs in Watersheds II and III of the mountainous area, where the predominant tree species are distributed. Watershed I is characterized by arid and cold conditions, with mostly grassland distribution and less significant vegetation restoration effects.
3.4. The Relationship between the NDVI and Runoff Coefficient
The NDVI values from 1981 to 2020 were sorted in ascending order and divided into four equal levels. The statistical results of runoff coefficients for each level are shown in Figure 10. From the boxplots results, it can be observed that as the NDVI increases, the runoff coefficient gradually decreases, indicating that vegetation restoration is one of the important factors leading to the decline in surface runoff in the mountainous area of the Luan River Basin. For NDVI values ranging from 0.65 to 0.68, the median runoff coefficient is 0.23; for NDVI values ranging from 0.69 to 0.70, the median runoff coefficient is 0.19; for NDVI values ranging from 0.71 to 0.72, the median runoff coefficient is 0.13; and for NDVI values ranging from 0.73 to 0.74, the median runoff coefficient decreases to 0.11.
Compared to the prominent large-scale vegetation restoration projects in the Loess Plateau, the relationship between vegetation and runoff in the Hai River Basin has received relatively less attention. However, the decline in surface water resources in the Hai River Basin is more severe, and water scarcity is more prominent. This research represents one of the approaches to exploring the reasons for the decline in surface water resources in the Hai River Basin. Although mountain vegetation restoration plays an irreplaceable role in water conservation and soil protection, it should be considered in a holistic manner in water use for mountainous vegetation and urban socio-economic water use in the water-stressed Luan River Basin. Reasonable water and soil conservation planning should be developed to achieve the healthy development of the water cycle in the watershed.
4. Discussion
Currently, the “greening” and “drying” of the globe or specific regions due to vegetation restoration have been widely discussed in the academic community. Mankin [33] found that vegetation regulates global-scale runoff by affecting surface evapotranspiration in a global-scale study. In most regions of North America, Europe, and Asia, vegetation growth leads to a significant decrease in available runoff resources. Regional studies in China, such as in the Loess Plateau [23], also show similar phenomena. According to the results of the third water resources assessment of the Hai River Basin, from 2001 to 2016, surface water resources in the Hai River Basin declined by 4.9 billion cubic meters compared with those in the period from 1980 to 2000, with a decline of 87% in mountainous areas. The main reason is the large-scale vegetation restoration measures in mountainous areas [34]. The vegetation restoration in the mountainous areas of the Luan River Basin is highly representative of that in the entire Hai River Basin. Zhao et al. [35] conducted a correlation analysis and concluded that the change in vegetation coverage since 1980 is one of the main factors causing the decrease in the runoff coefficient in the Luan River Basin. This study quantitatively calculates the changes in evapotranspiration in the mountainous areas after vegetation restoration and analyzes the impact on runoff, reaching a consistent conclusion. Currently, there is limited research in the Hai River Basin, but referring to the research conclusions in the neighboring Loess Plateau, the attenuation effect of vegetation restoration on mountainous runoff cannot be ignored. The Beijing–Tianjin–Hebei region in the Hai River Basin is one of the most water-stressed areas in China, and studying the impact of vegetation restoration on mountainous runoff is an important aspect of addressing regional water security.
Due to the lack of measured evapotranspiration data in the mountainous areas of the Luan River Basin, there are uncertainties in the results of this study. Firstly, regarding the model itself, the PML model introduces the concept of surface resistance, and the parameters involved are not based on experimental observation data. The determination of parameter values is influenced by data quality and calibration and validation processes, leading to uncertainties in the simulation results, which is a common issue in evapotranspiration simulation studies. Secondly, in this study, the water balance method was used to calibrate and verify parameters, but it is subject to errors at the annual scale due to variations in annual water storage in mountainous watersheds, which can also affect the results. In the absence of measured data, the calibration and validation processes were conducted in three small watersheds to adapt to different regions and minimize the associated errors. In the future, more field experiments need to be conducted and more refined research should be carried out.
5. Conclusions
This study analyzed the long-term evolution of the vegetation NDVI in the mountainous areas of the Luan River Basin based on remote sensing data. It also constructed the PML model to simulate the water consumption pattern of evapotranspiration in response to vegetation NDVI changes. The main conclusions are as follows:
From 1981 to 2020, the vegetation NDVI in the mountainous areas of the Luan River Basin showed a continuous increasing trend, while the rainfall during the same period did not undergo significant changes. However, the mountainous runoff decreased continuously. The average mountainous runoff during the periods of 1981–1994, 1995–2001, and 2002–2020 was 3.37 billion cubic meters, 3.88 billion cubic meters, and 2.01 billion cubic meters, respectively. From 2001 to 2020, the mountainous runoff decreased by 40% and 48% compared with that in the two previous periods. According to the results of the PML model, the increase in the vegetation NDVI led to an annual increase in the rate of evapotranspiration water consumption in the mountainous areas of 3.47 mm/year. The average evapotranspiration in the mountainous areas was 424 mm from 1981 to 1985, and it increased to 487 mm from 2015 to 2020, representing a 15% increase.
With the increase in the NDVI, the runoff coefficient of the mountainous vegetation gradually decreased. When the NDVI reached the range of 0.65–0.68, the median runoff coefficient was 0.23. When the NDVI increased to the range of 0.73–0.74, the median runoff coefficient decreased to 0.11. On average, with every 0.01 increase in the NDVI, the evapotranspiration in the mountainous areas increased by approximately 8.3 mm.
This study mainly focused on the analysis of the influence of vegetation changes on evapotranspiration in the mountainous areas based on annual-scale water balance. It did not consider the soil storage capacity and the runoff generation process in the mountainous areas. Therefore, the next important task is to construct a hydrological model for hilly areas that takes into account the factors of vegetation change and conduct research at a more refined level to investigate the causes of runoff changes.
Author Contributions
Methodology, L.W.; Validation, P.D.; Resources, J.C.; Data curation, P.D.; Writing—original draft, Z.Z.; Funding acquisition, Q.W. All authors have read and agreed to the published version of the manuscript.
Funding
The research was funded by the National Key Research and Development program of China (2021YFC3200204), the Key Research and Development Plan Project of Hebei Province (22324202D), the National Natural Science Foundation of China (52025093), and the Water Conservancy Research Project of Hebei Province (Ji water Research 2022-01, 2023-72).
Data Availability Statement
Data are contained within the article.
Conflicts of Interest
Author Lichao Wang was employed by the company Hebei Water Resources Planning and Design Institute Co., Ltd. The remaining authors declare that the research was conducted in the absence of any commercial or financial relationships that could be construed as a potential conflict of interest.
References
- Zhong, Q.; Ma, J.; Zhao, B.; Wang, X.; Zong, J.; Xiao, X. Assessing Spatial-Temporal Dynamics of Urban Expansion, Vegetation Greenness and Photosynthesis in Megacity Shanghai, China during 2000–2016. Remote Sens. Environ. 2019, 233, 111374. [Google Scholar] [CrossRef]
- Feng, X.; Fu, B.; Zhang, Y.; Pan, N.; Zeng, Z.; Tian, H.; Lyu, Y.; Chen, Y.; Ciais, P.; Wang, Y. Recent Leveling off of Vegetation Greenness and Primary Production Reveals the Increasing Soil Water Limitations on the Greening Earth. Sci. Bull. 2021, 66, 1462–1471. [Google Scholar] [CrossRef]
- Lamchin, M.; Wang, S.W.; Lim, C.-H.; Ochir, A.; Pavel, U.; Gebru, B.M.; Choi, Y.; Jeon, S.W.; Lee, W.-K. Understanding Global Spatio-Temporal Trends and the Relationship between Vegetation Greenness and Climate Factors by Land Cover during 1982–2014. Glob. Ecol. Conserv. 2020, 24, e01299. [Google Scholar] [CrossRef]
- Deng, Y.; Wang, S.; Bai, X.; Luo, G.; Wu, L.; Chen, F.; Wang, J.; Li, C.; Yang, Y.; Hu, Z. Vegetation Greening Intensified Soil Drying in Some Semi-Arid and Arid Areas of the World. Agric. For. Meteorol. 2020, 292, 108103. [Google Scholar] [CrossRef]
- Zhang, X.; Cao, Q.; Chen, H.; Quan, Q.; Li, C.; Dong, J.; Chang, M.; Yan, S.; Liu, J. Effect of Vegetation Carryover and Climate Variability on the Seasonal Growth of Vegetation in the Upper and Middle Reaches of the Yellow River Basin. Remote Sens. 2022, 14, 5011. [Google Scholar] [CrossRef]
- Feng, X.; Fu, B.; Piao, S.; Wang, S.; Ciais, P.; Zeng, Z.; Lü, Y.; Zeng, Y.; Li, Y.; Jiang, X. Revegetation in China’s Loess Plateau Is Approaching Sustainable Water Resource Limits. Nat. Clim. Chang. 2016, 6, 1019–1022. [Google Scholar] [CrossRef]
- Du, Y.; Bao, A.; Zhang, T.; Ding, W. Quantifying the Impacts of Climate Change and Human Activities on Seasonal Runoff in the Yongding River Basin. Ecol. Indic. 2023, 154, 110839. [Google Scholar] [CrossRef]
- Yang, W.; Long, D.; Bai, P. Impacts of Future Land Cover and Climate Changes on Runoff in the Mostly Afforested River Basin in North China. J. Hydrol. 2019, 570, 201–219. [Google Scholar] [CrossRef]
- Geng, X.; Zhou, X.; Yin, G.; Hao, F.; Zhang, X.; Hao, Z.; Singh, V.P.; Fu, Y.H. Extended Growing Season Reduced River Runoff in Luanhe River Basin. J. Hydrol. 2020, 582, 124538. [Google Scholar] [CrossRef]
- Li, J. Evaluation of Soil and Water Conservation Function in Dingxi City, Upper Yellow River Basin. Water 2022, 14, 2919. [Google Scholar] [CrossRef]
- Wang, S.; Xu, C.; Zhang, W.; Chen, H.; Zhang, B. Human-Induced Water Loss from Closed Inland Lakes: Hydrological Simulations in China’s Daihai Lake. J. Hydrol. 2022, 607, 127552. [Google Scholar] [CrossRef]
- Ren, Z.; Tian, Z.; Wei, H.; Liu, Y.; Yu, Y. Spatiotemporal Evolution and Driving Mechanisms of Vegetation in the Yellow River Basin, China during 2000–2020. Ecol. Indic. 2022, 138, 108832. [Google Scholar] [CrossRef]
- Yi, H.; Wang, Y.; Lou, Y.; Han, X. Effects of Vegetation Restoration on the Hydrological Regimes of the Chinese Loess Plateau: A Comparative Analysis of Forested and Less-Forested Catchments. Forests 2023, 14, 1199. [Google Scholar] [CrossRef]
- Zhang, L.; Potter, N.; Hickel, K.Y.; Shao, Q. Water Balance Modeling over Variable Time Scales Based on the Budyko Framework-Model Development and Testing. J. Hydrol. 2008, 360, 117–131. [Google Scholar] [CrossRef]
- Jiang, C.; Guo, H.; Wei, Y.; Yang, Z.; Wang, X.; Wen, M.; Yang, L.; Zhao, L.; Zhang, H.; Zhou, P. Ecological Restoration Is Not Sufficient for Reconciling the Trade-off between Soil Retention and Water Yield: A Contrasting Study from Catchment Governance Perspective. Sci. Total Environ. 2021, 754, 142139. [Google Scholar] [CrossRef]
- Li, X.; Li, C.; Wang, X.; Liu, Q.; Yi, Y.; Zhang, X. A Developed Method of Water Pollution Control Based on Environmental Capacity and Environmental Flow in Luanhe River Basin. Water 2022, 14, 730. [Google Scholar] [CrossRef]
- Hayati, E.; Abdi, E.; Saravi, M.M.; Nieber, J.L.; Majnounian, B.; Chirico, G.B. How Deep Can Forest Vegetation Cover Extend Their Hydrological Reinforcing Contribution? Hydrol. Process. 2018, 32, 2570–2583. [Google Scholar] [CrossRef]
- Piao, S.; Wang, X.; Park, T. Characteristics, Drivers and Feedbacks of Global Greening. Nat. Rev. Earth Environ. 2020, 1, 14–27. [Google Scholar] [CrossRef]
- Li, L.; Song, X.; Zhao, X.; Meng, P.; Feng, D.; Fu, C.; Wang, L. Modeling the Impact of Climate Change and Vegetation Conversion on Water Budget: A Case Study in the Loess Plateau of China-ScienceDirect. J. Hydrol. Reg. Stud. 2022, 40, 101040. [Google Scholar] [CrossRef]
- Qiankun, G.; Zhaowei, D.; Wei, Q.; Wenhong, C.; Wen, L.; Xiaomei, X.; Zhe, Y. Changes in Sediment Load in a Typical Watershed in the Tableland and Gully Region of the Loess Plateau, China. Catena 2019, 182, 104132. [Google Scholar] [CrossRef]
- Liang, W.; Bai, D.; Wang, F.; Fu, B.; Yan, J.; Wang, S.; Yang, Y.; Long, D.; Feng, M. Quantifying the Impacts of Climate Change and Ecological Restoration on Streamflow Changes Based on a Budyko Hydrological Model in China’s Loess Plateau. Water Resour. Res. 2015, 51, 16589. [Google Scholar] [CrossRef]
- Jiao, Y.; Lei, H.M.; Yang, D.W. Attribution of discharge changes over Wuding River watershed using a distributed eco-hydrological model. J. Hydroelectr. Eng. 2017, 7, 34–44. (In Chinese) [Google Scholar]
- Zhang, B.Q.; Shao, R.; Zhao, X.N. Effects of Large-scale Vegetation Restoration on Eco-hydrological Processes Over the LoessPlateau, China. J. Basic Sci. Eng. 2020, 28, 594–606. (In Chinese) [Google Scholar]
- Mu, X.M.; Gu, C.J.; Sun, W. Preliminary Assessment Effect of Vegetation Restoration on Runoff Generation Pattern of the Loess Plateau. Yellow River 2019, 41, 31–39. (In Chinese) [Google Scholar]
- Han, K.W.; Shi, K.B.; Yan, X.J.; Ouyang, J.; Lei, P.; Hao, G.C. Comparison of Evaporation Estimation Methods for Water Surface under Floating Coverage in Arid Areas. Agric. Water Manag. 2022, 264, 107534. [Google Scholar] [CrossRef]
- Lu, B.; Lei, H.; Yang, D.; Fu, X. Separating the Effects of Revegetation and Sediment-Trapping Dams Construction on Runoff and Its Application to a Semi-Arid Watershed of the Loess Plateau. Ecol. Eng. 2020, 158, 106043. [Google Scholar] [CrossRef]
- Bao, Z.; Zhang, J.-Y.; Wang, G.; Chen, Q.; Guan, T.; Yan, X.; Liu, C.; Liu, J.; Wang, J. The Impact of Climate Variability and Land Use/Cover Change on the Water Balance in the Middle Yellow River Basin, China. J. Hydrol. 2019, 577, 123942. [Google Scholar] [CrossRef]
- Shao, S.; Yang, Y. Effects of Precipitation and Land Use/Cover Changes on the Spatio-Temporal Distribution of the Water Yield in the Huang-Huai-Hai Basin, China. Environ. Earth Sci. 2021, 80, 812. [Google Scholar] [CrossRef]
- Leuning, R.; Zhang, Y.Q.; Rajaud, A.; Cleugh, H.; Tu, K. A Simple Surface Conductance Model to Estimate Regional Evaporation Using MODIS Leaf Area Index and the Penman-Monteith Equation. Water Resour. Res. 2008, 44, 652–655. [Google Scholar] [CrossRef]
- Monteith, J.L. Evaporation and environment. The state and movement of water in living organisms. Symp. Soc. Exp. Biol. 1964, 19, 205–234. [Google Scholar]
- Duan, H.; Zhao, H.; Li, Q.; Xu, H.; Han, C. Estimation of Evapotranspiration Based on a Modified Penman–Monteith–Leuning Model Using Surface and Root Watershed Soil Moisture. Water 2023, 15, 1418. [Google Scholar] [CrossRef]
- Zhang, Y.Q.; Leuning, R.; Hutley, L.B.; Beringer, J.; Walker, J.P. Using Long-Term Water Balances to Parameterize Surface Conductances and Calculate Evaporation at 0.05° Spatial Resolution. Water Resour. Res. 2010, 46, 5512. [Google Scholar] [CrossRef]
- Mankin, J.S.; Seager, R.; Smerdon, J.E.; Cook, B.I.; Williams, A.P. Mid-Latitude Freshwater Availability Reduced by Projected Vegetation Responses to Climate Change. Nat. Geosci. 2019, 12, 983–988. [Google Scholar] [CrossRef]
- Wang, Q.; Jiang, S.; Zhai, J.; He, G.; Zhao, Y.; Zhu, Y.; He, X.; Li, H.; Wang, L.; He, F.; et al. Effects of Vegetation Restoration on Evapotranspiration Water Consumption in Mountainous Areas and Assessment of Its Remaining Restoration Space. J. Hydrol. 2022, 605, 127259. [Google Scholar]
- Zhang, T.; Wang, L.; Li, J.; Feng, P. Prediction of the Soil Water Content in the Luanhe River Basin Based on CMIP6. J. Clean. Prod. 2023, 425, 138852. [Google Scholar] [CrossRef]
Figure 1.
DEM and river distribution in mountainous area of Luan River Basin.

Figure 2.
Parameter calibration and verification of small watershed.
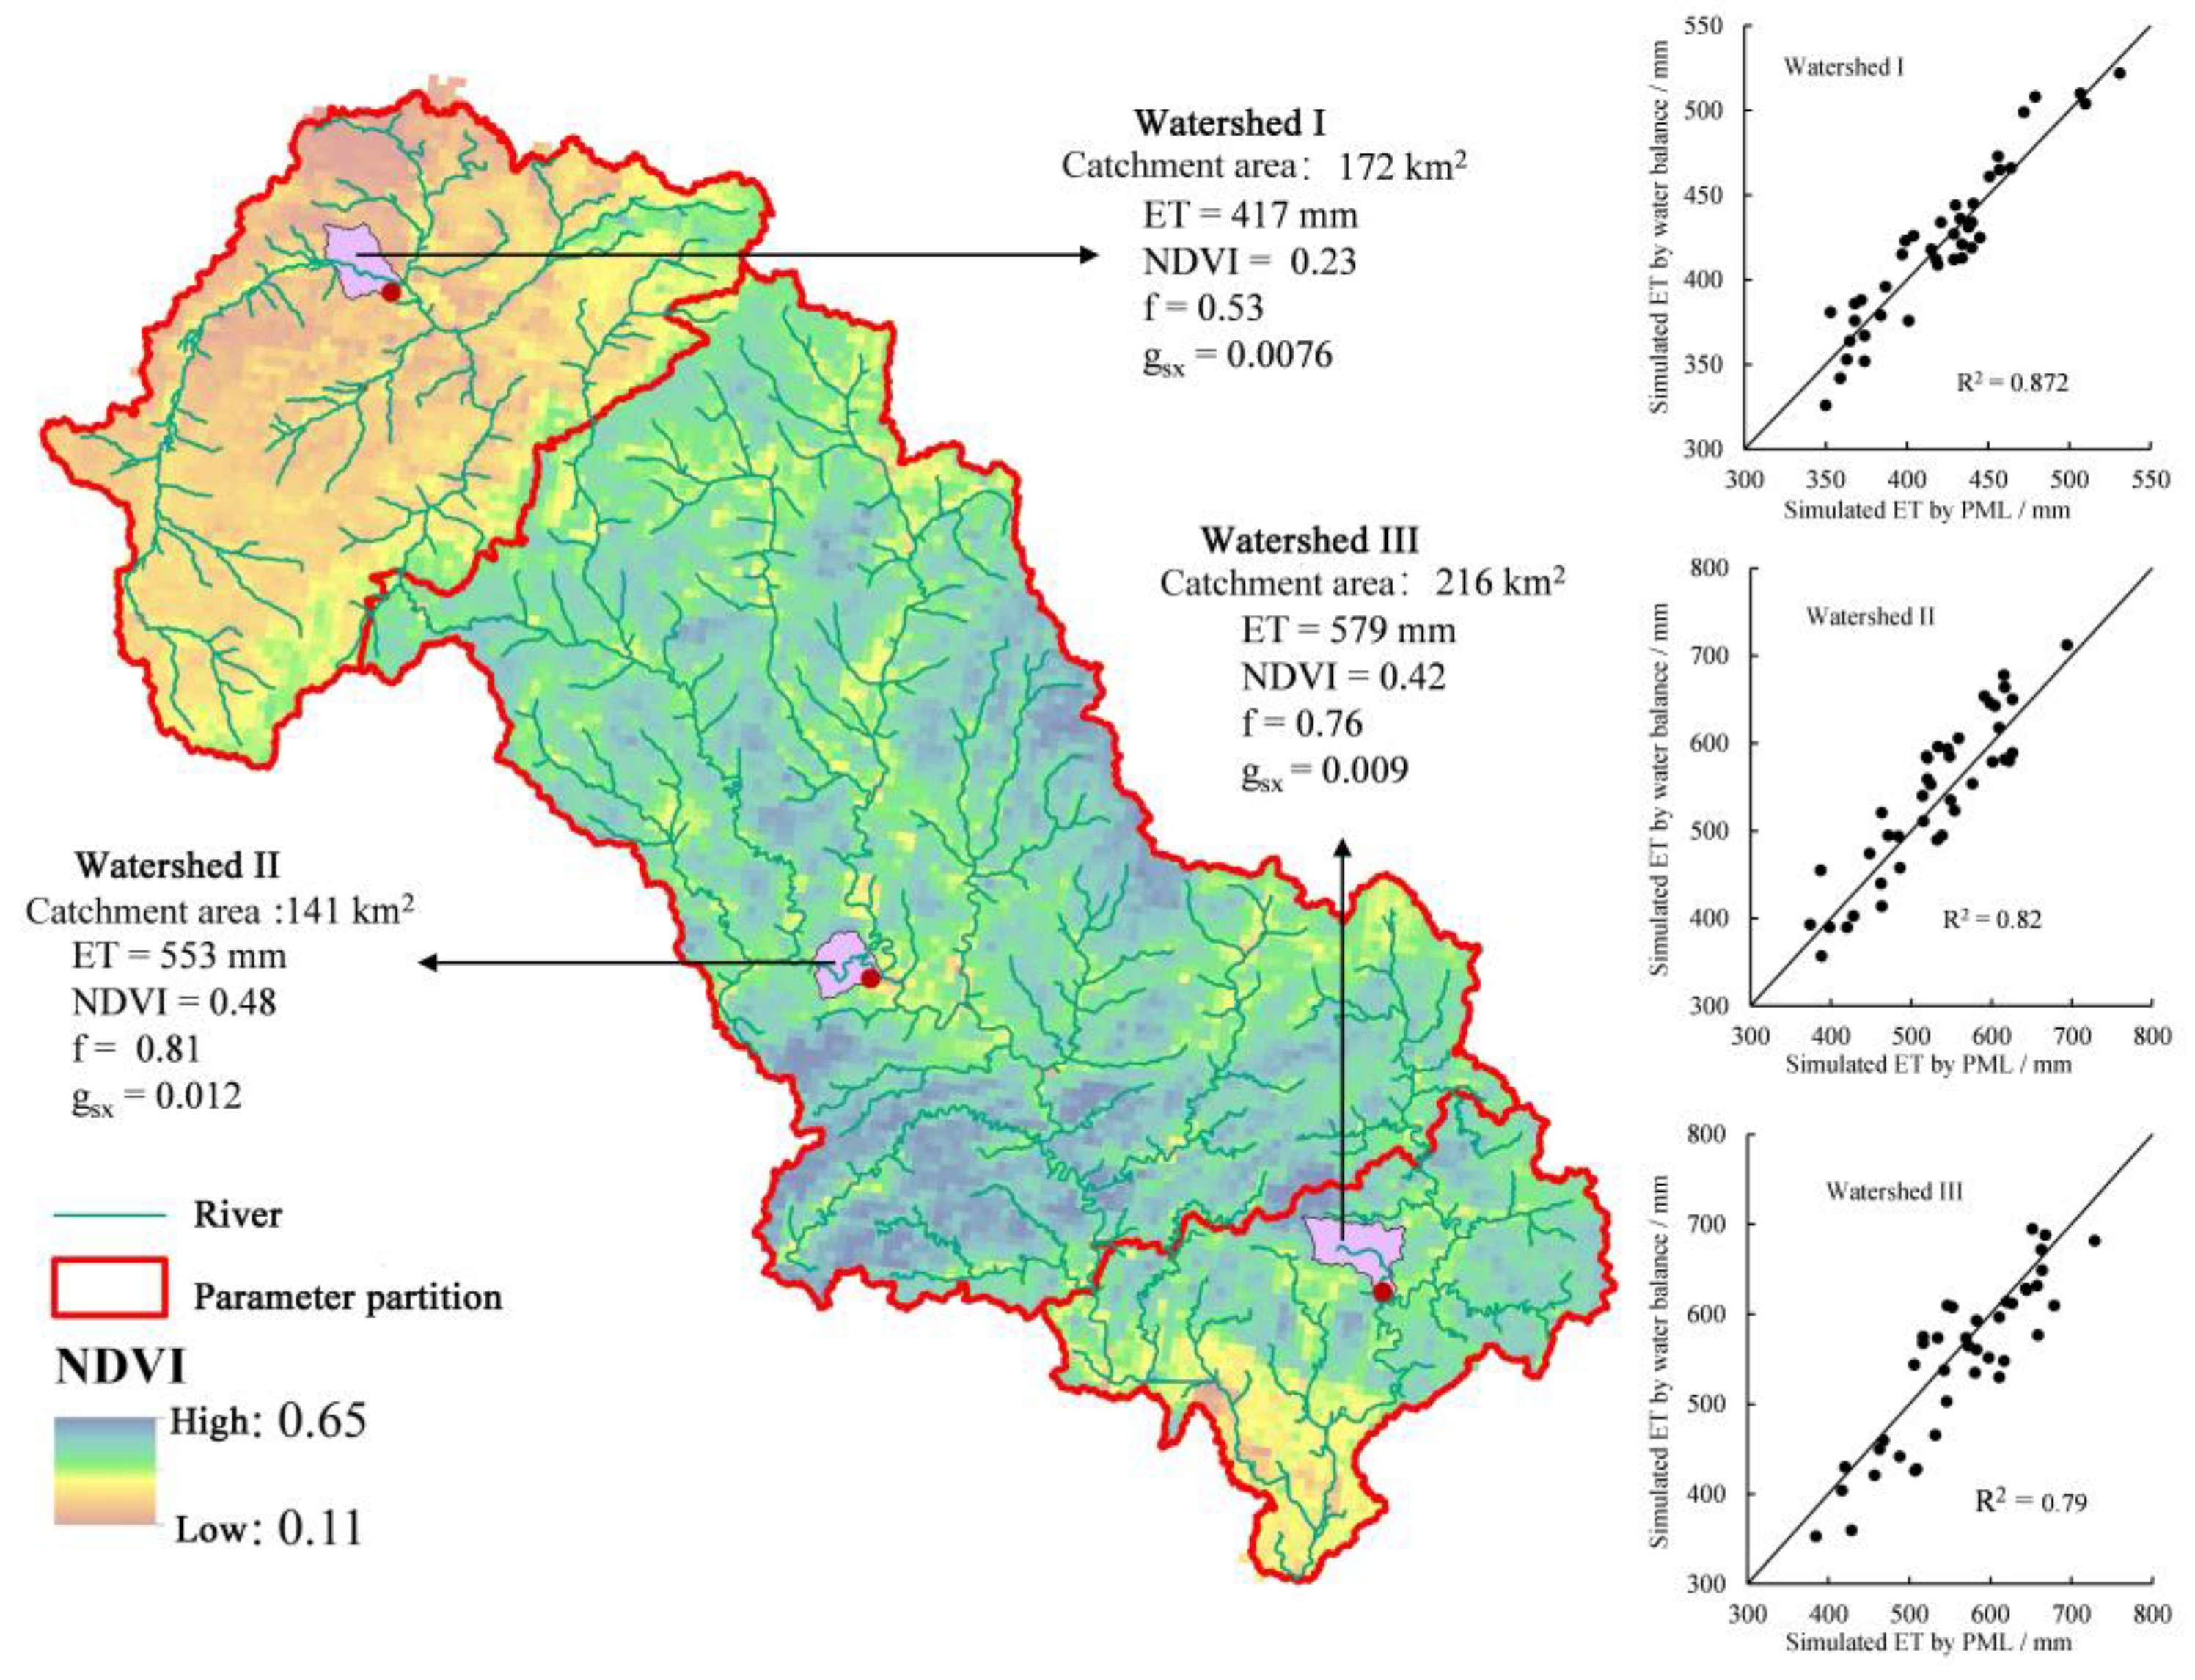
Figure 3.
Evolution of runoff in Luan mountain area from 1981 to 2000.

Figure 4.
Evolution of runoff coefficient and rainfall in Luan River mountain area.

Figure 5.
Evolution of the vegetation NDVI in the mountain area of the Luan River Basin from 1981 to 2000.
Figure 5.
Evolution of the vegetation NDVI in the mountain area of the Luan River Basin from 1981 to 2000.

Figure 6.
Spatial distribution of the annual mean and slope of the vegetation NDVI in the mountain area of the Luan River Basin. (a) The multi-annual mean NDVI of the mountain area of the Luan River Basin. (b) Slope of the NDVI change in the mountain area of the Luan River Basin.
Figure 6.
Spatial distribution of the annual mean and slope of the vegetation NDVI in the mountain area of the Luan River Basin. (a) The multi-annual mean NDVI of the mountain area of the Luan River Basin. (b) Slope of the NDVI change in the mountain area of the Luan River Basin.
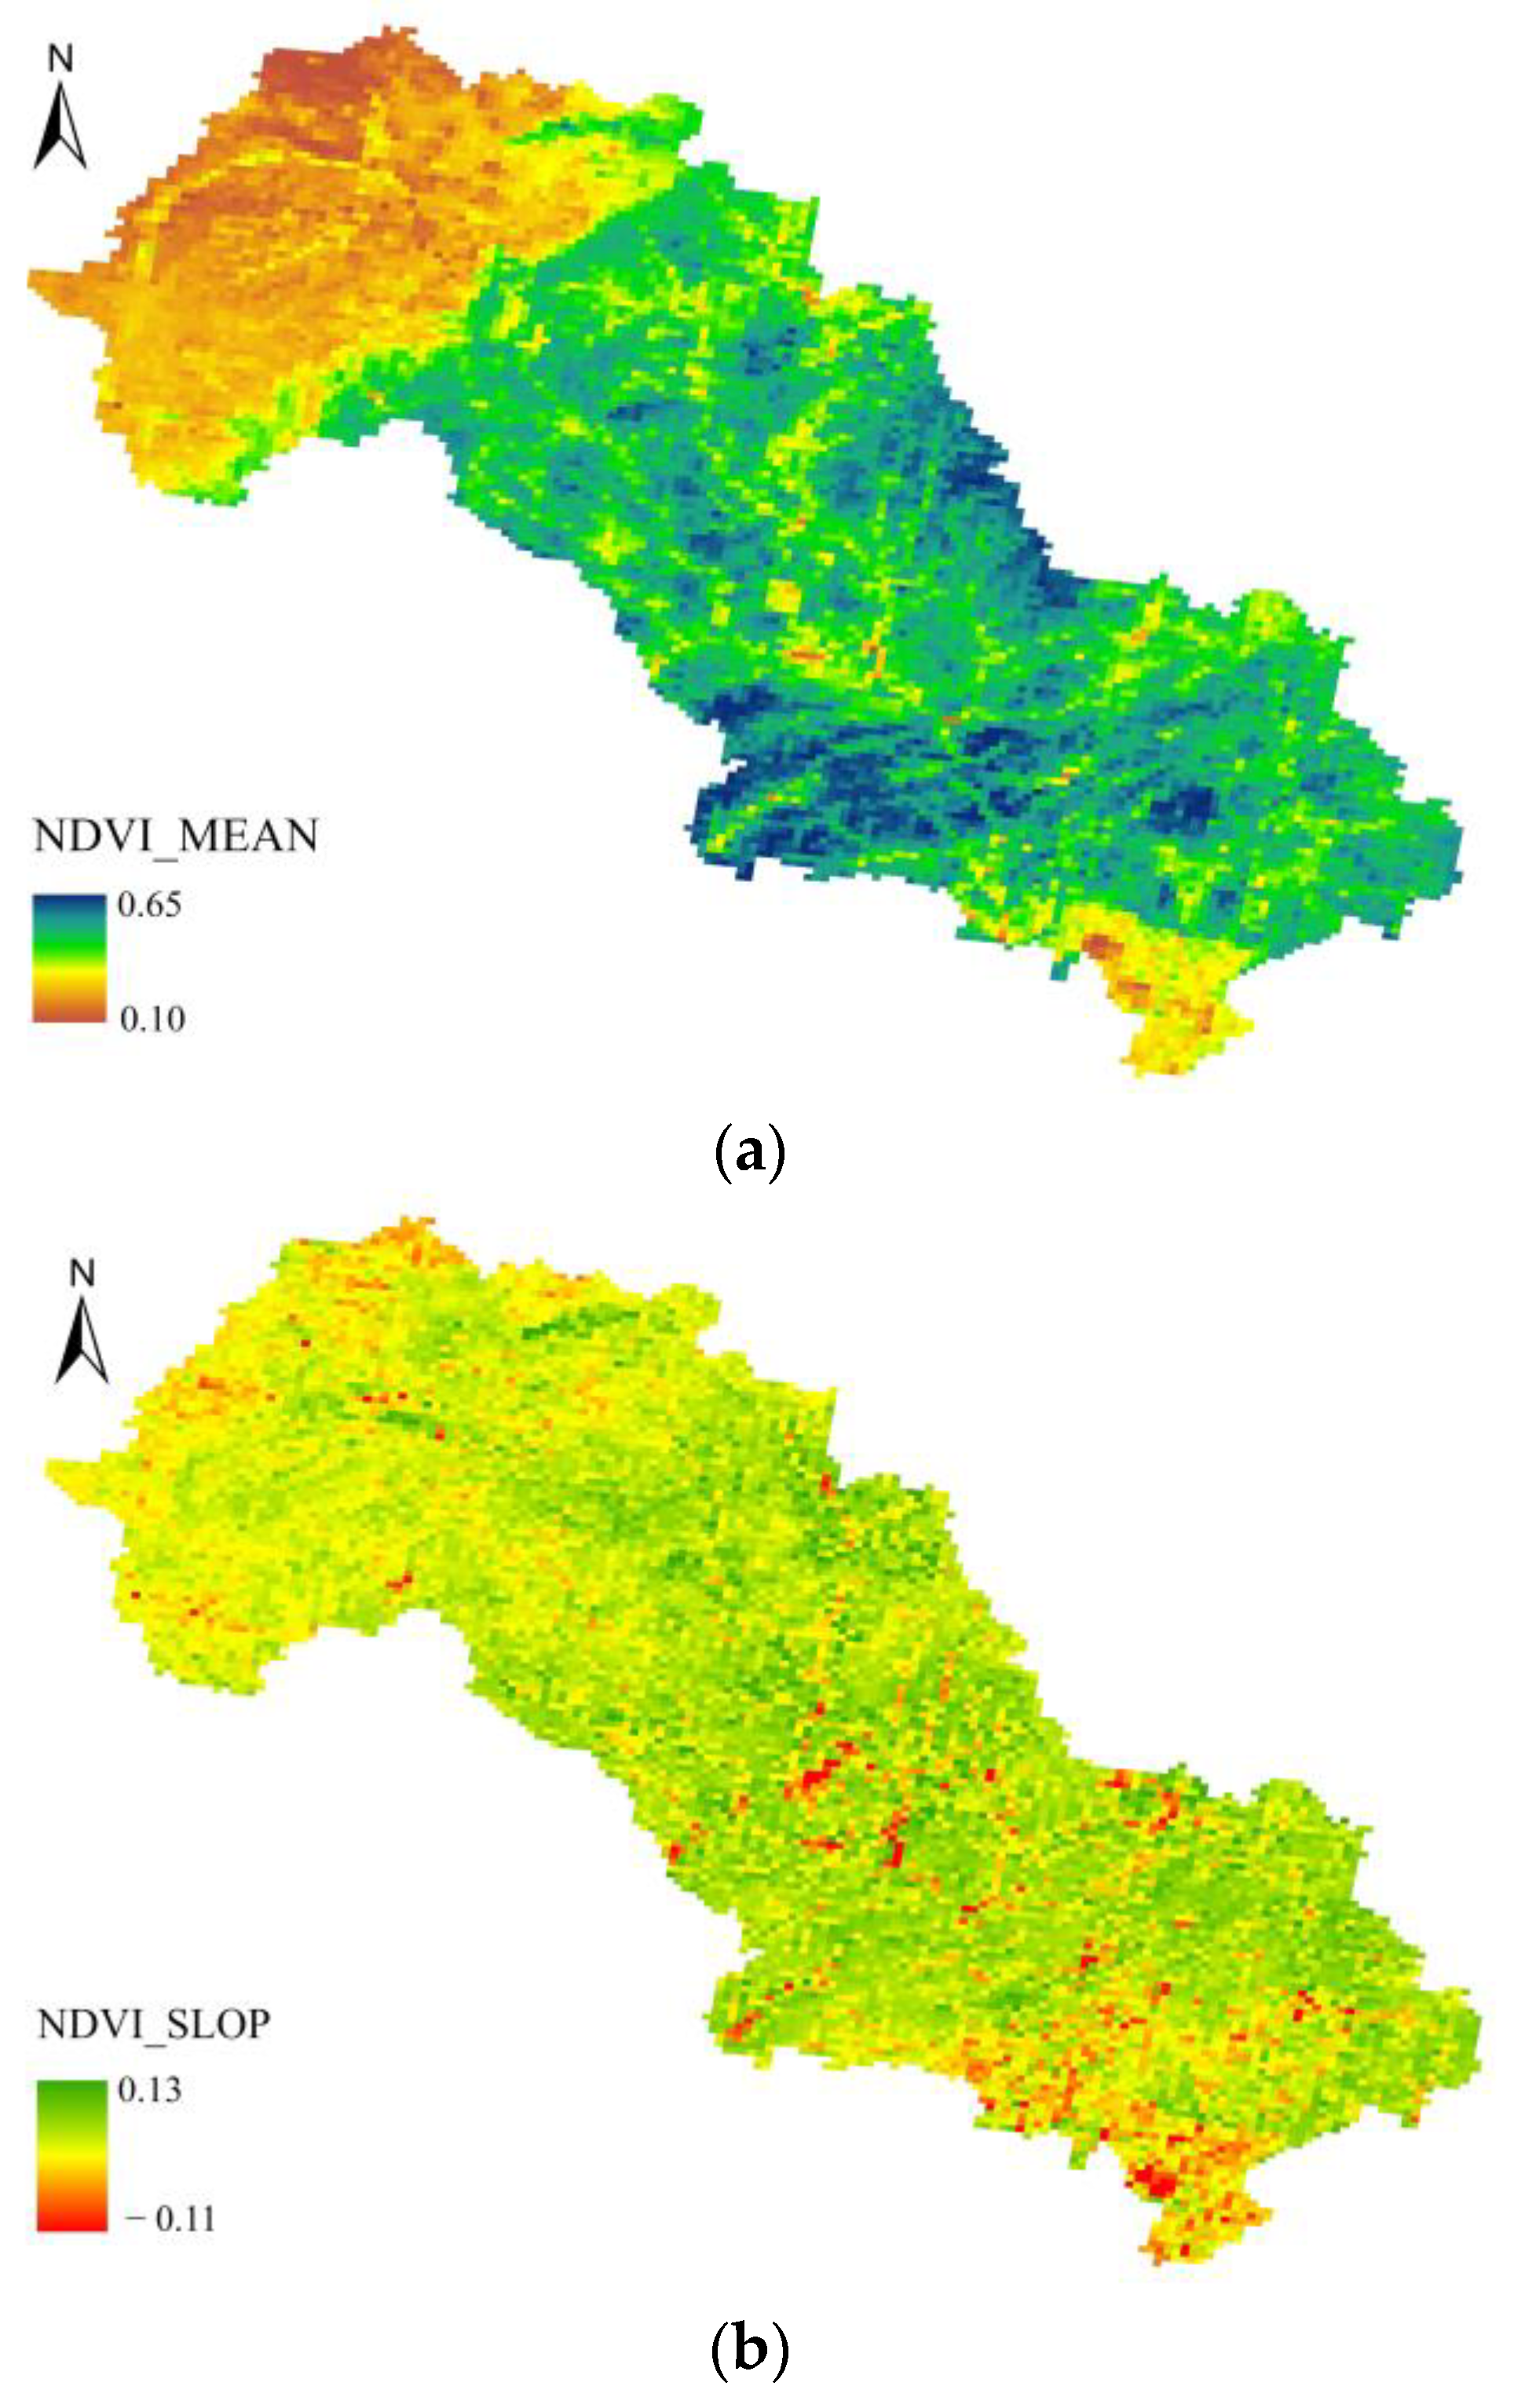
Figure 7.
Comparison and verification of evapotranspiration simulation value and water balance value, and its relationship with the NDVI. (a) Evapotranspiration verification in the entire mountainous area of the Luan River Basin. (b) The relationship between the NDVI and ET.
Figure 7.
Comparison and verification of evapotranspiration simulation value and water balance value, and its relationship with the NDVI. (a) Evapotranspiration verification in the entire mountainous area of the Luan River Basin. (b) The relationship between the NDVI and ET.

Figure 8.
Evolution of evaporative water consumption in the mountain area of the Luan River Basin from 1980 to 2020.
Figure 8.
Evolution of evaporative water consumption in the mountain area of the Luan River Basin from 1980 to 2020.

Figure 9.
Spatial distribution of ET mean and change slope in mountain area of Luan River Basin. (a) Annual mean of evapotranspiration in mountain area of Luan River Basin. (b) Variation slope of evapotranspiration in mountain area of Luan River Basin.
Figure 9.
Spatial distribution of ET mean and change slope in mountain area of Luan River Basin. (a) Annual mean of evapotranspiration in mountain area of Luan River Basin. (b) Variation slope of evapotranspiration in mountain area of Luan River Basin.
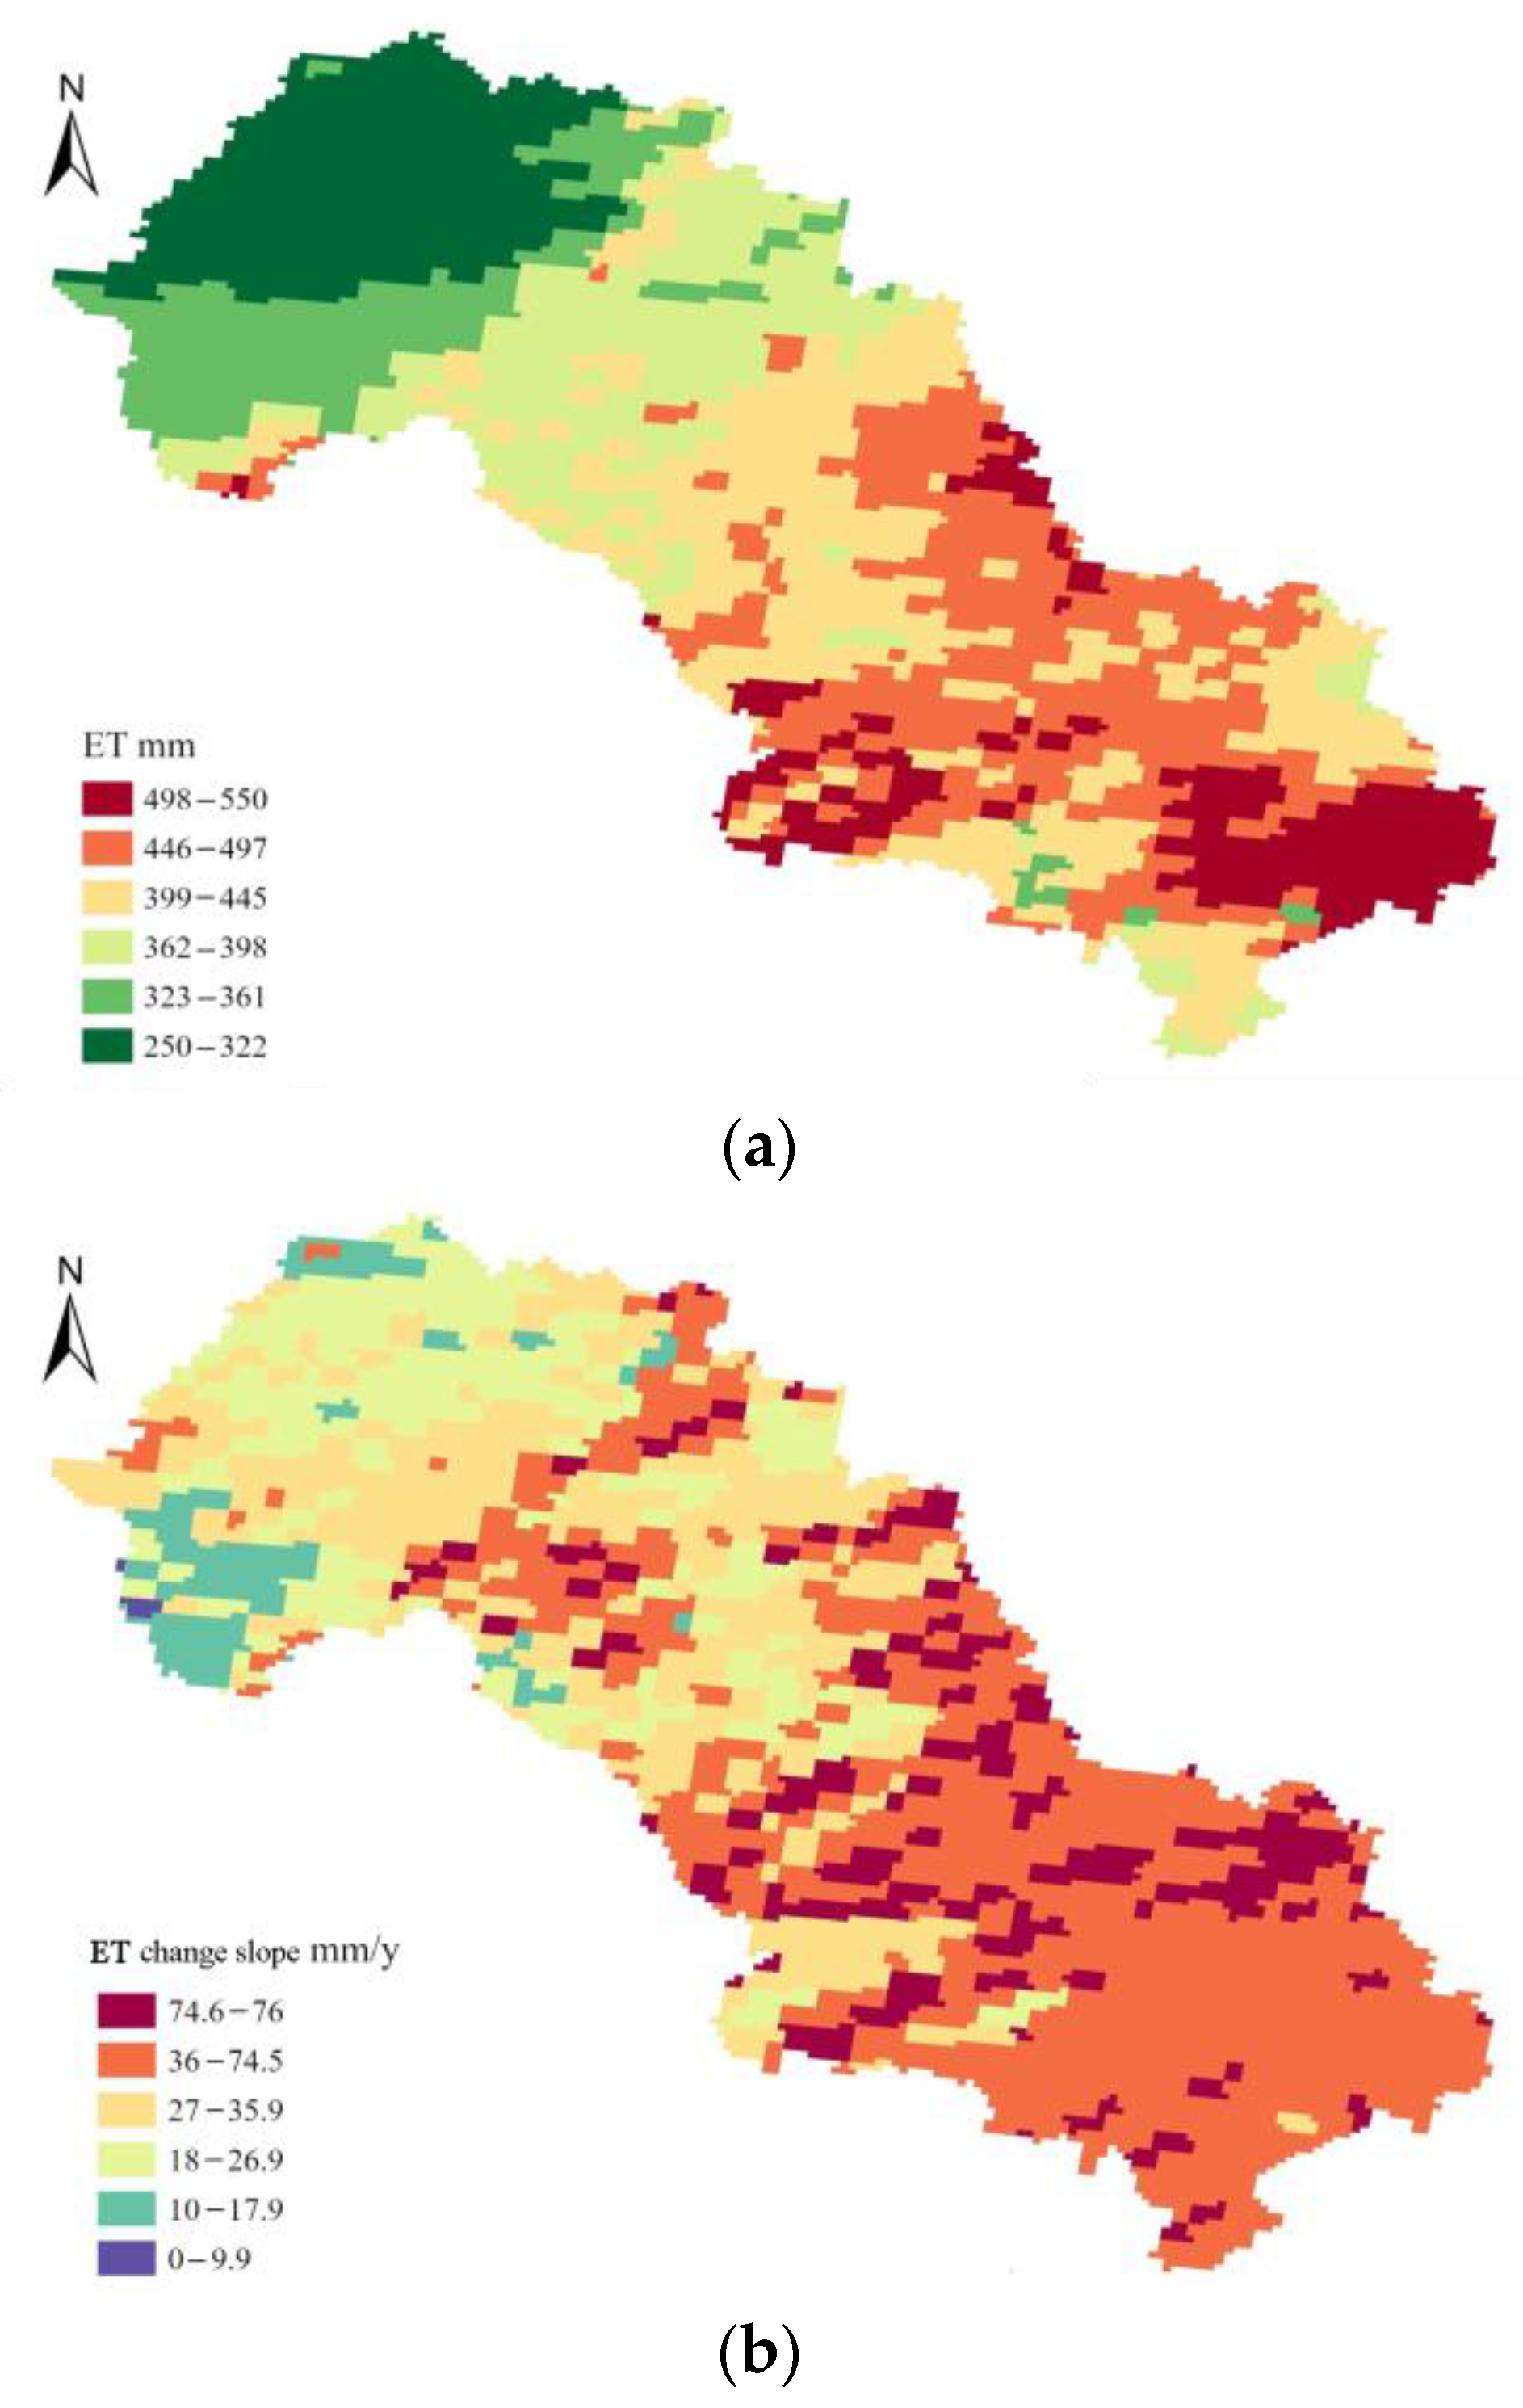
Figure 10.
Relationship between NDVI and runoff coefficient.

Disclaimer/Publisher’s Note: The statements, opinions and data contained in all publications are solely those of the individual author(s) and contributor(s) and not of MDPI and/or the editor(s). MDPI and/or the editor(s) disclaim responsibility for any injury to people or property resulting from any ideas, methods, instructions or products referred to in the content. |
© 2024 by the authors. Licensee MDPI, Basel, Switzerland. This article is an open access article distributed under the terms and conditions of the Creative Commons Attribution (CC BY) license (https://creativecommons.org/licenses/by/4.0/).
Share and Cite
MDPI and ACS Style
Zhang, Z.; Wang, L.; Dou, P.; Wang, Q.; Cao, J. Study on the Influence of Vegetation Restoration on Evapotranspiration in Mountainous Areas of the Luan River Basin. Water 2024, 16, 1143. https://doi.org/10.3390/w16081143
AMA Style
Zhang Z, Wang L, Dou P, Wang Q, Cao J. Study on the Influence of Vegetation Restoration on Evapotranspiration in Mountainous Areas of the Luan River Basin. Water. 2024; 16(8):1143. https://doi.org/10.3390/w16081143
Chicago/Turabian StyleZhang, Ziyuan, Lichao Wang, Peng Dou, Qingming Wang, and Jiansheng Cao. 2024. "Study on the Influence of Vegetation Restoration on Evapotranspiration in Mountainous Areas of the Luan River Basin" Water 16, no. 8: 1143. https://doi.org/10.3390/w16081143
Note that from the first issue of 2016, this journal uses article numbers instead of page numbers. See further details here.