
Tackling the Phylogeny of Lampreys—Insight from the Croatia’s Danube Basin
Faculty of Science, University of Zagreb, Rooseveltov trg 6, 10000 Zagreb, Croatia
*
Author to whom correspondence should be addressed.
Water 2024, 16(8), 1153; https://doi.org/10.3390/w16081153
Submission received: 15 March 2024
/
Revised: 4 April 2024
/
Accepted: 9 April 2024
/
Published: 19 April 2024
(This article belongs to the Special Issue Freshwater Ecosystems—Biodiversity and Protection)
Abstract
:This research addresses the pressing issue of protecting endangered lamprey species in Croatia, a crucial element in preserving biodiversity, particularly in the face of increasing human-induced impacts on natural ecosystems due to global warming. Lampreys, a group of vertebrates with an ancient lineage, are not fully understood taxonomically, posing a challenge to conservation efforts. In the Danube and Adriatic basins of Croatia, where lampreys are found, the lack of modern molecular methods and analyses has hindered an accurate determination of species numbers. This study aimed to bridge this knowledge gap by assessing the genetic diversity and structure of identified lamprey species and lineages in Croatia using the gene for cytochrome b. The research revealed four distinct lineages within the species Eudontomyzon vladykovi Oliva and Zanandrea, 1959 and confirmed the presence of the species Eudontomyzon danfordi Regan, 1911 in Croatia. Genetic diversity and differentiation tests, coupled with molecular diagnostic analyses, indicated moderate to high levels of genetic diversity within and between the identified species and lineages, emphasizing the deep structuring within Eudontomyzon vladykovi species. These results highlight the significance of understanding lamprey taxonomy and genetic diversity for effective conservation. The study provides important insights into the intricate relationships and conservation needs of lampreys, and provides a basis for future discussions involving additional genetic markers. By gaining a comprehensive understanding of the taxonomy, ecology, and genetic diversity of lampreys, we can ensure their conservation and that of associated ecosystems.
1. Introduction
The Croatian Danube basin is home to a remarkable diversity of fish species, a result of the interplay of historical events and geological processes. The Danube River and its tributaries, which cover a large part of the country, are home to a wide variety of species as a result of biogeographical separation and evolutionary processes. Geological forces, including the uplift of the Dinarides, tectonic activity, and the formation of the Central Paratethys Basin, have significantly influenced the area. These events, coupled with the effects of glacial and interglacial periods, have facilitated the creation of harbors for fish populations during glacial periods and their subsequent dispersal to rivers in central and northern Europe after the last glaciation [1]. With its distinctive geomorphological and hydrological features, the Danube basin and its tributaries are emerging as a hotspot of European ichthyofaunal diversity, housing an impressive 81 species of freshwater fish species (64 native and 17 invasive species) [2,3,4,5].
Among this great diversity of fish in the Croatian Danube basin, a fascinating group of animals, the lampreys, can be found, either buried in the substrate or swimming freely in the water. Lampreys are elongated and scaleless organisms widely distributed in temperate waters, with the exception of tropical and polar regions [6]. Their fascinating life cycle has attracted the interest of scientists [7,8,9,10,11,12] and varies among species and is influenced by diet and ecological conditions. During the larval stage, known as ammocoetes, lampreys burrow in the sand for several years before metamorphosing and growing, making them ecosystem engineers [13]. Some species migrate to the sea to feed or reproduce, while others remain in freshwater. During the trophic phase, lampreys feed as parasites, and in some cases, this phase is absent. These peculiar life cycles and behaviors explain why they are rarely caught in their natural habitats and why they are so little studied. Lampreys belong to the Agnatha class, which means that they lack jaws and have a permanently open mouth [6,14,15]. Despite belonging to a distinct superclass (Agnatha) that has not undergone significant anatomical change in the past 360 million years [16], lampreys are often lumped together with fishes (superclass: Gnathostomata) in the literature.
The reported number of lamprey species in Croatia varies in different publications from the last decade and earlier [3,4,17]. Globally, the Petromyzontidae family comprises 10 genera and 40 described species [18], and 13 species are found in Europe, with one species now extinct [17]. Earlier field studies in Croatia identified five species, including Lethenteron zanandreai (Vladykov, 1955), Petromyzon marinus Linnaeus, 1758, Eudontomyzon danfordi Regan, 1911, Eudontomyzon mariae (Berg, 1931), and Lampetra planeri (Bloch, 1784) [4]. However, a recent list of Croatian freshwater ichthyofauna only includes three species: Eudontomyzon vladykovi Oliva and Zanandrea, 1959, Lampetra soljani Tutman, Freyhof, Duli, Glamuzina, and Geiger, 2017, and Petromyzon marinus Linnaeus, 1758 [3]. The difference in the number of species is explained by incorrect determination, the frequent use of synonyms in the literature, and the lack of molecular genetic analysis [3]. The identification of lamprey is usually based on morphological observations, such as the position of the dorsal fins, the relative position of the cloaca and dorsal fins, the position of the eyes, the structure of the oral funnel, the teeth and laminae, and the number of myomers [17,18,19]. As morphlogical determinations are not always accurate and lampreys lack countable structures such as fin rays, shells, or ossified structures [18,20], it is necessary to use molecular and genetic methods in order to resolve their taxonomy. To solve the problem, modern genetic techniques, molecular analyses, and phylogenetic reconstructions are necessary but have not yet been carried out for lampreys in Croatia.
The purpose of this research is to provide important information on the genetic diversity and distribution of lamprey species in the Danube basin in Croatia, which will help in their conservation and management. Furthermore, the results of this study will contribute to a better understanding of the evolutionary history and biogeography of lampreys in Europe and the Black Sea basin. Owing to the combination of methods applied to the Petromyzontidae family, the results of the analyses conducted will finally reveal some of the secrets hidden in the genetic material of these secretive organisms and provide accurate data on the phylogeny of lampreys in the study area.
2. Materials and Methods
2.1. Sampling
Individuals of adult lampreys and ammocoetes were sampled from 20 streams (a total of 39 different localities along 13 different river catchments): Bednja, Mura, Drava, Voćinska river, Krapina, Sutla, Mrežnica, Dobra, Kupa, Kupčina, Korana, Radonja, Una, Glina, Ilova, Česma, Sava, Danube, Orljava, and Bosna (Figure 1). A total of 103 individuals were caught using the electrofishing method or randomly by hand (Table 1). A small part of the dorsal fin was cut off with scissors, and the individuals were released. The collected fin samples were stored in tubes filled with 96% ethanol, together with information on the location of the catch. The samples were stored in a freezer at −20 °C (to prevent degradation of the DNA sample) until further analysis.
2.2. Laboratory Protocols
Laboratory procedures included DNA isolation, gene amplification by polymerase chain reaction, and verification of amplification by agarose gel electrophoresis. DNA isolation was conducted using a DNeasy Blood & Tissue chemical kit according to the protocol of the kit manufacturer, QIAGEN (Amsterdam, Netherlands). The protocol for gene amplification by polymerase chain reaction was optimized to obtain the best products, and PCR conditions and primers are listed in Table 2. PCR products obtained and verified by electrophoresis were sent to the Macrogen Service Centre for sequencing using the same primers that were used for PCR amplification.
The molecular marker chosen for analysis in this study was the cytochrome b (cyt b) gene. As part of mitochondrial DNA and also a coding gene, its mutation rate is usually lower than other gene markers, making it suitable for phylogenetic analyses at species and supraspecific levels. It was chosen because it has shown the best performance and yielded the most reliable results in previous studies of phylogenetic structure, relationships, and taxonomic research [2,21], particularly in recovering phylogenetic relationships among closely related freshwater fish taxa [22,23].
2.3. Data Analyses
2.3.1. Sequence Alignment
Sequences were aligned using the BioEdit Sequence Alignment Editor version 7.2.5 [24] and compared to previously published sequences. Visual checks were performed on chromatograms and alignments to ensure accuracy.
2.3.2. Neutrality Test and Analyses of Population Genetic Diversity and Polymorphism
Genetic diversity within the identified lineages and species was assessed by estimating measures of DNA sequence polymorphisms using the DnaSP 5.10 program [25]. To gain an understanding of gene flow and genetic differentiation of lineages, estimates of genetic differentiation (χ2, Hst, Kst, Kst*, Z, Z*, and Snn) of the lineages and their support were computed in addition to specific measurements of DNA polymorphisms. Sequences obtained from the captured individuals were used as input data for genetic statistical tests of diversity. Neutrality tests Tajima’s D, Fu and Li’s D, and F tests were performed and showed that the data set is in mutation-drift equilibrium (not statistically significant, p < 0.05) also using the DnaSP 5.10 program [25].
2.3.3. Phylogeographic and Evolutionary Analyses
Phylogenetic reconstruction was performed to confirm the phylogenetic position of lampreys from the Croatian Danube basin within the phylogenetic tree of the genus Eudontomyzon, to reveal relationships among them, and to test whether the phylogenetic position of each population is consistent with reported taxonomic hypotheses. Two different phylogenetic reconstruction methods were employed: maximum parsimony (MP) and maximum likelihood (ML), implemented in PAUP v.4.0a [26]. For MP analysis, a heuristic search mode with 100 replicates was used, with a randomized input order of taxa and tree bisection-reconnection (TBR) branch swapping, giving equal weight to all codon sites and nucleotide substitution types weighted equally. ML analysis was performed under the heuristic search option using the TBR branch-swapping algorithm. Branch support (BS) was assessed by nonparametric bootstrapping (1000 pseudoreplicates, ten additional sequence replicates). The length of the MP tree was 163, with a consistency index of 0.6994, a homoplasy index of 0.3006, and a retention index of 0.7461. With haplotypes as input sequences for phylogenetic tree and network construction, sequences from the GenBank were also used (Table 3). Sequences of several Eudontomyzon species from the GenBank were included in the phylogenetic analyses to provide a clearer insight into the phylogenetic position of the lampreys from the study area in relation to their European relatives, while the sequence of Lampetra fluviatilis (accession number: GQ206175.1; Table 3) was used as an outgroup. The median-joining approach (MJ) was employed as an additional method using the computer program Network 4.5.1.6 [27]. In the resulting phylogenetic network, horizontal gene transfers were observed, which can be useful in reconstructing phylogenetic relationships among closely related taxa.
Divergence times between phylogenetic lineages were estimated by a Bayesian MCMC coalescent method using BEAST 2.4.7 software [32]. The analysis was conducted on the cyt b data set. Rate homogeneity across phylogenetic lineages was assessed by the log-likelihood ratio test (LRT), comparing the likelihood of phylogenetic trees (reconstructed using the maximum likelihood approach) with and without molecular clock enforcement in PAUP software version 4.0. As the likelihood scores were not the same in both cases for the cyt b data set, we applied a relaxed molecular clock. Molecular clock calibration was based on the divergence rate of the cyt b gene in Petromyzontidae of 0.12% per lineage per million years, as reported by [33]. The divergence rates were drawn from an uncorrelated lognormal distribution and a Yule speciation prior to a random starting tree. The substitution model used was HKY with a gamma-site heterogeneity model. We used default prior distributions for kappa, frequencies, and alpha, while substitution rate parameters were unlinked across codon positions. The number of MCMC steps (the length of the chain) was ten million.
The ancestral distribution ranges of lineages were reconstructed using Statistical Dispersal-Vicariance Analysis implemented in the S-DIVA software version 1.9 [34]. This method reconstructs the ancestral distribution in a phylogeny by optimizing a three-dimensional cost matrix, in which extinctions and dispersals ‘cost’ more than vicariance and determines the statistical support for the ancestral range [34]. Reconstruction of ancestral geographic ranges was conducted using the cyt b data set. An input set of trees was generated using Bayesian analysis (BAY). A total of six recent geographic ranges for Eudontomyzon were denoted (4 of them are marked in Figure 1): A—right tributaries of the Sava River, C—North Europe, D—tributaries of the Drava and Danube Rivers, E—Central Europe, F—South Europe.
3. Results
3.1. Phylogenetic Relationships and Distribution of Lampreys in Continental Croatia
The phylogenetic reconstruction of the Petromyzontidae family in the area of continental Croatia (the Danube basin) is based on the sequences of the gene for cytochrome b (cyt b) of sampled lampreys and sequences retrieved from the GenBank (Table 2 and Table 3). The cyt b gene sequences were 1191 base pairs long, with 68 variable and 46 parsimony significant sites (sites with at least two nucleotides occurring at least twice).
A total of 103 newly obtained sequences were combined with sequences retrieved from GenBank (Table 3) and included in the analyses. With the Croatian sample set, 32 haplotypes were identified, and five phylogenetic lineages were recovered in the phylogenetic tree (Figure 2). Four of these lineages, including samples from both the Sava and Drava River basins in Croatia, belong to E. vladykovi, according to current taxonomy. However, several samples from the Drava R. basin, particularly from the easternmost part of this river basin in Croatia and from the Bednja River (the largest left tributary of the Drava River), clustered together with sequences of E. danfordi from Slovakia in a separate phylogenetic lineage. As this lineage corresponds to the species E. danfordi, this study confirms for the first time that the Croatian Drava and Bednja rivers are part of the distribution range of this species.
Another unexpected result is the high amount of cryptic diversity within E. vladykovi, with at least four clearly separated phylogenetic units whose geographic distributions are also largely separated. Eudontomyzon vladykovi lineage I is so far, and based on our results, only repoted from Croatian waters, where it mainly inhabits the northwest part (area of Hrvatsko zagorje), but also the Mrežnica and Sunja rivers, so that it was found in both the Sava and Drava river basins. The second lineage, although found in a small number of samples, occupies a wide but fragmented distribution area. It was also found in both river basins in continental Croatia. The third lineage within E. vladykovi comprises the largest number of specimens from Croatia (it is present only in the Sava River basin, but it was found in a large number of localities), but also from Bosnia and Herzegovina. Lineage IV is also restricted to the Sava River basin, but is much rarer.
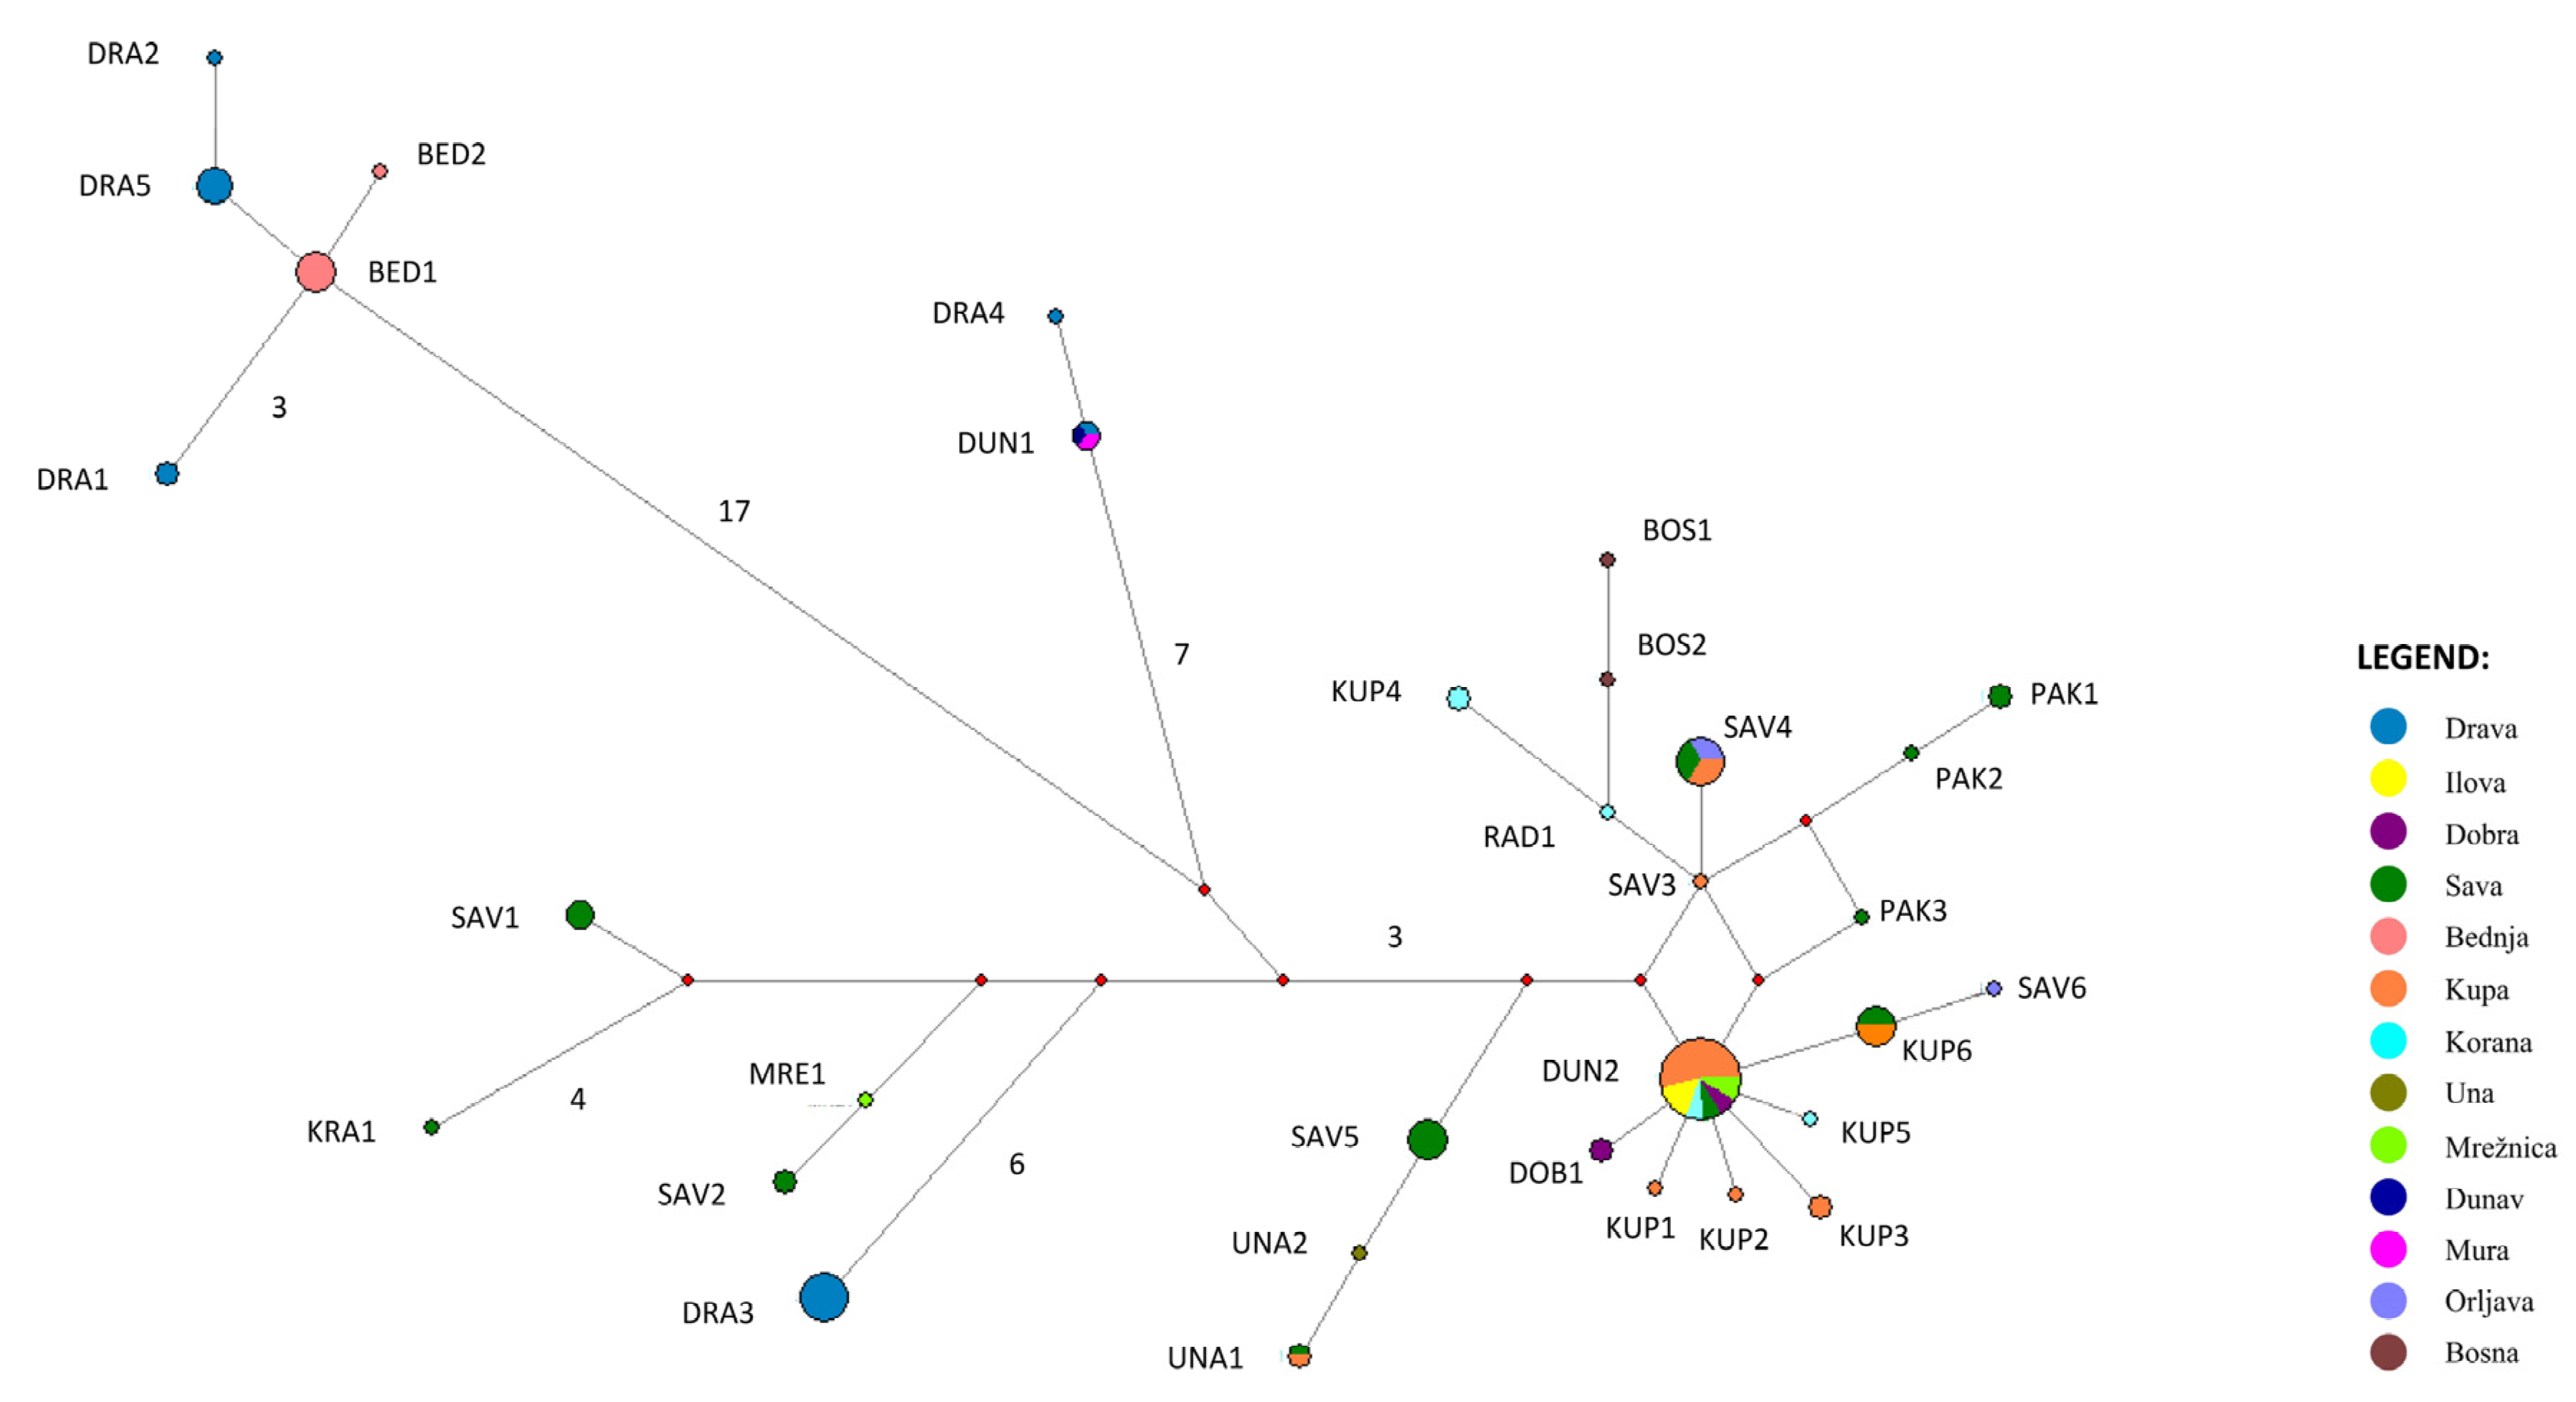
The MJ phylogenetic network (Figure 3), based on the cyt b gene sequences obtained in this study, corroborates the results visible in the phylogenetic trees. A clear separation of two species—Eudontomyzon danfordi and four lineages within the species Eudontomyzon vladykovi—is evident. Once again, there is a particularly high level of diversity within the E. vladykovi III lineage that needs to be recognized.
3.2. Inter- and Intraspecific Genetic Diversity and Differentiation
The genetic diversity of both species distributed in continental Croatia, as well as within each of the four E. vladykovi lineages, is moderate to high. A large number of haplotypes were determined, as was their high diversity. Furthermore, the average number of nucleotide differences for the Eutontomyzon vladykovi species and the vladykovi I lineage is extremely high, indicating a deeper structure and the possibility of the presence of cryptic diversity (Table 4). It is noteworthy that the haplotype diversity of E. danfordi is only 15% lower than the haplotype diversity of E. vladykovi, although its distribution area in Croatia is much smaller and it is present in a much lower number of individuals (15 vs. 88) caught in this study. However, the average number of nucleotide differences is almost five times higher in E. vladykovi, indicating that deep structuring is present, in contrast to the uniform genetic structure of E. danfordi. Moreover, the number of shared polymorphisms is very low, and they exist only between the E. vladykovi lineage III and all other units, including E. danfordi (Table 5).
The pairwise distances (p-distances) (Table 6) between species and lineages are always higher than the p-distance within E. danfordi and each of the E. vladykovi lineages. Eudontomyzon vladykovi lineages III and IV are the most closely related lineages, which is reflected in the lowest p-distance between them. On the other hand, as expected, p-distances between E. danfordi and all E. vladykovi lineages are the highest.
The distinction not only of species but also of lineages of E. vladykovi lineages is corroborated by the results of the genetic differentiation tests (Table 7), since there was no gene flow between species and lineages, indicating that there is no reproduction of individuals belonging to different lineages.
3.3. Molecular Identification of Species and Lineages
Molecular diagnostic analyses identified sites of fixed differences based on the cyt b gene. More fixed differences (Table 8) show that the species/lineages diverged earlier and indicate a large genetic difference between the species/lineages. As expected, the highest number of fixed differences was observed between Eudontomyzon danfordi and the phylogenetic lineages of Eudontomyzon vladykovi. However, there are also fixed differences present between all phylogenetic lineages of the Eudontomyzon vladykovi species. The table of diagnostic sites (Table 9) shows exactly which sites are involved. It is noteworthy that each of the E. vladykovi lineages can be unambiguously recognized on the basis of diagnostic sites in cyt b gene.
3.4. Evolutionary History of the Family Petromyzontidae in Europe
Evolutionary history analyses based on the cyt b gene (Figure 4) revealed an ancient origin and long-term evolutionary history of both E. vladykovi and E. danfordi. Separation of the clade comprising all E. vladykovi lineages from its sister clade comprising E. danfordi, E. stankokaramani and E. sp. Dnieper occurred in the early Miocene, about 22 mya (million years ago), whereas these two clades started to diversify around 17 mya. The origin of the different species and E. vladykovi lineages occurred mostly during the Middle Miocene, 11.6–8.5 mya.
4. Discussion
4.1. Diversity of the Petromyzontidae Family in the Danube Basin in Croatia
As this study was the first to investigate the structure of lamprey populations in continental Croatia at the molecular genetic level, it provided new and very important insights. Our results show significantly higher diversity on all levels—species, intraspecific, and genetic diversity. In addition to E. vladykovi, which was thought to be the only lamprey species in continental Croatia [3], this study proved that E. danfordi is also present and that its distribution range includes localities in the Drava River basin. Since its current distribution range in Croatia comprises the Bednja River (located in the western part of the Drava River basin) and the easternmost localities (Osijek and Petrijevci), with no reports of its presence in the Drava River in between, it is possible that the current localities are remnants of the once wider distribution range of this species, which has been reduced as a consequence of anthropogenic activities, especially habitat modifications. Regardless of its small and fragmented distribution range in Croatia, the genetic diversity of E. danfordi is moderately high, which is consistent with its long-term diversification in the Miocene.
Eudontomyzon vladykovi has a wider distribution in Croatia, inhabiting localities in both the Drava and Sava river basins. Its genetic diversity is high, and its intraspecific structure is also very pronounced. Four E. vladykovi lineages can be observed in the phylogenetic structure of this species, with no observed gene flow between them and mostly distinct distribution ranges. The origin of E. vladykovi can be dated to the early Miocene (22 mya). The intraspecific divergences of this species are also of very ancient origin and started already in the Miocene, 17 mya.
It is noteworthy that although E. vladykovi now has a larger distribution area in the Sava River basin, our results suggest that its ancestral distribution area was located in the Drava and Danube River basins, similar to E. danfordi, whose ancestral area was in the Drava and Danube River basins in Croatia or even further north, in Central Europe. The time frame of the origin of these two species (early and middle Miocene) corresponds to the development and evolution of the Danube River basin, which is concordant with the results of their ancestral ranges. Namely, the Proto-Danube was formed in the North Alpine foreland basin around 19–18 mya and started its southward migration [38,39]. Interestingly, the period between 17 and 18 mya, which was recovered in this study as the time of divergence of the E. vladykovi lineages and the origin and evolution of the species E. danfordi, E. stankokaramani and E. sp. Dnieper, has already been observed as an important period in the evolutionary history of the fish species distributed in the Danube River basin. The first major diversification event within the genus Barbus was also associated with this period [5]. Since the Proto-Danube progressed slowly, reaching the Vienna basin at 14–13 mya and the Pannonian basin at 10–5 mya [39], it is possible that the evolutionary history of both E. danfordi and E. vladykovi was largely shaped by the evolution of the Danube River basin, especially since 10–5 mya is the exact time frame when the origin of E. vladykovi lineages and the origin of diversification of the Croatian E. danfordi population occurred. Moreover, the ancestral range of the Croatian E. danfordi and E. vladykovi lineages was reconstructed in the Drava and Danube River basins. On the other hand, the ancestral ranges of E. vladykovi lineages I and II are associated with the right tributaries of the Sava River, indicating the colonization of the Sava River basin at the same time and the subsequent evolution and diversification of E. vladykovi there. Another important observation is that some E. vladykovi lineages inhabit the same rivers and river basins, with no obvious barriers between their localities, that would prevent migration and gene flow. This implies the presence of reproductive isolation between lineages, but it is also consistent with their ecology and behavior, particularly their connection with small patches of suitable habitats. Discovering various aspects of life cycles and diversities in the ecology and behavior of different E. vladykovi lineages and populations should be the focus of further investigation.
Given the long-term evolutionary history of both, E. vladykovi and E. danfordi, their high and moderately high genetic diversity is not surprising and is positive from a conservational perspective. Moreover, the absence of population genetic patterns that would imply bottleneck events indicates that both species have survived glaciations in the waters of continental Croatia and that glacial events did not have a significant effect on them. Namely, there is no abruption in their evolutionary history; the intraspecific structure of E. vladykovi, which originated in the Miocene, is well preserved until now, and intraspecific divergences of E. danfordi also started in the Miocene and continued until recent times. The waters of the Danube River basin in Croatia have been reported to serve as glacial refugia for other freshwater fish species, e.g., Cobitis elongatoides Bacescu & Mayer, 1969 [40], and it is likely that they also served as glacial refugia for lampreys. Nevertheless, lamprey populations with high genetic diversity have also been recognized as candidates for protection at several sites in Italy, Ireland, and Spain [7].
4.2. Taxonomic Implications
Besides revealing a high amount of cryptic diversity within lampreys in the Danube basin in Croatia, the results of all analyses conducted in this investigation indicate the necessity of a taxonomic revision of E. vladykovi (also observed by [33] at the European level) and the possibility that a species complex exists under this name, which, on the other hand, also has strong consequences for the practical conservation of lampreys in Croatia. The deep structuring within E. vladykovi observed by phylogenetic reconstruction and evolutionary history analyses (at least four phylogenetically distant and evolutionarily independent lineages were observed in this study) is comparable to the structuring within its sister clade, which comprises E. danfordi, E. stankokaramani, and E. sp. Dnieper. The origins of both clades occurred in a similar time frame, and the emergence of lineages included within both clades occurred mostly in the Miocene (11.6–10.25 mya), so it is surprising that lineages within one clade are all considered to belong to a single species (E. vladykovi), whereas lineages within the second clade each represent a separate species. Importantly, no gene flow was detected between the different E. vladykovi lineages, each of which can be recognized by molecular diagnostic sites in the cyt b gene. Although the above results are strong indications that each of the recovered E. vladykovi lineages may represent a separate species, a detailed comparison of morphological characteristics is necessary to find morphological diagnostic characters. Furthermore, although cyt b recovered cryptic diversity within E. vladykovi, it is necessary to investigate more genetic markers, including nuclear genes, in order to reliably resolve the taxonomy of this species or species complex.
4.3. Conservation Recommendations
The channeling of watercourses has been highlighted as the primary cause of endangerment at the sites where individuals were captured [41,42]. To preserve these populations, which harbor such a high level of genetic diversity and contribute to the biodiversity and ecosystem stability of Croatia, it is necessary to conserve, possibly protect, and prevent further endangerment of these sites. There is no reason why protective measures should not be implemented even before taxonomic issues are resolved. Among the sites highlighted in this study as unique and worthy of protection because of their natural richness are the areas inhabited by populations of the E. danfordi species, namely the Bednja River area, and the sites where the Vladykovi II lineage is found, specifically the Mura River basin and the confluence of the Mura River and Drava rivers. In addition to their genetic diversity, these sites collectively yielded the fewest individuals captured, suggesting the possible presence of smaller populations that, due to their size (currently indeterminable), may be more vulnerable to threats than some populations found in the tributaries of the Sava River. Furthermore, individuals of the Vladykovi II lineage indicate that populations in these areas may be crucial for unraveling the evolutionary history of the species E. vladykovi in Croatia.
Continued conservation efforts are essential to protecting lamprey populations and their habitats. Habitat restoration initiatives should be prioritized to improve the quality and connectivity of aquatic environments, particularly in regions where lamprey populations are threatened by habitat degradation [8]. Furthermore, the establishment of protected areas or reserves in critical lamprey habitats is imperative to ensure their long-term survival and to mitigate human disturbance. Monitoring programs must be developed and used to track population trends, habitat changes, and human impacts over time, providing essential data for adaptive management strategies [43]. In addition, outreach and education initiatives are essential to raise awareness of the ecological significance of lampreys and to build support for conservation efforts among local communities and among stakeholders. Cross-border collaboration is also necessary, working with other countries and international organizations to coordinate conservation efforts across transboundary river basins, recognizing the migratory nature of lamprey species and the interconnectedness of their habitats [44].
Author Contributions
S.P.: Conceptualization, investigation, writing—original draft; I.B.: conceptualization, resources, investigation, writing—original draft. All authors have read and agreed to the published version of the manuscript.
Funding
This research received no external funding.
Data Availability Statement
The original data presented in this study are openly available at https://www.ncbi.nlm.nih.gov/genbank/.
Acknowledgments
The authors are grateful to all colleagues from the Laboratory for Vertebrates and Nature protection, Division of Zoology, Department of Biology, Faculty of Science, University of Zagreb; namely: Davor Zanella, Perica Mustafić, Marko Ćaleta, Zoran Marčić, Sven Horvatić, Lucija Ivić, Lucija Onorato, Roman Karlović and Siniša Vajdić for their strong support of this investigation and their continuous efforts in providing samples for this research over the years.
Conflicts of Interest
The authors declare no conflict of interest.
References
- Hewitt, G.M. Post-glacial re-colonization of European biota. Biol. J. Linn. Soc. 1999, 68, 87–112. [Google Scholar] [CrossRef]
- Buj, I.; Podnar, M.; Mrakovčić, M.; Choleva, L.; Šlechtova, V.; Tvrtković, N.; Ćaleta, M.; Mustafić, P.; Marčić, Z.; Zanella, D.; et al. Genetic diversity and phylogenetic relationships of spined loaches (genus Cobitis) in Croatia based on mtDNA and allozyme analyses. Folia Zool. 2008, 57, 71–82. [Google Scholar]
- Ćaleta, M.; Marčić, Z.; Buj, I.; Zanella, D.; Mustafić, P.; Duplić, A.; Horvatić, S. A review of extant Croatian freshwater fish and lampreys: Annotated list and distribution. Croat. J. Fish. 2019, 77, 137–234. [Google Scholar]
- Mrakovčić, M.; Brigić, A.; Buj, I.; Ćaleta, M.; Mustafić, P.; Zanella, D. Red Book of Freshwater Fish of Croatia; Ministry of Culture, State Institute for Nature Protection: Zagreb, Croatia, 2006. [Google Scholar]
- Raguž, L.; Buj, I.; Marčić, Z.; Veble, V.; Ivić, L.; Zanella, D.; Horvatić, S.; Mustafić, P.; Ćaleta, M.; Sabolić, M. First look into the evolutionary history, phylogeographic and population genetic structure of the Danube barbel in Croatia. Knowl. Manag. Aquat. Ecosyst. 2021, 422, 13. [Google Scholar] [CrossRef]
- Kottelat, M.; Freyhof, J. Handbook of European Freshwater Fishes, 1st ed.; Kottelat: Cornol, Switzerland; Freyhof: Berlin, Germany, 2007; p. 646. [Google Scholar]
- De Cahsan, B.; Nagel, R.; Schedina, I.M.; King, J.J.; Bianco, P.G.; Tiedemann, R.; Ketmaier, V. Phylogeography of the European brook lamprey (Lampetra planeri) and the European river lamprey (Lampetra fluviatilis) species pair based on mitochondrial data. J. Fish Biol. 2020, 96, 905–912. [Google Scholar] [CrossRef]
- Mateus, C.S.; Stange, M.; Berner, D.; Roesti, M.; Quintella, B.R.; Alves, M.J.; Almeida, P.R.; Salzburger, W. Strong genome-wide divergence between sympatric European river and brook lampreys. Curr. Biol. 2013, 23, R649–R650. [Google Scholar] [CrossRef] [PubMed]
- Rüber, L.; Gandolfi, A.; Foresti, D.; Paltrinieri, L.; Splendiani, A.; Seehausen, O. Phylogenetic and biogeographic history of brook lampreys (Lampetra: Petromyzontidae) in the river basins of the Adriatic Sea based on DNA barcode data. Ecol. Evol. 2023, 13, e10496. [Google Scholar] [CrossRef] [PubMed]
- Zanandrea, G. Speciation among lampreys. Nature 1959, 184, 380. [Google Scholar] [CrossRef]
- Zanandrea, G.I.S. Recenti ricerche sulle forme appaiate di Lamprede dell’Italia e del Danubio. Bolletino Zool. 1959, 26, 545–554. [Google Scholar] [CrossRef]
- Zanandrea, G. Studies on European lampreys. Evolution 1961, 15, 523–534. [Google Scholar] [CrossRef]
- Boeker, C.; Geist, J. Lampreys as ecosystem engineers: Burrows of Eudontomyzon sp. and their impact on physical, chemical, and microbial properties in freshwater substrates. Hydrobiologia 2016, 777, 171–181. [Google Scholar] [CrossRef]
- Pough, F.H.; Janis, C.H.; Heiser, J.B. Vertebrate Life, 9th ed.; Prentice Hall: Upper Saddle River, NJ, USA, 2013; pp. 1–69. [Google Scholar]
- Young, J.Z. The Life of Vertebrates, 3rd ed.; Clarendon Press: Oxford, UK, 1985; pp. 76–109. [Google Scholar]
- Gess, R.W.; Coates, M.I.; Rubidge, B.S. A lamprey from the Devonian period of South Africa. Nature 2006, 443, 981–984. [Google Scholar] [CrossRef] [PubMed]
- Tutman, P.; Freyhof, J.; Dulčić, J.; Glamuzina, B.; Geiger, M. Lampetra soljani, a new brook lamprey from the southern Adriatic Sea basin (Petromyzontiformes: Petromyzontidae). Zootaxa 2017, 4273, 531–548. [Google Scholar] [CrossRef] [PubMed]
- Vladykov, V.D.; Kott, E. List of the Northern Hemisphere Lampreys (Petromyzondidae) and Their Distribution, 3rd ed.; Miscellaneous Special Publications; Department Fisheries and Oceans: Ottawa, Canada, 1979; pp. 1–30. [Google Scholar]
- Gill, H.S.; Renaud, C.B.; Chapleau, F.; Mayden, R.L.; Potter, I.C. Phylogeny of living parasitic lampreys (Petromyzontiformes) based on morphological data. Copeia 2003, 687–703. [Google Scholar] [CrossRef]
- Krappe, M. Quantitative Analysen Populationsbiologischer Phänomene im Lebenszyklus des Bachneunauges Lampetra planeri (Bloch, 1784). Ph.D. Thesis, Fakultät der Universität Rostock, Rostock, Germany, 2005. [Google Scholar]
- Perea, S.; Böhme, M.; Zupančič, P.; Freyhof, J.; Šanda, R.; Özuluğ, M.; Abdoli, A.; Doadrio, I. Phylogenetic relationships and biogeographical patterns in Circum-Mediterranean subfamily Leuciscinae (Teleostei, Cyprinidae) inferred from both mitochondrial and nuclear data. BMC Evol. Biol. 2010, 10, 265. [Google Scholar] [CrossRef] [PubMed]
- Castresana, J. Cytochrome b phylogeny and the taxonomy of great apes and mammals. Mol. Biol. Evol. 2001, 18, 465–471. [Google Scholar] [CrossRef]
- Patwardhan, A.; Ray, S.; Roy, A. Molecular Markers in Phylogenetic Studies—A Review. J. Phylogen. Evol. Biol. 2014, 2, 131. [Google Scholar] [CrossRef]
- Hall, T.A. BioEdit: A user-friendly biological sequence alignment editor and analysis program for Windows 95/98/NT. Nucleic Acids Symp. Ser. 1999, 41, 95–98. [Google Scholar]
- Librado, P.; Rozas, J. DnaSP v5: A software for comprehensive analysis of DNA polymorphism data. Bioinformatics 2009, 25, 1451–1452. [Google Scholar] [CrossRef]
- Swofford, D.L. PAUP*: Phylogenetic Analysis Using Parsimony (*and Other Methods), Version 4; Sinauer Associates: Sunderland, MA, USA, 2002. [Google Scholar]
- Nakhleh, L.; Guohua, J.; Fengmei, Z.; Mellor-Crummey, J. Reconstructing Phylogenetic Networks Using Maximum Parsimony. In Proceedings of the IEEE Computational Systems Bioinformatics Conference (CSB’05), Stanford, CA, USA, 8–11 August 2005. [Google Scholar]
- Lang, N.J.; Roe, K.J.; Renaud, C.B.; Gill, H.S.; Potter, I.C.; Freyhof, J.; Naseka, A.M.; Cochran, P.A.; Pérez, H.E.; Habit, E.M.; et al. Novel Relationships among Lampreys (Petromyzontiformes) Revealed by a Taxonomically Comprehensive Molecular Data Set. Am. Fish. Soc. Symp. 2009, 72, 41–55. [Google Scholar]
- Delarbre, C.; Escriva, H.; Gallut, C.; Barriel, V.; Kourilsky, P.; Janvier, P.; Laudet, V.; Gachelin, G. The complete nucleotide sequence of the mitochondrial DNA of the agnathan Lampetra fluviatilis: Bearings on the phylogeny of cyclostomes. Mol. Biol. Evol. 2000, 17, 519–529. [Google Scholar] [CrossRef] [PubMed]
- Levin, B.; Ermakov, A.; Ermakov, O.; Levina, M.; Sarycheva, O.; Sarychev, V. Ukrainian Brook Lamprey Eudontomyzon mariae (Berg): Phylogenetic position, genetic diversity, distribution, and some data on biology. In Jawless Fishes of the World, 2nd ed.; Orlov, A., Beamish, R., Eds.; Cambridge Scholar Publishing, Lady Stephenson Library: Newcastle upon Tyne, UK, 2016; Volume 1, pp. 154–196. [Google Scholar]
- Fox, A.M. A Molecular Phylogenetic Analysis of the Lamprey Genera Eudontomyzon, Lampetra, and Lethenteron. Ph.D. Thesis, University of Manitoba, Department of Biological Sciences, Winnipeg, MB, Canada, 29 August 2016. [Google Scholar]
- Bouckaert, R.; Heled, J.; Kuhnert, D.; Vaughan, T.; Wu, C.-H.; Xie, D.; Suchard, M.A.; Rambaut, A.; Drummond, A.J. BEAST 2: A software platform for Bayesian evolutionary analysis. PLoS Comput. Biol. 2014, 10, e1003537. [Google Scholar] [CrossRef]
- Pereira, A.M.; Levy, A.; Vukić, J.; Šanda, R.; Levin, B.A.; Freyhof, J.; Geiger, M.; Choleva, L.; Francisco, S.M.; Robalo, J.I. Putting European lampreys into perspective: A global-scale multilocus phylogeny with a proposal for a generic structure of the Petromyzontidae. J. Zool. Syst. Evol. Res. 2021, 59, 1982–1993. [Google Scholar] [CrossRef]
- Yu, Y.; Harris, A.J.; He, X. S-DIVA (Statistical Dispersal-Vicariance Analysis): A tool for inferring biogeographic histories. Mol. Phylogenet. Evol. 2010, 56, 848–850. [Google Scholar] [CrossRef] [PubMed]
- Nei, M. Evolution of human races at the gene level. Prog. Clin. Biol. Res. 1982, 103 Pt A, 167–181. [Google Scholar]
- Lynch, M.; Crease, T.J. The analysis of population survey data on DNA sequence variation. Mol. Biol. Evol. 1990, 7, 377–394. [Google Scholar] [PubMed]
- Hudson, R.R.; Slatkin, M.; Maddison, W.P. Estimation of levels of gene flow from DNA sequence data. Genetics 1992, 132, 583–589. [Google Scholar] [CrossRef] [PubMed]
- Krezsek, C.; Olariu, C. Filling of sedimentary basins and the birth of large rivers: The lower Danube network in the Dacian Basin, Romania. Glob. Planet. Chang. 2021, 197, 103391. [Google Scholar] [CrossRef]
- Magyar, I.; Radivojević, D.; Sztano, O.; Synak, R.; Ujszaszi, K.; Pocsik, M. Progradation of the paleo-Danube shelf margin across the Pannonian Basin during the Late Miocene and Early Pliocene. Glob. Planet. Chang. 2013, 103, 168–173. [Google Scholar] [CrossRef]
- Buj, I.; Šanda, R.; Marčić, Z.; Ćaleta, M.; Mrakovčić, M. Combining morphology and genetics in resolving taxonomy—a systematic revision of spined loaches (genus Cobitis; Cypriniformes, Actinopterygii) in the Adriatic Watershed. PLoS ONE 2014, 9, e99833. [Google Scholar] [CrossRef]
- Meyer, L.; Brunken, H. Historical occurrence and current distribution of migrating fishes and lampreys (Osteichthyes et Cyclostomata) in the drainage system of the River Aller (Lower Saxony) with an evaluation of future developments of their stocks. Braunschweiger Naturkundliche Schriften 1997, 5, 281–303. (in German). [Google Scholar]
- Ojutkangas, E.; Aronen, K.; Laukkanen, E. Distribution and abundance of river lamprey (Lampetra fluviatilis) ammocoetes in the regulated river Perhonjoki. Regul. Rivers Res. Manag. 1995, 10, 239–245. [Google Scholar] [CrossRef]
- Kelly, F.L.; King, J.J. A review of the ecology and distribution of three lamprey species, Lampetra fluviatilis (L.), Lampetra planeri (Bloch) and Petromyzon marinus (L.): A context for conservation and biodiversity considerations in Ireland. In Biology and Environment: Proceedings of the Royal Irish Academy; Royal Irish Academy: Dublin, Ireland, 2001; Volume 101, p. 101. [Google Scholar]
- Clemens, B.J.; Arakawa, H.; Baker, C.; Coghlan, S.; Kucheryavyy, A.; Lampman, R.; Lança, M.J.; Mateus, C.S.; Miller, A.; Nazari, H.; et al. Management of anadromous lampreys: Common threats, different approaches. J. Great Lakes Res. 2021, 47 (Suppl. S1), S129–S146. [Google Scholar] [CrossRef]
Figure 1.
Map of the research area with sampling localities marked with numbers from 1 to 39. Location numbers correspond with numbers in Table 1, where more information on localities is presented.
Figure 1.
Map of the research area with sampling localities marked with numbers from 1 to 39. Location numbers correspond with numbers in Table 1, where more information on localities is presented.

Figure 2.
ML phylogram showing the position of Eudontomyzon species in the Danube basin, together with sequences retrieved from the GenBank based on the cyt b gene. Numbers at nodes represent ML and MP bootstrap values.
Figure 2.
ML phylogram showing the position of Eudontomyzon species in the Danube basin, together with sequences retrieved from the GenBank based on the cyt b gene. Numbers at nodes represent ML and MP bootstrap values.

Figure 3.
Median-joining network of cyt b haplotypes. Red circles represent median vectors. The number of mutations is indicated by branches when there are more than two mutations.
Figure 3.
Median-joining network of cyt b haplotypes. Red circles represent median vectors. The number of mutations is indicated by branches when there are more than two mutations.

Figure 4.
Estimates of divergence time based on cyt b sequences of lamprey species. The timing of divergence events is presented as a mean and a 95% credible interval (in millions of years ago). Lower and upper bounds of the highest posterior density (HPD) interval; the HPD is the shortest interval containing 95% of the sampled values. Numbers in squares are bootstrap values. Colored circles represent the highest probability of the ancestral range (A—right tributaries of the Sava River, C—North Europe, D—tributaries of the Drava and Danube Rivers, E—Central Europe, F—South Europe).


Table 1.
Distribution (loacalities) and number of samples of cytochrome b haplotypes of lampreys in the rivers of the Danube basin.
Table 1.
Distribution (loacalities) and number of samples of cytochrome b haplotypes of lampreys in the rivers of the Danube basin.
| Locality (Name & Number) | Drainage System | Number of Samples (n) | cyt b Haplotype | GenBank Accession Numbers |
|---|---|---|---|---|
| Maslenjača (1) | Ilova | 1 | DUN2 | PP661384 |
| Toplica, Daruvar (2) | Ilova | 2 | DUN2 | PP661384 |
| Lešće (3) | Dobra | 7 | DOB1, DUN2 | PP661393, PP661384 |
| Sunja (4) | Sava | 8 | KUP6, SAV5 | PP661399, PP661390 |
| Osijek (5) | Drava | 1 | DRA1 | PP661378 |
| Voćin (6) | Drava | 7 | DRA2, DRA3, DRA5 | PP661379, PP661380, PP661382 |
| Štorgač (7) | Drava | 1 | DUN1 | PP661383 |
| Repaški most (8) | Drava | 1 | DRA4 | PP661381 |
| Petrijevci (9) | Drava | 1 | DRA1 | PP661378 |
| Ivanečka Željeznica (10) | Bednja | 1 | BED1 | PP661376 |
| Bednja (11) | Bednja | 2 | BED1 | PP661376 |
| Voća (12) | Bednja | 4 | BED1, BED2 | PP661376, PP661377 |
| Bubnjarci (13) | Kupa | 1 | DUN 2 | PP661384 |
| Brod na Kupi (14) | Kupa | 2 | KUP1, KUP2 | PP661394, PP661395 |
| Lazina (15) | Kupa | 1 | KUP3 | PP661396 |
| Pribanjci (16) | Kupa | 1 | DUN2 | PP661384 |
| Furjašnica (17) | Korana | 2 | KUP4 | PP661397 |
| Brezova Glava (18) | Korana | 2 | KUP5, DUN2 | PP661398, PP661384 |
| Stubička Slatina (19) | Sava | 1 | KRA1 | PP661385 |
| Brzaja (20) | Sava | 5 | SAV4 | PP661389 |
| Pakra (21) | Sava | 7 | PAK1, PAK2, PAK3, DUN2 | PP661402, PP661403, PP661404, PP661384 |
| Bručina (22) | Kupa | 3 | DUN2 | PP661384 |
| Ruševnica (23) | Kupa | 1 | KUP6 | PP661399 |
| Glinica (24) | Kupa | 1 | KUP6 | PP661399 |
| Čemernica (25) | Kupa | 1 | UNA1 | PP661400 |
| Buzeta, Šibine (26) | Kupa | 4 | KUP6, DUN2 | PP661399, PP661384 |
| Žirovnica (27) | Una | 2 | UNA1, UNA2 | PP661400, PP661401 |
| Petrinjčica (28) | Kupa | 5 | SAV3, SAV4, DUN2 | PP661388, PP661389, PP661384 |
| Lupinjak (29) | Sava (Sutla) | 3 | SAV1, SAV2 | PP661386 PP661387 |
| Mostanje (30) | Mrežnica | 2 | MRE1, DUN2 | PP661392, PP661384 |
| Batina (31) | Dunav | 1 | DUN1 | PP661383 |
| Goričan (32) | Mura | 1 | DUN1 | PP661383 |
| Orljava (33) | Orljava | 4 | SAV4, SAV6 | PP661389, PP661391 |
| Živković kosa (34) | Korana | 1 | RAD1 | PP661407 |
| Ušće Lašve (35) | Bosna | 2 | BOS1, BOS2 | PP661405, PP661406 |
| Terezino polje (36) | Drava | 5 | DRA3 | PP661380 |
| Bukvik (37) | Drava | 5 | DRA3 | PP661380 |
| Jaševnica (38) | Kupa | 2 | KUP3, DUN2 | PP661396, PP661384 |
| Ozalj (39) | Kupa | 2 | DUN2 | PP661384 |
Note(s): GenBank accession numbers will be provided in the proof, however, alignments can be sent to the editor, if needed.
Table 2.
Protocol for PCR reaction and used primers.
| Genetic Marker | cyt b |
|---|---|
| PCR conditions | 35 cycles of 45 s at 92 °C, following 90 s at 48 °C, following 105 s at 72 °C |
| PCR primers | ProK (5′TTATTTAATGTTAAGATRCTAGCTTTGG3′) Pak-Glu F (5′CACCGTTGTAGAATTCAA CTATAAG3′) |
Table 3.
Lamprey cyt b sequences retrieved from the GenBank and included in the phylogenetic and evolutionary history reconstruction.
Table 3.
Lamprey cyt b sequences retrieved from the GenBank and included in the phylogenetic and evolutionary history reconstruction.
| Species | bp (Number of Base Pairs) | Locality | GenBank Accession Number | Reference |
|---|---|---|---|---|
| Eudontomyzon danfordi Regan, 1911 | 1133 | Zdychava River (SVK) | GQ206158.1 | [28] |
| Eudontomyzon mariae (Berg, 1931) | 1133 | Ivianka River (UKR) | GQ206162.1 | [28] |
| Eudontomyzon stankokaramani (Karaman, 1974) | 1133 | Zeta River (MNE) | GQ206189.1 | [28] |
| Eudontomyzon vladykovi Oliva and Zanandrea, 1959 | 1133 | Studenec Creek (SVK) | GQ206161.1 | [28] |
| Lampetra fluviatilis (Linnaeus, 1758) | 16,159 | Garonne Estuary (FRA) | NC001131.1 | [29] |
| Eudontomyzon lanceolata (Kux and Steiner, 1972) | 1133 | Chakhtsutsyr River (RUS) | GQ206176.1 | [28] |
| Lampetra planeri (Bloch, 1784) | 1133 | Kalte Moldau River (DEU) | GQ206149.1 | [28] |
| Lethenteron zanandreai (Vladykov, 1955) | 1133 | Vipava River (SLO) | GQ206184.1 | [28] |
| Eudontomyzon sp. Dnieper | 1164 | Ugra River (RUS) | KP135487.1 | [30] |
| Eudontomyzon sp. Dnieper | 1164 | Rudyanka River (RUS) | KP135483.1 | [30] |
| Eudontomyzon sp. Dnieper | 1164 | Sigosa River (RUS) | KP135485.1 | [30] |
| Eudontomyzon sp. Dnieper | 1164 | Vyazma River (RUS) | KP135482.1 | [30] |
| Eudontomyzon hellenicus (Vladykov, Renaud, Kott and Economidis, 1982) | 1133 | Strymon River (GRC) | GQ206160.1 | [28] |
| Lampetra fluviatilis (Linnaeus, 1758) | 1133 | Luga River (RUS) | GQ206175.1 | [28] |
| Eudontomyzon stankokaramani (Karaman, 1974) | 1191 | unknown river (SLO) | KX787432.1 | [31] |
| Eudontomyzon lanceolata (Kux and Steiner, 1972) | 1191 | unknown river (TUR) | KX787431.1 | [31] |
Table 4.
Measures of genetic polymorphism for the Eudontomyzon vladykovi lineages and for the Eudontomyzon danfordi species. N—number of sequences, h—number of haplotypes, S—number of polymorphic sites, Hd—haplotype diversity, k—average number of nucleotide differences, π—nucleotide diversity, ƞ—total number of mutations.
| Species/Lineage | N | h | S | Hd | k | π | ƞ |
|---|---|---|---|---|---|---|---|
| E. danfordi | 15 | 5 | 6 | 0.752 | 1.524 | 0.00128 | 6 |
| E. vladykovi | 88 | 30 | 53 | 0.895 | 7.158 | 0.00601 | 54 |
| vladykovi I | 16 | 5 | 19 | 0.667 | 6.983 | 0.00586 | 19 |
| vladykovi II | 4 | 2 | 1 | 0.5 | 0.5 | 0.00042 | 1 |
| vladykovi III | 59 | 20 | 23 | 0.8 | 2.414 | 0.00203 | 23 |
| vladykovi IV | 9 | 3 | 2 | 0.556 | 0.722 | 0.00061 | 2 |
Table 5.
Shared polymorphisms on the cyt b gene between lineages.
| Species/Lineage | Vladykovi I | Vladykovi II | Vladykovi III | Vladykovi IV |
|---|---|---|---|---|
| E. danfordi | 0 | 0 | 1 | 0 |
| vladykovi I | - | 0 | 3 | 0 |
| vladykovi II | - | - | 1 | 0 |
| vladykovi III | - | - | - | 0 |
Table 6.
p-values between and inside lineages (expressed as a percentage).
| Species/Lineage | E. danfordi | Vladykovi I | Vladykovi II | Vladykovi III | Intraspecific/Intralineage |
|---|---|---|---|---|---|
| E. danfordi | 0.08–0.41 (0.20) | ||||
| vladykovi I | 1.84–2.68 (2.26) | 0.08–1.25 (0.70) | |||
| vladykovi II | 2.01–2.35 (2.18) | 1.09–1.51 (1.30) | / (0.10) | ||
| vladykovi III | 1.93–2.35 (2.14) | 0.83–1.59 (1.21) | 1.09–1.42 (1.255) | 0.80–0.58 (0.30) | |
| vladykovi IV | 1.84–2.09 (1.97) | 0.83–1.34 (1.09) | 0.92–1.09 (1.01) | 0.33–0.75 (0.54) | 0.08–0.16 (0.10) |
Table 7.
Estimation of the number of migrants per generation between the lamprey lineages of the Danube basin in Croatia according to [35,36,37].
| Species/Lineage | Nm [35] | Nm [36] | Nm [37] |
|---|---|---|---|
| E. danfordi:E. vladykovi | 0.61 | 0.1 | 0.11 |
| vladykoviI:vladykoviII | 0.67 | 0.15 | 0.15 |
| vladykoviI:vladykoviIII | 0.53 | 0.26 | 0.26 |
| vladykoviI:vladykoviIV | 0.51 | 0.21 | 0.21 |
| vladykoviII:vladykoviIII | 0.74 | 0.6 | 0.6 |
| vladykoviII:vladykoviIV | 0.06 | 0.03 | 0.03 |
| vladykoviIII:vladykoviIV | 1.19 | 0.2 | 0.2 |
Table 8.
Fixed differences based on the cyt b gene between lineages.
| Species/Lineage | Vladykovi I | Vladykovi II | Vladykovi III | Vladykovi IV |
|---|---|---|---|---|
| E. danfordi | 19 | 24 | 21 | 21 |
| vladykovi I | - | 9 | 6 | 6 |
| vladykovi II | - | - | 12 | 10 |
| vladykovi III | - | - | - | 3 |
Table 9.
Fixed differences on the cyt b gene with specified nucleotide sites of fixed differences and bases present in each lineage indicated. Diagnostic sites for a particular lineage are represented by nucleotides in colored boxes.
Table 9.
Fixed differences on the cyt b gene with specified nucleotide sites of fixed differences and bases present in each lineage indicated. Diagnostic sites for a particular lineage are represented by nucleotides in colored boxes.
| Species/Lineage | |||||
|---|---|---|---|---|---|
| Nucleotide Spot | E. danfordi | Vladykovi I | Vladykovi II | Vladykovi III | Vladykovi IV |
| 36 | T | C | C | C | C |
| 57 | C | T | T | T | T |
| 72 | C | T | T | T | T |
| 156 | G | A | A | A | A |
| 157 | C | T | T | T | T |
| 162 | T | C | C | C | C |
| 312 | A | G | A | A | A |
| 378 | A | A | G | A | A |
| 390 | T | T | C | T | T |
| 480 | A | G | G | G | G |
| 483 | A | G | G | G | G |
| 531 | C | C | C | C | T |
| 588 | A | A | G | A | A |
| 630 | T | T | C | T | T |
| 639 | G | A | A | A | A |
| 675 | T | C | C | C | C |
| 726 | C | T | T | T | T |
| 771 | A | C | C | C | C |
| 807 | G | A | G | G | G |
| 813 | C | C | C | T | C |
| 909 | G | A | A | A | A |
| 1155 | G | G | A | G | G |
Disclaimer/Publisher’s Note: The statements, opinions and data contained in all publications are solely those of the individual author(s) and contributor(s) and not of MDPI and/or the editor(s). MDPI and/or the editor(s) disclaim responsibility for any injury to people or property resulting from any ideas, methods, instructions or products referred to in the content. |
© 2024 by the authors. Licensee MDPI, Basel, Switzerland. This article is an open access article distributed under the terms and conditions of the Creative Commons Attribution (CC BY) license (https://creativecommons.org/licenses/by/4.0/).
Share and Cite
MDPI and ACS Style
Pleše, S.; Buj, I. Tackling the Phylogeny of Lampreys—Insight from the Croatia’s Danube Basin. Water 2024, 16, 1153. https://doi.org/10.3390/w16081153
AMA Style
Pleše S, Buj I. Tackling the Phylogeny of Lampreys—Insight from the Croatia’s Danube Basin. Water. 2024; 16(8):1153. https://doi.org/10.3390/w16081153
Chicago/Turabian StylePleše, Sara, and Ivana Buj. 2024. "Tackling the Phylogeny of Lampreys—Insight from the Croatia’s Danube Basin" Water 16, no. 8: 1153. https://doi.org/10.3390/w16081153
Note that from the first issue of 2016, this journal uses article numbers instead of page numbers. See further details here.