
An Analysis of Society’s Willingness to Restore the Aquatic Environment in Romania
by
 , , ,
, , ,
Daniel Constantin Diaconu
1,2,* ,
,
Andreea Ardelean
3 ,
,
Florentina Toma
4,
Dragoș Cristian Diaconu
5,
Andrei Rafael Gruia
6 and
Daniel Peptenatu
2 1
Department of Meteorology and Hydrology, Faculty of Geography, University of Bucharest, 010041 Bucharest, Romania
2
Research Center for Integrated Analysis and Territorial Management, Faculty of Geography, University of Bucharest, 030018 Bucharest, Romania
3
Department of Applied Economics and Quantitative Analysis, Faculty of Administration and Business, University of Bucharest, 030018 Bucharest, Romania
4
Mihai Eminescu National College, 040133 Bucharest, Romania
5
Faculty of International Economic Relations, Academy of Economic Studies, 010374 Bucharest, Romania
6
Graphit Innovation Factory, 220121 Drobeta Turnu Severin, Romania
*
Author to whom correspondence should be addressed.
Water 2024, 16(8), 1159; https://doi.org/10.3390/w16081159
Submission received: 19 March 2024
/
Revised: 10 April 2024
/
Accepted: 15 April 2024
/
Published: 19 April 2024
(This article belongs to the Section Urban Water Management)
Abstract
:Anthropogenic pressure on water resources is affecting aquatic systems, requiring ecological analysis and restoration. This study proposes a new approach to assessing public perceptions of these activities. The methodology used is based on a structured questionnaire that looks at the general perception of the research topic, the economic readiness for community involvement and the identification of institutional mechanisms to implement river restoration measures. We used random sampling, guaranteeing results with a margin of error of 4.33%. The results show that the public and practitioners have different perspectives, and this can influence river restoration solutions, as they will contribute to a change in the way that longitudinally connected river restoration solutions are designed and implemented.
1. Introduction
Society’s increasing demand for water has led to a transformation of the river network into a succession of reservoirs or canals, sectioned off by various hydro-engineering works, generating numerous debates about the impact of these structural interventions on aquatic systems [1,2,3,4], and not least on communities. In addition to this hydro-geomorphological alteration, there is also a chemical and thermal alteration, either directly through wastewater effluent or insufficiently treated water, or through the fact that the physico-chemical characteristics of the water volumes in the riverbed are strongly influenced by climatic factors [5,6,7,8]. Thus, research on river connectivity from as many perspectives as possible should be a priority in the scientific world, as there are currently few tools for quantifying this attribute of river systems [9,10,11,12,13].
The negative impacts caused by river fragmentation highlight the importance of restoring river connectivity and focusing on exploiting the ecosystem services provided by the entire natural system [14,15,16,17]. To incorporate connectivity restoration into conservation and renaturation programs, it is essential to improve civil society’s awareness of the importance of maintaining continuous waterways [18]. River connectivity is essential for the conservation of freshwater ecosystems, because barriers alter both abiotic conditions and biotic communities, compromising biodiversity; however, the appreciation of this characteristic of rivers has been insufficiently considered in socio-environmental studies, which focus mainly on the acceptance of new dam construction [19,20,21]. Global climate change is having a major impact on water resources and the hydrological regime of rivers, prompting riparian communities to build reservoirs that attenuate flood waves and retain water for extended periods of time when droughts occur [22,23]. All these hydrotechnical constructions being built or under construction have become transverse and longitudinal barriers to natural aquatic ecosystems [24,25,26,27].
One of the most well-documented effects of river barriers is the obstruction of upstream access for many valuable migratory species, such as migratory fish species. European species such as Atlantic salmon (Salmo salar), brown trout (Salmo trutta), European eel (Anguilla anguilla) and lamprey (Petromyzon marinus) have been threatened, particularly upstream of impassable dams, where most of the populations have disappeared [28,29,30,31,32].
Rivers have been affected by an altered water flow and abnormal sedimentation patterns, both within reservoirs and downstream, significantly impairing the water quality and ecological condition [33] and facilitating the establishment of exotic and invasive species at the expense of allochthonous ones [34,35,36].
The watershed has been transformed over time into an urban, industrial or agricultural production center, and less consideration has been given to its potential valorization as an asset to local communities [37,38,39].
Most methods of analysis and planning of river connectivity actions are based on numerical methods, on the basis of which simulations are carried out for decision-making. These methods exploit hydrological, hydrotechnical, biological and ecological databases in general [11,40,41,42,43].
The longitudinal connectivity of rivers is strongly influenced by the social connectivity of rivers, which is the set of infrastructures that are built across rivers to provide the necessary goods and services. These constructions have construction components in the riverbed that fragment longitudinal connectivity, especially in the case of river sections that cross localities [17,44,45,46].
Hermida (2019) proposes disaggregating the concept of river connectivity into several dimensions [47]. Spatial and visual accessibility, as well as green corridor connectivity, are expressed through several quantitative indicators.
Presenting the antagonistic problem of measures that are imposed by global climate change and the health of aquatic ecosystems is another research direction [48,49,50]. Another approach is social connectivity analysis, in which the authors analyze communication, the circulation of merchandise, ideas and cultural values along and across rivers [51,52].
The large number of such infrastructures in existing inhabited areas in Romania, crossed by important rivers, has led to research on community perceptions of the importance of longitudinal connectivity in maintaining the ecological balance of rivers, as it is known that the way that the community relates to the sectioning of watercourses, and implicitly, their biodiversity, is essential in the development of specific territorial management systems.
Most studies are based on quantitative approaches using indices developed for this purpose. Although they provide a picture of the state of connectivity and the need to improve connectivity in terms of the ecosystem and its biodiversity, such approaches are not sufficient to define the full set of measures to be implemented.
This research aims to determine the perception and degree of involvement of society in restoring the longitudinal connectivity of rivers. Decision-makers need to know the degree of financial commitment that they can expect to receive from the population. Determining the needs of riparian communities thus increases the relevance of the measures that are implemented and the sustainability of the interventions.
2. Materials and Methods
2.1. Study Area
Romania has an area of 238,397 km2 (about 6% of the EU’s area, ranking 9th) and a resident population of 19,328,838 inhabitants (on 1 January 2020, according to official data from the National Institute of Statistics of Romania) [53]. Of the country’s total surface area, the Danube drains 232,193 km2 (representing 97.4% of the country’s surface area). Romania thus has 29% of the surface area and 21.7% of the population of the Danube basin.
Romania is a country that is currently implementing the EU standards of environmental protection, maintaining water quality and biodiversity. As such, removing transversal and longitudinal barriers on rivers is a chosen objective of Romanian authorities. The problem is that they do not have the relevant technical and legal methodology for implementing these objectives.
Romania’s cadastral river network is 78,905 km long and evenly distributed, with a radial configuration, and 98% of the rivers flowing from the Carpathian Mountains. The upper and middle courses of a large number of rivers that cross the state border are located on the territory of our country, and the Tisa, Prut and Danube rivers, among others, form part of Romania’s border. The main rivers are Mureș (761 km), Prut (742 km), Olt (615 km), Siret (559 km), Ialomița (417 km), Someș (376 km) and Argeș (350 km).
The hydrographic network drains the relief, divided into the following main units: mountains: 31%; hills and foothills: 36%; and plains: 33%. The climate is temperate continental, the multiannual average air temperature varies between +11 °C on the coast and −4 °C in the Carpathian Mountains, and the multiannual average rainfall varies between 400 mm/year in Dobrogea and 1400 mm/year on the high peaks of the Carpathian Mountains. The mean specific runoff ranges from less than 1 L/s/km2 in the Romanian Plain to 40 L/s/km2 on the ridges of the Southern Carpathians.
Out of the 25 ecoregions defined at the European level in Annex XI of the Water Framework Directive, based on the ecological characteristics and geographical distribution of aquatic fauna, 4 ecoregions have been identified at the national level, namely, the Carpathian Mountains Ecoregion—10—the Pannonian Plain Ecoregion—11—the Pontic Ecoregion—12—and the Eastern Plain Ecoregion—16. In addition to the ecoregions included in Annex XI, at the national, level the sub-ecoregion the Transylvanian Plateau—10a—has been defined as part of the Carpathian Mountains ecoregion.
In the updated National Management Plan (2021–2027), a total of 3025 surface water bodies were identified, of which 2741 are river water bodies, of which 1.772 are permanent water bodies, and the remaining 969 water bodies are represented by non-permanent water bodies: 278 lake water bodies (natural lakes, heavily modified natural lakes, reservoirs, artificial lakes); 2 transitional water bodies (one lacustrine and one marine); and 4 coastal water bodies [54].
Over the last century, rivers have been heavily fragmented by cross-barriers built for various purposes (hydropower dams, to attenuate flood waves and supply water to population, industry and agriculture), but also by other hydrotechnical works with heights greater than 0.50 m. The focus of water management is now also on habitat quality and connectivity to maintain biodiversity (Directive 2000/60/EC of the European Parliament and of the Council of 23 October 2000, establishing a framework for community action in the field of water policy) [55].
2.2. Field Research
A questionnaire was developed, addressed to a broad mass of people, using common language with as few specialist terms as possible. It consists of ten questions, the first four of which are questions about the interviewee and the others about the environmental issue under consideration (https://forms.gle/DCSr39enTMBdszCT7, accessed on 7 January 2024) [56]. Being online, this survey was distributed to a wide array of people on different social media channels, to which people with different levels of education, genders, levels of wealth and geographical locations responded. No pressure was applied to respondents during its completion, by virtue of being online, thus avoiding biased, random or ambiguous responses. We specify that all respondents volunteered and agreed to participate in the study and signed informed consent for the use of their responses in the research.
The first objective of these questions is to determine the degree of implication in environmental protection in general, the second objective is to determine the willingness of financial contributions for supporting longitudinal connectivity measures, and the third objective is to determine the exact amount of money (in EUR) that the respondents would be willing to donate to support such activities.
The response types were open, multiple and utilizing the Likert scale, the questionnaire being comprised of nominal-, ordinal- and interval-level questions.
The first section, containing contextualization questions aimed at the respondent’s general perception of the topic under investigation were as follows: Do you consider environmental protection to be important? Is river connectivity a priority in maintaining the natural condition of rivers?
The second section of the questionnaire sought the respondent’s economic relationship to the structural elements of the river connectivity issue: How much Euro (up to 100 Euro) would you be willing to pay in your annual taxes (or donate) for each of the following actions: (1) Building fish migration passages (fish ladders) to help fish move (migrate) along rivers. (2) Conservation of native fish species and their numbers. (3) Improvement of fish populations for fishing. (4) Conservation of all fish species in the river (biodiversity). (5) Improvement of the aquatic environment (restoration of damaged areas).
The last section of the questionnaire focused on the perception of the institutions in charge and concrete actions to be taken for environmental protection: Who do you think should be in charge of environmental protection? In your opinion, what is the reason why people do not protect the environment enough in their daily life? And if you can name a technical solution/recommendation on increasing river connectivity?
Method of Carrying Out the Survey
The questionnaire validated by the previous method was made public, in Romanian, and posted online on google forms for 30 days. Participants were informed only that this questionnaire is designed to determine their level of knowledge of river connectivity (movement of migratory fish along rivers due to the construction of weirs and dams), and that the information collected in this way will be analyzed in order to develop strategies to implement actions to remove existing barriers on watercourses (Figure 1). Volunteers agreed to participate in the study and signed the informed consent for the use of their answers in this research electronically.
2.3. Methodology for Processing the Results
Our hypotheses were tested using R software version 4.2.3 accessing packages such as “rstatix”, “tidyverse”, “ggpubr” or “rcompanion”, whereas the descriptive analysis was carried out using the Analysis ToolPak from Microsoft Excel. The normality was also checked for the quantitative variables with Q-Q plots, Shapiro–Wilk tests and Kolmogorov–Smirnov tests [57,58].
In order to determine which socio-demographic characteristics registered differences at each level for each action, the Mann–Whitney–Wilcoxon test and the Kruskal–Wallis test were applied due to the data not being normally distributed [59]. The Mann–Whitney–Wilcoxon test was used when comparing two groups, while the Kruskal–Wallis test was used when comparing more than two groups.
With the purpose of checking whether there are significant differences between groups, the hypotheses for the two statistical tests are expressed as follows:
- H0: the null hypothesis is that the groups are equal;
- H1: the alternative hypothesis is that the groups are not equal.
If the two-sided level of significance (α) is lower than 0.05, then we reject the null hypothesis, as can be seen from the presented results below.
The groups that were compared included socio-demographics such as gender (male/female), level of education (primary, secondary, tertiary, post high school), age (5 intervals: under 25, between 26 and 35, between 36 and 50, between 51 and 65, and over 65) and residential environment (urban/rural) on the amount of money given towards building fish migration passages, conservation of indigenous fish species and their numbers, improvement in fish stocks for fishing purposes, conservation of all fish species in the river and improving the aquatic environment.
3. Results
Random sampling was applied, and with a probability of 95%, the research results are guaranteed with a 4.33% margin of error [60,61].
The data were collected between January and February 2024. The sample consists of 511 respondents: 46% men and 54% women who live in Romania. In this sample, 300 respondents are under the age of 25, 31 are between 26 and 35, 127 are between 36 and 50, 51 are between 50 and 65 and 2 are over the age of 65. The graph below shows the distribution by age, for both women and men (Figure 2).
Of the respondents, 16% live in rural areas, while 84% live in urban areas. In addition, 58% have a bachelor’s degree, 1.4% graduated from a post-secondary school, while 31.5% graduated high school and 8.8% finished primary school.
The vast majority (99.8%) considered environmental protection to be important, and also, a fairly significant percentage of the respondents (83.8%) considered the connectivity of the rivers to be a priority in maintaining the natural state of the rivers. Only 14.5% did not have an opinion, and 1.8% regarded the connectivity of rivers to be unimportant.
When asked about how much money (up to EUR 100) they would be willing to pay in their annual taxes (or donate) for each of the actions regarding the connectivity of rivers presented in Table 1, the median (EUR 20), mode (EUR 20), minimum (EUR 0) and maximum (EUR 100) had the same values for each category. As we can see from the table below, all the five actions appear to have means that are near to each other, with standard deviations that are almost as large as the means, which suggests the existence of extreme values. Furthermore, the values of the skewness and kurtosis indicate that the data are not normally distributed. All actions are positively skewed, as shown in Figure 2, with many high outliers, meaning that people in general tend to choose a rather small sum for actions to fix problems that concern the connectivity of rivers. Four of the five actions have peaked distribution, and only the last one has a more moderate kurtosis [62]. The normality was also checked with Q-Q plots, Shapiro–Wilk tests and Kolmogorov–Smirnov tests, revealing that the data are not normally distributed.
Improving the aquatic environment seems to be the action that gathered the most money (a sum of EUR 15,572.8), with the highest mean of EUR 30.47 and the highest outliers, suggesting that it is considered the most important one, whilst building fish migration passages and conservation of indigenous fish species and their numbers collected small amounts of money (Table 1 and Figure 3). As specified earlier, because the five variables were not normally distributed, the Kruskal–Wallis test was applied to check whether there were statistical significant differences between the allocation of money. The p-value being lower than 0.05 confirms the differences. The multiple pairwise comparisons show that the action that is, indeed, highly different from the others is “improving the aquatic environment”, with only conservation of all fish species in the river, being the closest, not having any statistical significance towards it. As we can see (from Table 1), this action has the closest mean, standard deviation and sum to the one that stands out.
For each category that embedded the chosen sum, the effect size was also calculated [63]. Table 2 displays, based on the p-value, which characteristic makes a distinction. Those that have α < 0.05 are considered to be statistically significant in their discrepancy. All socio-demographic characteristics that had a p-value below 0.05 also had a small effect size.
For most actions, respondents’ level of education made a difference in distributing the sums of money (Table 2). Apparently, those with lower levels of education tend to offer more money towards this matter, while in other groups, large sums of money are seen as outliers (Figure 4). The distribution of amounts in Euro based on the level of education for building fish migration passages is presented in the figure below, as an example, but all the other actions have similar distributions.
Improvements in fish stocks for fishing purposes and improving the aquatic environment also have differences among groups based on age. The largest differences are recorded between the groups that are under the age of 25 and between 36 and 50 years old. The figure below reflects the distribution of the amount of money regarding improvement of fish stocks for fishing purposes by age intervals, but the distribution for improving the aquatic environment is similar. The youngest tend to offer increased sums of money for those two types of actions, while the elderly group is the only one that does not have high outliers (Figure 5).
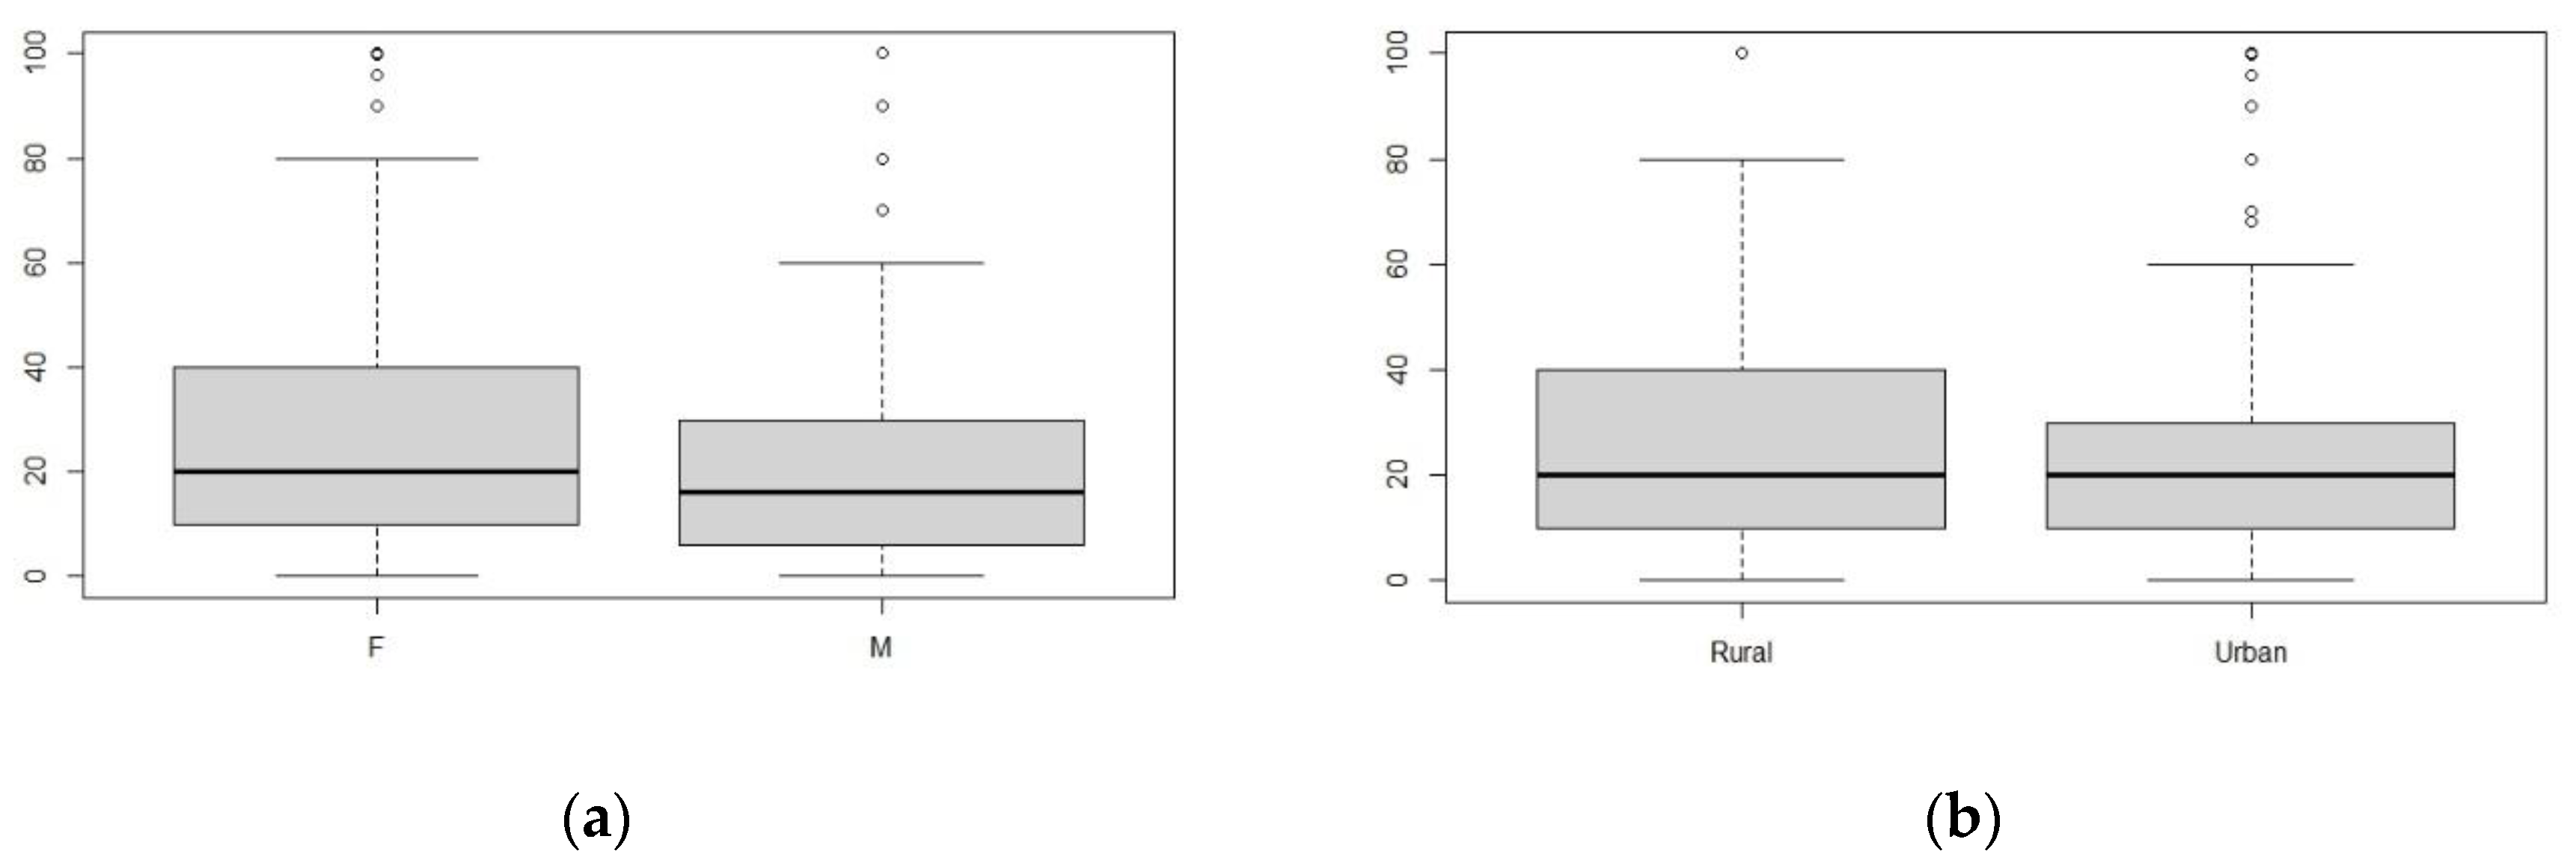
The conservation of all fish species in the river recorded differences among characteristics like gender and residential environment. Women tend to care more about conservation of all fish species, and also, people who live in rural areas consider this aspect being more important (Figure 6).
When the respondents were asked who they think should deal with environmental protection, most were of the opinion that especially the environmental authorities should take care of it (84%), and afterwards, every citizen should be responsible. Following these, very close to each other are the city council and the government, then more distantly, non-governmental organizations. In the last places with equal importance, from the perspective of the respondents, were schools/universities and the TV, radio, print and online media. Regarding the causes that the respondents considered to be the basis of the insufficient protection of the environment, most saw carelessness and a lack of education as the main factors, followed at a considerable distance by financial causes (17%). So, it seems that many did not think that money was the problem. A few respondents even thought that the main cause was overly permissive sanctions.
The answers to the last question indicate a lack of or varying knowledge of environmental protection in general and river connectivity in particular.
Technical solutions/recommendations from the respondents regarding river connectivity were waste collection; educating the population; limitation of construction and developments; reduction in and efficiency of approvals and bureaucracy; increasing biodiversity; hydrotechnical improvements; prohibiting the program for the construction of micro-hydropower plants on the rivers in the mountain area; creating ladders for fish; restoring the paths of streams/rivers; or river bed cleaning.
4. Discussion
As opposed to other studies in the field that analyzed the spatial connectivity method in certain communities, this study obtains information from the final beneficiaries of the connectivity reestablishment measures [39,49,50,52]. The decision-making authorities in the field do not have a relevant and accurate methodology, as no study has been conducted regarding reestablishing longitudinal connectivity.
The results indicate that civil society is interested in being involved in the development of plans to restore river connectivity and protect ecosystems in their communities, which is particularly important given that the community consultation process is currently optional or limited, with plans being developed centrally.
This study revealed different levels of interest, depending on age, in getting involved in the ecological rehabilitation of watercourses, which shows the different ways of relating to environmental issues, a result that forces decision-makers to involve the whole community in the decision-making processes.
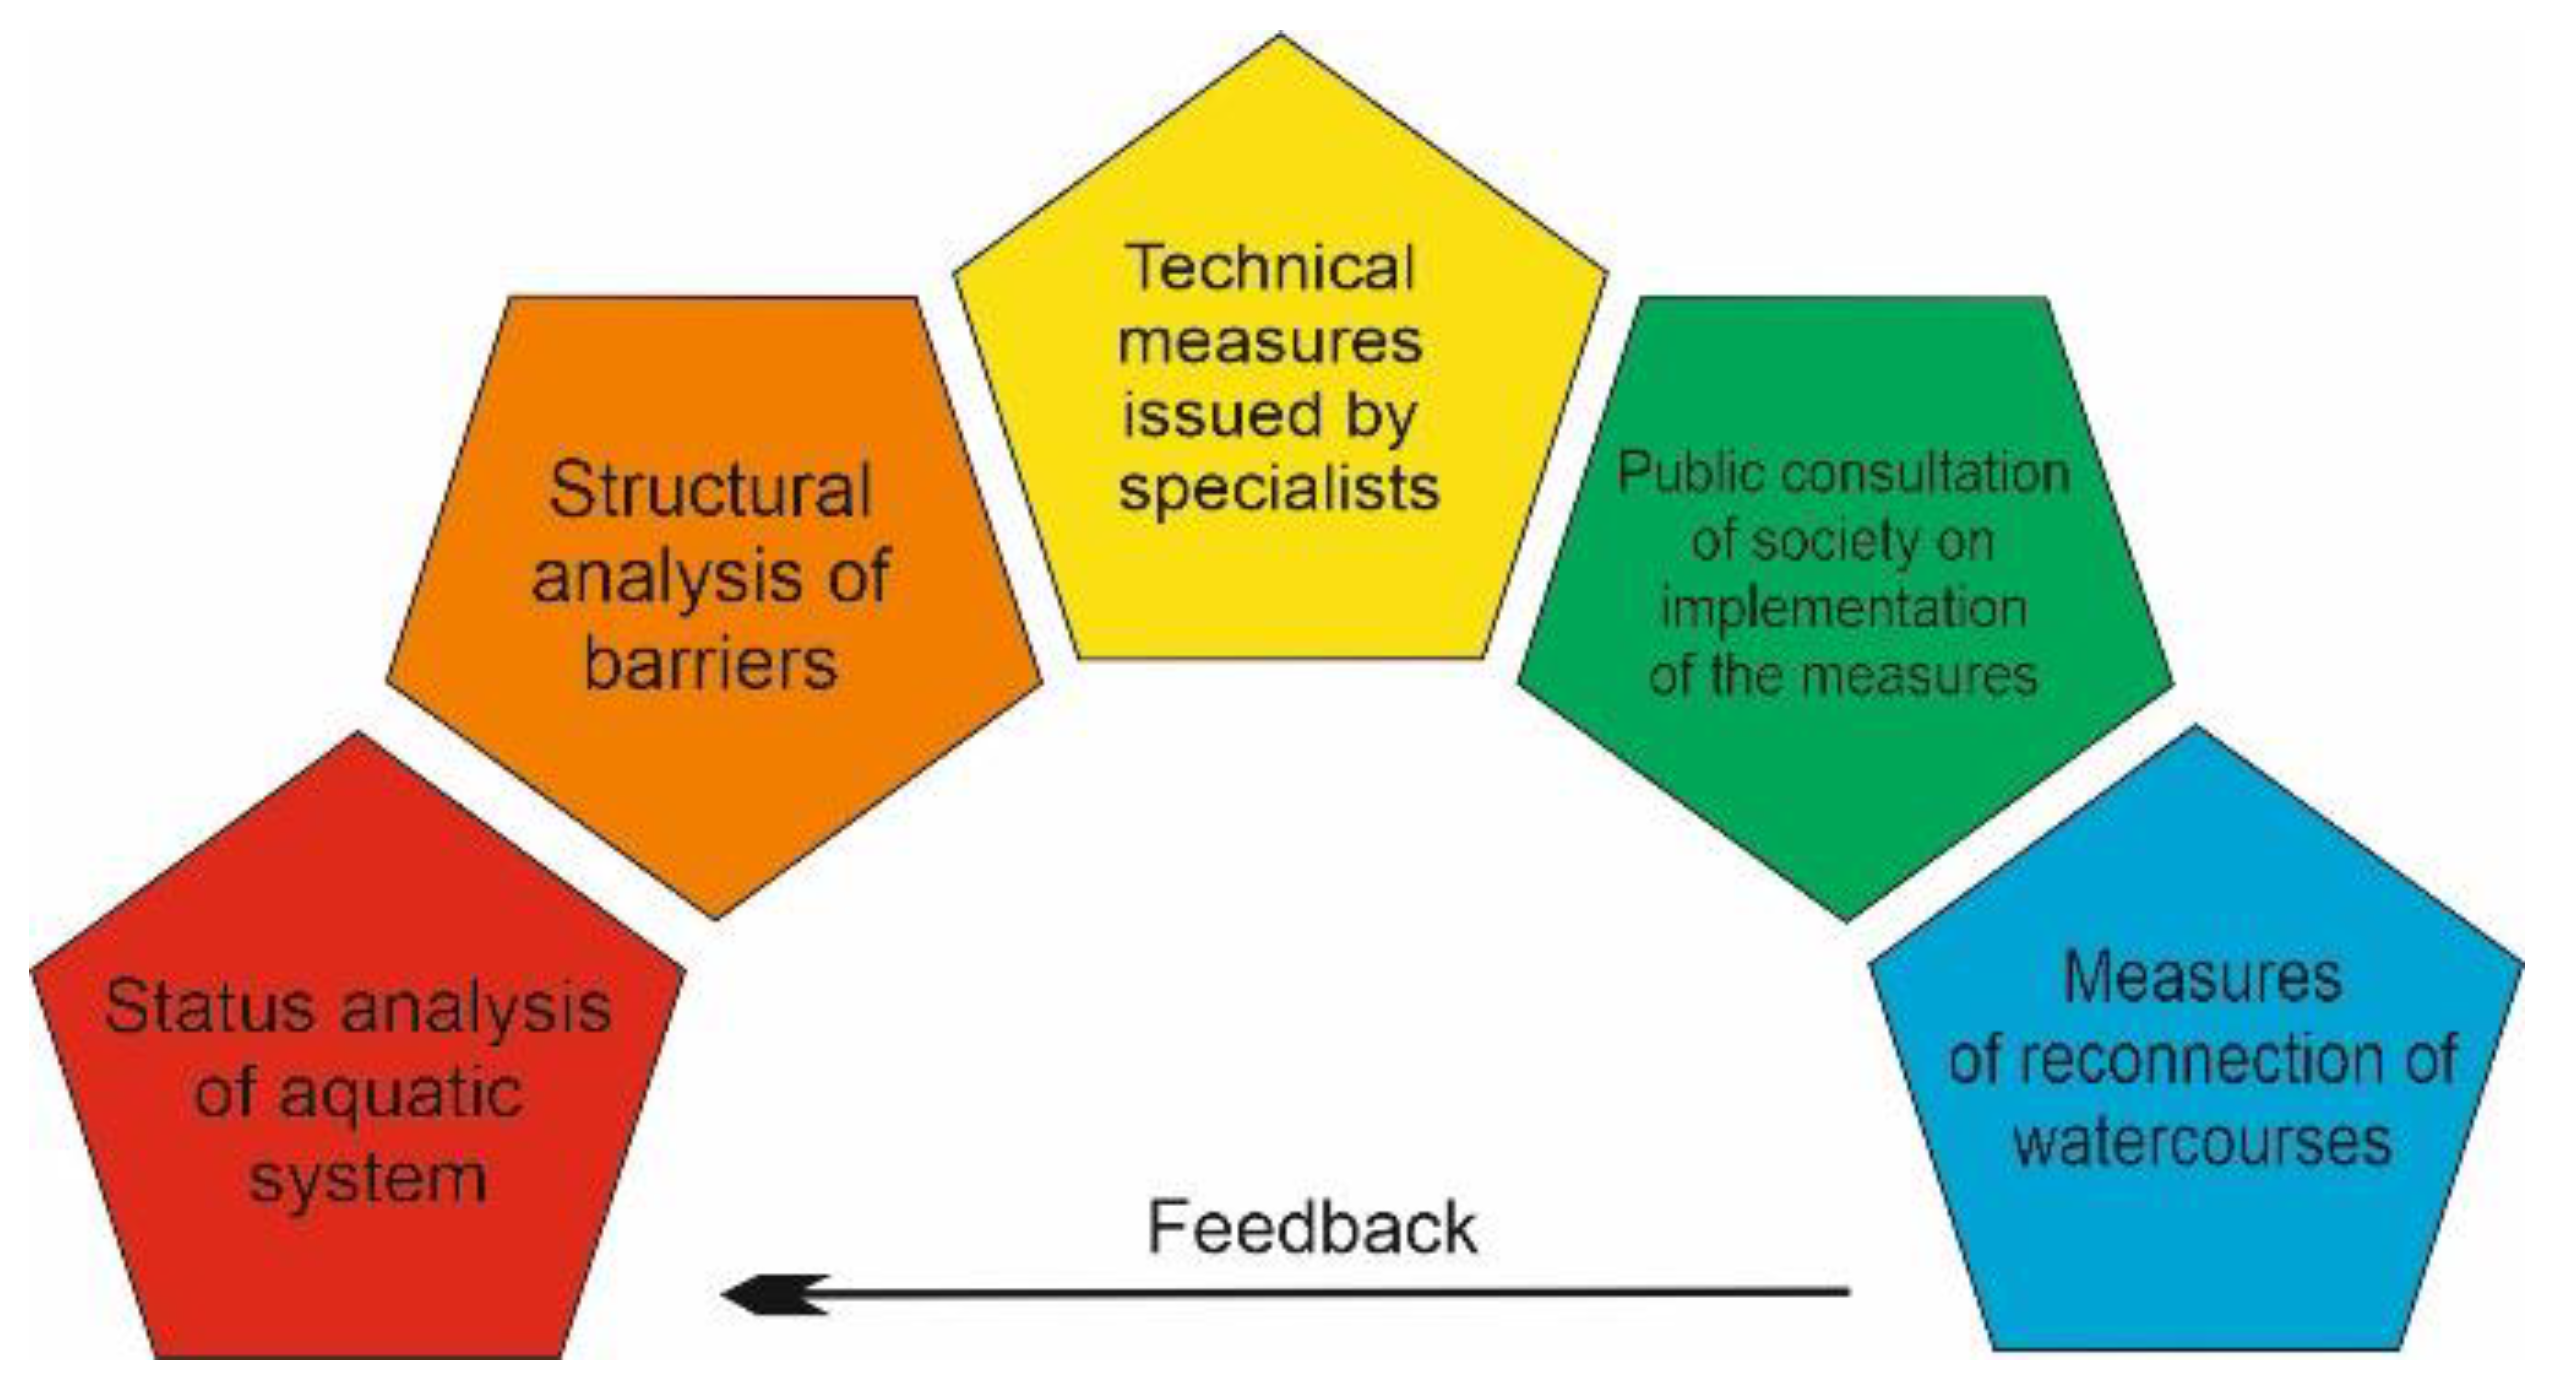
Redefining the role of local communities could lead to the optimization of ecological rehabilitation processes by integrating relevant information from local communities in assisting decisions on the management of the affected environment [4,64]. Given the importance of longitudinal connectivity of rivers for human communities, their perception of the optimization of this attribute of river systems can lead to the development of territorial management systems that add information from stakeholders who are directly affected by ecological imbalances generated by breaks in longitudinal connectivity to the decision-making process (Figure 7).
Community perception analysis can add to research on the impact of barriers that are built on rivers and on the connectivity of a river network [11,65], and it can complement a range of methodologies for analyzing the territorial context, such as fractal analysis or spatial modeling, the relevance of which are highlighted in numerous studies [66,67,68,69,70,71,72,73,74,75]. Also, perceptions of longitudinal connectivity provide relevant information on the ecological quality of river sections [39,75,76].
Future studies should focus on integrating perceptual analyses of the longitudinal connectivity of rivers into spatial management strategies aimed at optimizing connectivity, thereby ensuring that ecological optimization decisions are assisted. Perception analyses can also contribute to an optimal relationship between the longitudinal and social connectivity of rivers.
The number of responses was 511. This could be considered a small number; however, the statistical error margin on this study was minimal. Only people with access to online media could respond to the study. This selection filtered the participants to those who have a higher degree of information access.
The results indicate that consultation with civil society is necessary in the development of river connectivity and ecological restoration strategies. In this way, measures can be more easily supported and accepted by those who will become the direct beneficiaries of the resulting ecosystem services and biodiversity [77].
5. Conclusions
This survey indicates that people would normally allocate more money to increasing the quality of the aquatic environment in general and less to specific one-off actions such as fish ladders (fish ways), which in themselves increase biodiversity and, therefore, the quality of the aquatic environment. The same applies to actions to conserve native fish species and increase the number of individuals in these populations. Younger interviewees tend to give more money to improve the quality of the aquatic environment and increase fish abundance, while the older group is the only one not to allocate large amounts of money to this. This may be due to either a more detailed knowledge of environmental issues or to the fact that they are not forced to allocate money to other pressing needs (housing payments, cars, medical services, etc.).
Even if civil society shows a willingness to get involved in actions to protect the aquatic environment, most of them believe that environmental authorities should be particularly involved in these actions (84%). Thus, an increase in the scientific knowledge of the population and in the number of public campaigns would be recommended to improve their awareness of the ecological state of rivers. The message should be conveyed to the public, and not only among specialists, so that restoration of connectivity is publicly demanded in river conservation programs.
Author Contributions
Conceptualization, D.C.D. (Daniel Constantin Diaconu). and D.P.; methodology, D.C.D. (Dragoș Cristian Diaconu) and A.A.; software, A.A. and D.C.D. (Dragoș Cristian Diaconu); validation, D.C.D. (Daniel Constantin Diaconu) and F.T.; formal analysis, D.C.D. (Daniel Constantin Diaconu), A.A., A.R.G. and D.P.; investigation, D.C.D. (Dragoș Cristian Diaconu), F.T. and A.R.G.; data curation, F.T., D.C.D. (Dragoș Cristian Diaconu) and D.P.; writing—original draft preparation, D.C.D. (Daniel Constantin Diaconu), A.A. and D.P.; writing—review and editing, D.C.D. (Dragoș Cristian Diaconu) and D.P.; visualization, D.C.D. (Daniel Constantin Diaconu), F.T. and D.P. All authors have read and agreed to the published version of the manuscript.
Funding
This research received no external funding.
Data Availability Statement
Data is contained within the article.
Conflicts of Interest
The authors declare no conflicts of interest.
References
- Amoros, C.; Bornette, G. Connectivity and biocomplexity in waterbodies of riverine floodplains. Freshw. Biol. 2002, 47, 761–776. [Google Scholar] [CrossRef]
- Radinger, J.; Hölker, F.; Horký, P.; Slavík, O.; Wolter, C. Improved river continuity facilitates fishes’ abilities to track future environmental changes. J. Environ. Manag. 2018, 208, 169–179. [Google Scholar] [CrossRef]
- Hermoso, V.; Kennard, M.; Linke, S. Integrating multidirectional connectivity requirements in systematic conservation planning for freshwater systems. Divers. Distrib. 2012, 18, 448–458. [Google Scholar] [CrossRef]
- Liu, Y.; Cui, B.; Du, J.; Wang, Q.; Yu, S.; Yang, W. A method for evaluating the longitudinal functional connectivity of a river–lake–marsh system and its application in China. Hydrol. Process. 2020, 34, 5278–5297. [Google Scholar] [CrossRef]
- Vagheei, H.; Laini, A.; Vezza, P.; Palau-Salvador, G.; Boano, F. Ecohydrologic modeling using nitrate, ammonium, phosphorus, and macroinvertebrates as aquatic ecosystem health indicators of Albaida Valley (Spain). J. Hydrol. Reg. Stud. 2022, 42, 101155. [Google Scholar] [CrossRef]
- da Silva, D.F.M.; da Silva, L.M.L.; Garnier, J.; Araújo, D.F.; Mulholland, D.S. Linking multivariate statistical methods and water quality indices to evaluate the natural and anthropogenic geochemical processes controlling the water quality of a tropical watershed. Environ. Monit. Assess. 2023, 195, 1240. [Google Scholar] [CrossRef]
- Shi, J. Identifying the influence of natural and human factors on seasonal water quality in China: Current situation of China’s water environment and policy impact. Environ. Sci. Pollut. Res. 2023, 30, 104852–104869. [Google Scholar] [CrossRef]
- Li, Y.; Mi, W.; Ji, L.; He, Q.; Yang, P.; Xie, S.; Bi, Y. Urbanization and agriculture intensification jointly enlarge the spatial inequality of river water quality. Sci. Total Environ. 2023, 20, 162559. [Google Scholar] [CrossRef]
- Callow, J.N.; Smettem, K.R.J. The effect of farm dams and constructed banks on hydrologic connectivity and runoff estimation in agricultural landscapes. Environ. Model. Softw. 2009, 24, 959–968. [Google Scholar]
- Bracken, L.J.; Wainwright, J.; Ali, G.A.; Tetzlaff, D.; Smith, M.W.; Reaney, S.M.; Roy, A.G. Concepts of hydrological connectivity: Research approaches, pathways and future agendas. Earth-Sci. Rev. 2013, 119, 17–34. [Google Scholar]
- Segurado, P.; Branco, P.; Ferreira, M.T. Prioritizing restoration of structural connectivity in rivers: A graph-based approach. Landsc. Ecol. 2013, 28, 1231–1238. [Google Scholar]
- Wohl, E. Connectivity in rivers. Prog. Phys. Geogr. 2017, 41, 345–362. [Google Scholar] [CrossRef]
- Deng, X.; Xu, Y.; Han, L.; Song, S.; Xu, G.; Xiang, J. Spatial-temporal changes in the longitudinal functional connectivity of river systems in the Taihu Plain, China. J. Hydrol. 2018, 566, 846–859. [Google Scholar] [CrossRef]
- Kennedy, T.A.; Naeem, S.; Howe, K.M.; Knops, J.M.H.; Tilman, D.; Reich, P. Biodiversity as a Barrier to Ecological Invasion. Nature 2002, 417, 636–638. [Google Scholar] [CrossRef]
- Costanza, R.; de Groot, R.; Sutton, P.; van der Ploeg, S.; Anderson, S.J.; Kubiszewski, I.; Farber, S.; Kerry, R.; Turner, K. Changes in the Global Value of Ecosystem Services. Glob. Environ. Chang. 2014, 26, 152–158. [Google Scholar] [CrossRef]
- Mahmoud, M.; Liu, Y.; Hartmann, H.; Stewart, S.; Wagener, T.; Semmens, D.; Stewart, R.; Gupta, H.; Dominguez, D.; Dominguez, F.; et al. A Formal Framework for Scenario Development in Support of Environmental Decision-Making. Environ. Model. Softw. 2009, 24, 798–808. [Google Scholar] [CrossRef]
- Fullerton, A.; Burnett, K.; Steel, E.; Flitcroft, R.; Pess, G.; Feist, B.; Torgersen, C.; Miller, D.; Sanderson, B. Hydrological connectivity for riverine fish: Measurement challenges and research opportunities. Freshw. Biol. 2010, 55, 2215–2237. [Google Scholar] [CrossRef]
- Couvet, D.; Jiguet, F.; Julliard, R.; Levrel, H.; Teyssèdre, A. Enhancing citizen contributions to biodiversity science and public policy. Interdiscip. Sci. Rev. 2008, 31, 95–103. [Google Scholar]
- Costanza, R.; d’Arge, R.; De Groot, R.; Farber, S.; Grasso, M.; Hannon, B.; Limburg, K.; Naeem, S.V.; O’Neil, R.; Paruelo, J.G.; et al. The Value of the World’s Ecosystem Services and Natural Capital. Nature 1997, 387, 253–260. [Google Scholar] [CrossRef]
- Jansson, R.; Nilsson, C.; Malmqvist, B. Restoring Freshwater Ecosystems in Riverine Landscapes: The Roles of Connectivity and Recovery Processes. Freshw. Biol. 2007, 52, 589–596. [Google Scholar] [CrossRef]
- Boyé, H.; de Vivo, M. The Environmental and Social Acceptability of Dams. Field Actions Sci. Rep. 2016, 14, 32–37. Available online: http://journals.openedition.org/factsreports/4055 (accessed on 25 January 2024).
- Verkerk, P.; Sánchez, A.; Libbrecht, S.; Broekman, A.; Bruggeman, A.; Daly-Hassen, H.; Giannkis, E.; Jebari, S.; Kok, K.; Klemencic, A.K.; et al. A Participatory Approach for Adapting River Basins to Climate Change. Water 2017, 9, 958. [Google Scholar] [CrossRef]
- Lindqvist, A.N.; Fornell, R.; Prade, T.; Khalil, S.; Tufvesson, L.; Kopainsky, B. Impacts of future climate on local water supply and demand—A socio-hydrological case study in the Nordic region. J. Hydrol. Reg. Stud. 2022, 41, 101066. [Google Scholar] [CrossRef]
- Pringle, C. What is hydrologic connectivity and why is it ecologically important? Hydrol. Process 2003, 17, 2685–2689. [Google Scholar] [CrossRef]
- Fencl, J.; Mather, M.; Costigan, K.; Daniels, M. How Big of an Effect Do Small Dams Have? Using Geomorphological Footprints to Quantify Spatial Impact of Low-Head Dams and Identify Patterns of Across-Dam Variation. PLoS ONE 2015, 10, e0141210. [Google Scholar] [CrossRef]
- Branco, P.; Amaral, S.D.; Ferreira, M.T.; Santos, J.M. Do small Barriers Affect the Movement of Freshwater Fish by Increasing Residency? Sci. Total Environ. 2017, 581–582, 486–494. [Google Scholar] [CrossRef]
- Anderson, E.; Jenkins, C.; Heilpern, S.; Maldonado-Ocampo, J.; Carvajal-Vallejos, F.; Encalada, A.; Rivadeneira, J.; Hidalgo, M.; Cañas, C.; Ortega, H.; et al. Fragmentation of Andes-to-Amazon connectivity by hydropower dams. Sci. Adv. 2018, 4, eaao1642. [Google Scholar] [CrossRef]
- Jungwirth, M.; Muhar, S.; Schmutz, S. Fundamentals of fish ecological integrity and their relation to the extended serial discontinuity concept. Hydrobiologia 2000, 422–423, 85–97. [Google Scholar] [CrossRef]
- Garcia de Leaniz, C. Weir Removal in Salmonid Streams: Implications, Challenges and Practicalities. Hydrobiologia 2008, 609, 83–96. [Google Scholar] [CrossRef]
- Holmquist, J.G.; Schmidt-Gengenbach, J.; Yoshioka, B.B. High dams and marine-freshwater linkages: Effects on native and introduced fauna in the caribbean. Conserv. Biol. 1998, 12, 621–630. [Google Scholar] [CrossRef]
- Limburg, K.E.; Waldman, J.R. Dramatic Declines in North Atlantic Diadromous Fishes. BioScience 2009, 59, 955–965. [Google Scholar] [CrossRef]
- González-Ferreras, A.; Bertuzzo, E.; Barquín, J.; Carraro, L.; Alonso, C.; Rinaldo, A. Effects of altered river network connectivity on the distribution of Salmo trutta: Insights from a metapopulation model. Freshw. Biol. 2019, 64, 1877–1895. [Google Scholar] [CrossRef]
- Fernández, S.; Rodríguez-Martínez, S.; Martínez, J.L.; Garcia-Vazquez, E.; Ardura, A. How Can eDNA Contribute in Riverine Macroinvertebrate Assessment? A Metabarcoding Approach in the Nalón River (Asturias, Northern Spain). Environ. DNA 2019, 1, 385–401. [Google Scholar] [CrossRef]
- Clavero, M.; Blanco-Garrido, F.; Prenda, J. Fish Fauna in Iberian Mediterranean River Basins: Biodiversity, Introduced Species and Damming Impacts. Aquat. Conserv. Mar. Freshw. Ecosyst. 2004, 14, 575–585. [Google Scholar]
- Johnson, P.T.; Olden, J.D.; Vander Zanden, M.J. Dam Invaders: Impoundments Facilitate Biological Invasions into Freshwaters. Front. Ecol. Environ. 2008, 6, 357–363. [Google Scholar]
- Santos, J.M.; Reino, L.; Porto, M.; Oliveira, J.; Pinheiro, P.; Almeida, P.R.; Cortes, R.; Ferreira, M.T. Complex size-dependent habitat associations in potamodromous fish species. Aquat. Sci. 2011, 73, 233–245. [Google Scholar]
- Wohl, E. Forgotten Legacies: Understanding and Mitigating Historical Human Alterations of River Corridors. Water Resour. Res. 2019, 55, 5181–5201. [Google Scholar] [CrossRef]
- Shaw, E.; Coldwell, D.; Cox, A.; Duffy, M.; Firth, C.; Fulton, B.; Goodship, S.; Hyslop, S.; Rowley, D.; Walker, R.; et al. Urban Rivers Corridors in the Don Catchment, UK: From Ignored, Ignoble and Industrial to Green, Seen and Celebrated. Sustainability 2021, 13, 7646. [Google Scholar] [CrossRef]
- Wohl, E.; Rathburn, S.; Dunn, S.; Iskin, E.; Katz, A.; Marshall, A.; Means-Brous, M.; Scamardo, J.; Triantafillou, S.; Uno, H. Geomorphic context in process-based river restoration. River Res. Appl. 2024, 40, 1–19. [Google Scholar] [CrossRef]
- Kemp, P.S.; O’Hanley, J.R. Procedures for evaluating and priori tising the, removal of fish passage barriers: A synthesis. Fish. Manag. Ecol. 2010, 17, 297–322. [Google Scholar]
- Pe’er, G.; Henle, K.; Dislich, C.; Frank, K. Breaking functional connectivity into components: A novel approach using an individ ual-based model, and first outcomes. PLoS ONE 2011, 6, e22355. [Google Scholar]
- Eros, T.; Olden, J.D.; Schick, R.S.; Schmera, D.; Fortin, M.-J. Characterizing connectivity relationships in freshwaters using patch based graphs. Landsc. Ecol. 2012, 27, 303–317. [Google Scholar]
- McKay, J.K.; Kuntz, J.; Naswall, K. The effect of affective commitment, communication and participation on resistance to change: The role of change readiness. N. Z. J. Psychol. 2013, 42, 29–40. [Google Scholar]
- Kondolf, G.; Boulton, A.; O’Daniel, S.; Poole, G.; Rahel, F.; Stanley, E.; Wohl, E.; Bång, Å.; Carlström, J.; Cristoni, C.; et al. Process-Based Ecological River Restoration: Visualizing Three-Dimensional Connectivity and Dynamic Vectors to Recover Lost Linkages. Ecol. Soc. 2006, 11, 1–16. [Google Scholar] [CrossRef]
- Wainwright, J.; Turnbull, L.; Ibrahim, T.; Lexartza-Artza, I.; Thornton, S.; Brazier, R. Linking environmental régimes, space and time: Interpretations of structural and functional connectivity. Geomorphology 2008, 126, 387–404. [Google Scholar] [CrossRef]
- Rodeles, A.A.; Galicia, D.; Miranda, R. A new method to include fish biodiversity in river connectivity indices with applications in dam impact assessments. Ecol. Indic. 2020, 117, 106605–106614. [Google Scholar] [CrossRef]
- Hermida, M.A.; Cabrera-Jara, N.; Osorio, P.; Cabrera, S. Methodology for the assessment of connectivity and comfort of urban rivers. Cities 2019, 95, 102376. [Google Scholar] [CrossRef]
- Negi, G.C.S.; Punetha, D. People’s perception on impacts of hydro-power projects in Bhagirathi river valley, India. Environ. Monit. Assess. 2017, 189, 138. [Google Scholar] [CrossRef]
- Tomáš, G.; Václav, Š.; Stanislav, R. Impact of check dam series on coarse sediment connectivity. Geomorphology 2021, 377, 107595. [Google Scholar] [CrossRef]
- Fernandez, S.; Arboleya, E.; Dopico, E.; Garcia-Vazquez, E. Dams in South Europe: Socio-environmental approach and eDNA-metabarcoding to study dam acceptance and ecosystem health. Wetl. Ecol. Manag. 2022, 30, 341–355. [Google Scholar] [CrossRef]
- Kondolf, G.M.; Podolak, K. Urban rivers: Landscapes of leisure and consumption. In Globalization and Metropolization—Theory and Practice from Europe’s West Coast; Santos, P.M., Seixas, P.C., Eds.; Berkeley Public Policy Press, Institute of Governmental Studies: Berkeley, CA, USA, 2014; pp. 33–44. [Google Scholar]
- Kondolf, G.M.; Pinto, P.J. The social connectivity of urban rivers. Geomorphology 2017, 277, 182–196. [Google Scholar] [CrossRef]
- National Institute of Statistics of Romania. Available online: https://insse.ro/cms/en (accessed on 10 January 2024).
- National Administration of Romanian Waters. Available online: https://rowater.ro/activitatea-institutiei/departamente/managementul-european-integrat-resurse-de-apa/planurile-de-management-ale-bazinelor-hidrografice/planuri-de-management-nationale/ (accessed on 11 January 2024).
- European Commission 2000 Directive 2000/60/EC of the European Parliament and of the Council Establishing a Framework for Community Action in the Field of Water Policy. OJ L327. 22 December 2000. Available online: https://eur-lex.europa.eu/legal-content/en/ALL/?uri=CELEX%3A32000L0060 (accessed on 10 January 2024).
- Questionnaire on River Connectivity. Available online: https://forms.gle/DCSr39enTMBdszCT7 (accessed on 7 January 2024).
- Thode, H.C. Testing for Normality (Statistics: Textbooks and Monographs), 1st ed.; CRC Press: Boca Raton, FL, USA, 2002. [Google Scholar] [CrossRef]
- Razali, N.M.; Wah, Y.B. Power comparisons of Shapiro-Wilk, Kolmogorov-Smirnov, Lilliefors and Anderson-Darling tests. J. Stat. Model. Anal. 2011, 2, 21–33. [Google Scholar]
- Bagdonavičius, V.B.; Levuliene, R.J.; Nikulin, M.S. Chi-Squared Goodness-of-Fit Tests for Parametric Accelerated Failure Time Models. Commun. Stat. Theory Methods 2013, 42, 2768–2785. [Google Scholar] [CrossRef]
- Chaudhuri, A.; Pal, S. A Comprehensive Textbook on Sample Surveys; Indian Statistical Institute Series; Springer: Singapore, 2022. [Google Scholar] [CrossRef]
- Eichhorn, J. Survey Research and Sampling; Sage Research Methods, The SAGE Quantitative Research Kit; SAGE Publications Ltd.: New York, NY, USA, 2021. [Google Scholar] [CrossRef]
- Hair, J.F.; Hult, G.T.M.; Ringle, C.M.; Sarstedt, M.A. Primer on Partial Least Squares Structural Equation Modeling (PLS-SEM), 3rd ed.; Sage: Thousand Oaks, CA, USA, 2022. [Google Scholar]
- Tomczak, M.T.; Tomczak, E. The Need to Report Effect Size Estimates Revisited. An Overview of Some Recommended Measures of Effect Size. Trends Sport Sci. 2014, 1, 19–25. [Google Scholar]
- Lejon, A.G.C.; Malm Renöfält, B.; Nilsson, C. Conflicts Associated with Dam Removal in Sweden. Ecol. Soc. 2009, 14, 4. [Google Scholar] [CrossRef]
- Zhang, C.; Peng, Z.; Tang, C.; Zhang, S. Evaluation of river longitudinal connectivity based on landscape pattern and its application in the middle and lower reaches of the Yellow River, China. Environ. Sci. Pollut. Res. 2022, 30, 30779–30792. [Google Scholar]
- Peptenatu, D.; Merciu, C.; Merciu, G.; Draghici, C.; Cercleux, L. Specific features of environment risk management in emerging territorial structures. Carpathian J. Earth Environ. Sci. 2012, 7, 135–143. [Google Scholar]
- Petrișor, A.I.; Andronache, I.; Petrisor, L.E.; Ciobotaru, A.M.; Peptenatu, D. Assessing the fragmentation of the green infrastructure in Romanian cities using fractal models and numerical taxonomy. Procedia Environ. Sci. 2016, 32, 110–123. [Google Scholar] [CrossRef]
- Drăghici, C.C.; Andronache, I.; Ahammer, H.; Peptanatu, D.; Pintilii, R.D.; Ciobotaru, A.-M.; Simion, A.; Dobrea, R.C.; Diaconu, D.C.; Vișan, M.-C.; et al. Spatial evolution of forest areas in the northern Carpathian Mountains of Romania. Acta Agric. Slov. 2017, 22, 95–106. [Google Scholar]
- Andronache, I.; Fensholt, R.; Ahammer, H.; Ciobotaru, A.-M.; Pintilii, R.-D.; Peptenatu, D.; Drăghici, C.C.; Diaconu, D.C.; Radulović, M.; Pulighe, G.; et al. Assessment of Textural Differentiations in Forest Resources in Romania Using Fractal Analysis. Forests 2017, 8, 54. [Google Scholar] [CrossRef]
- Andronache, I.; Marin, M.; Fischer, R.; Ahammer, H.; Radulovic, M.; Ciobotaru, A.M.; Jelinek, H.F.; Di Ieva, A.; Pintilii, R.-D.; Drăghici, C.-C.; et al. Dynamics of Forest Fragmentation and Connectivity Using Particle and Fractal Analysis. Sci. Rep. 2019, 9, 12228. [Google Scholar] [CrossRef]
- Diaconu, D.C.; Andronache, I.; Pintilii, R.D.; Brețcan, P.; Simion, A.G.; Drăghici, C.C.; Gruia, K.A.; Grecu, A.; Marin, M.; Peptenatu, D. Using fractal fragmentation and compaction index in analysis of the deforestation process in Bucegi Mountains Group, Romania. Carpathian J. Earth Environ. Sci. 2019, 14, 431–438. [Google Scholar] [CrossRef]
- Diaconu, D.C.; Peptenatu, D.; Tanislav, T.; Mailat, E. The importance of the number of points, transect location and interpolation techniques in the analysis of bathymetric measurements. J. Hydrol. 2019, 570, 774–785. [Google Scholar]
- Popa, M.C.; Simion, A.G.; Peptenatu, D.; Dima, C.; Drăghici, C.C.; Florescu, M.S.; Dobrea, R.C.; Diaconu, D.C. Spatial assessment of flash-flood vulnerability in the Moldova river catchment (N Romania) using the FFPI. J. Flood Risk Manag. 2020, 13, e12624. [Google Scholar] [CrossRef]
- Simion, A.G.; Andronache, I.; Ahammer, H.; Marin, M.; Loghin, V.; Nedelcu, I.D.; Popa, M.C.; Peptenatu, D.; Jelinek, H.F. Particularities of Forest Dynamics Using Higuchi Dimension. Parâng Mountains as a Case Study. Fractal Fract. 2021, 5, 96. [Google Scholar] [CrossRef]
- Larinier, M. Environmental Issues, Dams and Fish Migration. Dams, Fish and Fisheries, Opportunities, Challenges and Conflict Resolution; Marmulla, G., Ed.; FAO Fisheries Technical Paper 419; FAO: Rome, Italy, 2001; pp. 45–89. [Google Scholar]
- Côté, D.; Kehler, D.G.; Bourne, C.; Wiersma, Y.F. A new measure of longitudinal connectivity for stream networks. Landsc. Ecol. 2009, 24, 101–113. [Google Scholar]
- Hackbart, V.C.S.; de Lima, G.T.N.P.; Dos Santos, R.F. Theory and Practice of Water Ecosystem Services Valuation: Where Are We Going? Ecosyst. Serv. 2017, 23, 218–227. [Google Scholar] [CrossRef]
Figure 1.
Flowchart of study.

Figure 2.
Age distribution for women (F) and men (M), expressed in percentages.

Figure 3.
Distribution of amounts (in EUR) per category.

Figure 4.
Distribution of amounts (in EUR) based on level of education for building fish migration passages.
Figure 4.
Distribution of amounts (in EUR) based on level of education for building fish migration passages.

Figure 5.
Distribution of the amount of money (in EUR) regarding improvement in fish stocks for fishing purposes by age intervals.
Figure 5.
Distribution of the amount of money (in EUR) regarding improvement in fish stocks for fishing purposes by age intervals.

Figure 6.
Distribution of the amount of money (in EUR) regarding conservation of all fish species in the river by gender (a) and by residential environment (b).
Figure 6.
Distribution of the amount of money (in EUR) regarding conservation of all fish species in the river by gender (a) and by residential environment (b).

Figure 7.
Decision-making process structure.


Table 1.
Descriptive statistics.
| Index | Mean (EUR) | Standard Deviation (EUR) | Sum (EUR) | Skewness | Kurtosis | |
|---|---|---|---|---|---|---|
| Action | ||||||
| 1. Building fish migration passages | 22.71 | 23.8 | 11,604.6 | 1.7 | 2.8 | |
| 2. Conservation of indigenous fish species and their numbers | 23.05 | 24.3 | 11,779.6 | 1.8 | 2.9 | |
| 3. Improvement in fish stocks for fishing purposes | 24.79 | 25.9 | 12,670.6 | 1.5 | 1.6 | |
| 4. Conservation of all fish species in the river | 25.96 | 27.6 | 13,266.2 | 1.6 | 1.5 | |
| 5. Improving the aquatic environment | 30.47 | 30.7 | 15,572.8 | 1.2 | 0.2 | |
Table 2.
p-values (α) for Mann–Whitney–Wilcoxon and Kruskal–Wallis test.
| Action | 1.Building Fish Migration Passages | 2.Conservation of Indigenous Fish Species and Their Numbers | 3.Improvement in Fish Stocks for Fishing Purposes | 4.Conservation of All Fish Species in the River | 5.Improving the Aquatic Environment | |
|---|---|---|---|---|---|---|
| Socio-Demographic Characteristics | ||||||
| Gender | α > 0.05 | α > 0.05 | α > 0.05 | α < 0.05 small effect size | α > 0.05 | |
| Age | α > 0.05 | α > 0.05 | α < 0.05 small effect size | α > 0.05 | α < 0.05 small effect size | |
| Level of education | α < 0.05 small effect size | α < 0.05 small effect size | α < 0.05 small effect size | α > 0.05 | α < 0.05 small effect size | |
| Residential environment | α > 0.05 | α > 0.05 | α > 0.05 | α < 0.05 small effect size | α > 0.05 | |
Disclaimer/Publisher’s Note: The statements, opinions and data contained in all publications are solely those of the individual author(s) and contributor(s) and not of MDPI and/or the editor(s). MDPI and/or the editor(s) disclaim responsibility for any injury to people or property resulting from any ideas, methods, instructions or products referred to in the content. |
© 2024 by the authors. Licensee MDPI, Basel, Switzerland. This article is an open access article distributed under the terms and conditions of the Creative Commons Attribution (CC BY) license (https://creativecommons.org/licenses/by/4.0/).
Share and Cite
MDPI and ACS Style
Diaconu, D.C.; Ardelean, A.; Toma, F.; Diaconu, D.C.; Gruia, A.R.; Peptenatu, D. An Analysis of Society’s Willingness to Restore the Aquatic Environment in Romania. Water 2024, 16, 1159. https://doi.org/10.3390/w16081159
AMA Style
Diaconu DC, Ardelean A, Toma F, Diaconu DC, Gruia AR, Peptenatu D. An Analysis of Society’s Willingness to Restore the Aquatic Environment in Romania. Water. 2024; 16(8):1159. https://doi.org/10.3390/w16081159
Chicago/Turabian StyleDiaconu, Daniel Constantin, Andreea Ardelean, Florentina Toma, Dragoș Cristian Diaconu, Andrei Rafael Gruia, and Daniel Peptenatu. 2024. "An Analysis of Society’s Willingness to Restore the Aquatic Environment in Romania" Water 16, no. 8: 1159. https://doi.org/10.3390/w16081159
Note that from the first issue of 2016, this journal uses article numbers instead of page numbers. See further details here.