Article

Evaluation of the Effects of Pre-Grouting in Combination with Group Holes on the Risk of Water Inrush through Coal Seam Floors

1
Institute of Resources & Environment, Henan Polytechnic University, Jiaozuo 454000, China
2
Hebei Coal Research Institute Co., Ltd., Xingtai 054000, China
3
Guhanshan Coal Mine, Henan Coking Coal Energy Co., Ltd., Jiaozuo 454000, China
4
Collaborative Innovation Center of Coal Work Safety and Clean-Efficiency Utilization, Jiaozuo 454000, China
*
Author to whom correspondence should be addressed.
Water 2024, 16(8), 1160; https://doi.org/10.3390/w16081160
Submission received: 13 March 2024 / Revised: 14 April 2024 / Accepted: 17 April 2024 / Published: 19 April 2024
(This article belongs to the Special Issue Engineering Hydrogeology Research Related to Mining Activities)

Abstract

:
Coal mine pre-grouting is an important means to reduce the risk of coal seam floor water inrush, and the scientific evaluation of its effects is an important basis for the formulation of water control countermeasures and the realization of safe mining. This paper takes the Guhanshan Mine 15,051 working face grouting project as the research object and selects the grouting volume, the length of the meter grouting, the dry material value in tons of water, the complexity of faults, and the threat of water inrush at the working face as the index factors with which to evaluate the effectiveness of the grouting. The geological structure is quantified by fractal theory. The subjective, objective, and comprehensive weights of the index factors are determined by the analytic hierarchy process, the CRITIC method, and the combination weighting method. The grouting effect on the working face is quantitatively identified by the fuzzy variable set comprehensive evaluation model, and zoning is carried out. The research shows that the areas with optimal, good, qualified, and poor grouting effect at the 15,051 working face account for 4.66%, 74.34%, 21.00%, and 0% of the working face area, respectively, and the proportion at the level of qualified or above accounts for 100%. The safety results at the 15,051 working face prove that the selected evaluation index factors are representative, the established model is reliable, and the evaluation results are in line with actual conditions.

1. Introduction

The geological and hydrogeological conditions of coal mines in China are extremely complex, making China a country with one of the worst records for coal mine water disasters in the world [1,2]. According to incomplete statistics, coal mines in China suffered 153 water disaster accidents from 2008 to 2021 [3], causing tremendous economic losses to the country and its people. Applying underground grouting to reinforce the floor aquitard and transform the aquifer is one of the commonly used methods of coal mine water disaster prevention. However, grouting reinforcement projects have been characterized by concealment and complexity, which makes the evaluation of grouting effectiveness extremely difficult and seriously restricts the application of grouting technology. Therefore, how to scientifically, effectively, and accurately evaluate the effectiveness of grouting is an urgent problem to be solved.
Many academics and engineering technicians in China and elsewhere have conducted research on the evaluation of underground grouting effectiveness. Methods commonly used include geophysical detection methods [4,5,6,7], packer testing [8,9,10], computer numerical simulations [11,12,13,14], and comprehensive evaluation methods, among others.
In the evaluation of grouting effect, geophysical detection methods are usually used as one means of geophysical exploration to detect the scope and effectiveness of grouting comprehensively. Through a geophysical comparison before and after grouting, the grouting effect can be evaluated macroscopically, especially the horizontal and vertical continuity of the grouting area [15,16]. The field water pressure test method can directly reflect the strength and permeability of rock and soil, and can directly evaluate the effectiveness of grouting [17,18]. With recent rapid development of computer applications, greater accuracy and simulation realism have led to increased use of numerical analysis methods to simulate the effects of grouting [19]. Some scholars use numerical simulation software such as FLAC3D 6.0and UDEC 7.00 to simulate and predict the grouting effect [20,21], which provides reference for the evaluation of the reinforcement effect of grouting.
Numerical simulation can thus be used to evaluate grouting effects to some extent, but it should not be regarded as the only evidence. Numerical simulation is merely a predictive model. Its results are influenced by various factors, including the original assumptions, parameter selection, and the settings adopted for the initial conditions. Therefore, for comprehensive analysis of grouting effectiveness, numerical simulation should be combined with other evaluation methods.
Evaluating the overall effectiveness of underground grouting is a multifaceted evaluation problem with many uncertain indicators. The ambiguity of such indicators may lead to an uncertain relationship between indicators and evaluation results. The fuzzy comprehensive evaluation method is based on fuzzy mathematics and has been widely applied to handle fuzzy problems. Jin et al. [22] used the analytic hierarchy process (AHP) cloud model and the fuzzy comprehensive evaluation method to assess the influencing effects of a grouting project at a Pingnan limestone mine. This combination of methods fully considers the ambiguity and randomness of indicator factors, thereby improving the reliability of the results. Subsequent monitoring of the project validated the accuracy of the model. Liu et al. [23] evaluated the curtain grouting effect at a water station by establishing an objective and reasonable fuzzy evaluation method that combines interval intuitive fuzzy sets, prospect theory, and improved D number theory to further increase the diversity range of the evaluation indicators and take full account of the incompleteness of the decision information generated by experts, proving the consistency and superiority of the model. The fuzzy analytic hierarchy process was employed by Zhu et al. [24] to quantify the pre-grouting effects on the Tongluo Mountain tunnel using indicators such as integrity, continuity, and solidity. The results agreed with field test outcomes, providing a reference for similar project evaluations.
In summary, the approaches that has been adopted in studies of the detection and evaluation of grouting effects involving single-factor or single-method qualitative or quantitative analysis have certain limitations. Even when multiple indicators are used to evaluate grouting effectiveness, the reliability of the results is not high due to the lack of scientific and reasoned determination of the weights of each indicator, which restricts the application of grouting technology.
In the present study, the grouting project at workface 15,051 in the ancient Han Mountain coal field in Jiaozuo was selected as the objective. The authors selected the grouting volume, the length of the meter grouting, the value of dry material per ton of water, the complexity of faults, and the threat degree of water inburst at the working face as the evaluation index, and proposed a fuzzy variable set comprehensive evaluation method of grouting effectiveness based on the subjective and objective combination of AHP-CRITIC. While the AHP method retains the expert’s mature experience in weight allocation, the CRITIC method is adopted to increase the objectivity of weight allocation by analyzing the relationship between data, and quantitative evaluation of the grouting effect is carried out based on fuzzy variable set theory, which is more suitable for evaluating objects charactized by uncertainty and complexity. It is anticipated that the findings of this study will provide technical support for the quantitative identification of the grouting effects at workfaces.

2. Research Method

2.1. Fractal Dimension Theory

The fractal dimension theory, also known as the dimension theory, is a mathematical concept that describes the morphology and structure of complex systems. This theory primarily investigates the dimensional properties of fractal objects, including both integer and non-integer dimensions. In geological structure research, the self-similar dimension DS is often used to analyze the complexity of structures, calculated from
D S = l o g N ( a ) l o g ( a ) ,
where N(a) is the number of similar shapes and a is the scale ratio.
The fractal dimension is positively correlated with the complexity of the study object; that is, the larger the fractal dimension, the more complex the study object is considered to be.

2.2. AHP-CRITIC Combination Weighting Method

The AHP [25] is a multi-level factor weight decision-making analysis method used to quantify qualitative problems. This method involves breaking down the objective into multiple factors and organizing these factors into a structured model in a hierarchical manner based on their relationships, influences, and dependencies. This hierarchical structure allows for a systematic analysis of complex decisions by comparing and ranking factors at different levels.
The CRITIC method [26,27] is an objective weighting technique that determines weights based on the intensity of comparison and the conflict between indicators. This method uses standard deviation to represent the intensity of the comparison between indicators, and correlation coefficients to represent the conflict between them. A large standard deviation of an individual indicator implies greater volatility, hence a higher weighting. Conversely, if the correlation coefficients between indicators are large, it suggests less conflict between them, leading to relatively smaller weightings. The CRITIC method takes both correlation weights and information weights into account, resulting in a more reasonable determination of indicator weights.
The AHP relies on the relative importance of evaluation indicators, which increases the subjectivity of the analysis. By contrast, the CRITIC method uses the inherent properties of the evaluation indicators to calculate weights, which is more objective. Therefore, to establish an optimized combined weighting model that incorporates both subjective and objective weights, a target function was developed on the principle of minimum relative information entropy. The specific target function is
min   F = j = 1 n W j l n W j l n W j + W j j = 1 n l n W j l n W j ,
where F is the information entropy; W j is the subjective weight determined by the AHP; and W j is the objective weight determined by the CRITIC method.
The Lagrange multiplier is used to determine the combined subjective and objective weights, Wj, giving
W j = W j × W j 0.5 j = 1 n W j × W j 0.5 .

2.3. Fuzzy Variable Set Evaluation Model (FVSEM)

The FVSEM is based on fuzzy mathematics and the theory of variable sets. Firstly, it processes the various indicators of the evaluation object by fuzzifying them to convert them into fuzzy values; it then utilizes the theory of variable sets for weighting or combination to obtain the evaluation. The FVSEM is more flexible and reliable than traditional evaluation methods and better adapted to the evaluation of objects with uncertainty and complexity.

2.3.1. Basic Principle

Let there be a fuzzy concept A in the universe of discourse U. For any element u in U, at any point on the continuum of the relative membership function the relative membership degree of u to A is µA(u), and the relative membership of the opposite fuzzy concept AC to A is μ A C ( u ) [28,29].
Let DA(u) be the relative difference degree of u with respect to A, then
D A ( u ) = μ A ( u ) μ A C ( u ) .
Defining the relative difference degree of u with respect to A gives its mapping
D A : D 1 , 1 u | D A 1 , 1 .
It is known from the theory of fuzzy variable sets that
μ A ( u ) + μ A C ( u ) = 1 .
Then, from Equations (5) and (6), the relative membership is
μ A ( u ) = 1 + D A ( u ) 2 .

2.3.2. Membership Degree Model

Let X0 = [a, b] be the attractive domain of fuzzy variable set V on the real axis, X1 = [c, d] be the range domain of fuzzy variable set containing X0, M be the midpoint value of the attractive domain interval [a, b], and let x be the quantized result value of any index at any point on the real axis, using x and X0, The relative position relation of X1 calculates the relative difference degree DA(u). The positional relationship between M and the intervals [a, b] and [c, d] is shown in Figure 1.
When x ∈ [c, M], the relative difference is given by
D A ( u ) = x a M a β ; x ( a , M ) D A ( u ) = x a c a β ; x ( c , a ) ,
and when x ∈ [M, b], the relative difference is given by
D A ( u ) = x b M b β ; x ( M , b ) D A ( u ) = x b d b β ; x ( b , d ) .
When x ∉ [c, d], the relative difference degree DA(u) = −1. If β is a non-negative exponent, the value β = 1 is usually assumed.

2.3.3. Evaluation Model

After determining the relative membership of the evaluation indicators corresponding to the levels based on the membership function, the comprehensive membership degree µr is calculated using the fuzzy variable set evaluation model, expressed as
μ r = 1 1 + j = 1 m w j 1 μ A ( j r ) p j = 1 m w j μ A ( j r ) p α p ,
where j is the index number of the indicator, j = 1, 2, …, m; r is the sequence number of the level, r = 1, 2, …, m; α is the parameter of the optimization criterion, with the least squares criterion given by α = 1 and the least mean squared criterion given by α = 2; and p is the distance parameter (p = 1 for the Hamming distance, p = 2 for the Euclidean distance).
The level feature value H is calculated from
H = r = 1 h μ r r = 1 h μ r r .

2.4. Comprehensive Model Building

The key steps in establishing and applying a fuzzy variable set evaluation model include:
(1) Determining evaluation indicators and weights: First, determine the indicators that need to be evaluated, then determine the weights of each indicator. These can be obtained through expert consultation, analytic hierarchy process, CRITIC, etc.
(2) Establishing the fuzzy variable set: transform each evaluation index into a fuzzy variable set. The variable set consists of a membership function, which describes the shape of the fuzzy set in which the index is located, and a membership value, which represents the value of the index.
(3) Constructing a set of fuzzy rules and carrying out reasoning: Based on expert knowledge or experience, formulate a series of fuzzy rules to describe the influence of various evaluation factors on the evaluation results. The membership value of the evaluation result is derived by matching the actual value of the evaluation index with the membership function.
(4) Synthesizing evaluation results: According to the membership value of the evaluation results obtained by reasoning, the synthesis method is used to synthesize the results into a comprehensive evaluation result. The results can be normalized as needed.
(5) Interpretation and application: Interpret the fuzzy variable set evaluation results to obtain evaluation decisions about evaluation objects.
In summary, the fuzzy variable set evaluation model introduces the concept of variable sets, which is better able to handle situations with many indicators and factors associated with the evaluation objects. It provides a flexible framework for evaluation that may be adjusted to improve its accuracy and applicability if required in specific circumstances (Figure 2).

3. Case Application

3.1. Engineering Background

Working face 15,051 at the Guhanshan mine has an elevation of −386.2 to −341.0 m, a strike length of 1051 to 1060 m (average 1055 m), and a dip width of 107 to 109 m (average 108 m). The dimensions of coal seam No. 21 are stable and between 4.6 and 5.9 m thick (average 5.0 m). There are L8 and L2 limestone aquifers of Taiyuan formation under the coal, and the two aquifers have developed karst fractures and are highly water-rich. It is calculated that the water-inrush coefficient of the limestone floor of the coal seam is between 0.13 and 0.15 MPa/m, exceeding the threshold value of the critical water-inrush coefficient of 0.06 Mpa/m (Figure 3). The coal mining process is always faced with the threat of water inrush from a floor-confined limestone aquifer. In addition, a total of 17 normal faults were found during the exploration and mining of the 15,051 working face, of which two faults run through the working face, where water channels could easily form and allow water inrush from the L8 and L2 limestone aquifers.
In order to ensure the safety of mining at the 15,051 working face, the underground roadway grouting method is used to grout the coal seam floor above the L8 and L2 aquifers. While transforming them into weak aquifers, it also blocks the fault water channel of hydraulic connection between the L8 and L2 limestone aquifers. The position of the grouting layer is shown in Figure 4.
A total of 25 drilling fields (12 transportation lanes and 13 return air lanes) are arranged in the roadways of the 15,051 working face, and 286 construction holes are drilled, as shown in Figure 5. All grouting holes pass through the L8 limestone aquifer, the final hole is the L2 limestone aquifer, and the grouting range covers the entire floor of the working face. The total drilling footage is 33,403 m, and a total of 21,430.01 m3 of dry material is injected.

3.2. Evaluation Index System

In this grouting evaluation project for Guhanshan mine working face 15,051, the selection of indicators was particularly important. The factors influencing the grouting effect are complex and interrelated, yet to some extent independent. It is necessary to combine water-inrush behavior with factors affecting grouting and also to consider the information from the grouting drill holes and the geological conditions [30,31,32]. Factors such as engineering requirements, feasibility, expert opinions, and the reported results of previous research were weighed and selected to determine which influencing factors were appropriate in this case [33,34].
The primary indicators in the final proposed evaluation index system for grouting effectiveness include geological structure, grouting volume, and the water-inrush risk associated with grouting reinforcement of the face. Secondary indicators include the complexity of faults, the volume of grouting, the grouting quantity per meter, the volume of dry material retaining 1 t of water, and the extent of the water-inrush risk. Based on these five indicators, a comprehensive evaluation system for grouting effectiveness was established using a combination of the AHP and CRITIC methods and a fuzzy variable set evaluation model (Figure 6).

3.2.1. Fault Complexity

The extent to which faulting is present affects the value of variables such as grouting quantity and pressure per borehole, and thus effective grouting requires a quantitative evaluation of the faulting complexity at the face to establish a strong foundation. The assessment of fault complexity is a relative concept in which it is necessary to consider many factors in combination. Usually, this takes into account fault plane morphology, slip mode, stress environment, and the forms of displacement, deformation, and extension. Fractal dimension theory can be used to quantitatively characterize the geometric forms and spatial distribution characteristics of faults, which include the length and density of faults and the cross-relationship between cracks, and can comprehensively reflect the complexity of faults, with higher fractal dimension values indicating greater complexity.
Calculating a fractal dimension often involves using the box-counting method, which involves dividing the area occupied by the fractal into square blocks and labeling them with numbers. The similarity ratio a is given the values 1, ½, ¼, and ⅛, and the square blocks are subdivided into 1, 4, 16, and 64 squares, respectively, representing the number of similar shapes N(a). Then, applying Equation (1), a double logarithmic coordinate system [log(a) − logN(a)] can be established, and the slope and correlation coefficient of the line of best fit obtained by a least squares calculation. The absolute value of the slope then represents the fractal dimension.
The 15,051 working face was divided in this way into 203 units measuring 40 m × 40 m, numbers were allocated to the blocks containing faults (Figure 7), and the fractal dimension of each block was then calculated (Table 1).
The fractal dimensions were used to classify the complexity of the faults into four levels: simple, relatively simple, relatively complex, and complex (see Table 2). Among them, a fractal dimension value less than 1 is deemed simple, which means that these faults have a small fractal dimension value, the number of faults is small, the length is short, and the cross-relationship is simple. Such faults have little influence on geological structure and coal seam mining. A fractal dimension between 1 and 1.1 is deemed relatively simple. A fractal dimension between 1.1 and 1.2 is relatively complex, and if a fractal dimension is greater than 1.2, it is complex, with a large number of faults, a long length, and a very complex cross-relationship. Such faults have a significant impact on geological structure and coal seam mining, and strict preventive measures and coping strategies need to be taken.
The fault complexity zones are shown in Figure 8.
The fractal calculations give 58.91% for the simple complexity level, 31.78% for relatively simple, 4.31% for relatively complex, and 5.00% for complex. The average fractal dimension of the faults was 0.9552.
Following the quantitative assessment of fault complexity, a conventional qualitative assessment was conducted to describe the physical characteristics of the fault planes, their branching, displacement and deformation, their surrounding geological conditions, and their network properties. Each of the faults was found to extend in a straight line for a relatively short distance without significant branching, and none exhibited any obvious shear or torsion; the geological background was relatively simple. From this information, the overall complexity of the faults in the 15,051 working face was classed as simple to relatively simple.

3.2.2. Grouting Volume

The volume of grout used reflects the distribution and coverage of grouting materials in the target strata. In general, more highly fractured country rock contains more highly developed pores, fractures, and karst formations, and therefore requires a greater volume of grouting material for better filling, reinforcement, and improvement effects. An isoline map derived from borehole grout volume records for the 15,051 working face are shown in Figure 9.
Figure 9 shows that the volume of grout used in the boreholes at the 15,051 working face ranged from 4 to 3652 m3, averaging 268.10 m3. The coefficient of variation was 1.86, reflecting this considerable range. The development of karst fractures in the working face was heterogeneous. Ninety-six boreholes required grout volumes > 100 m3, accounting for 47.06%. These were primarily located near faults and their zones of influence.

3.2.3. Amount of Grout per Meter of Borehole Length

‘Meter grouting volume’ refers to the weight of grout used per unit length and is commonly used as an indicator for evaluating the effectiveness of grouting, particularly for assessing the penetration and filling effects of narrow features such as fractures. A higher value indicates that the target layer required more reinforcement. The recorded grout weights and final lengths of the grouting boreholes enabled the meter grouting weight for each borehole in the 15,051 working face to be calculated (isolines shown in Figure 10).
Figure 10 shows that the meter grouting weight for the boreholes ranged from 0.0117 to 11.9615 t/m (average 2.9259 t/m), with a coefficient of variation of 1.85, indicating a considerable range of variation. The injectability of the strata in the working face was not uniform. The meter grouting weight near faults and their influence zones exceeded 1 t/m but was less than 1 t/m in other areas.

3.2.4. Dry Material Value per Ton of Water

The dry material-to-water ratio refers to the ratio of the grouting volume to the water inflow, which reflects the concentration of the grout material and its remedying effects. A high dry material-to-water ratio typically indicates a high content of solid components in the grout material for better filling and solidification of the target area, enhancing the stability and strength of the strata. The ratio for the 15,051 working face was calculated based on the grout volume and water inflow records from the grouting boreholes (isolines shown in Figure 11).
Figure 11 shows a dry material-to-water ratio for the boreholes in the 15,051 working face in the range 0.3667 to 52.1532 t/m3 (average 7.1163 t/m3), with a coefficient of variation of 1.24. The ratio near the faults and their influence zones is relatively high, exceeding 5 t/m3, but is lower than 5 t/m3 in other areas.

3.2.5. Threat Level of Water Inrush

The purpose of grouting is to strengthen the strata underlying the coal seam, reinforce faults and seal fractures, and transform the aquifer into a weakly aquiferous or aquiclude layer in order to reduce the risk of water inrush from the coal seam floor. In order to accurately assess the threat degree of water inrush at the working face, the water-inrush coefficient method is often used to judge whether there is a water-inrush threat in the roadway or stope by considering the water pressure value that can be borne per unit thickness of water barrier layer. Due to the reinforcement of the faults beneath the coal seam floor, the critical value for assessing the possibility of water inrush was adjusted from 0.06 to 0.1 MPa/m. The threshold values of the water-inrush coefficient in the safe zone, low-threat zone, high-threat zone, and danger zone are shown in Table 3.
The water-inrush coefficients were calculated based on the records of water pressure, inclination, and the final length of each of the grouting boreholes in the 15,051 working face, the isolines of which are shown in Figure 12.
Figure 12 shows that the danger zone beneath the coal seam no longer existed after reinforcement, with only 2.45% of the area classified as high-threat (red zones in Figure 11), while the low-threat and safe zones accounted for 67.37% and 30.18%, respectively. Comparison with Figure 2 confirms that grouting greatly reduced the risk of water inrush.
To further analyze the degree of water-inrush threat after grouting reinforcement, isolines of the differences between the water-inrush coefficients after grouting and the critical value of 0.1 MPa/m are shown in Figure 13.
Clearly, the water-inrush coefficients beneath the working face after grouting are less than the critical water-inrush coefficient of 0.1 MPa/m, the greatest difference being 0.07 MPa/m. This indicates that the grouting significantly lowered the risk of water inrush.

3.3. Weighting Determination

3.3.1. Subjective Weighting Determination

Regarding the indicator system for the grouting effects at the working face, a judgment matrix was constructed to calculate the weights of the indicators. The judgment matrix R for the first-level indicators is given by
R = 1 1 / 3 1 / 4 3 1 1 / 2 4 2 1
After calculation, the eigenvector w was obtained as (0.1226, 0.5571, 0.3203), and CR = 0.0157 < 0.1, which satisfies the consistency test and indicates that the matrix is reasonable. Similarly, the weights of the secondary indicators at the scheme level were obtained, as shown in Table 4.

3.3.2. Objective Weight Determination

Standardized processing was performed based on the volume of grout used, the amount of grout per meter, and the amount of grout per ton of water. Reverse processing on the complexity of faults and the water inrush coefficient obtained the standardized values of the indicators. The calculated objective weights W of each indicator are shown in Table 5.

3.3.3. Combined Weight

Taking the weights W, obtained using the AHP method, and W , using the CRITIC method, the combined weights of each indicator were determined from Equation (3). The results are shown in Table 6.

3.4. Identification of Grouting Effect

In view of the actual floor grouting at the 15,051 working face of the Guhanshan mine, the grouting effect was divided into four levels, with higher levels indicating better grouting effects; that is, Y = {I, II, III, IV} = {poor, qualified, good, optimal}. The degree of relative difference was then calculated for the positional relationship of the evaluation factor x on the real number axis with X0 and X1 (Figure 1). Therefore, it was particularly important to determine the values of the parameters c, a, M, b, and d. Using the mean-squared error method, the recognition intervals for each evaluation factor were established in each of the four levels, and the parameters c, a, M, b and d were assigned the following values:
I a b = [ 0 , 4 ] [ 4 , 18.2393 ] [ 18.2393 , 268.098 ] [ 268.098 , 517.9568 ] [ 0 , 0.0117 ] [ 0.0117 , 0.0611 ] [ 0.0611 , 0.8042 ] [ 0.8042 , 1.5473 ] [ 0 , 0.0645 ] [ 0.0645 , 2.6996 ] [ 2.6996 , 7.1163 ] [ 7.1163 , 11.55305 ] [ 0.0600 , 0.05368 ] [ 0 . 0664 , 0.0600 ]   [ 0.0791 , 0 . 0664 ] [ 0.0791 , 0.07273 ] [ 1.0525 , 1.1296 ] [ 0.9755 , 1.0525 ] [ 0.8985 , 0.9755 ] [ 0.8215 , 0.8985 ]
I c d = [ 0 , 18.2393 ] [ 0 , 268.0980 ] [ 4 , 517.9568 ] [ 18.2393 , 767.8155 ] [ 0 , 0.0611 ] [ 0 , 0.8042 ] [ 0.0117 , 1.5473 ] [ 0.0611 , 2.2940 ] [ 0 , 0.0410 ] [ 0 , 2.6996 ] [ 0.0645 , 11.5330 ] [ 2.6996 , 15.9498 ] [ 0.0537 , 0.0410 ] [ 0 . 0727 , 0.05368 ]   [ 0.07908 , 0 . 0600 ] [ 0 , 0.0664 ] [ 1.1296 , 1.2836 ] [ 0.8985 , 1.1296 ] [ 0.8215 , 1.0525 ] [ 0 , 0.9755 ]
I M = 2 11.1197 143.1687 393.0274 0.0059 0.03645 0.4327 1.1758 0.0323 1.3281 4.9050 9.3247 0.05686 0 . 0632   0.0664 0.07591 1.0911 1.0140 0.9370 0.8599
After the relative positions of the parameters c, a, M, b, and d were determined, H1-1 was taken as an example to calculate the relative difference degree matrix based on the actual values of its evaluation factors and the relative positions of c, a, M, and b, and the relative difference degree matrix DA(u) was obtained from Equations (8) and (9):
D A ( u ) = 1 0.3112 0.6224 0.6888 1 0.2448 0.4896 0.7512 0.8302 0.3618 0.1698 1 1 0.3398   0.4186 0.2812 1 1 1 0.0524
Subsequently, Equation (7) gave µA(u):
μ A ( u ) = 0 0.3444 0.8112 0.1556 0 0.3776 0.7448 0.1224 0.0849 0.6699 0.4151 0 0 0.1046   0.7093 0.3954 0 0 0 0.4738
The relative membership degree was calculated by combining the membership degree matrix with the corresponding comprehensive weights and performing the operations set out in Equation (10). From Equation (11), the characteristic values of H corresponding to a = 1 and p = 1; a = 2 and p = 1; a = 1 and p = 2; and a = 2 and p = 2 were obtained as (2.9210, 2.9395, 2.8963, 2.9403). The average, H = 2.9242, is the final evaluation result.
Based on the actual situation at the working face and the characteristic values of H, the classification criteria for the grouting effect for the floor of the working face were established as follows: H < 1.5 corresponds to level I, indicating poor grouting effect; 1.5 ≤ H < 2.5 corresponds to level II, indicating qualified grouting effect; 2.5 ≤ H < 3.5 corresponds to level III, indicating good grouting effect; and 3.5 ≤ H ≤ 4 corresponds to level IV, indicating optimal grouting effect. The quantitative recognition diagram for the floor grouting effect at the 15,051 working face is shown in Figure 14.
The areas with optimal, good and qualified grouting effects in Figure 14 account for 4.66%, 74.34% and 21.00% of the working face area, respectively, with no areas of poor grouting effect.

4. Discussion

4.1. Model Reliability Analysis

The accuracy and reliability of the evaluation depends on four aspects: the selection of appropriate indicator factors, their quantification and classification, the determination of weightings, and the feasibility of the method.
(1) Indicator selection: Five common indicators include grouting final pressure, grout volume, permeability coefficient and water absorption rate, borehole water inflow, and water-inrush coefficient. It is generally believed that a good grouting result means that the strength and water resistance properties of the grouted rock layers are significantly improved, and that the risk of water inrush has been reduced accordingly. Based on the experience of water control in northern Chinese coal mines and expert advice, choosing these five factors as evaluation indicators is reasonable.
(2) Indicator quantification and classification: Of the five secondary indicators, the grouting volume, length of grouting in meters, dry material value per ton of water, and water-inrush coefficient are all described directly as numbers. The complexity of fault zones is often quantitatively evaluated using fractal theory [35]. Since all of the secondary indicators can be quantified in this way, classification can be readily carried out.
(3) Indicator weights: The weighting determination adopted a combination of the AHP and CRITIC methods, which retains subjective expert experience in weighting allocation and simultaneously increases its objectivity by analyzing relationships between data. Therefore, the determination of evaluation indicator weightings is feasible.
(4) Choice of evaluation method: The method of fuzzy variable set evaluation is a mathematical tool for dealing with uncertainty, fuzziness, and incomplete information. It is suitable for solving problems with attributes that are difficult to accurately describe using traditional quantitative methods. Compared to other evaluation methods, the indicator partition construction and membership calculation in fuzzy variable set theory are better able to characterize complex nonlinear relationships between indicator factors and grouting effects. There are many indicators for evaluating the grouting effect on the floor of the working face. Some of them, such as the complexity of the faulting pattern, have to be assessed qualitatively and are therefore subjective. Therefore, using the fuzzy variable set evaluation method to evaluate the grouting effect is a rational approach to the actual situation.

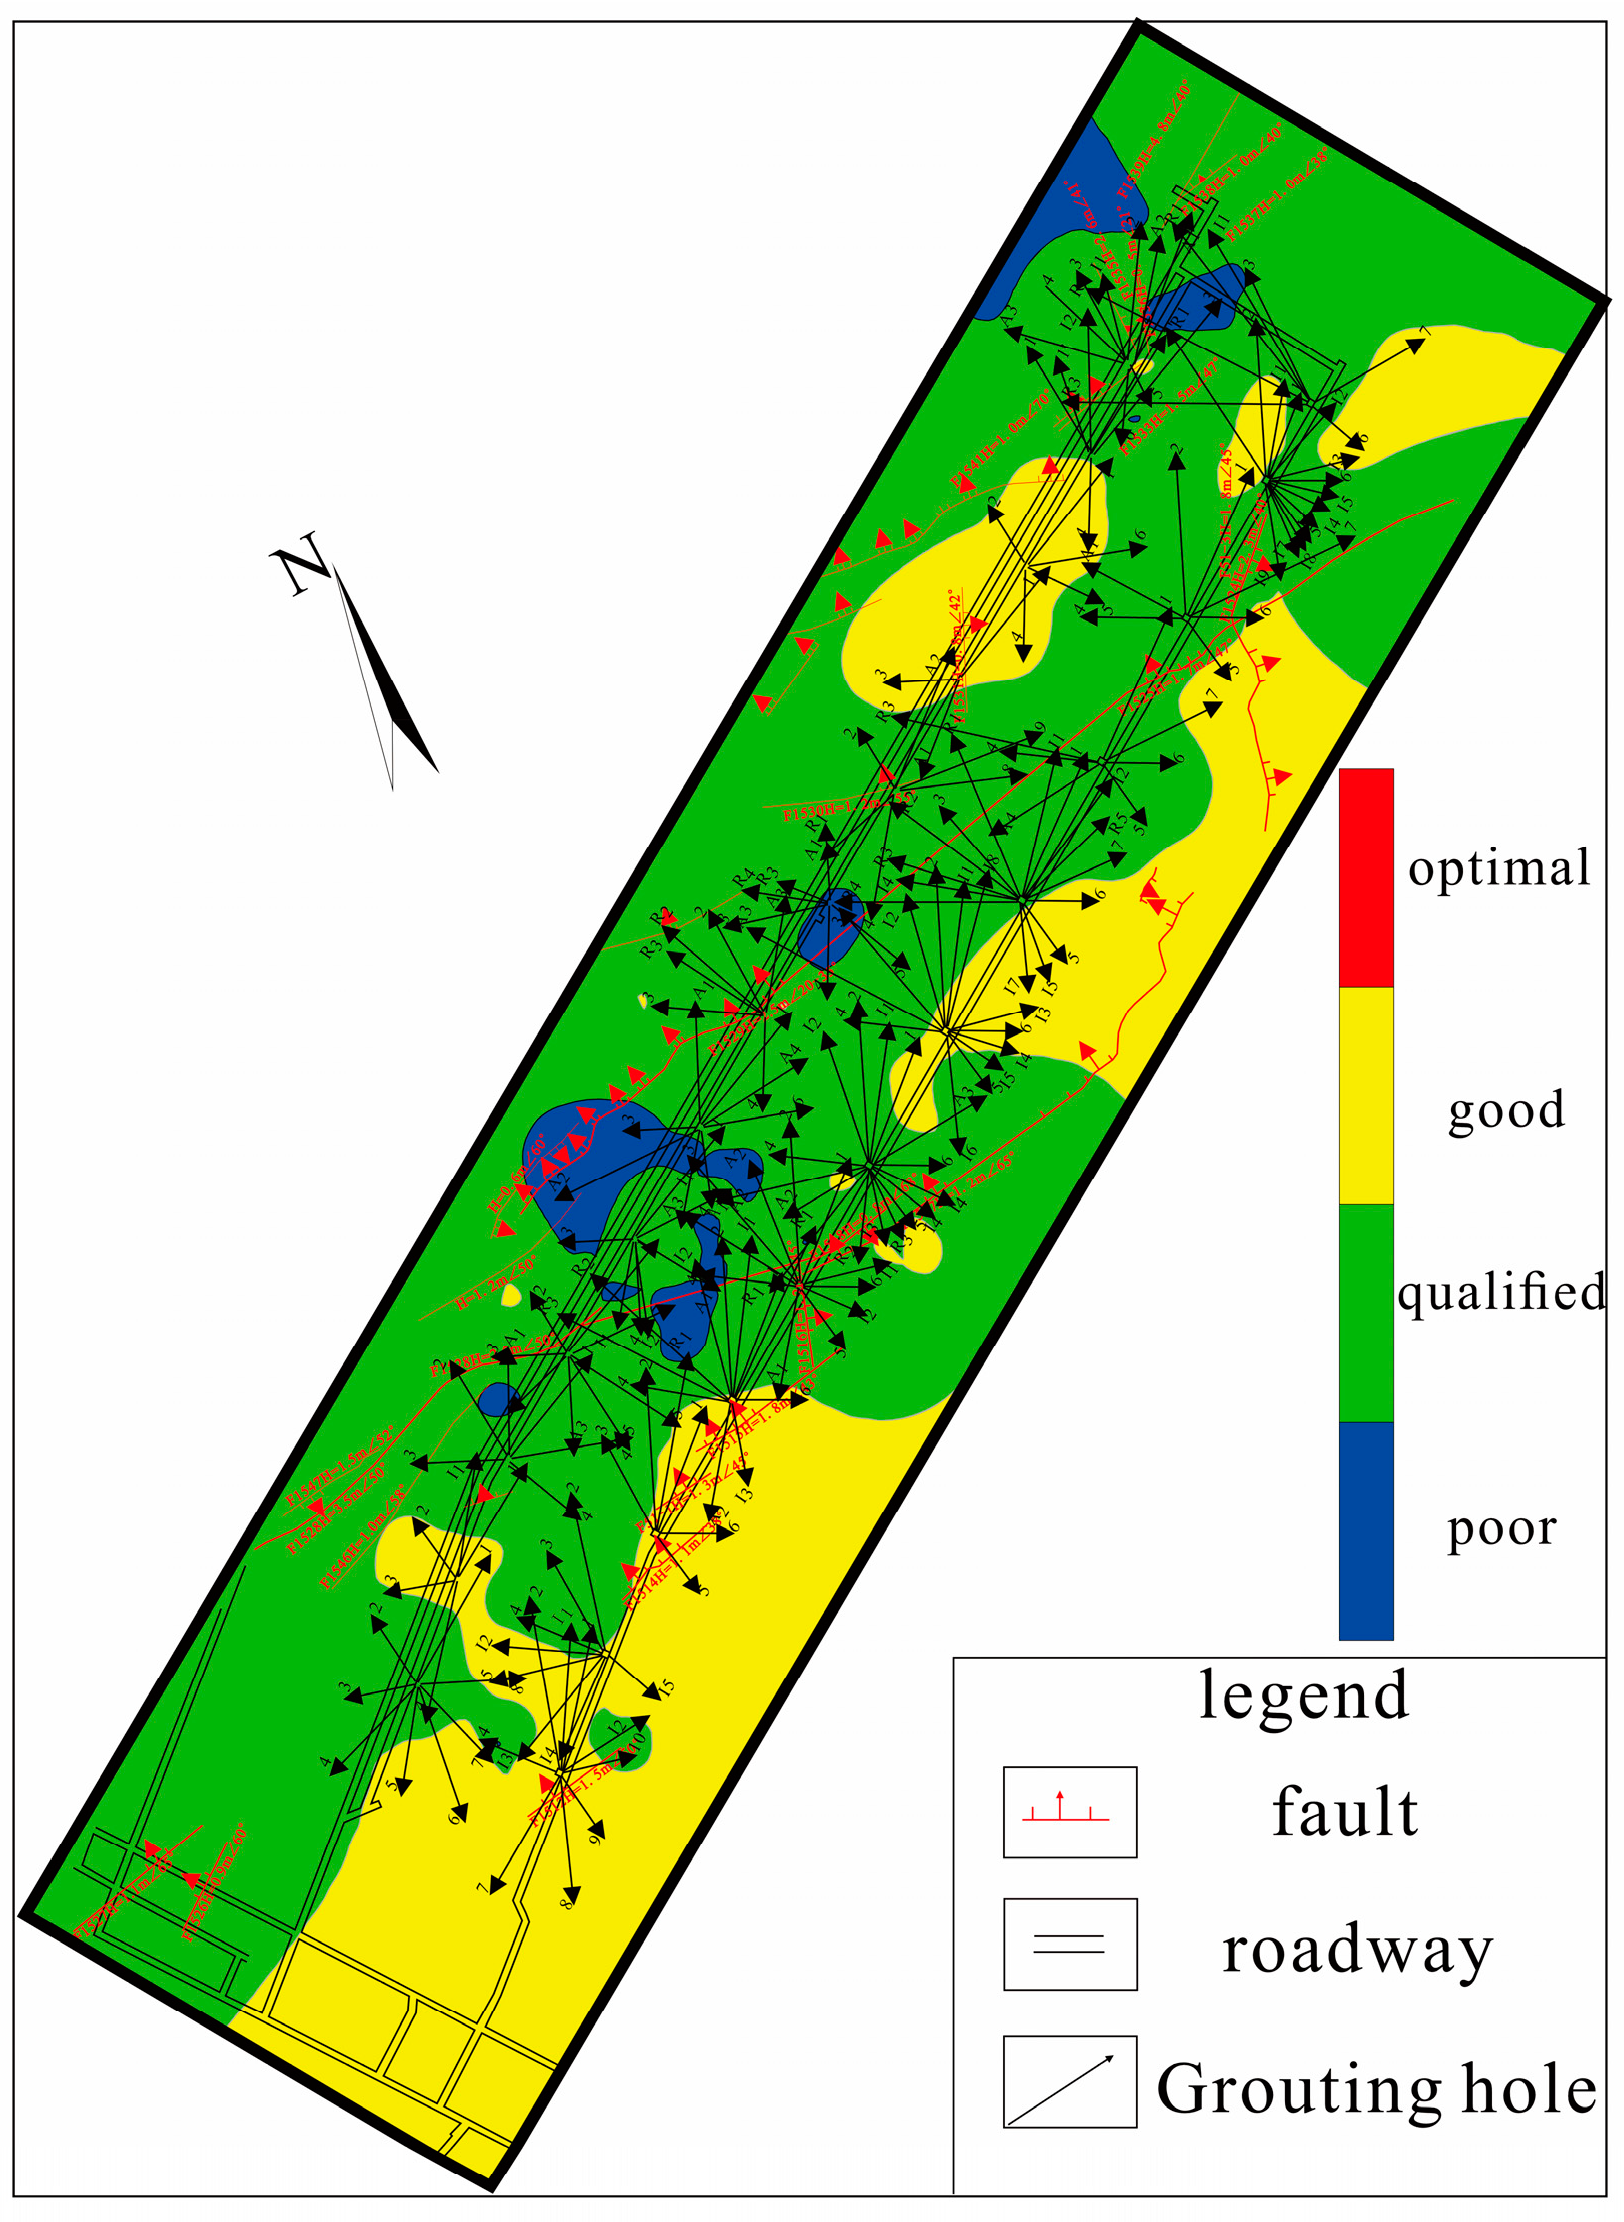
4.2. Evaluation of Grouting Effect

To further verify the accuracy of the model, the same evaluation indicators, weightings and model were used, but with the grouting volume, meter-long grouting amount, and ton-of-water dry material value all set to zero. The index of the water-inrush threat was used for the ungrouted face, with the critical water-inrush coefficient at 0.06 MPa/m. The relationship between the characteristic value H and the grouting effect is shown in Table 7.
The quantitative recognition and classification of the working face without grouting is shown in Figure 15.
Figure 15 shows that before grouting, the areas of poor, qualified, and good grouting effects account for 91.18%, 8.78%, and 0.04% of the face area, respectively. Comparison with Figure 14 clearly shows the significant improvement due to grouting.

4.3. Grouting Effect Verification

In order to verify the grouting effect, inspection hole new 1 (drilling field No. 4 in the return air lane), hole new 2 (drilling field No. 7 in the return air lane), hole new 3 (drilling field No. 13 in the return air lane), and hole new 4 (drilling field No. 6 in the transport lane) were bored into the 15,051 working face. The outlet points of these four holes were all located in the good areas evaluated by the model, and the holes all passed through the L8 limestone aquifer. The final hole layer was located in the L2 aquifer, and the water inflow was 8 m3/h, 2 m3/h, 7 m3/h, and 2 m3/h, respectively, which meets the requirement that the water inflow of the hole does not exceed 10 m3/h, indicating that the grouting effect was good.
The 15,051 working face of Guhanshan mine was safely mined with no water-inrush events during this period. After the floor of the working face was grouted and transformed, it achieved the effect of isolating the water layer, verifying the reliability of the model.

5. Conclusions

(a) The dimensional values of faults in the 15,051 working face were determined using fractal theory, enabling the working face to be classified in terms of faulting complexity. It was found that the overall fault complexity of the 15,051 working face was simple to relatively simple. These results laid a sound foundation for the subsequent quantitative evaluation of the effectiveness of the grouting.
(b) The water-inrush coefficient of the working face after grouting was calculated based on grouting borehole records of final depth, dip angle, and water pressure measurements. Accordingly, the risk of water inrush at the grouted face was divided into four possible zones: safe, low-threat, high-threat, and danger zones. The results show that the risk of water inrush was reduced after the grouting of the 15,051 working face. It not only shows that the effect of the grouting was good, but also verifies the results of the quantitative evaluation model.
(c) Based on the actual conditions of the working face, and with reference to previous studies, grouting volume, length of grouting in meters, dry material content per ton of water, water-inrush threat level, and fault structure complexity were selected as evaluation indicator factors. The subjective and objective weights of the indicator factors were determined using the AHP and CRITIC methods, respectively, and the overall weights were determined using a combination of weighting methods. This rational approach retained expert advice to be used along with objective weighting methods.
(d) A comprehensive evaluation model based on fuzzy variable set theory was developed to quantitatively evaluate the effect of the floor grouting project at the 15,051 working face in the Guhanshan mine. Optimal, good, qualified, and poor grouting effect accounted for 4.66%, 74.34%, 21.00%, and 0% of the total area, respectively, with a high rate of excellence reaching 79% overall. These values agree closely with on-site observations, underlining the applicability of the evaluation method at the Guhanshan mine and providing a reference for similar projects in the future.

Author Contributions

S.T.: writing—original draft preparation, software, visualization, investigation. C.G.: conceptualization, funding acquisition. J.Y.: writing—review and editing. P.H.: investigation, data curation. S.G.: conceptualization. X.W.: revising, editing, funding acquisition. All authors have read and agreed to the published version of the manuscript.

Funding

This work was supported by the National Natural Science Foundation of China (41972254), the Construction Project of Innovative Scientific and Technological Talents of Henan Province (CXTD2016053), and the Special Fund for Basic Scientific Research of Universities of Henan Province (NSFRF200103).

Data Availability Statement

Data are contained within the article.

Conflicts of Interest

The authors Chunfang Gao, employed by Hebei Coal Research Institute Co., Ltd., Peiguo Heng and Shuitao Guo, employed by Henan Coking Coal Energy Co., Ltd., Shiyuan Tian, Junchao Yue, and Xinyi Wang, employed by Henan Polytechnic University, promise that the research is free from any potential commercial or financial conflicts of interest.

References

  1. Jiang, P.; Ye, J.J.; Li, J. Research and application of integrated underground—Surface hydrological monitoring and early warning system for coal mine. Coal Eng. 2021, 53, 21–25. [Google Scholar]
  2. Wang, S.Y.; Li, W.; Pang, N.Y. Hydrogeological exploration and water hazard assessment of weathered rock water-filled coal mine. Coal Sci. Technol. 2021, 49, 222–229. [Google Scholar]
  3. Zhang, P.S.; Dong, Y.H.; Zhang, X.L.; Xu, D.Q. Statistical law analysis and forecast of coal mine water disaster accidents in China from 2008 to 2021. Coal Eng. 2022, 54, 131–137. [Google Scholar]
  4. Wang, T.; Xu, D.Q.; Hu, W.; Zhang, P.S. Grouting effect evaluation of overlying loose aquifer in thin bedrock coal seam. Coal Technol. 2023, 42, 161–166. [Google Scholar]
  5. Pang, C.M.; Gao, W.F.; Wu, P.Z.; Wang, L.D. Grouting Effect Detection within the Floor of a Coal Seam Using 3D Electric Resistivity Tomography (ERT) with Arbitrary Electrode Positions. Appl. Sci. 2022, 12, 5625. [Google Scholar] [CrossRef]
  6. Liu, S.D.; Liu, J.; Qi, J.; Cao, Y.; Lv, Q.R. Applied technologies and new advances of parallel electrical method in mining geophysics. J. China Coal Soc. 2019, 44, 2336–2345. [Google Scholar]
  7. Lang, J.; Liu, Z.W. Evaluation of the grouting reinforcement effect in the bottom plate structure area based on the detection technology. China Meas. Test 2022, 48, 163–168. [Google Scholar]
  8. Bai, J.W.; Li, S.C.; Jiang, Y.J.; Liu, R.T.; Li, W. An Extension Theoretical Model for Grouting Effect Evaluation in Sand Stratum of Metro Construction. KSCE J. Civ. Eng. 2019, 23, 2349–2358. [Google Scholar] [CrossRef]
  9. Xu, X.H.; Xiang, Z.C.; Zou, J.F.; Wang, F. An improved approach to evaluate the compaction compensation grouting efficiency in sandy soils. Geomech. Eng. 2020, 20, 313–322. [Google Scholar]
  10. Han, Z.Q.; Chen, S.Y.; Wang, C.; Wang, C.Y. Grouting effect evaluation of fractured rock mass based on borehole televiewer observation. IOP Conf.Ser. Earth Environ. Sci. 2021, 861, 022034. [Google Scholar] [CrossRef]
  11. Saeidi, H.; Ghafoori, M.; Lashkaripour, G. Evaluation of Grout Curtain Performance and Seepage Behavior in Doosti Dam. Iran 2015, 6, 8539–8551. [Google Scholar]
  12. Lee, J.S.; Bang, C.S.; Mok, Y.J.; Joh, S.H. Numerical and experimental analysis of penetration grouting in jointed rock masses. Int. J. Rock Mech. Min. Sci. 2000, 37, 1027–1037. [Google Scholar] [CrossRef]
  13. Li, Z.; Liu, J.C.; Xu, R.C.; Liu, H.X.; Shi, W.H. Study of grouting effectiveness based on shear strength evaluation with experimental and numerical approaches. Acta Geotech. 2021, 16, 3991–4005. [Google Scholar] [CrossRef]
  14. Wu, Y.P. Numerical Simulation on Grouting in Fault FractureZone Based on COMSOL Multiphysics. Master’s Thesis, Anhui University of Science and Technology, Huainan, China, 2017. [Google Scholar]
  15. Wang, X.L.; Qin, Q.R.; Xiong, Z.Q.; Su, P.D.; Yuan, Y. Comprehensive evaluation of grouting reinforcement effect on broken surrounding rock of deep Roadway. Chin. J. Undergr. Space Eng. 2019, 15, 576–582. [Google Scholar] [CrossRef]
  16. Li, W.H.; Zhang, J.K.; Wang, N.; Shi, Z.S.; An, C.; Yan, F.F. Application of non-destructive testing in evaluation of grouting reinforcement effect of soil site cracks. J. Lanzhou Univ. 2023, 59, 80–89. [Google Scholar]
  17. Yang, Z.B.; Dong, S.N. Study on quantitative evaluation of grouting effect by water pressure test. J. China Coal Soc. 2018, 43, 2021–2028. [Google Scholar]
  18. Tang, Z.; Jiang, X.Z.; Chen, L.G.; Lei, M.T.; Ma, X.; Wu, S.T. Evaluation of curtain water stop engineering and grouting effect of a limestone quarry in Longmen County. Carsologica Sin. 2022, 41, 47–58. [Google Scholar]
  19. Xu, Y.C.; Huang, L.; Yu, H.Q.; Luo, Y.L.; Li, P.F.; Geng, H.B.; Fei, Y.; Zhao, C.; Zhang, L.X. Evaluation system for floor water inrush risk in grout-reinforced working faces based on grouting boreholes dataset. J. China Coal Soc. 2020, 45, 1150–1159. [Google Scholar]
  20. Wang, E.B. Study on grouting reinforcement method of coal seam roadway in contiguous seams. Coal 2022, 31, 26–30. [Google Scholar]
  21. Liao, Z.H.; Yan, S.Q.; Zeng, Z.Q.; Han, H.C.; Qiu, S.L.; Li, P. Research on grouting parameters of fractured rock mass based on UDEC. Jiangsu Sci. Technol. Inf. 2020, 37, 44–49. [Google Scholar]
  22. Jin, Q.; Bu, Z.H.; Pan, D.D.; Li, H.Y.; Li, Z.F.; Zhang, Y.C. An Integrated Evaluation Method for the Grouting Effect in Karst Areas. KSCE J. Civ. Eng. 2021, 25, 3186–3197. [Google Scholar] [CrossRef]
  23. Liu, Z.X.; Song, W.S.; Cui, B.; Wang, X.L.; Yu, H.L. A Comprehensive Evaluation Model for Curtain Grouting Efficiency Assessment Based on Prospect Theory and Interval-Valued Intuitionistic Fuzzy Sets Extended by Improved D Numbers. Energies 2019, 12, 3674–3703. [Google Scholar] [CrossRef]
  24. Zhu, C.A.; Sun, R.F.; Xu, H.; Liu, Y.W.; Chen, Z. Evaluation of Ground Surface Pregrouting in a Mountain Tunnel Based on FAHP. Math. Probl. Eng. 2019, 2019, 2543584. [Google Scholar] [CrossRef]
  25. Wang, X.Y.; Yao, M.J.; Zhang, J.G.; Zhao, W.; Huang, P.H.; Guo, J.W.; Chen, G.S.; Zhang, B. Evaluation of water bursting in coal seam floor based on improved AHP and fuzzy variable set theory. J. Min. Saf. Eng. 2019, 36, 558–565. [Google Scholar]
  26. Xiao, L.L.; Li, F.; Niu, C.; Dai, G.L.; Qiao, Q.; Lin, C.S. Evaluation of Water Inrush Hazard in Coal Seam Roof Based on the AHP-CRITIC Composite Weighted Method. Energies 2022, 16, 114–133. [Google Scholar] [CrossRef]
  27. Wang, W.; Qi, Y.; Jia, B.S.; Yao, Y.L. Dynamic prediction model of spontaneous combustion risk in goaf based on improved CRITIC-G2-TOPSIS method and its application. PLoS ONE 2021, 16, e0257499. [Google Scholar] [CrossRef] [PubMed]
  28. Zhu, J.; Feng, J.G.; Gao, Y.Q.; Guo, Z.C.; Zheng, H. Comprehensive evaluation model for happy rivers and lakes based on BWM-CRITIC-TOPSIS. Adv. Sci. Technol. Water Resour. 2022, 42, 8–14+20. [Google Scholar]
  29. Wang, L.; Ke, Q.; Li, Y.L.; Wu, Y.S. Risk evaluation of check dam system in a small watershed of loess plateau using combined weight-TOPSIS method. Chin. J. Appl. Mech. 2019, 39, 698–706. [Google Scholar]
  30. Bajić, S.; Bajić, D.; Gluščević, B.; Vakanjac, V.R. Application of Fuzzy Analytic Hierarchy Process to Underground Mining Method Selection. Symmetry 2020, 12, 192–211. [Google Scholar] [CrossRef]
  31. Muduli, L.; Mishre, D.P.; Jane, P.K. Optimized Fuzzy Logic-Based Fire Monitoring in Underground Coal Mines: Binary Particle Swarm Optimization Approach. IEEE Syst. J. 2019, 14, 3039–3046. [Google Scholar] [CrossRef]
  32. Wang, Y.S.; Jin, Z.X.; Deng, C.B.; Wang, X.Y. Comprehensive decision-making with fuzzy combined weighting and its application on the order of gob management. J. Intell. FuzzySyst. Appl. Eng. Technol. 2018, 34, 2641–2649. [Google Scholar] [CrossRef]
  33. Han, J.F.; Liu, Z.X.; Wang, H. Analysis on floor grouting effect and water inrush risk in coalface of deep well with high confined aquifer. Coal Technol. 2023, 42, 122–126. [Google Scholar]
  34. Tang, D.Z.; Wang, Y.B.; Chen, J.G.; Lu, J.T.; Yun, M.; Liu, L.; Guo, H.Y.; Fu, Z.Q. Full cycle evaluation method of directional borehole grouting effect in Huangbei coalfield. Coal Technol. 2023, 42, 151–156. [Google Scholar]
  35. Xu, H.; Mou, Y.; Niu, C. Fractal optimization of permeability coefficient of mine water inflow. Coal Sci. Technol. 2019, 49, 228–232. [Google Scholar]
Figure 1. Positional relationship between M and interval [a, b], [c, d].
Water 16 01160 g001
Figure 2. Flowchart of the comprehensive evaluation model.
Water 16 01160 g002
Figure 3. Contour map of water-inrush coefficient before grouting of the working face.
Water 16 01160 g003
Figure 4. Schematic diagram of grouting horizon.
Water 16 01160 g004
Figure 5. Drilling location map of the 15,051 working face.
Water 16 01160 g005
Figure 6. Evaluation of the effect of grouting on the working face.
Water 16 01160 g006
Figure 7. Fault structure division and number.
Water 16 01160 g007
Figure 8. Fault complexity zones at the Guhanshan mine 15,051 working face.
Water 16 01160 g008
Figure 9. Contour map of borehole grout volume for the 15,051 working face.
Water 16 01160 g009
Figure 10. Contour map of the meter grouting weight for boreholes in working face 15051.
Water 16 01160 g010
Figure 11. Contour map of dry material value per ton of water at the 15,051 working face.
Water 16 01160 g011
Figure 12. Isogram of water-inrush coefficients after grouting at the 15,051 working face.
Water 16 01160 g012
Figure 13. Isoline map of the differences between water-inrush coefficients and critical value for the working face.
Water 16 01160 g013
Figure 14. Quantitative identification diagram of grouting effect at the 15,051 working face.
Water 16 01160 g014
Figure 15. Quantitative diagram of the 15,051 working face without grouting.
Water 16 01160 g015
Table 1. Fractal dimension value of each structural unit.
IDFractal DimensionIDFractal DimensionIDFractal DimensionIDFractal Dimension
10.8340221.1909431.0832640.9007
20.5755231.1963440.7966650.7000
31.3914240.9737450.8340661.0832
41.0000250.8551460.9007670.5755
51.0510260.7966470.6000680.7000
60.6585270.3000480.7000691.1288
71.0000281.2340491.2077701.0966
80.3000290.7551501.2943711.1378
91.0000301.1288511.0322720.7000
100.8551311.0247521.1115731.0095
110.8837321.0095530.9744741.2170
121.3170330.7000540.7000751.0247
131.2101341.0510551.0288760.9422
141.3432351.1288561.0322771.1115
150.8966361.2340570.9422780.9737
160.3000370.3000580.8551791.0703
170.9734380.8340591.4381801.1601
181.2290390.9340600.6000810.5755
191.3000401.1186611.1288821.1115
200.9000410.9422621.0966
210.9585421.0247631.0422
Table 2. Classification standard of fault complexity.
RankSimpleRelatively SimpleRelatively ComplexComplex
DD < 11 ≤ D < 1.11.1 ≤ D < 1.2D ≥ 1.2
Table 3. Classification standard for water-inrush threat from the coal seam floor at the grouted face.
RankSafe ZoneLow-Threat ZoneHigh-Threat ZoneExclusion Zone
TT < 0.030.03 ≤ T < 0.060.06 ≤ T < 0.1T ≥ 0.1
Table 4. Subjective weight determined by AHP method.
Primary IndexWeightSecondary IndexWeight
Geological structure characteristics0.1226Fault complexity0.1226
Grouting quantity characteristics0.5571Grouting quantity0.0683
Length of meter grouting quantity0.1784
Dry material value per ton of water0.3104
Risk of water inrush at working face0.3203Danger of water inrush0.3203
Table 5. Objective weights determined by CRITIC method.
IndexVariabilityConflictAmount of InformationWeight
Fault complexity0.19673.44090.67680.3031
Grouting volume0.13732.24490.30830.1381
Length of meter grouting quantity0.12472.15890.26910.1206
Dry material value per ton of water0.1712.38420.40740.1825
Threat level of water inrush0.15473.69030.57090.2557
Table 6. Comprehensive weightings.
Evaluation IndexFault
Complexity
Grouting VolumeLength of Meter Grouting QuantityDry Material Value Per Ton of WaterThreat Level of Water Inrush
Combined weight0.20060.10110.15270.24770.2979
Table 7. Grading standard of grouting effect evaluation by grouting face model.
RankPoorQualifiedGoodOptimal
HH < 1.51.5 ≤ H < 2.52.5 ≤ H < 3.53.5 ≤ H < 4
Disclaimer/Publisher’s Note: The statements, opinions and data contained in all publications are solely those of the individual author(s) and contributor(s) and not of MDPI and/or the editor(s). MDPI and/or the editor(s) disclaim responsibility for any injury to people or property resulting from any ideas, methods, instructions or products referred to in the content.

