Article

Assessing the Lifecycle Environmental Resilience of Urban Green Infrastructures Coping with Acute Disturbances and Chronic Stresses

1
Center for Human-Oriented Environment and Sustainable Design, School of Architecture and Urban Planning, Shenzhen University, Shenzhen 518060, China
2
Green Infrastructure Institute, Peking University Shenzhen Institute, Shenzhen 518057, China
3
Archimaera, Brooklyn, NY 11222, USA
*
Author to whom correspondence should be addressed.
Water 2024, 16(8), 1162; https://doi.org/10.3390/w16081162
Submission received: 10 March 2024 / Revised: 9 April 2024 / Accepted: 16 April 2024 / Published: 19 April 2024

Abstract

:
Urban green infrastructure (UGI), a key component of nature-based solutions (NbSs), plays a vital role in enhancing urban resilience. Nonetheless, the absence of a thorough resilience evaluation for UGI has hindered the efficacy of its design and implementation. This article proposes an innovative urban environmental resilience index (ERI) framework designed to evaluate the lifecycle performance of UGI. First, a coupled environmental resilience evaluation system is proposed that encompasses indicators for the adaptation to acute disturbances and the mitigation of chronic pressures. Second, the inventive formulas for calculating the environmental resilience index are presented, which establish the weighting of indicators through Delphi-analytic hierarchy process (AHP) analysis, and the Storm Water Management Model (SWMM), GaBi, and i-Tree models are employed for the quantitative assessment. Third, four representative UGI scenarios in urban built-up areas have been selected for comparative analysis and in-depth discussion by calculating the resilience index. This research presents UGI solutions as adaptive measures for “Black Swan” events and “Gray Rhino” phenomena, offering significant case studies and methodological frameworks which will inform future endeavours in green and sustainable urban development.

1. Introduction

In recent years, as climate disasters and environmental pressures continue to rise, enhancing urban resilience has become a global governance consensus and a research frontier in multi-disciplines [1,2,3]. The 2030 Agenda for Sustainable Development explicitly identifies increasing resilience as a necessary pathway to promote urban sustainable development [4]. The integration of ecology, engineering technology, socio-economics, urban planning, and other multi-disciplines promotes a systematic framework for resilient cities to cope with diverse external acute disturbances and chronic stresses [5,6,7]. Urban green infrastructure (UGI) is a critical structural facility of nature-based solutions (NbSs) that can effectively increase urban resilience and provide multiple ecosystem services [8,9,10]. UGI can propose adaptive responses to acute disturbances, such as heavy rainfall and floods, and chronic stresses, such as mitigating CO2 emissions, reducing pollution, and improving biodiversity [11,12,13,14]. Effective planning and design for sustainable resilience require collaborative, multi-disciplinary, and adaptive strategies encompassing systematic thinking and leveraging the quantitative evaluation of urban resilience infrastructures [15,16]. The critical bottleneck constraining the effectiveness of UGI lies in the inadequate identification of resilience-driven mechanisms, which is based on a comprehensive evaluation of resilience for alternative UGI options. Currently, there is a lack of consensus on the evaluation indicators and practical methods for the resilience assessment of UGI.
Previous studies have mentioned that UGI could contribute to urban resilience by increasing its diversity, flexibility, redundancy, modularity, and decentralisation [17,18]. Multifunctional and interconnected UGI systems are closely linked to increased urban resilience in diverse circumstances. First, when considering the temporal aspect of resilience, it is essential to determine whether it is related to short-term disturbances (e.g., storms) or long-term stressors (e.g., climate change) and adapt terms like “rapid return” or “quickly transform” accordingly [19]. Previous studies have suggested that resilience is defined as the ability of a system to prepare for threats, absorb impacts, recover, and adapt to extreme disturbances and persistent stress [20,21]. The role of UGI in mitigating extreme disturbances lies in its capacity to enhance urban resilience by providing support in resisting, absorbing, and adapting to high-risk extreme situations [10]. Unlike the acute shocks often related to natural disasters, urban resilience often has socio-economic attributes in response to gradual and chronic stresses, including the place-based support that urban green spaces provide for recreation, social interaction, building community cohesion and promoting physical and mental health and well-being [22]. Current research on urban resilience mitigation is more concerned with the response capacity after extreme climate disasters and lacks the evaluation of environmental stress mitigation over the entire lifecycle.
Previous scholars have explored building resilience indices and evaluation systems to assess and compare decisions conveniently. Cheek and Chmutina [23] explored five well-known urban resilience frameworks, i.e., UNDRR’s Making Cities Resilient Campaign, UN-Habitat’s City Resilience Profiling Programme, The World Bank and GFDRR’s Resilient Cities Program, Arup and The Rockefeller Foundation’s City Resilience Index, and The Rockefeller Foundation’s 100 Resilient Cities, which identified that is difficult to make horizontal comparisons between different indicator systems, and many indicators are also difficult to quantify and evaluate. In the study by Chen et al. [24], five factors, including the disturbance factor, the vulnerability factor, the resistance factor, the adaptation factor, and the transformation factor, were calculated from the three dimensions of urban systems—situation, structure, and elements—by combining hierarchical analysis, the Delphi method, and the fuzzy synthesis calculation method. The final composite score of the urban system’s resilience level was obtained from the resilience formula. In Zhao et al. [25]’s study, the entropy value method is used to calculate the information entropy of individual indicators, decide the formula for information entropy, construct the weights of the indicators, and use the weights to directly multiply each socio-economic indicator to obtain the results of the evaluation of the comprehensive resilience of the city. The index considers the resilience of health, society, economy, infrastructure, and urban management, and, for the evaluation of urban green space, the two indexes of per capita park green space area and built-up area green space rate are mainly considered.
Specifically, the performance evaluation of UGI is often analysed from the perspective of ecosystem services or landscape performance, and there is a lack of a targeted indicator system focusing on the contribution of green infrastructure to urban resilience (Table 1). Although for the performance evaluation of green infrastructure water ecosystem services studies have focused on regulating and supplying services and have constructed a supply and demand evaluation system for rainfall regulation, water quality purification, soil and water conservation, freshwater recharge, and other service types, few studies have comprehensively evaluated the environmental impacts and stormwater management roles of the construction and operation of green infrastructures [26].
The assessment of the resilience effects in green infrastructure primarily focuses on evaluating acute disturbances (such as extreme rainfall) using hydrological modelling tools, including the Storm Water Management Model (SWMM), the Geographic Information System (ArcGIS), and the Weather Research and Forecasting-Surface Urban Energy and Water Scheme (WRF-SUEWS) [33,34,35]. Meerow and Newell [36] developed a green infrastructure spatial planning (GlSP) model incorporating a GIS-based six-benefit criterion (stormwater management, social vulnerability, green space, air quality, urban heat island, and landscape connectivity) of multi-criteria assessment and weighting of expert stakeholders. On the other hand, the lifecycle assessment (LCA) of UGI is gradually attracting attention, which evaluates the environmental and economic impacts of specific green stormwater facilities’ technologies during material acquisition, transport, construction, and operation [37,38]. Current research has been applied to scenario-setting for single or combined low-impact development (LID) facilities [39], comparative LCA analysis of grey and green infrastructure [40], multi-objective optimal design of rainwater management systems [41], LCA analysis of climate change and the city [38], LCA analysis of rainwater harvesting measures at different scales, etc. [42]. However, there are fewer results of a comprehensive evaluation of the resilience benefits of actual green infrastructure in acute disturbances and chronic stresses. A comprehensive resilience indicator system is needed to determine the weighting relationship between both categories of indicators and construct a scientifically sound and easy-to-use evaluation method.
The existing literature indicates a wealth of research on assessment systems for resilient cities. Yet, there is a deficiency in comprehensive evaluation methods for UGI’s contribution to urban resilience, particularly the integration of acute disturbance adaptation and chronic stress mitigation, hindering effective scientific decision making. This paper aims to achieve the following: (1) introduce a lifecycle resilience assessment framework for UGI that addresses acute disturbances and chronic stresses via five modules and sixteen indicators; (2) develop a robust evaluation method that integrates SWMM, GaBi, and i-Tree models to simulate the lifecycle resilience of UGI and assign all the selected indicators through Delphi-AHP analysis; and (3) create an environmental resilience index (ERI) for UGI to facilitate comparisons between different scenarios and identify the most effective option. The novelty of this study lies in the innovation of a holistic resilience framework and index for UGI, as well as the development of a reliable evaluation methodology which integrates effective models. The findings attempt to support the practice of UGI planning and design for strengthening urban resilience and provide scientific evidence to assist policymakers in advancing resilient cities.

2. Materials and Methods

2.1. Evaluation Framework

This study introduces a methodology for evaluating environmental resilience by establishing an analytical foundation for the integrated SWMM, GaBi, and i-Tree models. It develops a technical framework for assessing the environmental resilience of UGI over its lifecycle, focusing on mitigating acute disturbances and chronic stresses. The specific research flowchart is presented in Figure 1.

2.1.1. Environmental Resilience Indicator

  • Indicator Selection
Based on the diverse functions of UGI to mitigate acute disturbances and chronic stresses, indicators corresponding to their characteristic attributes were selected for a quantitative analysis of absorption, adaptation, recovery, and transformation. The acute disturbance adaptation (ADA) category mainly considered the modules of extreme weather adaptation and extreme weather recovery. It contained six representative indicators: the runoff reduction rate under a 10-year design storm of a 2 h duration, the runoff reduction rate under a 100-year design storm of a 2 h duration, the peak flow reduction rate -10a, the peak flow reduction rate -100a, the recovery time -10a, and the recovery time -100a. The category of chronic stress mitigation (CSM) mainly considered three modules: climate adaptation, ecological environment improvement, and resource consumption reduction. It contained ten representative indicators, including carbon emission reduction, urban cooling, annual runoff reduction, annual suspended solids’ reduction, particle formation, soil acidification, terrestrial ecotoxicity, consumption of water resources, consumption of fossil energy, and consumption of mineral resources. Table 2 presents a detailed description of the indicators’ information and the cited literature sources.
  • Indicator Weighting
This paper adopts the Delphi-hierarchical analysis method, widely used in mathematical statistics, to determine the weights of the indicators. The Delphi method, through a questionnaire form using a 1~9 scale method on the two first-level indicators, five second-level indicators, and sixteen third-level indicators for the evaluation of scoring, allows for comprehensive expert experience to influence the indicator weight coefficients to make a gradual convergence in the assessment of the views [64]. The hierarchical analysis method (analytic hierarchy process, AHP) uses a two-by-two comparison of the degree of importance to construct a judgment matrix, which is designed to transform multi-objective, multi-criteria, challenging-to-quantify problems into multi-level single-objective problems for processing. The specific process is to evaluate the weight of the single-level indicators at each level, then calculate the total ranking of the indicators between levels, and, finally, obtain the relative weight evaluation of each indicator relative to the total indicator [65]. Twenty experts specialising in ecology, hydrology, green infrastructure, economics, and sociology were assigned to evaluate different quantitative indicators for gauging the urban resilience performance concerning specific green infrastructure types and scenarios. The consistency ratio (CR) is determined by dividing the consistency index by the random Index to ensure consistency in judgments across dimensions or indicators. According to Saaty [66], a CR ≤ 0.10 is acceptable to continue an AHP analysis. Through expert scoring and analytic hierarchy process (AHP) calculations, the evaluation system for the environmental resilience indicators and weight parameters is computed in Equation (1) and illustrated in Table 3.
W = w 1 ,   w i ,   w n ,   i = 1 n w i = 1 ,
where W is the weight vector, wi is the weight for indicator i, and n is the number of indicators.

2.1.2. Environmental Resilience Index Evaluation

Based on the analysis of the model for mitigating acute disturbance and chronic stress, the environmental resilience index (ERI) evaluation system was constructed. The unit ecological performance of UGI was calculated by creating a resilience index scale, and then the environmental resilience index was calculated using the environmental resilience index formula.
  • Environmental Resilience Index Scale
The environmental resilience index (ERI) scale was developed based on previous research, case studies, and expert ratings. Quantitative indicators were divided into one of five scores, corresponding to the level of UGI performance in terms of urban environmental resilience: “very low”, “low”, “medium”, “high”, and “very high”; the score ranks were 1, 2, 3, 4, and 5, respectively. The standards for ranking quantitative indicators were based on LCA methodological studies [13,65,67], the comparison of diverse UGI scenarios [37,68], and comprehensive expert ratings [69]. The rating scores of each index are calculated in Table 4.
  • Environmental Resilience Index Calculation
Previous scholars have proposed calculation methods for the urban resilience of sponge cities. For instance, Zhang et al. [70] used the Technique for Order of Preference by Similarity to Ideal Solution (TOPSIS) method to establish a sponge city resilience evaluation model from three attributes—disaster defence, disaster absorption, and system adaptation—and a comparative analysis of spatial and temporal changes in the same research object. Zhu et al. [71] constructed a fuzzy comprehensive evaluation model using a pattern language by setting weights for experts in different fields and then using an aggregation formula to calculate the fuzzy weights of the resilient scale evaluated by the experts many times and then obtain the comprehensive resilience value of sponge cities. However, there is still a lack of comprehensive and integrated resilience performance evaluation methods for UGI addressing both acute disturbances and chronic stresses. Therefore, this paper innovatively proposes formulas for calculating the environmental resilience index that includes the performance of mitigating acute disturbances and chronic stresses. Detailed information is shown below:
E R I = E R I a + E R I c
E R I a = i = 1 n r i · w i
E R I c = j = 1 n r j · w j
where ERI represents the environmental resilience index, R ϵ 1 ,   10 ;   E R I a indicates the mitigation of the acute disturbance performance; E R I c indicates the mitigation of the chronic stresses performance; r i is the score of each mitigating acute disturbance indicator; w i is the weight of each acute disturbance adaptation indicator; r j is the score of each chronic stress mitigation indicator; and w j is the weight of each chronic stress mitigation indicator.

2.2. Research Setting

2.2.1. Study Area

Zhuhai city is located on the southwest bank of the Pearl River Estuary in the Guangdong province, bordering Macau to the southeast. It is approximately 125 km away from Guangzhou by land and about 100 km away from Hong Kong across the sea. Experiencing a subtropical monsoon climate, Zhuhai city has an average annual temperature of 22.2 degrees Celsius and receives an average annual rainfall of 2103.6 mm. The rainfall patterns are marked by high intensity and frequency, and the flood season predominantly spans from April to September, during which approximately 80% of the annual rainfall occurs. The study area is part of Zhujiang new city, a critical development zone for the future of Zhuhai city (Figure 2). It falls within the pilot sponge city initiative and functions as the catchment area for the southern section of the central water system, which is responsible for regional rainwater discharge. Subsequently, the rainfall flows southward into the No. 2 Main Drainage River. The elevation in this area ranges from 0 to 5 m, with a gradient varying between 1.0% and 3.2%, resulting in a generally flat terrain. According to the “Detailed Control Plan for the Western Center of Zhuhai City”, the total study area is 181.8 hectares, with an effective catchment area of 68.2 hectares, including 17.1 hectares of public green space in the riverside park, 22.7 hectares of public green space in the municipal roads, and 28.4 hectares of attached green space.

2.2.2. UGI Selection

UGI constructs cost-effective water recycling networks with sustainable links in timely and long-lasting urban water management systems [16]. Building upon prior research and the prerequisites for model configuration, this paper identifies three representative low-impact development (LID) stormwater management facilities: bioretention ponds, grassed swales, and stormwater detention basins. These facilities have been chosen to examine stormwater management application needs within urban green spaces, municipal roadways, and drainage networks (Table 5).

2.2.3. Representative UGI Scenarios

Previous studies indicated that the effectiveness of bioretention ponds, grassed swales, and stormwater detention basins would grow with the increase in application area while the growth rate would gradually decrease [5,72]. Considering the optimal land use–benefit ratio, scenarios were established using both singular technological applications and multiple technology integrations tailored to the real-world conditions of the study area. These scenarios were classified into four main categories: source control stormwater management scenario (S1), process control stormwater management scenario (S2), terminal control stormwater management scenario (S3), and facility combined stormwater management scenario (S4). The conventional scenarios without UGI facilities were marked as S0. The stormwater facility combination scenarios integrated source, process, and terminal stormwater management facilities, as depicted in Table 6 and Figure 3.

2.3. Data Input and Model Analysis

2.3.1. Modelling Acute Disturbance Adaptation

As a dynamic hydrology–hydraulic water quality simulation model, SWMM could simulate and calculate the surface-produced flow, surface catchment, hydrodynamic transport in pipe network, and hydrological transport generated by a single rainstorm or continuous rainstorms through hydrological, hydraulic, and water quality modules, which are widely used by scholars worldwide in the simulation study of urban storm flooding [79]. In this research, the SWMM model was employed to simulate the capacity of green infrastructure solutions to mitigate sudden disruptions by configuring low-impact development (LID) controls and best-management practices (BMPs), such as runoff reduction rate, peak flow reduction rate, and recovery time.
The sites in the study area were divided into three types—roofs, pavement, and green spaces—due to variations in pollutant accumulation and washout processes in different sub-surfaces. To assess flood control performance under various climate change risks, we simulated the flooding process using design rainfall with 10-year and 100-year return periods. The chosen rainfall pattern matched the Chicago storm profile in the Pearl River Delta region [80], with a duration of 120 min and a rainfall interval of 1 min. Specific data were calibrated to the SWMM simulation data using the measured rainfall runoff monitoring results from 18 July 2017. Due to the absence of validated water quality monitoring data in the study area, validated parameter data from studies in the Pearl River Delta (PRD) region (Guangzhou and Shenzhen) were used to set the SWMM model parameters for water quality calibration. The calculation data can be found in Appendix A: Data Information (Table A1, Table A2, Table A3 and Table A4). Please refer to Supplementary Materials for detailed information on Figure S1: SWMM model construction graph.

2.3.2. Modelling Chronic Stress Mitigation

In the simulation calculations for chronic stress mitigation, the GaBi and i-Tree models were used to analyse and derive metrics, except for the annual runoff reduction and the annual suspended solids’ removal, which were analysed using the SWMM model. The GaBi model, named from the German “Ganzheitlichen Bilanzierung”, employed for lifecycle assessment stands as one of the most prevalent software tools for environmental impact calculations, featuring an integrated industrial database and various models, i.e., ReCiPe, Centrum voor Milieukunde Leiden (CML), Tool for Reduction and Assessment of Chemicals and Other Environmental Impacts (TRACI), and Environmental Development of Industrial Products (EDIP) [81]. Gabi Software 10.6.1is utilized to thoroughly evaluate the environmental effects of each scenario throughout its construction and the 30-year operational period, encompassing manufacturing, transportation, energy input-output, etc. The i-Tree model, developed by the U.S. Forest Service (USDA Forest Service) in 2006, is adopted for calculating plants’ ecological efficiency and economic value [82]. It offers unique advantages regarding carbon sequestration and oxygen release, energy saving, rainwater retention, and air quality improvement [83].
First, the required amount of materials during the construction period was calculated based on the series of Drawings Collection for National Building Standard Design, including “Environmental Landscape-Details of Outdoor Engineering Construction” (15J012-1), “Environmental Landscape-Greenery Planting Design” (03J012-2), “Outdoor Engineering” (12J003), and the Zhuhai local construction design data. Then, inventory data for the operation period were calculated and divided into three parts: (1) input data for pollutant reduction in the operation period based on the simulation results of SWMM; (2) input data for the purification of climate change and air pollution in the operation period obtained from the simulation results of the i-Tree model, reflecting the effect of carbon dioxide, particulate matter, etc., absorbed by the vegetation; (3) calculations for irrigation water, commonly used electricity, and diesel consumption for greening maintenance based on local landscape maintenance standards for each scenario. The calculation data can be found in Appendix A: Data Information (Table A1, Table A2, Table A3, Table A4 and Table A5).

3. Results and Discussion

3.1. Overall Resilience Index Calculation

The initial evaluation of the multi-scenario modelling of green infrastructure environmental performance is presented in Table 7 and Table 8 and Figure 4. From the category of acute disturbance adaptation (ADA), the terminal control stormwater management scenario (S3) excelled in the module of extreme weather adaptation capability, showing significant advantages in all four metrics: runoff reduction -10a, runoff reduction -100a, peak flow reduction -10a, and peak flow reduction -100a. In contrast, the process control stormwater management scenario (S2) had the worst performance across all four indicators. However, S2 rated the highest in the extreme weather recovery capability module, including flood recovery time -10a and flood recovery time -100a, while S3 rated the lowest. The source control stormwater management scenario (S1) demonstrated greater efficacy within the chronic stress mitigation (CSM) category, achieving the highest scores in 70% of the evaluated indicators. Within the climate adaptation module, S1 excelled in the climate warming reduction rate and urban cooling effectiveness indicators. Regarding the ecological environment improvement module, S1 outperformed in the indicators for the particle formation reduction rate, the average annual runoff reduction rate, and the soil acidification reduction rate. On the other hand, the facility combined stormwater management scenario (S4) secured the highest scores for the annual suspended solids’ reduction rate and terrestrial ecotoxicity reduction rate. Regarding the resource consumption reduction module, S1 excelled in reducing water resources’ consumption and fossil energy consumption, whereas S3 was the top performer in reducing mineral resources’ consumption.
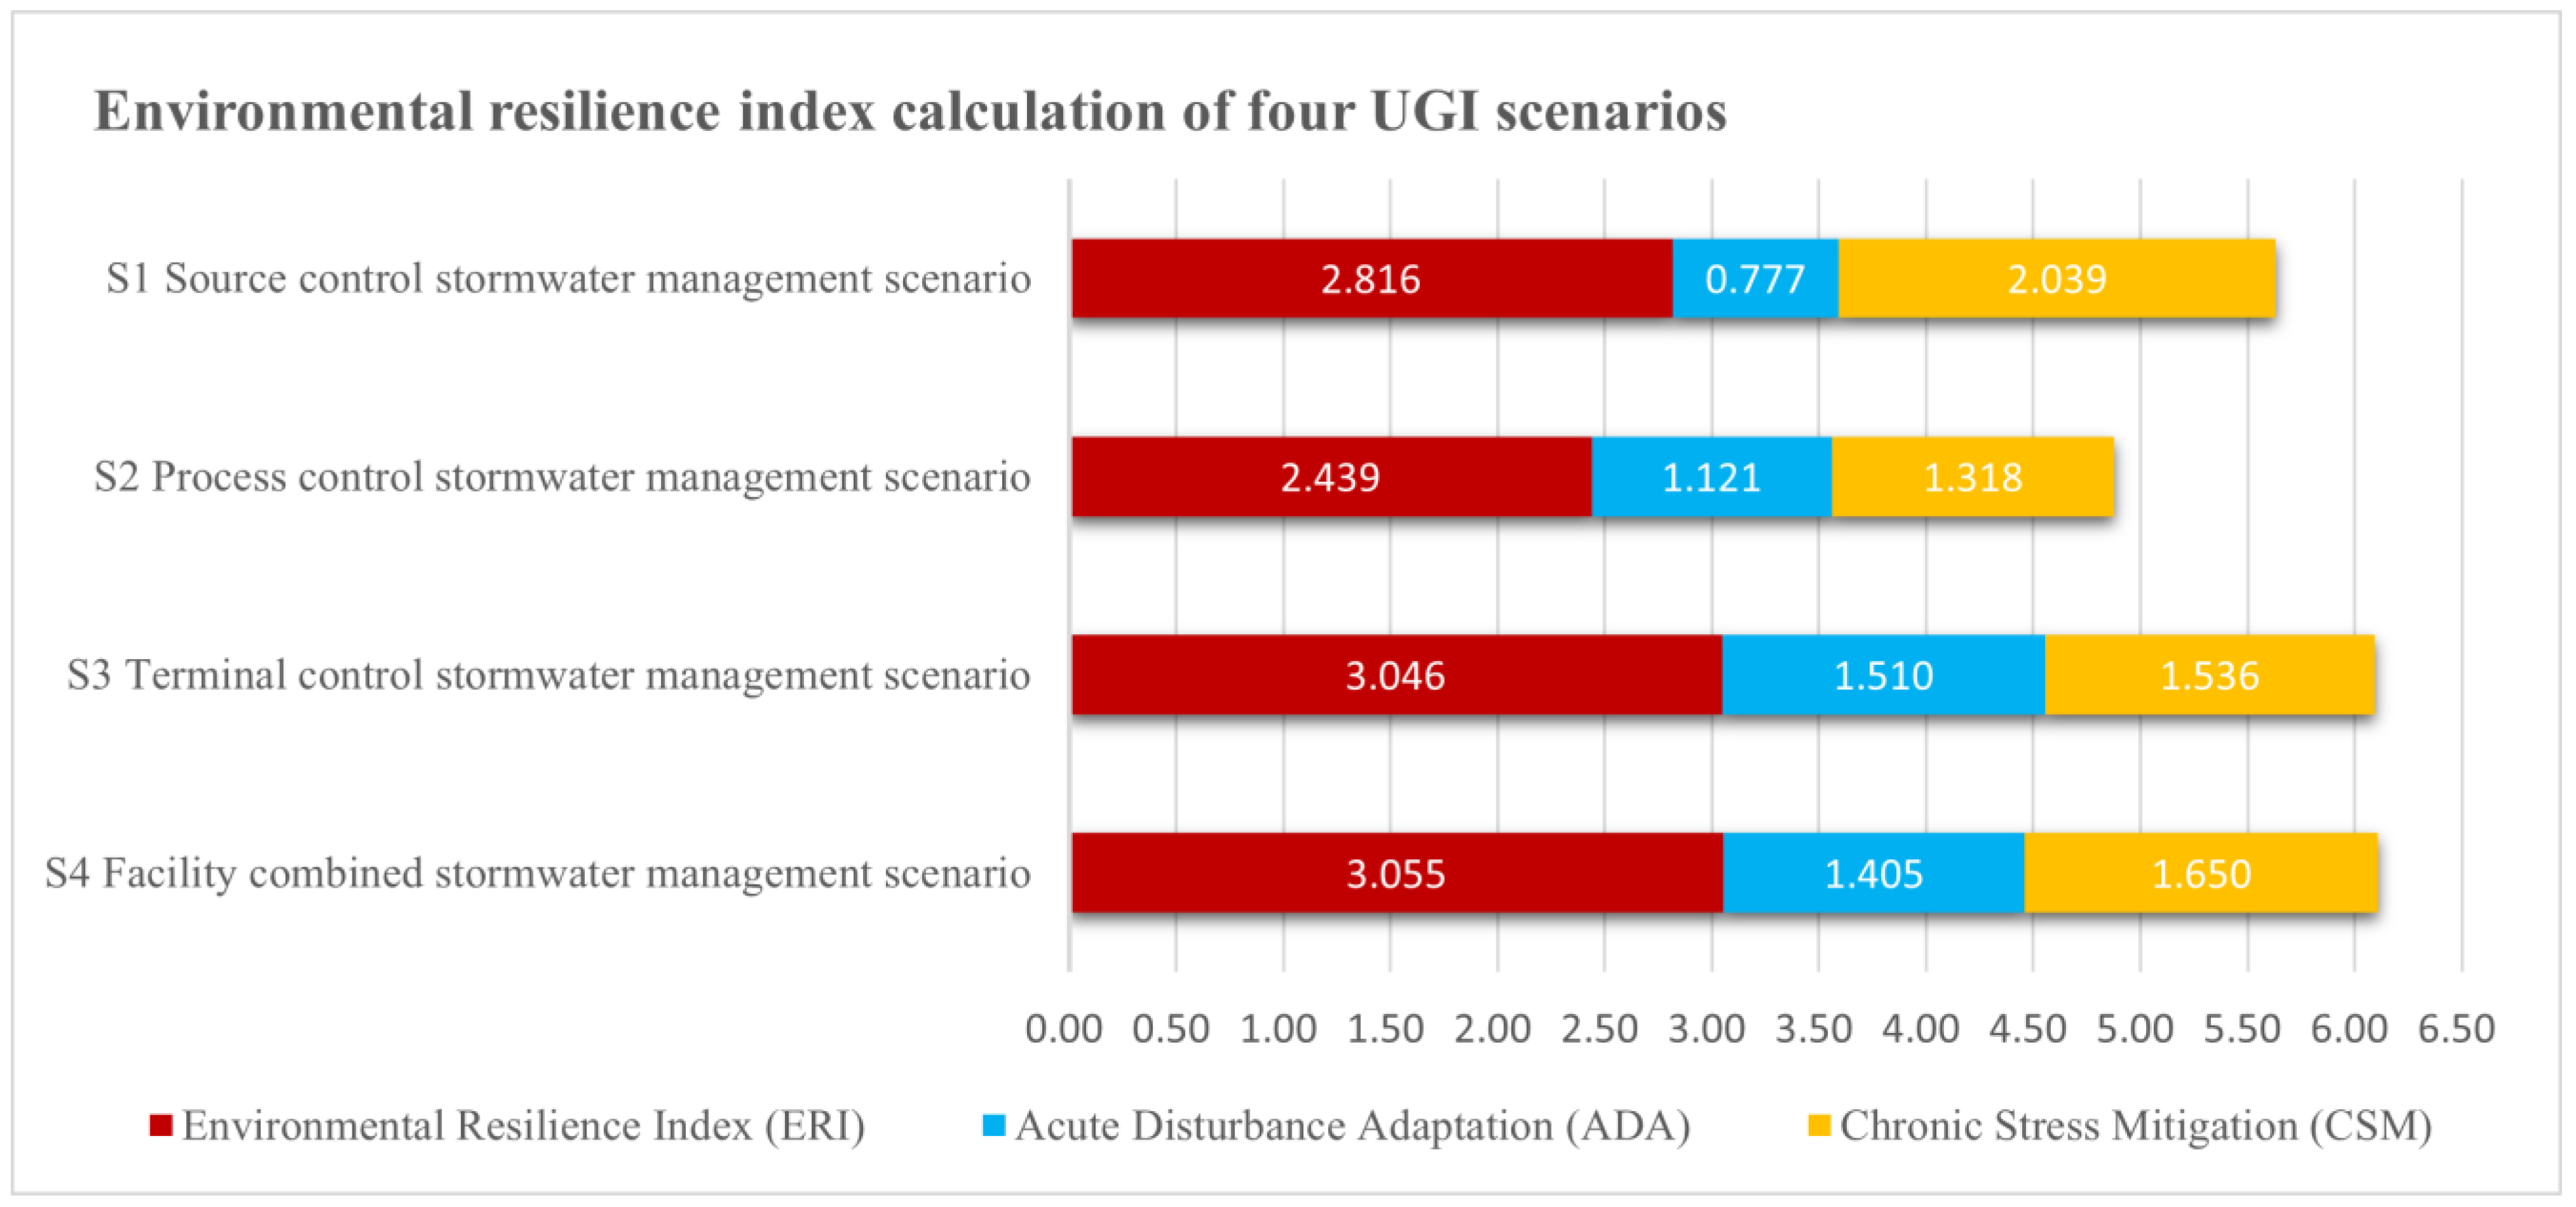
As per the environmental resilience index evaluation method outlined in Section 2.1.2, each indicator’s simulation scores were categorised based on set criteria. Subsequently, the environmental resilience index for each of the four green infrastructure layout scenarios was computed using the environmental resilience index’s weighted formula. Based on the composite performance score of the environmental resilience index (ERI), the S4 facility combined stormwater management scenario achieved the highest score (3.055), followed by the S3 terminal control stormwater management scenario (3.046) and the S1 source control stormwater management scenario (2.816). The lowest score was recorded by the S2 process control stormwater management scenario (2.439). More details are shown in Table 9 and Figure 5. Regarding the overall score for the category of ADA, the S3 scenario achieved the highest score (1.510), while the S1 scenario scored the lowest (0.777), reflecting a difference of 94.34%. The S4 scenario ranked second, and the S2 scenario ranked third. On the other hand, regarding the overall score for the category of CSM, the S1 scenario recorded the highest score (2.039), while the S2 scenario had the lowest score (1.318), indicating a variance of approximately 54.70%. Furthermore, the S4 scenario secured the second position, and the S3 scenario ranked third.
Figure 6 illustrates that each strategy possesses distinct advantages and disadvantages. Concerning the module of A-1 extreme weather adaptation capability, the S3 scenario received the highest score (1.166). Conversely, both the S1 and S2 scenarios shared the lowest score (0.433), resulting in a variance value as high as 2.69. Regarding resilience to the module of A-2 extreme weather recovery capability, the S2 scenario achieved the highest score (0.688), while the S1 and S3 scenarios ranked lowest (0.344), exhibiting a differential factor of up to 2.0 times. In the B-1 climate adaptation module, the S1 scenario topped the list with the highest score (0.685). The other scenarios jointly held the second position with a score of (0.481), resulting in a variance of approximately 42.41%. Within the B-2 ecological environment improvement module, the S1 scenario achieved the highest score (0.808), while the S2 scenario received the lowest score (0.471), marking a disparity of 1.72. As for the B-3 resource consumption reduction module, the S1 scenario reached the top score (0.546), whereas the S2 scenario came in at the lowest score (0.366), reflecting a difference of 49.18%.
While the S4 combination scenario achieved the highest score in the environmental response index (ERI), each scenario presented notable advantages and disadvantages when evaluated against the categories of acute disturbances and chronic stressors. Firstly, the S3 scenario was highly adaptable for reducing runoff and managing flood flow during extreme weather events. Compared to other solutions, the S3 scenario demonstrated the effective regulatory function of the UGI storage facilities in creating floodwater removal channels and storage space during the flood season [84]. Stormwater detention basins can help manage excess stormwater and control peak flooding [72,77]. Specifically, the S3 scenario for urban rainwater runoff involved source control and process management measures to reduce emissions and purify stormwater, which included setting up storage facilities near the outfall of the stormwater pipe network to store and gradually release rainwater into natural receiving water bodies.
Second, the S1 source control stormwater management scenario surpassed the other three scenarios in every aspect of chronic stress mitigation. Due to the high proportion of plant greening, eco-friendly materials, low environmental load during the construction period, and high environmental benefits during the operation period adopted in the rainwater source management program, the benefits of climate warming abatement caused by greenhouse gas emissions were more prominent than those of the process management and terminal management programs [38]. This advantage was primarily attributed to its more effective management of cumulative greenhouse gas (GHG) emissions and urban cooling efficiency over the lifecycle [40,60]. Lu [85] conducted a comprehensive lifecycle assessment of two prevalent urban stormwater low-impact development (LID) technologies, revealing that LID installations featuring rain gardens significantly outperformed those utilizing infiltration paving and infiltration tube wells with respect to CO2 reduction. Wang et al. [86] conducted corresponding environmental and economic lifecycle assessments of green and grey stormwater infrastructure for wastewater treatment systems, demonstrating that the stormwater source management options represented by bioretention ponds and green roofs can achieve water quality improvement goals at the lowest climate and economic costs.
Third, although the S2 process control scenario did not receive a high overall performance rating in ADA, it offered optimal time efficiency for swift recovery from flood impacts during extreme weather. This recovery time was significantly lower than those of the S1 source control scenario and the S3 terminal control scenario, indispensable in mitigating acute disturbances and restoring urban resilience [46]. The composition and particle size of the media material could influence the stormwater transport efficiency of grassed swales. According to Emre and Melek [76], the combination of 40% vegetative soil and 60% coarse sand mixture with a side slope of 1:3 presented the best performance in reducing peak overflow rates. In addition, shallow rainwater slow-permeable grassed swales created through a design miming the natural hydrological cycle protect urban ecosystems and enhance natural habitats [87].

3.2. UGI for the Adaptation to the “Black Swan” Phenomenon

Since the 21st century, climate change has frequently triggered “Black Swan” events. Traditional municipal grey infrastructure is vulnerable, which continues to cause massive disasters worldwide. Given the rising occurrence of extreme climate events nowadays, the intelligent combination of green–grey infrastructure improves the stability and effectiveness of urban flood management, enabling cities to respond effectively to and recuperate from extreme weather events like heavy rainfalls and flooding [88].
From Figure 7, it is evident that the S3 terminal control stormwater management scenario was the best solution for adapting to extreme weather and mitigating acute disturbances. In Jia et al. [44]’s study, they found that source and process management facilities like bioretention ponds and grassed swales were significantly less adequate in retention storage, sedimentation, diversion, and infiltration compared to end-of-pipe management facilities such as stormwater detention basins and other detention basins. Xian et al. [45] noted that the S2 scenario involving grassed swales also demonstrated a lower reduction in flood flow during 1-in-20-years, 1-in-50-years, and 1-in-100-years rainstorms compared to the S3 scenario with regulating ponds. The S3 scenario was vital in regulating flood flow and delaying runoff peaks by utilizing detention basins and detention basins integrated with municipal stormwater pipes and river networks. These facilities could be combined with urban built environments such as parking lots, playgrounds, and parks to retain stormwater runoff on-site during extreme weather conditions, thus reducing the risk of flooding in high-density built-up areas. Moreover, UGI facilities should be customized to fit the local context. Due to stormwater management performance being significantly affected by the topography of the urban landscape, the S3 terminal control scenario has a more practical application in mountainous and hilly cities compared to cities on plains [89].
The S2 process control stormwater management scenario excelled in extreme weather recovery, surpassing the S1 source control scenario and S3 terminal control scenario. It was also more efficient than the S4 facility combined stormwater management scenario, making it well-suited for the rapid recovery of detention capacity from extreme weather. The peak recovery times in the S2 scenario for both the 1-in-10-years and 1-in-100-years flood were under 280 min, demonstrating that shallow grassed swale, as a crucial urban stormwater management facility, can reduce flood peak recovery time in terms of flood water transmission, which offers substantial benefits for resilient flood risk management and rapid disaster recovery [90,91]. Due to the impact of shallow grassed swales on regulating runoff, including rainfall patterns, vegetation and soil conditions, and clogging, it is essential to inspect and replace clogged soil substrates regularly. Strengthening daily maintenance and management will help maintain effective rainfall reduction and storage [46]. The S2 scenario adapted to this technology involved creating grassed swales with vegetation along both sides of the roadways, which collected, conveyed, and discharged stormwater runoff while purifying the water of nitrogen, phosphorus, and other eutrophic substances [75].
By comparison, the S1 source management scenario scored lowest in all the indicators and had the lowest overall rating in ADA. The source control approach, which mimicked the natural state of the watershed through rain gardens/bioretention ponds and utilized mulch, artificial fill layers, gravel layers, and various combinations of vegetation, was more effective in removing surface source pollution but less energy efficient in terms of total runoff control and the reduction in runoff peaks [92,93]. These results suggest that employing the S1 source control strategy alone may not effectively mitigate acute disturbances. It is recommended that this approach be combined with process management and terminal control strategies for enhanced outcomes.
Overall, the S3 scenario had the highest score due to its significant advantage in regulating extreme weather, which comprised 67% of the environmental resilience index’s weighting in the acute disturbance adaptation (ADA) category. While the S2 scenario excelled in recovering from extreme weather, it only accounted for 33% of the environmental resilience index’s weighting in the ADA category and ended up in third place. The S4 integrated scenario combined source, process, and terminal management strengths, excelling in the modules of “extreme weather adaptation capability” and “extreme weather recovery capability”, ranking second in the ADA category.

3.3. UGI for the Mitigation of the “Gray Rhino” Phenomenon

Unlike rare “Black Swan” events, “Gray Rhino” phenomena refer to highly probable, high-impact, and predictable issues or risks that are often overlooked until they become urgent [94]. In the context of climate change, some typical “Gray Rhino” phenomena, including sea-level rise, fluctuations in agricultural production, water scarcity, and uncertainty in energy supply, pose higher demands and challenges for integrated urban governance [95]. These issues require global cooperation, policy formulation, technological innovation, and changes in social behaviour to be addressed and adapted. Based on the ReCiPe 2016 handbook, a harmonized lifecycle impact assessment method [61], the characterization factors at the endpoint level typically implemented three protection areas: human health, ecosystem quality, and resource scarcity. LCA aims to compare options or pinpoint stages in the production process that exert a relatively high level of pressure on the environment [52]. In this study, the chronic stress brought about by the “Gray Rhino” phenomenon was primarily reflected in three significant aspects: climate change, ecological damage, and resource depletion.
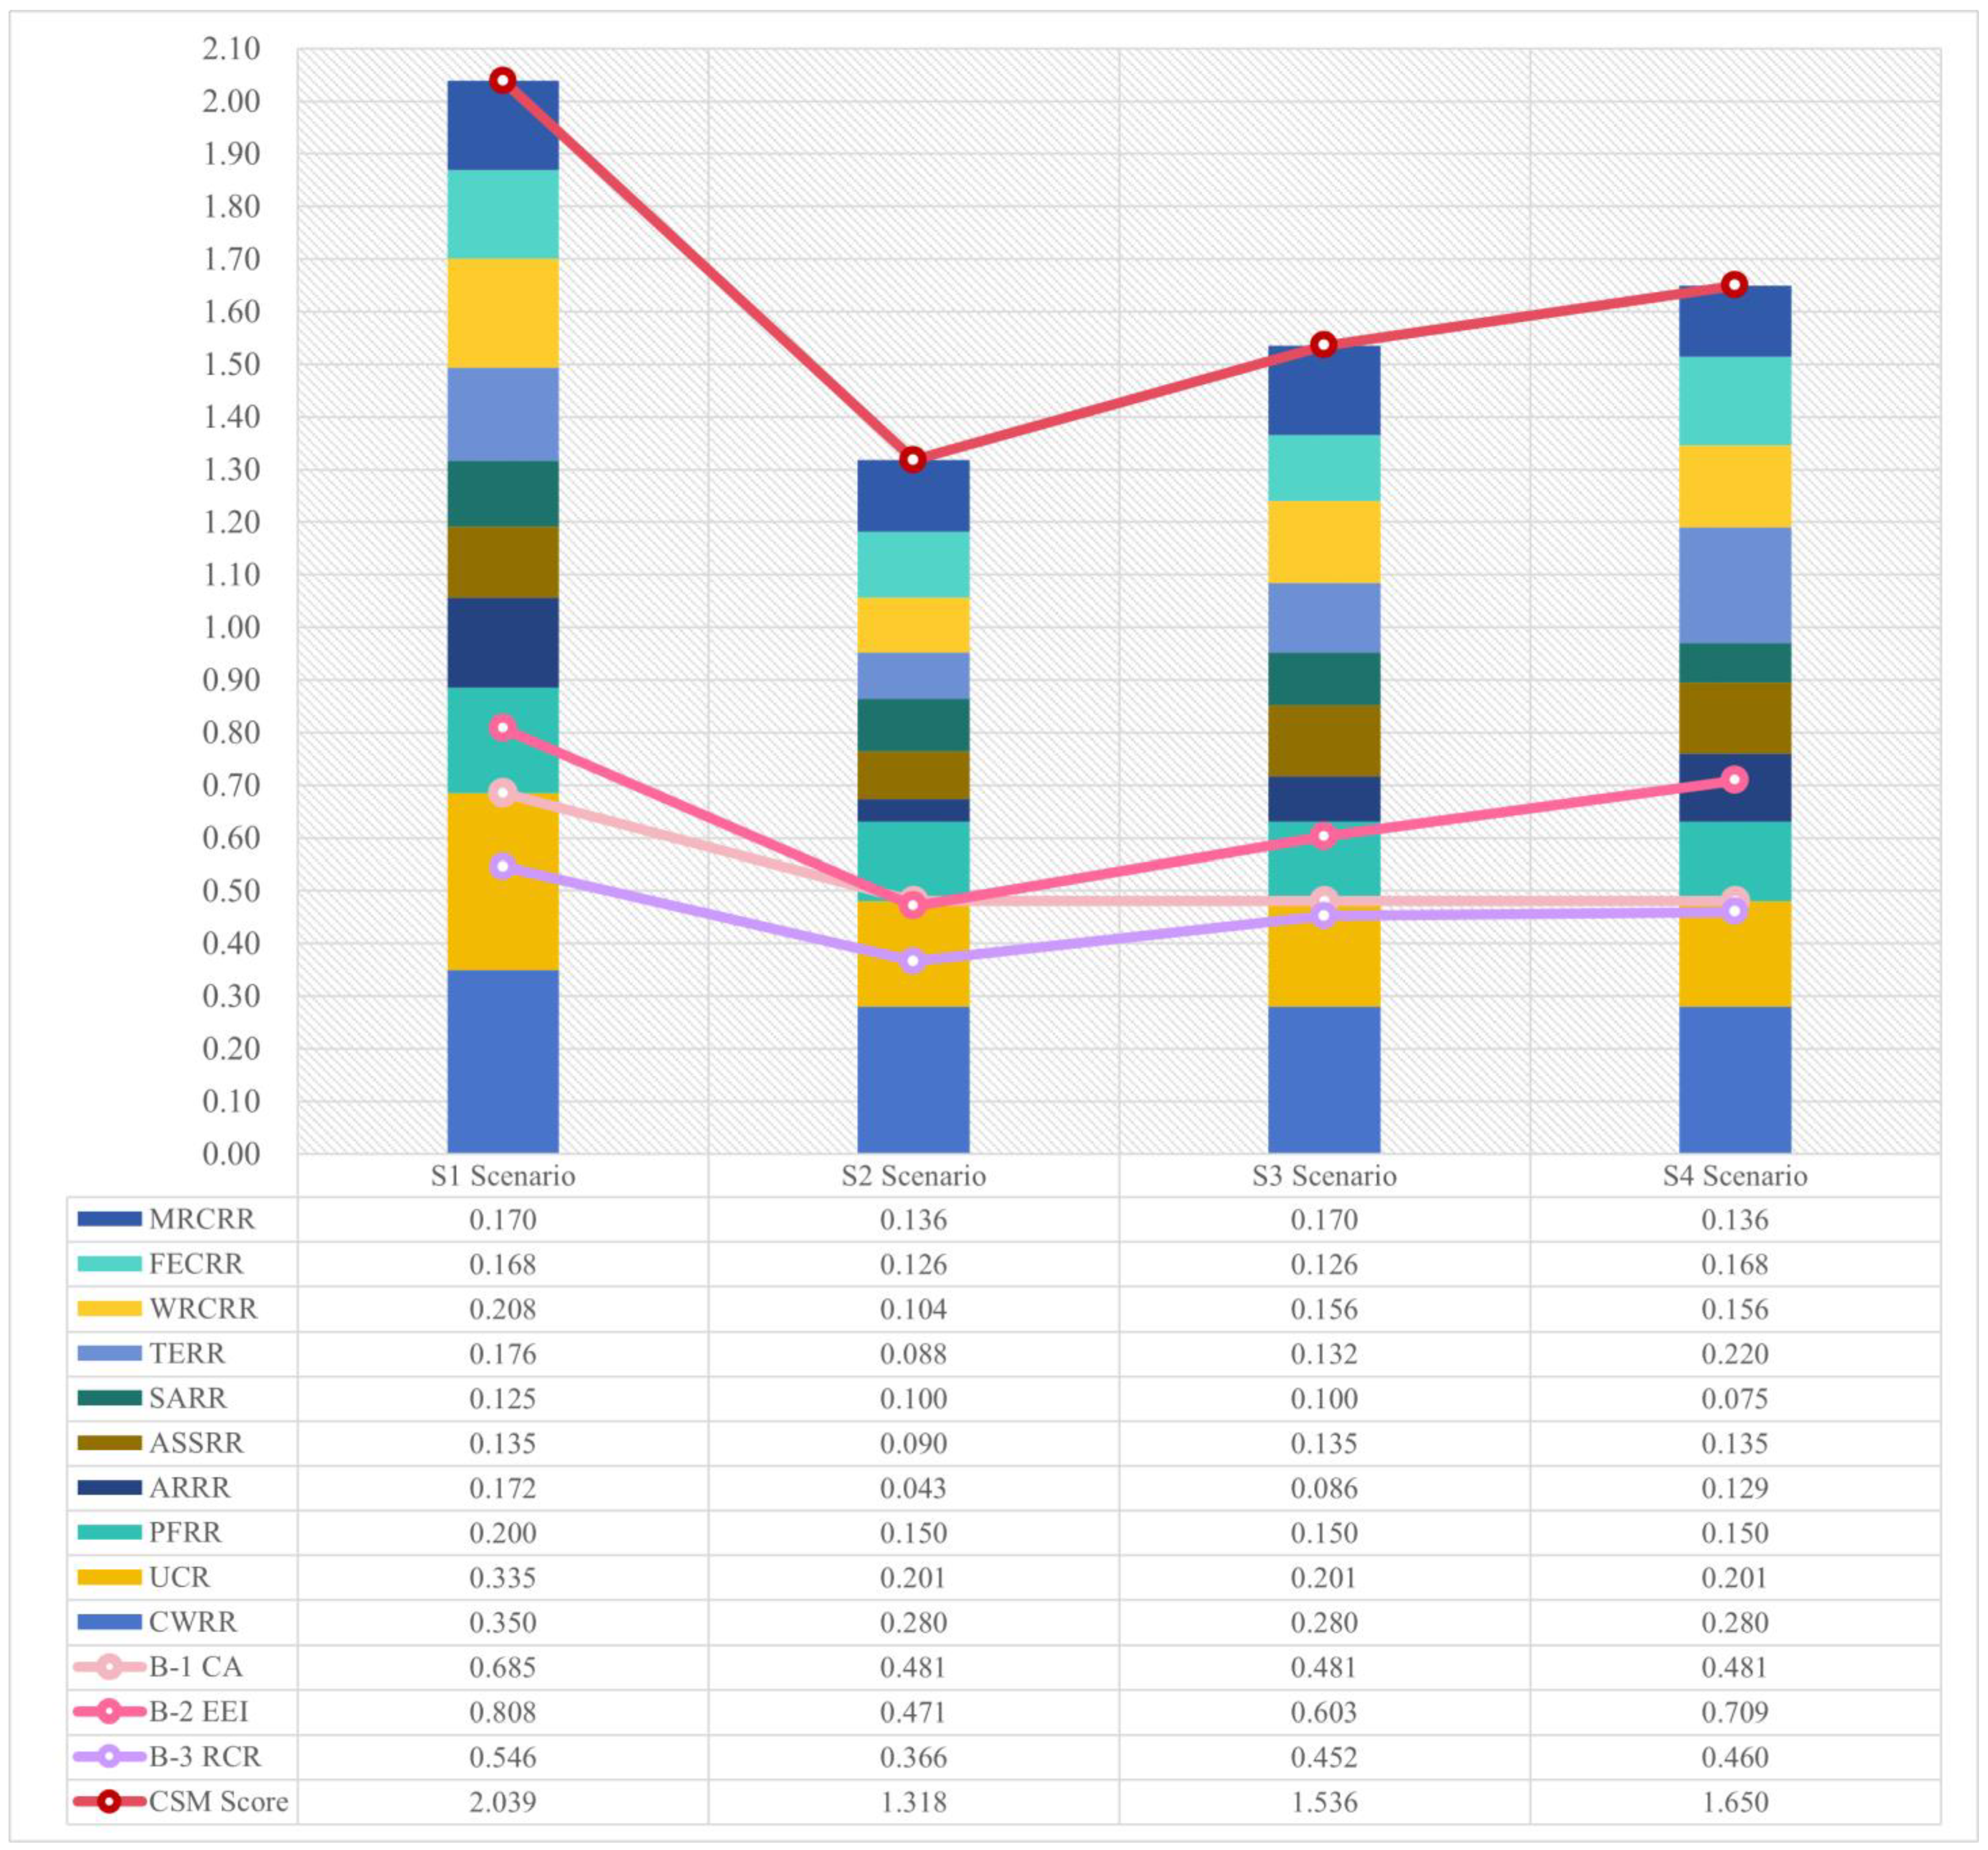
In Figure 8, it is clear that the S1 source control stormwater management scenario outperformed the other three scenarios across all the CSM modules, making it the optimal strategy for addressing chronic stress disturbances which accumulate gradually over the lifecycle. Firstly, improving the urban heat island effect and enhancing the microclimate of densely populated areas are crucial for maintaining city resilience. Previous studies have identified environmentally sustainable solutions utilizing green infrastructure’s adaptive and mitigative qualities [89,96]. According to our simulation, the variability in the performance of the selected UGI scenarios was mainly focused on the energy efficiency of carbon dioxide absorption. Thanks to the widespread use of source control UGI facilities such as green roofs, permeable paving, rain gardens, and bioretention ponds, its ability to regulate the urban heat island was significantly better than the other options due to its CO2 absorption capacity and the evapotranspiration of surface water [97].
The second primary concern in the entire lifecycle assessment was the method for quantifying the improvement in the environmental quality. The S1 scenario, concerning the module of ecological environment improvement, boasted the highest score for environmental resilience, exhibiting exceptional outcomes in specific metrics including the “particle formation reduction rate”, the “average annual runoff reduction rate”, the “soil acidification reduction rate”, and the “terrestrial ecotoxicity reduction rate”. Yan [98] demonstrated that bioretention ponds, green roofs, and permeable paving have a significant improvement effect on freshwater eutrophication and marine eutrophication during the operation phase and contribute significantly to the reduction in ecotoxicity on both land and sea. Rong et al. [99] explored the optimal advantages of managing flood flow, total suspended solids’ (TSS) discharge, and runoff coefficients using a suite of source control facilities, including green roofs, permeable pavements, and bioretention ponds, during recurrent flood events. Moreover, at site scales like urban neighbourhoods, campuses, and airports, source control facilities such as bioretention ponds and rain gardens demonstrate considerable superiority over other LID structures in managing runoff control rates, reducing TSS loads, and enhancing toxic removal rates under conditions of frequent heavy rainfall [78,100,101].
Further, Wang et al. [38] demonstrated that bioretention systems applied in different scenarios could compensate for adverse changes caused by urbanization and climate changes leading to an improvement in the runoff quality (total suspended solid loads) and a reduction in the peak volume. The total annual runoff and suspended solids’ reduction rates do not correlate linearly in highly urbanized, densely built-up areas. Since future impacts on runoff quality will be more sensitive than those on quantity, the parameterization of UGI facilities should priorities improving runoff quality through peak runoff abatement. Tiwari and Kumar [102] illustrated that particle number reduction is particularly effective in the presence of UGI with coniferous trees, which increases surface roughness and deposition compared to other UGI scenarios. Flynn and Traver [37] identified that using bark mulch for ground cover during the construction phase is considered the most significant construction impact related to soil acidification potential. It could be replaced with mulch from tree clippings and other organic waste types generated by bio-infiltration rain gardens. The application of UGI facilities also helps with the sustainable remediation and redevelopment of brownfield sites, particularly in mitigating ecotoxicity [103].
Thirdly, within the resource consumption reduction module, the S1 scenario attained the highest environmental resilience index score, surpassing the S2 scenario, which registered the lowest score, by 49.18%. It was noticed that bioretention ponds primarily consisted of natural vegetative material and featured a relatively straightforward structure. The materials required for their construction were directly sourced from nature, resulting in the minimal consumption of fossil fuels, minerals, and water resources and, consequently, the lowest environmental impact. The LCA for resource consumption mainly concerned water use, fossil energy, and mineral resources. Notably, it held a considerable edge in the water resources’ consumption reduction rate indicator. Climate change-induced water resource depletion has wrought catastrophic impacts on the planet in recent years. Since water which has been consumed is not available anymore in the original watershed for humans or ecosystems, conserving water resources is a shared responsibility for all of humanity. Studies have shown that reductions in blue water (the amount of water in lakes, rivers, aquifers, and precipitation) may also reduce the amount of available green water (soil moisture), which can lead to a reduction in plant species [61]. Due to its wide distribution and permeability, UGI systems of source management measures can replenish green water in large quantities, never mitigating the scarcity of blue water. Furthermore, bioretention ponds and rain gardens provide additional benefits by reducing the volume of effluent treated at downstream wastewater treatment plants, including reduced water consumption and significant wastewater treatment energy consumption [37].
On the other hand, all fossil fuels are non-renewable, encompassing crude oil, natural gas, hard coal, lignite, and peat. As these resources become depleted in areas of low latitudes and altitudes, humanity will inevitably extend extraction to higher latitudes and altitudes in its pursuit of survival, resulting in significant environmental pollution and substantial consumption costs [56]. UGI facilities should focus on leveraging nature-based solutions to decrease reliance on artificial materials and reduce the need for manual maintenance. The efficiency of exploiting fossil fuel resources, both in the short term and in the long term, is a factor in advancing the goals of green development all over the world, essential for advancing sustainable human development [62]. Further, due to the limited availability of mineral resources, primary extraction will inevitably lead to a reduction in ore grade, signifying a lower resource concentration within global ore deposits. Consequently, this necessitates mining a larger volume of ore to obtain a kilogram of the mineral resource at hand. The application of UGI facilities strikes a balance between the escalating demand for mineral resources and the imperative for sustainable consumption, a critical challenge in pursuing a genuinely green economy. Moreover, promoting mineral resource efficiency is pivotal for green growth, stimulating economic growth and cultivating healthy environments and thriving communities for future generations [63].
Overall, the S1 source control stormwater management scenario achieved the highest score in the environmental resilience index within the chronic stress mitigation (CSM) category. In contrast, the S2 process control stormwater management scenario registered lower sub-scores across all three modules. Notably, the S2 scenario exhibited the most significant shortfall in the module of ecological environment improvement (EEI), scoring 71.55% lower than the S1 scenario. Given that the EEI module carried the major weight in the CSM section (as high as 0.44), this resulted in the S2 scenario having the lowest overall final performance score. Conversely, the S4 facility combined stormwater management scenario performed well in all the significant evaluation categories and secured the second-highest overall score in the final composite performance measure (CSM) index. When contrasted with the lower-ranked S2 and S3 scenarios, the S4 scenario aligned with the benefits of S1 source solution and combined the strengths of the other solutions. This resulted in a reduced and more sustainable environmental footprint and resource consumption for urban development.

3.4. Innovation and Future Applications

The prevailing UGI evaluation index systems typically focus on attenuating stormwater runoff during acute disturbances or on the environmental impact throughout UGIs’ lifecycle under chronic stress, but they rarely consider both simultaneously. Common indicators for acute disturbances include the annual runoff reduction rate, the annual suspended solids’ reduction rate, and the flood flow reduction rate for a one-in-ten-years rainstorm event. For chronic stress, the usual indicators encompass climate warming potential, particulate matter formation, soil acidification reduction rate, terrestrial ecotoxicity reduction rate, and reductions in fossil energy and mineral resource consumption. The indicators above are independent and lack interconnectivity.
In this study, we introduced an innovative coupled environmental resilience assessment system that can address acute disruption adaptation and chronic stress mitigation, offering tailored and comprehensive solutions according to specific situational requirements. As shown in Table 10, the four UGI scenarios showed varying rankings in their acute disturbance adaptation (ADA) score, chronic stress mitigation (CSM) score, and environmental resilience index (ERI). Regarding the ADA ranking, the S3 terminal control scenario was far superior than the S1 source control scenario and more appropriate than the S2 process control scenario and S4 facility combined scenario for handling sudden “Black Swan” extreme weather events. Regarding the CSM ranking, the S1 source control scenario was far superior to the S2 process control scenario. It was also better suited than the S3 terminal control scenario and the S4 facility combined scenario to deal with known and foreseeable “Grey Rhino” phenomena that often do not receive appropriate attention and response for various reasons. When evaluating the overall environmental resilience performance throughout the lifecycle in response to the typical challenges associated with both “Black Swan” and “Grey Rhino” phenomena, the S4 facility combined scenario excelled over the other scenarios.
The ERI framework could integrate the Delphi-AHP methodology into the urban planning support system to facilitate and assess various scenarios as comparable indicators for improving urban resilience and suggesting “preferred” scenarios. Our approach could support comprehensive decision making by utilizing the SWMM, GaBi, and i-Tree models to combine diverse quantitative data and establish feedback loops via scenario development, modelling, and surveys. The assessment process in our study began with building a robust system of indicators and clarifying each element’s synergistic or trade-off efficacy in improving urban resilience. We then explored the assessment performance of diverse UGI scenarios to help readers relate and track the effectiveness of the indicators in building urban resilience, including acute disturbance adaptation to “Black Swan” events and chronic stress mitigation to “Gray Rhino” events. Our experiments simulating different UGI scenarios provided additional value to the quantitative metrics’ assessment hierarchy. We proposed an innovative methodology for assigning weights and ratings to ERI indicators through literature research, case studies, and expert scoring. This methodology allows one to apply the assumptions and modelling approach for quantitative indicators proposed in this paper by flexibly adjusting the parameters according to different geographic regions. This innovation significantly enhances UGI evaluation methodology and allows stakeholders to offer input and examine alternatives that align with their preferences and interests.
However, some limitations require further work. The methodology used to evaluate the resilience of UGI, as established in this study, was only applied in one case in southern coastal China. More applications in different climatic or geographic regions are needed to verify its effectiveness. Additionally, the performance of alternative UGI solutions and non-resilient sites across diverse locations should be compared using a consistent method and ERI calculations in future studies, providing a more scientific basis for making effective UGI planning and design decisions.

4. Conclusions

This paper proposes an innovative methodology to evaluate the discrepancies in the comprehensive performance of representative UGI scenarios. It aimed to achieve the following: (1) introduce a lifecycle resilience assessment framework for UGI which addressed acute disturbances and chronic stresses via five modules and sixteen indicators; (2) develop a robust evaluation method which integrated the SWMM, GaBi, and i-Tree models to simulate the lifecycle resilience of UGI and assigned all the selected indicators through Delphi-AHP analysis; and (3) create an environmental resilience index (ERI) for UGI to facilitate comparisons between different scenarios and identify the most effective option. This paper draws the following main conclusions:
First, a coupled environmental resilience evaluation system was proposed that encompassed indicators for the adaptation to acute disturbances and the mitigation of chronic pressures. The evaluation system covered five modules, and each module consisted of two-to-five typical or advanced indicators, which were essential supplements to current research on the correlation between UGI facilities and urban resilience measurement.
Second, the inventive formulas for calculating the environmental resilience index were presented, which established the weighting of indicators through Delphi-AHP analysis, and the SWMM, GaBi, and i-Tree models were employed for the quantitative assessment. Also, this study innovated standardized methods and resilience index algorithms through empirical analysis and data comparison.
Third, four representative UGI scenarios in urban built-up areas of Zhuhai city were selected for a comparative analysis and an in-depth discussion by calculating the resilience index. The results identified that the S3 terminal control scenario had the most substantial ability to deal with “Black Swan”-type acute disturbance disasters. In contrast, the S1 source control scenario was more suitable for adapting to recovering “Gray Rhino”-type chronic pressures. When considering both components, the S4 facility combined scenario exhibited the best performance.
In sum, this study developed an innovative urban environmental resilience index (ERI) and a methodology for evaluating the resilience performance of UGI over its lifecycle, including acute disturbance adaptation and chronic stress mitigation. It also discussed the strengths and weaknesses of each UGI scenario in dealing with “Black Swan” events and “Gray Rhino” phenomena. This study aimed to provide adaptative solutions and preferable decisions to urban planning decision makers and stakeholders. These findings attempt to support the practice of UGI planning and design for strengthening urban resilience and provide scientific evidence to assist policymakers in advancing resilient cities.

Supplementary Materials

The following supporting information can be downloaded at https://www.mdpi.com/article/10.3390/w16081162/s1: Figure S1: SWMM model construction graph.

Author Contributions

Conceptualization, F.X. and B.L.; methodology, B.L.; software, S.X.; validation, S.X., X.Y. and J.L.; formal analysis, Y.F.; investigation, X.Y.; resources, J.L. and R.Z.; data curation, S.X.; writing—original draft preparation, F.X. and X.Y.; writing—review and editing, F.X. and B.L.; visualization, S.X.; supervision, Y.F.; project administration, B.L.; funding acquisition, B.L. All authors have read and agreed to the published version of the manuscript.

Funding

This research was funded by the National Natural Science Foundation of China [grant number 52078004] and the Science, Technology and Innovation Commission of the Shenzhen Municipality [grant numbers KCXFZ20211020164205009 and KCXST20221021111416039].

Data Availability Statement

The data that support the findings of this study are available from the corresponding author upon request.

Conflicts of Interest

Although the author work with a company, this article have no conflict of interest with the company.

Appendix A. Data Information

Table A1. Land use and land cover in the study area.
Land Use/Land CoverArea
(ha)
Percentage of the Total AreaBuilding DensityGreen Space RatioImpervious Area Ratio
Residential60.4133.2%20%35%45%
Commercial8.724.8%35%30%35%
Government and Community11.076.1%30%35%35%
Roads40.3022.2%0%5%95%
Squares1.030.6%0%25%75%
Municipal Utilities1.781.0%30%30%40%
Public Green Space45.0424.8%0%80%20%
Water Area13.467.4%0%0%0%
Total181.81100.0%///
Note: “/” represents “not applicable”.
Table A2. Properties of sub-catchments and links in SWMM.
Parameter NameParameter Value
N-Perv a0.24
N-Imperv a0.012
Dstore-Perv (mm) a4
Dstore- Imperv (mm) a1.27
Max. Infil. Rate (mm/h) b50
Min. Infil. Rate (mm/h) b3
Note: Values a are derived from (1) Wang R., Qin H. P., & Zhao Z. J. (2015). Control Studies of Peak Flow and Non-point Source Pollution for Urbanized Area Based on SWMM. Acta Scientiarum Naturalium Universitatis Pekinensis. 51(1), 141–150. (in Chinese) [104]; (2) Wu Y. N., Xiong, J. Q., Ren X. X., & Wang X. C. (2015). Sensitivity analysis and calibration study on the parameters of SWMM for Ejing watershed in Shenzhen. Water & Wastewater Engineering. 11, 126–131 [105]. Values b are derived from the user manual of EPA SWMM.
Table A3. Properties of TSS in SWMM.
Land Use/Land CoverTSS Parameter NameParameter Value
RoofMax. Buildup (kg/ha) a300
Sat. Constant a10
EMC Coefficient (mg/L) b35.94
Pavement/RoadMax. Buildup (kg/ha) a500
Sat. Constant a10
EMC Coefficient (mg/L) b151.73
GrassMax. Buildup (kg/ha) a300
Sat. Constant a10
EMC Coefficient (mg/L) b72.98
Note: Values a are derived from (1) Huang G. R., & Nie H. F. (2012). Characteristics and Load of Non-Point Source Pollution of Urban Rainfall Runoff in Guangzhou, China. Journal of South China University of Technology. 40(2), 142–148. (In Chinese) [106]; (2) Wang R., Qin H. P., & Zhao Z. J. (2015). Control Studies of Peak Flow and Non-point Source Pollution for Urbanized Area Based on SWMM. Acta Scientiarum Naturalium Universitatis Pekinensis. 51(1), 141–150. (In Chinese) [104]. Values b are based on field monitoring at Doumen, Zhuhai city.
Table A4. Design parameters of GSI strategies in SWMM.
LayerParameterGrass Swales (GSs)Bioretention (BR)Detention Basins
SurfaceStorage depth (mm)3002001500
Vegetation volume fraction0.10.1/
Manning’s roughness coefficient (n)0.150/
SoilThickness (mm)300400/
Porosity0.350.35/
Field capacity0.120.12/
Wilting point0.0650.065/
Conductivity K (mm/h)36361
PavementThickness (mm)///
Void ratio///
Permeability (mm/h)///
StorageHeight (mm)150200/
Void ratio0.650.65/
Conductivity (mm/h)36/
UnderdrainEmptying time12 h24 h48 h
Note: “/” represents “not applicable”.
Table A5. Material lists for the construction and operation period in each scenario.
PhaseMaterialS0S1S2S3S4
ConstructionLamps10,5725713844780616919
Solid construction timber (m3)1977827961970955
Steel (m3)301137154132147
Clay brick (m3)5722047289925401814
Coarse sand (m3)810017,33012,271653512,505
Graded broken stone (m3)29,16020,04323,31022,02022,026
Granite (m3)115824718563455165786
C20 concrete (m3)26,80413,78015,473155,78317,200
Cement mortar (m3)72903454358237084016
Gravel (m3)78913,63210,896513010,295
PVC200 (m)/22,7201,2971615614,544
Fine sand (m3)/9088//3181
Geotextile (m2)56,850156,250102,25060,612102,954
HDPE (m2)26,000//20,5206840
Planting soil (m3)55,27151,40447,04957,85152,009
Excavation (m3)26,00056,80035,41298,49665,106
Grass (m2)364,000388,140390,965391,040387,592
Shrub (m2)172,353165,230154,585160,260161,968
Tree (m2)243,648230,845231,840228,700217,063
Power consumption (MJ)172,800172,800172,800172,800172,800
Oil consumption (kg)111,302111,302111,302111,302111,302
OperationPower consumption (MJ)48,633,96526,924,12338,165,19635,878,44231,739,972
Oil consumption (kg)17,220,78911,286,27211,604,70411,622,58011,267,158
Water consumption (kg)19,188,00017,631,61517,853,78017,747,10017,295,555
Note: “/” represents “not applicable”.

References

  1. Moore, F.C.; Lacasse, K.; Mach, K.J.; Shin, Y.A.; Gross, L.J.; Beckage, B. Determinants of emissions pathways in the coupled climate–social system. Nature 2022, 603, 103–111. [Google Scholar] [CrossRef]
  2. Rockström, J.; Gupta, J.; Qin, D. Safe and just Earth system boundaries. Nature 2023, 619, 102–111. [Google Scholar] [CrossRef]
  3. Barry, R.; Barbecot, F.; Rodriguez, M.; Mattéi, A.; Djongon, A. Estimating Climate Change’s Impacts on the Recharge of an Ungauged Tropical Aquifer (Togolese Coastal Sedimentary Basin). Water 2024, 16, 731. [Google Scholar] [CrossRef]
  4. UN. The Sustainable Development Goals Report 2023. In Towards a Rescue Plan for People and Planet, Special Ed.; United Nations: New York, NY, USA, 2023; p. 76. [Google Scholar]
  5. Luan, B.; Yin, R.; Xu, P.; Wang, X.; Yang, X.; Zhang, L.; Tang, X. Evaluating Green Stormwater Infrastructure strategies efficiencies in a rapidly urbanizing catchment using SWMM-based TOPSIS. J. Clean. Prod. 2019, 223, 680–691. [Google Scholar] [CrossRef]
  6. Sun, H.; Zhen, F.; Lobsang, T.; Li, Z. Spatial characteristics of urban life resilience from the perspective of supply and demand: A case study of Nanjing, China. Habitat Int. 2019, 88, 101983. [Google Scholar] [CrossRef]
  7. Hong, W.; Guo, R.; Li, X.; Liao, C. Measuring urban ecological network resilience: A disturbance scenario simulation method. Cities 2022, 131, 104057. [Google Scholar] [CrossRef]
  8. Nesshöver, C.; Assmuth, T.; Irvine, K.N.; Rusch, G.M.; Waylen, K.A.; Delbaere, B.; Haase, D.; Jones-Walters, L.; Keune, H.; Kovacs, E.; et al. The science, policy and practice of nature-based solutions: An interdisciplinary perspective. Sci. Total Environ. 2017, 579, 1215–1227. [Google Scholar] [CrossRef]
  9. Browder, G.; Ozment, S.; Rehberger Bescos, I.; Gartner, T.; Lange, G.-M. Integrating Green and Gray: Creating Next Generation Infrastructure; World Bank and World Resources Institute: Washington, DC, USA, 2017. [Google Scholar]
  10. Luan, B.; Ding, R.; Wang, X.; Zhu, M. Exploration of Resilient Design Paradigm of Urban Green Infrastructure. Landsc. Archit. Front. 2020, 8, 94–105. [Google Scholar] [CrossRef]
  11. Luan, B.; Chai, M.; Wang, X. Review of development, frontiers, and prospects of green infrastructure. Acta Ecol. Sin. 2017, 37, 5246–5261. [Google Scholar]
  12. Spaans, M.; Waterhout, B. Building up resilience in cities worldwide—Rotterdam as participant in the 100 Resilient Cities Programme. Cities 2017, 61, 109–116. [Google Scholar] [CrossRef]
  13. Kumareswaran, K.; Jayasinghe, G.Y. Assessment, Quantification, and Valuation of Green Infrastructure. In Green Infrastructure and Urban Climate Resilience: An Introduction; Kumareswaran, K., Jayasinghe, G.Y., Eds.; Springer International Publishing: Cham, Switzerland, 2023; pp. 199–243. [Google Scholar] [CrossRef]
  14. Giudice, B.; Novarina, G.; Voghera, A. (Eds.) Green Infrastructure: Planning Strategies and Environmental Design; Springer: Cham, Switzerland, 2023; p. 186. [Google Scholar] [CrossRef]
  15. Zhao, R.; Fang, C.; Haimeng, L. Progress and prospect of urban resilience research. Prog. Geogr. 2020, 39, 1717–1731. [Google Scholar] [CrossRef]
  16. Liu, L.; Jensen, M.B. Green infrastructure for sustainable urban water management: Practices of five forerunner cities. Cities 2018, 74, 126–133. [Google Scholar] [CrossRef]
  17. Rus, K.; Kilar, V.; Koren, D. Resilience assessment of complex urban systems to natural disasters: A new literature review. Int. J. Disaster Risk Reduct. 2018, 31, 311–330. [Google Scholar] [CrossRef]
  18. Jiang, L.; Liu, S.; Liu, C. The Contributions of Blue-Green Infrastructure to Building Urban Climatic Resilience—Bibliometric Analysis Based on Co-citation Networks. Landsc. Archit. Front. 2021, 9, 8–23. [Google Scholar] [CrossRef]
  19. Meerow, S.; Newell, J.P.; Stults, M. Defining urban resilience: A review. Landsc. Urban Plan. 2016, 147, 38–49. [Google Scholar] [CrossRef]
  20. Folke, C. Resilience; Oxford University Press: Oxford, UK, 2016. [Google Scholar] [CrossRef]
  21. Marchese, D.; Reynolds, E.; Bates, M.E.; Morgan, H.; Clark, S.S.; Linkov, I. Resilience and sustainability: Similarities and differences in environmental management applications. Sci. Total Environ. 2018, 613–614, 1275–1283. [Google Scholar] [CrossRef]
  22. Bush, J.; Doyon, A. Building urban resilience with nature-based solutions: How can urban planning contribute? Cities 2019, 95, 102483. [Google Scholar] [CrossRef]
  23. Cheek, W.; Chmutina, K. Measuring Resilience in the Assumed City. Int. J. Disaster Risk Sci. 2022, 13, 317–329. [Google Scholar] [CrossRef]
  24. Chen, Z.; Qiu, B.; Chen, H. Research on Resiliency Level Promotion And Robustness Strategy of Resilient City System: From Complex Adaptive Systems (CAS) Perspective. Urban Dev. Stud. 2021, 28, 1–9. [Google Scholar]
  25. Zhao, M.-Y.; Yang, Y.-C.; Wang, B. Evaluation and spatio-temporal analysis of urban resilience in Guangdong Province. J. Lanzhou Univ. Nat. Sci. 2022, 58, 412–419+426. [Google Scholar] [CrossRef]
  26. Jiang, Q.; Li, J.; Liang, X.; Xiao, H. Review on the Evaluation of Water-related Ecosystem Service Supply and Demand of Green Infrastructure. Acta Ecol. Sin. 2023, 43, 1738–1747. [Google Scholar] [CrossRef]
  27. Fu, X.; Hopton, M.E.; Wang, X. Assessment of green infrastructure performance through an urban resilience lens. J. Clean. Prod. 2021, 289, 125146. [Google Scholar] [CrossRef]
  28. Calderón-Contreras, R.; Quiroz-Rosas, L.E. Analysing scale, quality and diversity of green infrastructure and the provision of Urban Ecosystem Services: A case from Mexico City. Ecosyst. Serv. 2017, 23, 127–137. [Google Scholar] [CrossRef]
  29. Reynolds, H.L.; Mincey, S.K.; Montoya, R.D.; Hamlin, S.; Sullivan, A.; Thapa, B.; Wilson, J.; Rosing, H.; Jarzen, J.; Grove, J.M. Green infrastructure for urban resilience: A trait-based framework. Front. Ecol. Environ. 2022, 20, 231–239. [Google Scholar] [CrossRef]
  30. Vargas-Hernández, J.G.; Zdunek-Wielgołaska, J. Urban green infrastructure as a tool for controlling the resilience of urban sprawl. Environ. Dev. Sustain. 2021, 23, 1335–1354. [Google Scholar] [CrossRef]
  31. Suárez, M.; Rieiro-Díaz, A.M.; Alba, D.; Langemeyer, J.; Gómez-Baggethun, E.; Ametzaga-Arregi, I. Urban resilience through green infrastructure: A framework for policy analysis applied to Madrid, Spain. Landsc. Urban Plan. 2024, 241, 104923. [Google Scholar] [CrossRef]
  32. Mosleh, L.; Negahban-Azar, M.; Pavao-Zuckerman, M. Stormwater Green Infrastructure Resilience Assessment: A Social-Ecological Framework for Urban Stormwater Management. Water 2023, 15, 1786. [Google Scholar] [CrossRef]
  33. Bibi, T.S.; Kara, K.G.; Bedada, H.J.; Bededa, R.D. Application of PCSWMM for assessing the impacts of urbanization and climate changes on the efficiency of stormwater drainage systems in managing urban flooding in Robe town, Ethiopia. J. Hydrol. Reg. Stud. 2023, 45, 101291. [Google Scholar] [CrossRef]
  34. Li, Y.; Li, Y.; Wu, W. Threshold and resilience management of coupled urbanization and water environmental system in the rapidly changing coastal region. Environ. Pollut. 2016, 208, 87–95. [Google Scholar] [CrossRef]
  35. Rafael, S.; Martins, H.; Sá, E.; Carvalho, D.; Borrego, C.; Lopes, M. Influence of urban resilience measures in the magnitude and behaviour of energy fluxes in the city of Porto (Portugal) under a climate change scenario. Sci. Total Environ. 2016, 566–567, 1500–1510. [Google Scholar] [CrossRef]
  36. Meerow, S.; Newell, J.P. Spatial planning for multifunctional green infrastructure: Growing resilience in Detroit. Landsc. Urban Plan. 2017, 159, 62–75. [Google Scholar] [CrossRef]
  37. Flynn, K.M.; Traver, R.G. Green infrastructure life cycle assessment: A bio-infiltration case study. Ecol. Eng. 2013, 55, 9–22. [Google Scholar] [CrossRef]
  38. Wang, M.; Zhang, D.; Adhityan, A.; Ng, W.J.; Dong, J.; Tan, S.K. Assessing cost-effectiveness of bioretention on stormwater in response to climate change and urbanization for future scenarios. J. Hydrol. 2016, 543, 423–432. [Google Scholar] [CrossRef]
  39. Angrill, S.; Farreny, R.; Gasol, C.M.; Gabarrell, X.; Viñolas, B.; Josa, A.; Rieradevall, J. Environmental analysis of rainwater harvesting infrastructures in diffuse and compact urban models of Mediterranean climate. Int. J. Life Cycle Assess. 2012, 17, 25–42. [Google Scholar] [CrossRef]
  40. De Sousa, M.R.C.; Montalto, F.A.; Spatari, S. Using Life Cycle Assessment to Evaluate Green and Grey Combined Sewer Overflow Control Strategies. J. Ind. Ecol. 2012, 16, 901–913. [Google Scholar] [CrossRef]
  41. Li, Y.; Huang, Y.; Ye, Q.; Zhang, W.; Meng, F.; Zhang, S. Multi-objective optimization integrated with life cycle assessment for rainwater harvesting systems. J. Hydrol. 2018, 558, 659–666. [Google Scholar] [CrossRef]
  42. Tavakol-Davani, H.; Rahimi, R.; Burian, S.J.; Pomeroy, C.A.; McPherson, B.J.; Apul, D. Combining Hydrologic Analysis and Life Cycle Assessment Approaches to Evaluate Sustainability of Water Infrastructure: Uncertainty Analysis. Water 2019, 11, 2592. [Google Scholar] [CrossRef]
  43. Sun, B.; Xie, S.; Wang, Z.; Wu, H.; Liu, H. Shenzhen City waterlogging prevention based on multiple LID schemes. Yangtze River 2020, 51, 17–22. [Google Scholar] [CrossRef]
  44. Jia, H.; Yao, H.; Tang, Y.; Yu, S.L.; Zhen, J.X.; Lu, Y. Development of a multi-criteria index ranking system for urban runoff best management practices (BMPs) selection. Environ. Monit. Assess. 2013, 185, 7915–7933. [Google Scholar] [CrossRef]
  45. Xian, B.C.C.; Kang, C.W.; Wahab, M.A.; Zainol, M.R.R.M.A.; Baharudin, F. Evaluation of low impact development and best management practices on peak flow reduction using SWMM. IOP Conf. Ser. Earth Environ. Sci. 2021, 646, 012045. [Google Scholar] [CrossRef]
  46. Xu, H.; Lyu, W. Research on Application of Grassed Swales on Control of Urban Rainfall and Runoff. Pearl River 2019, 40, 97–100+107. [Google Scholar]
  47. Yu, M.; Fu, T.; Zhang, J.; Wang, G.; Dong, W. Field experiment- based investigation on hydrological benefits of typical sponge facilities in the Yangtze Delta region. Adv. Water Sci. 2022, 33, 894–903. [Google Scholar] [CrossRef]
  48. Huang, C.; Zhang, X.; Han, W.; Liu, C. Scenarios simulation of urban stormwater regulation based on SWMM model and GIS in Zhenjiang City. Yangtze River 2022, 53, 31–36. [Google Scholar] [CrossRef]
  49. Xu, B. Application Study of Mountainous River Management Scheme Based on Numerical Simulation. Water Conserv. Sci. Technol. Econ. 2022, 28, 18–22. [Google Scholar]
  50. Liang, Y.; Sun, P.; Zhang, Q. Copula function-based analysis on characteristics of annual maximum flood peak in Guangdong Province from 1977 to 2014. Water Resour. Hydropower Eng. 2022, 53, 1–17. [Google Scholar] [CrossRef]
  51. Ferreira, C.S.S.; Potočki, K.; Kapović-Solomun, M.; Kalantari, Z. Nature-Based Solutions for Flood Mitigation and Resilience in Urban Areas. In Nature-Based Solutions for Flood Mitigation: Environmental and Socio-Economic Aspects; Ferreira, C.S.S., Kalantari, Z., Hartmann, T., Pereira, P., Eds.; Springer International Publishing: Cham, Switzerland, 2022; pp. 59–78. [Google Scholar] [CrossRef]
  52. Huijbregts, M.A.J.; Steinmann, Z.J.N.; Elshout, P.M.F.; Stam, G.; Verones, F.; Vieira, M.; Zijp, M.; Hollander, A.; van Zelm, R. ReCiPe2016: A harmonised life cycle impact assessment method at midpoint and endpoint level. Int. J. Life Cycle Assess. 2017, 22, 138–147. [Google Scholar] [CrossRef]
  53. Huang, B.; Zhao, J.; Chai, J.; Xue, B.; Zhao, F.; Wang, X. Environmental influence assessment of China’s multi-crystalline silicon (multi-Si) photovoltaic modules considering recycling process. Sol. Energy 2017, 143, 132–141. [Google Scholar] [CrossRef]
  54. Xiang, Y.; Zhou, Z. Influence of Blue-green Spatial Landscape Pattern on Urban Heat Island. Chin. Landsc. Archit. 2023, 39, 105–110. [Google Scholar] [CrossRef]
  55. Jiang, Y.; Huang, J. Quantitative Analysis of Mitigation Effect of Urban Blue—Green Spaces on Urban Heat Island. Resour. Environ. Yangtze Basin 2022, 31, 2060–2072. [Google Scholar]
  56. Wang, S.; Lu, C.; Gao, Y.; Wang, K.; Zhang, R. Life cycle assessment of reduction of environmental impacts via industrial symbiosis in an energy-intensive industrial park in China. J. Clean. Prod. 2019, 241, 118358. [Google Scholar] [CrossRef]
  57. Huang, G.; Zhang, L.; Luo, C.; Huang, J.; Liu, J. Application of SWMM Modle in Minzhi River Basin of Shenzhen City. Water Resour. Power 2015, 33, 10–14. [Google Scholar]
  58. Pushkar, S. Life Cycle Assessment of Flat Roof Technologies for Office Buildings in Israel. Sustainability 2016, 8, 54. [Google Scholar] [CrossRef]
  59. Alvarado, V.I.; Hsu, S.-C.; Lam, C.-M.; Lee, P.-H. Beyond Energy Balance: Environmental Trade-Offs of Organics Capture and Low Carbon-to-Nitrogen Ratio Sewage Treatment Systems. Environ. Sci. Technol. 2020, 54, 4746–4757. [Google Scholar] [CrossRef] [PubMed]
  60. Brudler, S.; Arnbjerg-Nielsen, K.; Hauschild, M.Z.; Rygaard, M. Life cycle assessment of stormwater management in the context of climate change adaptation. Water Res. 2016, 106, 394–404. [Google Scholar] [CrossRef] [PubMed]
  61. Huijbregts, M.A.J.; Steinmann, Z.J.N.; Elshout, P.M.F.; Stam, G.; Verones, F.; Vieira, M.D.M.; Hollander, A.; Zijp, M.; Zelm, R.V. ReCiPe 2016 v1.1 A Harmonized Life Cycle Impact Assessment Method at Midpoint and Endpoint Level; National Institute for Public Health and the Environment: Bilthoven, The Neatherland, 2017; p. 201. [Google Scholar]
  62. Wang, B.; Yang, H.; Bi, C.; Feng, Y. Green infrastructure and natural resource utilization for green development in selected belt and road initiative countries. Resour. Policy 2023, 85, 103758. [Google Scholar] [CrossRef]
  63. Hu, Q.; Gu, Y. Mineral resources and the green economy: A blueprint for sustainable development and innovation. Resour. Policy 2024, 88, 104461. [Google Scholar] [CrossRef]
  64. Yang, X.; Yan, L.; Zeng, L. How to handle uncertainties in AHP: The Cloud Delphi hierarchical analysis. Inf. Sci. 2013, 222, 384–404. [Google Scholar] [CrossRef]
  65. Shen, L.; Yang, J.; Jin, X.; Hou, L.; Shang, S.; Zhang, Y. Based on Delphi method and Analytic Hierarchy Process to construct the Evaluation Index system of nursing simulation teaching quality. Nurse Educ. Today 2019, 79, 67–73. [Google Scholar] [CrossRef]
  66. Saaty, T.L. Decision Making for Leaders: The Analytic Hierarchy Process for Decisions in a Complex World, 3rd ed.; University of Pittsburgh: Pittsburgh, PA, USA, 2012. [Google Scholar]
  67. Lo-Iacono-Ferreira, V.G.; Torregrosa-López, J.I.; Capuz-Rizo, S.F. Use of Life Cycle Assessment methodology in the analysis of Ecological Footprint Assessment results to evaluate the environmental performance of universities. J. Clean. Prod. 2016, 133, 43–53. [Google Scholar] [CrossRef]
  68. Wang, M.; Zhong, X.; Sun, C.; Chen, T.; Su, J.; Li, J. Comprehensive Performance of Green Infrastructure through a Life-Cycle Perspective: A Review. Sustainability 2023, 15, 10857. [Google Scholar] [CrossRef]
  69. Phillis, Y.A.; Kouikoglou, V.S.; Verdugo, C. Urban sustainability assessment and ranking of cities. Comput. Environ. Urban Syst. 2017, 64, 254–265. [Google Scholar] [CrossRef]
  70. Zhang, H.; Chang, Q.; Zhu, J.; Genli, T. Research on Resilience Evaluation System of Sponge City. J. Southwest For. Univ. Soc. Sci. 2022, 6, 56–61+68. [Google Scholar]
  71. Zhu, M.; Zhou, W.; Cheng, X.; Lu, X.; Li, L. Research on Resilience Evaluation of Sponge City. Constr. Econ. 2023, 44, 5–12. [Google Scholar] [CrossRef]
  72. Sharma, S.; Kumar, S.; Singh, A. Assessment of Green Infrastructure for sustainable urban water management. Environ. Dev. Sustain. 2023, 5, 1–10. [Google Scholar] [CrossRef]
  73. DeBusk, K.M.; Hunt, W.F.; Line, D.E. Bioretention Outflow: Does It Mimic Nonurban Watershed Shallow Interflow? J. Hydrol. Eng. 2011, 16, 274–279. [Google Scholar] [CrossRef]
  74. Rycewicz-Borecki, M.; McLean, J.E.; Dupont, R.R. Nitrogen and phosphorus mass balance, retention and uptake in six plant species grown in stormwater bioretention microcosms. Ecol. Eng. 2017, 99, 409–416. [Google Scholar] [CrossRef]
  75. Ekka, S.A.; Rujner, H.; Leonhardt, G.; Blecken, G.-T.; Viklander, M.; Hunt, W.F. Next generation swale design for stormwater runoff treatment: A comprehensive approach. J. Environ. Manag. 2021, 279, 111756. [Google Scholar] [CrossRef] [PubMed]
  76. Emre, S.K.; Melek, K.-A.C. Determination of Grass Swale Hydrological Performance with Rainfall-Watershed-Swale Experimental Setup. J. Hydrol. Eng. 2023, 28, 04022043. [Google Scholar] [CrossRef]
  77. Cahill, T.H. Low Impact Development and Sustainable Stormwater Management, 1st ed.; John Wiley & Sons: Hoboken, NJ, USA, 2012. [Google Scholar]
  78. Fei, Y.; Rene, E.R.; Shang, Q.; Singh, R.P. Comprehensive effect evaluation of LID facilities implemented in sponge campuses: A case study. Ecol. Indic. 2023, 155, 110912. [Google Scholar] [CrossRef]
  79. Zhang, X.Q.; Qiao, W.B.; Huang, J.F.; Li, H.Y.; Wang, X. Impact and analysis of urban water system connectivity project on regional water environment based on Storm Water Management Model (SWMM). J. Clean. Prod. 2023, 423, 138840. [Google Scholar] [CrossRef]
  80. Chan, F.K.S.; Yang, L.E.; Scheffran, J.; Mitchell, G.; Adekola, O.; Griffiths, J.; Chen, Y.; Li, G.; Lu, X.; Qi, Y.; et al. Urban flood risks and emerging challenges in a Chinese delta: The case of the Pearl River Delta. Environ. Sci. Policy 2021, 122, 101–115. [Google Scholar] [CrossRef]
  81. Ghasemi, L. Circular Economy for Industrial, Commercial, and Institutional (ICI) Buildings: Comparison of Alternative End-of-the-Life Cycle Management Scenarios; University of Windsor: Windsor, ON, Canada, 2023. [Google Scholar]
  82. Oliveira, M.; Santagata, R.; Kaiser, S.; Liu, Y.; Vassillo, C.; Ghisellini, P.; Liu, G.; Ulgiati, S. Socioeconomic and Environmental Benefits of Expanding Urban Green Areas: A Joint Application of i-Tree and LCA Approaches. Land 2022, 11, 2106. [Google Scholar] [CrossRef]
  83. Zhao, H.; Zhao, D.; Jiang, X.; Zhang, S.; Lin, Z. Assessment of Urban Forest Ecological Benefit Based on the i-Tree Eco Model—A Case Study of Changchun Central City. Forests 2023, 14, 1304. [Google Scholar] [CrossRef]
  84. Yan, W.; Huang, X.; Wang, Y. Measurements of the supply and demand for the flood regulation ecosystem services of green infrastructure: A review. Acta Ecol. Sin. 2019, 39, 1165–1177. [Google Scholar] [CrossRef]
  85. Lu, L. Life Cycle Assessment of Two Typical Low Impact Development Technology. Master’s Thesis, Beijing University of Civil Engineering and Architecture (BUCEA), Beijing, China, 2013. [Google Scholar]
  86. Wang, R.; Eckelman, M.J.; Zimmerman, J.B. Consequential Environmental and Economic Life Cycle Assessment of Green and Gray Stormwater Infrastructures for Combined Sewer Systems. Environ. Sci. Technol. 2013, 47, 11189–11198. [Google Scholar] [CrossRef]
  87. Chen, T.; Wang, M.; Su, J.; Li, J. Unlocking the Positive Impact of Bio-Swales on Hydrology, Water Quality, and Biodiversity: A Bibliometric Review. Sustainability 2023, 15, 8141. [Google Scholar] [CrossRef]
  88. Jiang, Q.; Xiong, S.; Yang, F.; Huang, J. Simulation Study on Rain-Flood Regulation in Urban “Gray-Green-Blue” Spaces Based on System Dynamics: A Case Study of the Guitang River Basin in Changsha. Water 2024, 16, 109. [Google Scholar] [CrossRef]
  89. Wang, J.; Xue, F.; Jing, R.; Lu, Q.; Huang, Y.; Sun, X.; Zhu, W. Regenerating Sponge City to Sponge Watershed through an Innovative Framework for Urban Water Resilience. Sustainability 2021, 13, 5358. [Google Scholar] [CrossRef]
  90. Yu, K.; Xu, T.; Li, D.; Wang, L. A Review: U rban Water Resilience. Urban Plan. Forum 2015, 1, 75–83. [Google Scholar] [CrossRef]
  91. Sañudo-Fontaneda, L.A.; Roces-García, J.; Coupe, S.J.; Barrios-Crespo, E.; Rey-Mahía, C.; Álvarez-Rabanal, F.P.; Lashford, C. Descriptive Analysis of the Performance of a Vegetated Swale through Long-Term Hydrological Monitoring: A Case Study from Coventry, UK. Water 2020, 12, 2781. [Google Scholar] [CrossRef]
  92. Alamdari, N.; Terri, S.H. Evaluating the effects of stormwater control measures on percolation in semi-arid watersheds using a high-resolution stormwater model. J. Clean. Prod. 2022, 375, 134073. [Google Scholar] [CrossRef]
  93. Alamdari, N.; Hogue, T.S. Assessing the effects of climate change on urban watersheds: A review and call for future research. Environ. Rev. 2022, 30, 61–71. [Google Scholar] [CrossRef]
  94. Wucker, M. The Gray Rhino: How to Recognize and Act on the Obvious Dangers We Ignore; St. Martin’s Press: New York, NY, USA, 2017. [Google Scholar]
  95. Wu, J.; Li, B.; Zhu, L.; Yi, H. Coping with Black Swan and Grey Rhino: Expecting New Urban Governance in the Time of Uncertainty. Urban Gov. 2022, 2, 127–129. [Google Scholar] [CrossRef]
  96. Leal Filho, W.; Wolf, F.; Castro-Díaz, R.; Li, C.; Ojeh, V.N.; Gutiérrez, N.; Nagy, G.J.; Savić, S.; Natenzon, C.E.; Quasem Al-Amin, A.; et al. Addressing the Urban Heat Islands Effect: A Cross-Country Assessment of the Role of Green Infrastructure. Sustainability 2021, 13, 753. [Google Scholar] [CrossRef]
  97. Marando, F.; Heris, M.P.; Zulian, G.; Udías, A.; Mentaschi, L.; Chrysoulakis, N.; Parastatidis, D.; Maes, J. Urban heat island mitigation by green infrastructure in European Functional Urban Areas. Sustain. Cities Soc. 2022, 77, 103564. [Google Scholar] [CrossRef]
  98. Yan, X. Life Cycle Assessment of Green Infrastructure Facilities of Sponge City—A Case Study in Guangming District, Shenzhen. Master’s Thesis, Harbin Institute of Technology, Harbin, China, 2020. [Google Scholar]
  99. Rong, G.; Gan, D.; Li, S.; Sun, H.; Wang, L. Area proportion optimization of different LID facilities and effect of runoff pollution control. Water Resour. Prot. 2022, 38, 168–173. [Google Scholar]
  100. Peng, J.; Wang, Q.-Q.; Yang, X.-S.; Yu, L.; Zhong, X. Application and evaluation of LID facilities in sponge airport, China. Water Sci. Technol. 2022, 85, 756–768. [Google Scholar] [CrossRef] [PubMed]
  101. Gao, J.; Li, J.; Li, Y.; Xia, J.; Lv, P. A Distribution Optimization Method of Typical LID Facilities for Sponge City Construction. Ecohydrol. Hydrobiol. 2021, 21, 13–22. [Google Scholar] [CrossRef]
  102. Tiwari, A.; Kumar, P. Quantification of green infrastructure effects on airborne nanoparticles dispersion at an urban scale. Sci. Total Environ. 2022, 838, 155778. [Google Scholar] [CrossRef]
  103. Hou, D.; Al-Tabbaa, A.; O’Connor, D.; Hu, Q.; Zhu, Y.-G.; Wang, L.; Kirkwood, N.; Ok, Y.S.; Tsang, D.C.W.; Bolan, N.S.; et al. Sustainable remediation and redevelopment of brownfield sites. Nat. Rev. Earth Environ. 2023, 4, 271–286. [Google Scholar] [CrossRef]
  104. Wang, R.; Qin, H.P.; Zhao, Z.J. Control Studies of Peak Flow and Non-point Source Pollution for Urbanized Area Based on SWMM. Acta Sci. Nat. Univ. Pekin. 2015, 51, 141–150. (In Chinese) [Google Scholar]
  105. Wu, Y.N.; Xiong, J.Q.; Ren, X.X.; Wang, X.C. Sensitivity analysis and calibration study on the parameters of SWMM for Ejing watershed in Shenzhen. Water Wastewater Eng. 2015, 11, 126–131. [Google Scholar]
  106. Huang, G.R.; Nie, H.F. Characteristics and Load of Non-Point Source Pollution of Urban Rainfall Runoff in Guangzhou, China. J. South China Univ. Technol. 2012, 40, 142–148. (In Chinese) [Google Scholar]
Figure 1. The research flowchart.
Water 16 01162 g001
Figure 2. Location map of the study area.
Water 16 01162 g002
Figure 3. Urban green infrastructure scenarios.
Water 16 01162 g003
Figure 4. Comparison of four UGI scenarios grouped in five modules.
Water 16 01162 g004
Figure 5. Environmental resilience index calculation of four UGI scenarios.
Water 16 01162 g005
Figure 6. Environmental resilience index evaluation of five modules.
Water 16 01162 g006
Figure 7. Environmental resilience index of ADA indicators. Note: RRR_10a = runoff reduction rate 10a; RRR_100a = runoff reduction rate 100a; PFRR_10a = peak flow reduction rate 10a; PFRR_100a = peak flow reduction rate 100a; FRT_10a = flood recovery time 10a; FRT_100a = flood recovery time 100a; EWAC = extreme weather adaptation capability; EWRC = extreme weather recovery capability; and ADA = acute disturbance adaptation.
Water 16 01162 g007
Figure 8. Environmental resilience index of CSM indicators. Note: CWRR = climate warming reduction rate; UCR = urban cooling rate; PFRR = particle formation reduction rate; ARRR = annual runoff reduction rate; ASSRR = annual suspended solids’ reduction rate; SARR = soil acidification reduction rate; TERR = terrestrial ecotoxicity reduction rate; WRCRR = water resources’ consumption reduction rate; FECRR = fossil energy consumption reduction rate; MRCRR = mineral resources’ consumption reduction rate; CA = climate adaptation; EEI = ecological environment improvement; RCR = resource consumption reduction; and CSM = chronic stress mitigation.
Water 16 01162 g008
Table 1. Urban green infrastructure performance indicators.
CategoriesSub-ItemSelected IndicatorsReferences
Environmental CategoryNatural resources supplyProvides raw material for adaptation to change;[27,28,29]
Produce food or crops;
Drinking water supply;
Natural environment regulationStormwater runoff mitigation;
Water quality improvement;
Increase groundwater recharge;
Improve wildlife habitats and species’ richness;
Urban built environment mitigation. Air purification/air quality
regulation;
Noise reduction;
Temperature regulation;
Land use diversity;
Social CategoryCultural and recreational developmentRecreation and cognitive development;[27,30,31]
Enhancing the impact of environmental education;
Enhance aesthetics;
Governance and institutional supportMulti-level and decentralized governance;
Increase human health and well-being;
Social cohesionIncrease community interaction;
Strengthen the sense of place and culture;
Economic CategoryEquity and justiceEqual distribution of green infrastructure;[27,31,32]
Equal access to the benefits of green infrastructure;
Efficiency and self-sufficiencyGreen infrastructure construction cost;
Creating green employment;
Decreasing grey infrastructure cost;
Increase property values;
Increase city revenue;
Increase local development.
Table 2. Categories and indicators of UGI environmental resilience evaluation.
CategoryModuleIndicatorDescriptionReferences
Part A: Acute Disturbance Adaptation (ADA)A-1 Extreme Weather Adaptation CapabilityRunoff Reduction Rate -10aDegree of reduction in runoff volume during an extreme rainfall event with a return period of 10 years [43,44]
Runoff Reduction Rate -100aDegree of reduction in runoff volume during an extreme rainfall event with a return period of 100 years[45,46]
Peak Flow Reduction Rate -10aDegree of reduction in flood flow during an extreme rainfall event with a return period of 10 years [47,48]
Peak Flow Reduction Rate -100aDegree of reduction in flood flow during an extreme rainfall event with a return period of 100 years [49,50]
A-2 Extreme Weather Recovery CapabilityRecovery Time -10aPeriod for recovery from the flood peak of an extreme rainfall event with a return period of 10 years [43,51]
Recovery Time -100aPeriod for recovery from the flood peak of an extreme rainfall event with a return period of 100 years[45,51]
Part B: Chronic Stress Mitigation (CSM)B-1 Climate Warming AdaptationCarbon Emission ReductionGlobal warming potential values, cumulative lifecycle greenhouse gas emissions, with negative numbers representing reductions[52,53]
Urban CoolingReduction in urban heat island effect in summer by water bodies and green spaces[54,55]
B-2 Ecological Environment ImprovementParticle Formation ReductionAtmospheric fine particulate matter formation potential, cumulative particulate matter emissions over the lifecycle, with negative numbers representing reductions [53,56]
Annual Runoff ReductionVolume capture ratio of annual rainfall[48,57]
Annual Suspended Solids’ ReductionReduction rate of suspended solids for the whole year of the average year[48,57]
Soil Acidification ReductionAcidification potential, acid gas emissions throughout the lifecycle, changes in soil acidity due to changes in acid deposition[37,56]
Terrestrial Ecotoxicity ReductionEcotoxicity potential in terrestrial areas, cumulative emissions from chemical releases throughout the lifecycle, and changes in concentrations will affect biodiversity[58,59]
B-3 Resource Consumption ReductionWater Resources’ Consumption ReductionCumulative consumption of water resources over the lifecycle[52,60]
Fossil Energy Consumption ReductionCumulative consumption of fossil energy over the lifecycle [61,62]
Mineral Resources’ Consumption ReductionCumulative consumption of mineral resources over the lifecycle[62,63]
Table 3. Indicator system evaluation weights.
Level 1WeightLevel 2WeightLevel 3WeightFinal WeightAttribute
Part A: Acute Disturbance Adaptation (ADA)0.53A-1 Extreme Weather Adaptation Capability0.67Runoff Reduction Rate -10a0.220.079Positive
Runoff Reduction Rate -100a0.220.077Positive
Peak Flow Reduction Rate -10a0.270.098Positive
Peak Flow Reduction Rate -100a0.290.102Positive
A-2 Extreme Weather Recovery Capability0.33Recovery Time -10a0.630.109Negative
Recovery Time -100a0.370.063Negative
Part B: Chronic Stress Mitigation (CSM)0.47B-1 Climate Adaptation0.29Climate Warming Reduction Rate0.510.070Positive
Urban Cooling0.490.067Positive
B-2 Ecological Environment Improvement0.44Particle Formation Reduction Rate0.240.050Positive
Annual Runoff Reduction Rate0.210.043Positive
Annual Suspended Solids’ Reduction Rate0.220.045Positive
Soil Acidification Reduction Rate0.120.025Positive
Terrestrial Ecotoxicity Reduction Rate0.210.044Positive
B-3 Resource Consumption Reduction0.27Water Resources’ Consumption Reduction Rate0.410.052Positive
Fossil Energy Consumption Reduction Rate0.330.042Positive
Mineral Resources’ Consumption Reduction Rate0.270.034Positive
Table 4. Environmental resilience index scoring sheet.
IndicatorInequality SignUnitScore (Very Low to Very High)
12345
Runoff Reduction Rate -10a%010152025
Runoff Reduction Rate -100a%05101520
Peak Flow Reduction Rate -10a%010203040
Peak Flow Reduction Rate -100a%05101520
Flood Recovery Time -10amin400360320280240
Flood Recovery Time -100amin410370330290250
Climate Warming Reduction Rate%0100200300400
Urban Cooling%01.01.52.02.5
Particle Formation Reduction Rate%0255075100
Annual Runoff Reduction Rate%05101520
Annual Suspended Solids’ Reduction Rate%020304050
Soil Acidification Reduction Rate%020304050
Terrestrial Ecotoxicity Reduction Rate%0150200250300
Water Resources’ Consumption Reduction Rate%015202530
Fossil Energy Consumption Reduction Rate%015253545
Mineral Resources’ Consumption Reduction Rate%020304050
Table 5. UGI selection and description.
Green InfrastructureDescriptionDistribution
Bioretention PondsBioretention ponds are also known as rain gardens. By simulating the natural state of the watershed and utilizing a combination of mulch, artificial fill layers, gravel layers, and a variety of vegetation, they provide a combination of benefits in terms of total runoff control, reduction in runoff peaks, recharge of groundwater, and removal of pollutants.This study placed bioretention ponds in the attached green spaces of various sites to dissipate roof and ground drainage and pollutants from each site.
Grassed SwalesGrassed swales are a typical method of sunken green space, mainly applied to municipal roads for stormwater runoff pollution control. The technology is set up as a vegetated surface ditch along both sides of the road, which can collect, convey, and discharge road stormwater runoff and purify nitrogen, phosphorus, and other eutrophic substances in the water body.This study placed grassed swales along municipal roads in public green spaces to dissipate municipal roadway drainage and pollutants.
Stormwater Detention BasinThe stormwater detention basin is a significant facility in the urban drainage system, usually combined with the municipal stormwater pipeline network facilities, with runoff pollution control, runoff peak control delayed regulation, and other integrated functions. The facility can be combined with parking lots, playgrounds, parks, and other venues to set up. In disaster weather, the urban stormwater runoff as much as possible in situ retention, effectively reducing the risk of flooding in high-density built-up areas.This study provided comprehensive control by placing detention basins in the public green space along the riverfront and connecting them to the regional stormwater network.
Table 6. Green infrastructure layout scenarios.
NumberUGI ScenariosUGI FacilitiesLayout SettingsReferences
S0Conventional scenarioNoneThe conventional scenario is only designed for traditional green space and does not include UGI facilities[10]
S1Source control stormwater management scenarioBioretention ponds20% of the attached green space area is chosen for decentralized placement[73,74]
S2Process control stormwater management scenarioGrassed swales20% of the public green space along municipal roads is chosen for decentralized placement[75,76]
S3Terminal control stormwater management scenarioStormwater detention basin30% of the public green space area along riverside park is chosen for decentralized placement[72,77]
S4Combined stormwater management scenarioBioretention ponds, grassed swales, and stormwater detention basinBioretention ponds cover 7% of the area in the attached green space, shallow grassed swales cover 10% of the area in the public green space along municipal roads, and stormwater detention basins cover 7% of the area within the public green space arranged along the riverfront[5,78]
Table 7. Multi-scenario modelling of four UGI scenarios’ environmental resilience performance (original data).
CategoryModuleIndicatorUnitS0 *S1S2S3S4
Part A: Acute Disturbance Adaptation (ADA)A-1 Extreme Weather Adaptation CapabilityRunoff -10am33,184,0702,901,4802,932,6602,647,5402,695,610
Runoff Reduction -10a282,590251,410536,530488,460
Runoff -100am34,374,2304,091,5404,111,7703,917,5603,990,570
Runoff Reduction -100a282,690262,460456,670383,660
Peak flow -10am3/s26.3224.6524.8817.919.77
Peak flow Reduction -10a1.671.448.426.55
Peak flow -100am3/s36.1235.435.5631.4932.85
Peak flow Reduction -100a0.720.564.633.27
A-2 Extreme Weather Recovery CapabilityRecovery Time -10amin331264342285
Recovery Time -100amin340272354297
Part B: Chronic Stress Mitigation (CSM)B-1 Climate AdaptationCarbon Emissionkg CO2 eq.−3,714,212.51−20,390,394.28−15,154,726.15−16,559,276.7−15,132,337.58
Carbon Emission Reduction16,676,181.7711,440,513.6412,845,064.1911,418,125.07
Urban Coolingm2520,000562,600545,550551,300549,560
Urban Cooling Reduction42,60025,55031,30029,560
B-2 Ecological Environment ImprovementParticle Formationkg PM10 eq.57,017.2512,422.0823,900.9521,067.8921,934.15
Particle Formation Reduction44,595.1733,116.3035,949.3635,083.10
Annual Runoffm31,363,6701,138,4801,303,3801,293,4301,224,700
Annual Runoff Reduction225,19060,29070,240138,970
Annual Suspended Solidskg235,310.17156,446.84180,239.04164,146.71143,299.43
Annual Suspended Solids’ Reduction78,863.3355,071.1371,163.4692,010.73
Soil Acidificationkg SO2 eq.218,725.94101,690.52125,109.18119,764.55144,550.95
Soil Acidification Reduction117,035.4293,616.7698,961.3974,174.99
Terrestrial Ecotoxicitykg 1, 4-DB eq.1724.03−2748.74−1303.07−2574.48−3492.08
Terrestrial Ecotoxicity Reduction4472.773027.104298.515216.11
B-3 Resource Consumption ReductionWater Resources’ Consumptionm339,475,058.5429,182,491.131,970,305.0631,038,673.5930,253,182.23
Water Resources’ Consumption Reduction10,292,567.447,504,753.488,436,384.959,221,876.31
Fossil Energy Consumptionkg oil eq.30,025,605.1018,590,560.4620,024,827.219,649,537.0819,339,814.53
Fossil Energy Consumption Reduction11,435,044.6410,000,777.9010,376,068.0210,685,790.57
Mineral Resources’ Consumptionkg Fe eq.2,621,015.611,215,064.581,371,148.281,195,217.931,313,976.29
Mineral Resources’ Consumption Reduction1,405,951.031,249,867.331,425,797.681,307,039.32
Note: * The data of S0 represent the initial value of the conventional green space.
Table 8. Comparison of four UGI scenarios’ environmental resilience performance.
CategoryModuleIndicatorUnitS1S2S3S4
Part A: Acute Disturbance Adaptation (ADA)A-1 Extreme Weather Adaptation CapabilityRunoff Reduction Rate -10a%8.88%7.90%16.85%15.34%
Runoff Reduction Rate -100a%6.46%6.00%10.44%8.77%
Peak Flow Reduction Rate -10a%6.34%5.47%31.99%24.89%
Peak Flow Reduction Rate -100a%1.99%1.55%12.82%9.05%
A-2 Extreme Weather Recovery CapabilityRecovery Time Rate-10amin331264342285
Recovery Time Rate-100amin340272354297
Part B: Chronic Stress Mitigation (CSM)B-1 Climate AdaptationCarbon Emission Reduction Rate%449.98%308.02%345.84%307.42%
Urban Cooling Reduction Rate%2.53%1.52%1.86%1.75%
B-2 Ecological Environment ImprovementParticle Formation Reduction Rate%78.21%58.08%63.05%61.53%
Annual Runoff Reduction Rate%16.51%4.42%5.15%10.19%
Annual Suspended Solids’ Reduction Rate%33.51%23.40%30.24%39.10%
Soil Acidification Reduction Rate%53.51%42.80%45.24%33.91%
Terrestrial Ecotoxicity Reduction Rate%259.44%175.58%249.33%302.55%
B-3 Resource Consumption ReductionWater Resources’ Consumption Reduction Rate%26.07%19.01%21.37%23.36%
Fossil Energy Consumption Reduction Rate%38.08%33.31%34.56%35.59%
Mineral Resources’ Consumption Reduction Rate%53.64%47.69%54.40%49.87%
Note: the data in the table show the performance difference between scenarios S1 and S4 and the initial model S0.
Table 9. Four UGI scenarios’ environmental resilience index (ERI) calculation.
Module and IndicatorS1S2S3S4
Acute Disturbance Adaptation (ADA)0.7771.1211.5101.405
A-1 Extreme Weather Adaptation Capability0.4330.4331.1660.889
Runoff Reduction Rate -10a0.0790.0790.2370.237
Runoff Reduction Rate -100a0.1540.1540.2310.154
Peak Flow Reduction Rate -10a0.0980.0980.3920.294
Peak flow Reduction Rate -100a0.1020.1020.3060.204
A-2 Extreme Weather Recovery Capability0.3440.6880.3440.516
Recovery Time -10a0.2180.4360.2180.327
Recovery Time -100a0.1260.2520.1260.189
Chronic Stress Mitigation (CSM)2.0391.3181.5361.650
B-1 Climate Adaptation0.6850.4810.4810.481
Carbon Emission Reduction Rate0.3500.2800.2800.280
Urban Cooling Rate0.3350.2010.2010.201
B-2 Ecological Environment Improvement0.8080.4710.6030.709
Particle Formation Reduction Rate0.2000.1500.1500.150
Annual Runoff Reduction Rate0.1720.0430.0860.129
Annual Suspended Solids’ Reduction Rate0.1350.0900.1350.135
Soil Acidification Reduction Rate0.1250.1000.1000.075
Terrestrial Ecotoxicity Reduction Rate0.1760.0880.1320.220
B-3 Resource Consumption Reduction0.5460.3660.4520.460
Water Resources’ Consumption Reduction Rate0.2080.1040.1560.156
Fossil Energy Consumption Reduction Rate0.1680.1260.1260.168
Mineral Resources’ Consumption Reduction Rate0.1700.1360.1700.136
Environmental Resilience Index2.8162.4393.0463.055
Table 10. Ranks of ADA score, CSM score, and ERI score.
ADA ScoreRank 1CSM ScoreRank 2ERI ScoreRank 3
S1 Source control scenario0.77742.03912.8163
S2 Process control scenario1.12131.31842.4394
S3 Terminal control scenario1.51011.53633.0462
S4 Facility combined scenario1.40521.65023.0551
Note: ADA = acute disturbance adaptation; CSM = chronic stress mitigation; and ERI = environmental resilience index.
Disclaimer/Publisher’s Note: The statements, opinions and data contained in all publications are solely those of the individual author(s) and contributor(s) and not of MDPI and/or the editor(s). MDPI and/or the editor(s) disclaim responsibility for any injury to people or property resulting from any ideas, methods, instructions or products referred to in the content.

