
Water Level Inversion Detection Method for Water Level Images without a Scale in Complex Environments


1
State Key Laboratory of Dynamic Measurement Technology, North University of China, Taiyuan 030051, China
2
School of Electrical and Control Engineering, North University of China, Taiyuan 030051, China
3
State Key Laboratory of Coal Mine Disaster Dynamics and Control, Chongqing University, Chongqing 400044, China
*
Authors to whom correspondence should be addressed.
Water 2024, 16(8), 1176; https://doi.org/10.3390/w16081176
Submission received: 18 March 2024
/
Revised: 15 April 2024
/
Accepted: 19 April 2024
/
Published: 20 April 2024
Abstract
:Accurately perceiving changes in water level information is key to achieving the fine control of water and flooding; however, the existing technology cannot achieve water level recognition in complex and harsh environments, such as at night; in haze, rain, or snow; or during obscuration by floating objects or shadows. Therefore, on the basis of a deep analysis of the characteristics of water level images in complex and harsh environments, in this study, we took full advantage of a deep learning network’s ability to characterise semantic features and carried out exploratory research on water level detection in no-water-ruler scenarios based on the two technical means of target detection and semantic segmentation. The related experiments illustrate that all the methods proposed in this study can effectively adapt to complex and harsh environments. The results of this study are valuable for applications in solving the difficulties of accurate water level detection and flood disaster early warnings in poor-visibility scenarios.
1. Introduction
Water level monitoring plays an important role in the field of water conservancy engineering, flood control, and early warnings. The fine control of water and flood warning detection requires the real-time and accurate detection of sudden water level changes [1].
However, there are many shortcomings of the existing methods of water level monitoring, making it difficult to meet the urgent need for refined, intelligent control in modern water resource management, including the following: (1) Artificial readings include a great number of subjective factors, and they are difficult to check, cannot be performed in real time or poor weather conditions, and the personnel’s safety cannot be guaranteed. (2) Contact water level detection devices have poor accuracy and stability, and their core components can easily be damaged during prolonged periods of contact with the surface of water, resulting in increased maintenance costs. For example, water pressure sensors or float sensors, because of the use of immersion measurement, are affected by the water quality and cannot be measured in corrosive water. (3) Noncontact water level detection based on acoustic waves, radar, infrared, etc., is affected by the environment, such as temperature and liquid level fluctuations, and its antijamming ability is generally poor. For example, the method of measuring the water level by ultrasonic bubble sensors may be affected by the environment because of the shape and size of the bubbles, so when the environment changes a lot, the sensor’s readings will produce a certain amount of error. (4) The robustness of traditional image processing (i.e., nondeep learning) technology used for water level detection is relatively poor, and these methods cannot be adapted to complex harsh environments with rain, snow, haze, shadows and shade, etc. [2,3].
With deep learning technology exhibiting excellent performance [4,5,6], the automatic identification of water levels based on artificial intelligence has become a research hotspot. In the literature [7], the use of the Unet image segmentation technique to identify water level lines has been proposed. The authors of [8] carried out research on water level detection in videos using the SSD target detection algorithm. In [9], a convolutional neural network structure for water level line detection was designed. In another study [10], a real-time water level recognition algorithm consisting of YOLO-v3 object detection, and the ResNet scale recognition model was proposed. In [11], an intelligent visual water level recognition algorithm based on an improved superpixel and graph cut algorithm was proposed to address the problem of viewing and reading data errors caused by water stage gage stains and tilting.
However, in engineering practice, complex and harsh environments characterised by night, light, rain, haze, snow, shadows, light and shadow transformations, floating objects, etc., create serious interference in intelligent visual water level recognition, which makes it difficult to achieve accurate water level monitoring using the above methods. Thus, effectively achieving accurate water level detection in complex and harsh environments has become a problem that needs to be solved urgently [12]. Moreover, existing methods also rely heavily on water stage gages, and few image-based water level detection methods without water stage gages have been reported [13]. The styles of water stage gages vary greatly, and they are “small target” objects in water level detection images, which poses a serious challenge to the robustness of the algorithm; at the same time, there are high requirements for a water stage gage based onsite, and its installation, maintenance, and ancillary facilities are costly. If a water level detection scheme without a water stage gage could be developed, this would improve the intelligence of water level detection systems.
Therefore, in this study, on the basis of a deep analysis of the characteristics of water level images in complex and harsh environments, in this study, we took full advantage of a deep learning network’s ability to characterise semantic features and carried out exploratory research on water level detection in water-ruler-free scenarios based on the two technical means of target detection and semantic segmentation. In the study of water levels based on target detection technology without the use of a scale, an intelligent detection method integrating the improved YOLOv5 and the Kalman filter principle is proposed. The core technology includes the following: (1) YOLOv5 to detect water level lines (i.e., water shore demarcation lines) and linear fitting methods to ascertain the actual water level line, with unconventional methods based on water surfaces for recognition. (2) For water level lines that are infinitely enlarged in the horizontal direction and infinitely shrunk in the vertical direction, a multilevel feature fusion method is proposed to strengthen the mesoscale features to improve the original YOLOv5 algorithm. (3) Kalman filtering is used to introduce historical water level information as a priori knowledge to improve the generalisation performance of this technique in complex and harsh environments. (4) A fixed marker precalibrated into an image is added to the deep learning network for training, determining the actual water level’s elevation based on the real size of the marker, achieving a ruler-free water detection scheme.
In this study on water level detection without the use of scales based on semantic segmentation technology, a Unet model (TRCAM-Unet) that fuses the Transformer and residual channel attention mechanism is constructed. Then, an intelligent method to detect water levels without a scale in poor environments based on TRCAM-Unet is proposed. The core technology includes multilevel feature fusion using a full-scale connection structure, the reinforcement of correlations among regional features by a Transformer module, and the reinforcement of the expression of useful information and the weakening of interference from useless information by a residual channel attention module.
2. Methods
2.1. Characterisation of Water Levels in Complex and Harsh Environments
- (1)
- Complex and hostile environments tend to blur, eliminate, or obscure a target’s characteristics.
In water level monitoring, as shown in Figure 1, these complex and harsh environments, such as those with low light at night, rain, haze, snow, shadows, the Tyndall effect, and obscuration by floating objects, are very unfavourable to the characterisation of a target, which results in existing water level detection algorithms being unable to accurately locate the water stage gage or the surface of the water. In addition, they are susceptible to omissions and misdetections in some parts of the image, seriously affecting their performance.
- (2)
- The distinctive “small target” feature of a water stage gage, combined with other unfavourable factors, leads to unsatisfactory results in intelligent visual water level recognition based on water stage gages.
In deep learning, small target detection has been a technical difficulty. The literature [14] defines a small target as follows: the relative area of all target instances in the same category (i.e., the ratio of the area of the bounding box to the area of the image) has a median between 0.08% and 0.58%. An analysis of the images in Figure 1 shows that the relative proportions of the water stage gages to the images are extremely small, exhibiting distinctive “small target” features. A “small target” feature is more susceptible to interference in complex and harsh environments. It can be seen that water level detection technology based on water stage gages is limited by the “small target detection” problem and complex and harsh environmental interference, easily resulting in large errors or even direct failure. In addition, a water stage gage’s model and type, as well as font colour, logo layout, installation methods, etc., can lead to higher requirements. Moreover, they have higher costs related to installation, maintenance, and ancillary facilities. These combined unfavourable factors lead to unsatisfactory intelligent visual water level recognition results.
- (3)
- Image information can be used to determine actual water level elevations, achieving the intelligent detection of water levels without the use of a water stage gage.
This achievement will result in water level detection technology becoming more intelligent and applicable. Therefore, in this study, we propose a water-scale-free detection scheme. Obvious image features are selected, and fixed markers (either specific objects or specific geometric shapes) are added to the deep learning network for training. Water level detection is achieved using the relative distance between the water level line and the markers, and combined with the precalibration of the scale coefficients, the real coordinates of the markers can be converted into the actual water level’s elevation.
2.2. Water Level Detection Method without a Scale Based on the Target Detection Technique
2.2.1. Detection Program
On the basis of the above analyses of water level characteristics, this study proposes a water level detection method without the use of a water stage gage that integrates the improved YOLOv5 with the Kalman filter principle.
- (1)
- The YOLOv5 algorithm [15], which has excellent accuracy and real-time performance, was used for the target detection of the water level line (i.e., waterfront demarcation line), and the centre point of the captured water level line’s anchor frame was linearly fitted to obtain a water level line that approximated the real one. In this way, according to the law of large numbers, it is not required that the detected anchor frames cover the entire area of the water level line but only that the results are statistically correct. Evidently, this greatly enhances the robustness of the present technique.
- (2)
- Because a water level line has the characteristic of being infinitely large in its extension direction and infinitely small in its normal direction such that only one scale feature plays a dominant role in the water level line, in this study, we propose a multilevel feature fusion method that strengthens the mesoscale features to improve the performance of the original YOLOv5 algorithm, increasing the accuracy of water level recognition.
- (3)
- Kalman filtering is used to introduce historical water level information as a priori knowledge to improve the generalisation performance of this technique in complex and harsh environments.
- (4)
- A marker with obvious features and a fixed position in the image is selected and added to the deep learning network for training. Moreover, the scale factor, , of a pixel is converted to the real length in real time, using the size of the marker to determine the Pixel lengths, , between the water level line and the marker, which is then combined with the real elevation, , of the marker to determine the actual water level elevation, .
The markers can be specific objects (e.g., street lights, railings, or other fixed objects) or geometric shapes (e.g., a corner of the case embankment, a skyline, a shape painted by humans). To facilitate the measurement, the marker location must be above the water’s surface and not obscured by it. The formula to determine the actual water level elevation is as follows:
where denotes the pixel length of the marker in the image, and denotes the actual length of the marker.
A flow chart of this scale-free water level detection scheme is shown in Figure 2, and its technical points are explained in detail below.
2.2.2. Improved YOLOv5 Algorithm
The YOLOv5 network structure is divided into four parts: the input layer, the baseline network layer, the neck feature fusion network layer, and the detection head [16,17,18]. The YOLOv5 algorithm incorporates the advantages of the previous versions of YOLO and has been tested on the public COCO dataset against Faster-RCNN [19], SSD [20], YOLOv3 [21], and YOLOv4 [22]. The YOLOv5 tests (as shown in Table 1, indicates that the corresponding metrics are not found) show that YOLOv5 performs optimally in both the mAP (mean Average Precision) and FPS (Frames Per Second) performance metrics. Therefore, YOLOv5 was chosen as the base network for the semantic feature learning of the “water level line” in this study.
After the water level image is extracted by the YOLOv5 benchmark network, it will output three scales of feature mapping: large, medium, and small (as shown in Figure 3). Among them, the large-scale feature mapping contains the lowest number of bottom layer features and the greatest number of high-level features; the small-scale feature mapping contains the greatest number of bottom layer features and the lowest number of high-level features; the medium-scale feature mapping contains the advantages of the above two. YOLOv5 uses the FPN (Feature Pyramid Network) plus PAN (Pixel Aggregation Network) feature fusion module to fuse the three scales of feature mapping, so as to exhibit excellent performance in target detection.
The water level line has the characteristic of being infinitely large in its extension direction and infinitely small in its normal direction. When applying YOLOv5 to water level detection, the water level line region needs to be identified with an anchor frame of a specific size. This means that only one scale feature mapping plays a dominant role in identifying the water level line. Evidently, YOLOv5 fuses three scale feature mappings with the risk of redundancy and the introduction of irrelevant features. According to the deep learning theory, constant convolution and pooling operations will reduce the spatial and detailed information of feature mappings, which is not conducive to target localisation [23]. In the process of water level monitoring, whether the target localisation is accurate or not directly affects the identified water level results. Therefore, it is necessary to improve the ability of YOLOv5 to convey spatial and detailed information for feature mapping.
In summary, the water level line anchor frame size was set as a medium-sized target (labelled so that the water level line passes exactly through the midpoint of the anchor frame), corresponding to the mesoscale feature mapping, and the following improvements were made to the feature fusion network layer in the neck of the YOLOv5 network: two transfer nodes of the YOLOv5 small-scale feature mapping and the large-scale feature mapping were pooled into the mesoscale feature mapping channel, and the mesoscale feature mapping was performed in a tight manner, fully fused, and reduced the convolution and pooling operations before the original small-scale and large-scale feature mapping fusion to improve the ability of mesoscale feature mapping to convey spatial information and detailed information. The improved YOLOv5 network structure is shown in Figure 3.
The following improvements to YOLOv5 provide advantages in water level line recognition: ① Increased convergence node of mesoscale feature mapping to achieve a fuller and tighter fusion, which improves the ability of the mesoscale feature mapping to recognize the water level line. ② The shallow feature mapping is fused with deeper feature mapping at an earlier stage, which retains more spatial and detailed information, so that the centre of the prediction frame is closer to the water level line, and the accuracy of the subsequent fitted line is increased. ③ One Concat operation, one CSP2_1 (convolution + residual) operation, and two CBL (convolution + batch normalisation + activation function) operations are reduced, which reduces the number of network layers and parameters, and is conducive to the lightweighting of the deep network.
2.2.3. Method of Approximating the True Water Level Line
The coordinates of the centre of the anchor frame of the water level line predicted by the improved YOLOv5 were sampled and fitted by the method of least squares to obtain the following expression equation for the water level line:
where and are the coordinates of the midpoint of the prediction frame; is the slope of the fitted line; is the intercept of the fitted line; is the number of prediction frames; and and are the mean values of the midpoint coordinates of the prediction frames.
In this way, by sampling plus fitting, the approximation of the real water level line was obtained. This method does not need to detect all the water level line areas and solves the problem of the presence of foreign objects on the water surface obscuring the prediction of the water level line in some areas, which is invalid and less robust.
2.2.4. An Intelligent Water Level Detection Method Integrating Improved YOLOv5 and Kalman Filter Principles
It is worth noting that the complex environment encountered during water level detection is not constant. While night, rain, haze, snow, shadows, and floating objects all change over time, there will always be a period of time when the water level in the monitoring area is in a favourable environment, i.e., there will always be true and reliable historical information available at the time of water level detection. The introduction of more a priori knowledge (historical information of water level) will help to improve the performance of water level recognition in complex and harsh environments. As mentioned above, this study introduced historical information as a priori knowledge to guide the water level recognition by using the Kalman filtering principle, so that an intelligent water level detection technique integrating the improved YOLOv5 and Kalman filtering principle was proposed.
The slope of the water level line in the image is basically constant when the water level fluctuates. Therefore, it was assumed that the water level recognition system based on the improved YOLOv5 is a static system, and its state space model is shown in Equation (5).
where is the next water level prediction value and is the water level output result of the current state, which is jointly determined by the previous water level estimation value and the current measurement value . The state update equation of the system is shown in Equation (6).
where the coefficient is the Kalman gain, denoted as .
However, as the iteration proceeds, gradually tends to 0. That is, at a certain point in iteration, the effect of the measurements disappears and does not respond to the change in the observations, which contains new information about the actual change in the water level. At the same time, when the time span is large, or when the water level line fluctuates a lot, the water level line is not static, and assuming the system to be static may be problematic. Therefore, in this study, Equation (6) was improved as follows:
where is the standard deviation of the historical water level value; is the difference between the water stage in the current moment and the expected value of the water level at the previous moment.
where denotes the expectation of the historical water levels, .
During the training process, the slope and intercept values of the water level line are obtained from the fitted water level line, and the accuracy of the coordinate positions of the network output prediction frame will directly affect the accuracy of the slope and intercept of the fitted water level line. In this study, the accuracy of the prediction frame was improved by integrating the improved YOLOv5 with the Kalman filter principle, thus ensuring the accuracy of the slope and intercept of the water level line.
In this way, the flow of the intelligent water level detection method integrating the improved YOLOv5 and Kalman filtering principle, shown in Figure 4, greatly strengthens the adaptability of this technology to complex and harsh environments by introducing a priori knowledge to guide the current water level recognition.
2.3. Method for Water Level Detection without Water Stage Gage Based on Semantic Segmentation Technique
2.3.1. Testing Program
In water level detection, technical solutions based on target detection algorithms usually use the adjacent area of the water level line (the intersection line between the water surface and the shore embankment) as the identification target, and a specific line shape is fitted through multiple identification results to obtain an estimate of the actual water level line. However, water level lines are mostly natural curves, and simple fitting to straight lines or other line shapes will result in decreased accuracy when the number of output water level line anchor frames is small. Therefore, in this study, a semantic segmentation method was used for water level detection to solve the problem of the target detection technique not being applicable under certain conditions.
Based on the water level image characteristics and semantic segmentation technology, in this study, we proposed a Unet model that integrates the Transformer and residual channel attention mechanism and applied this to water level detection in unfavourable environments, forming a water level detection scheme without a water stage gage to solve the problem of water level recognition in such environments.
- (1)
- First, the ratio of the true distance to the Pixel lengths was obtained using the obvious and fixed markers in the water level image, as shown in Equation (9).
- (2)
- Accurate water surface segmentation images were obtained in harsh environments using the improved Unet model.
- (3)
- The edge detection algorithm was used to process the segmented image of the water surface to obtain the pixel elevation of the water level line, which could be converted to the real elevation information by using the above scale relationship.
The flow of the improved Unet based water level detection scheme without water stage gages is shown in Figure 5.
2.3.2. Structure of the Improved Unet Model
The semantic features of the “water surface” and “background (riverbank)” in the water surface image remain unchanged under complex and harsh environments, but the combined effect of multiple unfavourable factors under such environments makes it difficult for the neural network to accurately represent these semantic features. In addition, while deep features in deep learning enable the extraction of more semantic features, they also lead to a lack of spatial localization. Therefore, the key problem of water level detection is how to build a network that can efficiently represent semantic information such as “water surface” and “background (embankment)”, and take into account “depth”, “superposition”, and “error”. “Overlay and error back propagation” should also be taken into account.
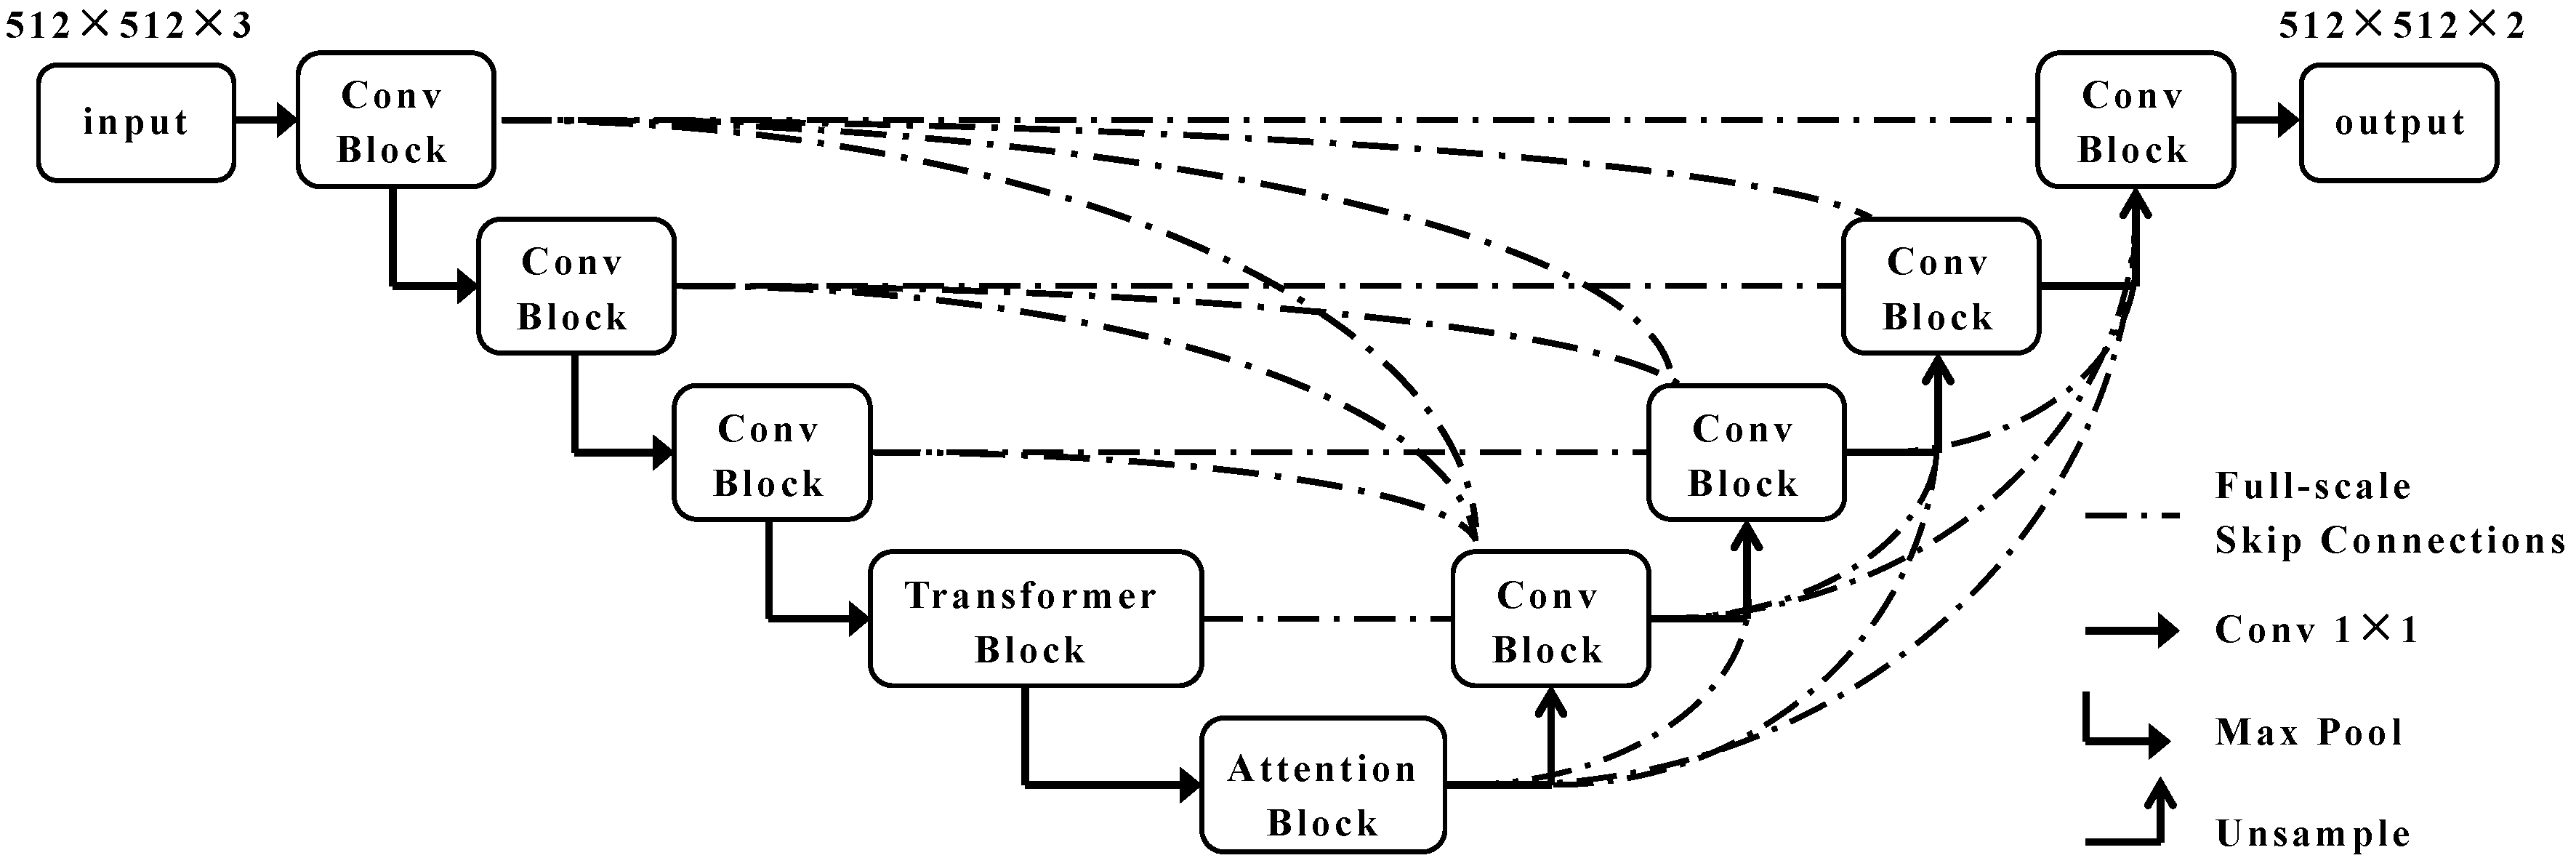
Unet is a commonly used deep learning network architecture that performs well in image segmentation and other image processing tasks. With an aim to address the above challenges, in this study, we proposed an improved Unet model (denoted as TRCAM-Unet), which integrated the Transformer and the residual channel attention mechanism, utilized the global connectivity structure for multi-level feature fusion, and used the Transformer to improve the correlation between the network and the local features of the water body image, and also to improve the effectiveness of the transmitted information. The overall structure of the model is shown in Figure 6. The network is based on Unet’s network structure, with the jump structure replaced with global connectivity, the deepest convolution operation in the coding domain replaced with the Transformer transmission structure, and the residual attention mechanism added at the connection point of coding and decoding. On this basis, the TRCAM-Unet network model was established.
2.3.3. Structure of Full-Scale Connections
In the Unet network, based on its residual linking model, a skip connection structure (SCS) was proposed to reduce the loss of shallow features due to network extension. This method directly connects the image at the coding end with the corresponding image at the decoding end, which can maintain the shallow features in the image and enhance the model’s ability to correctly recognize the local features in the image.
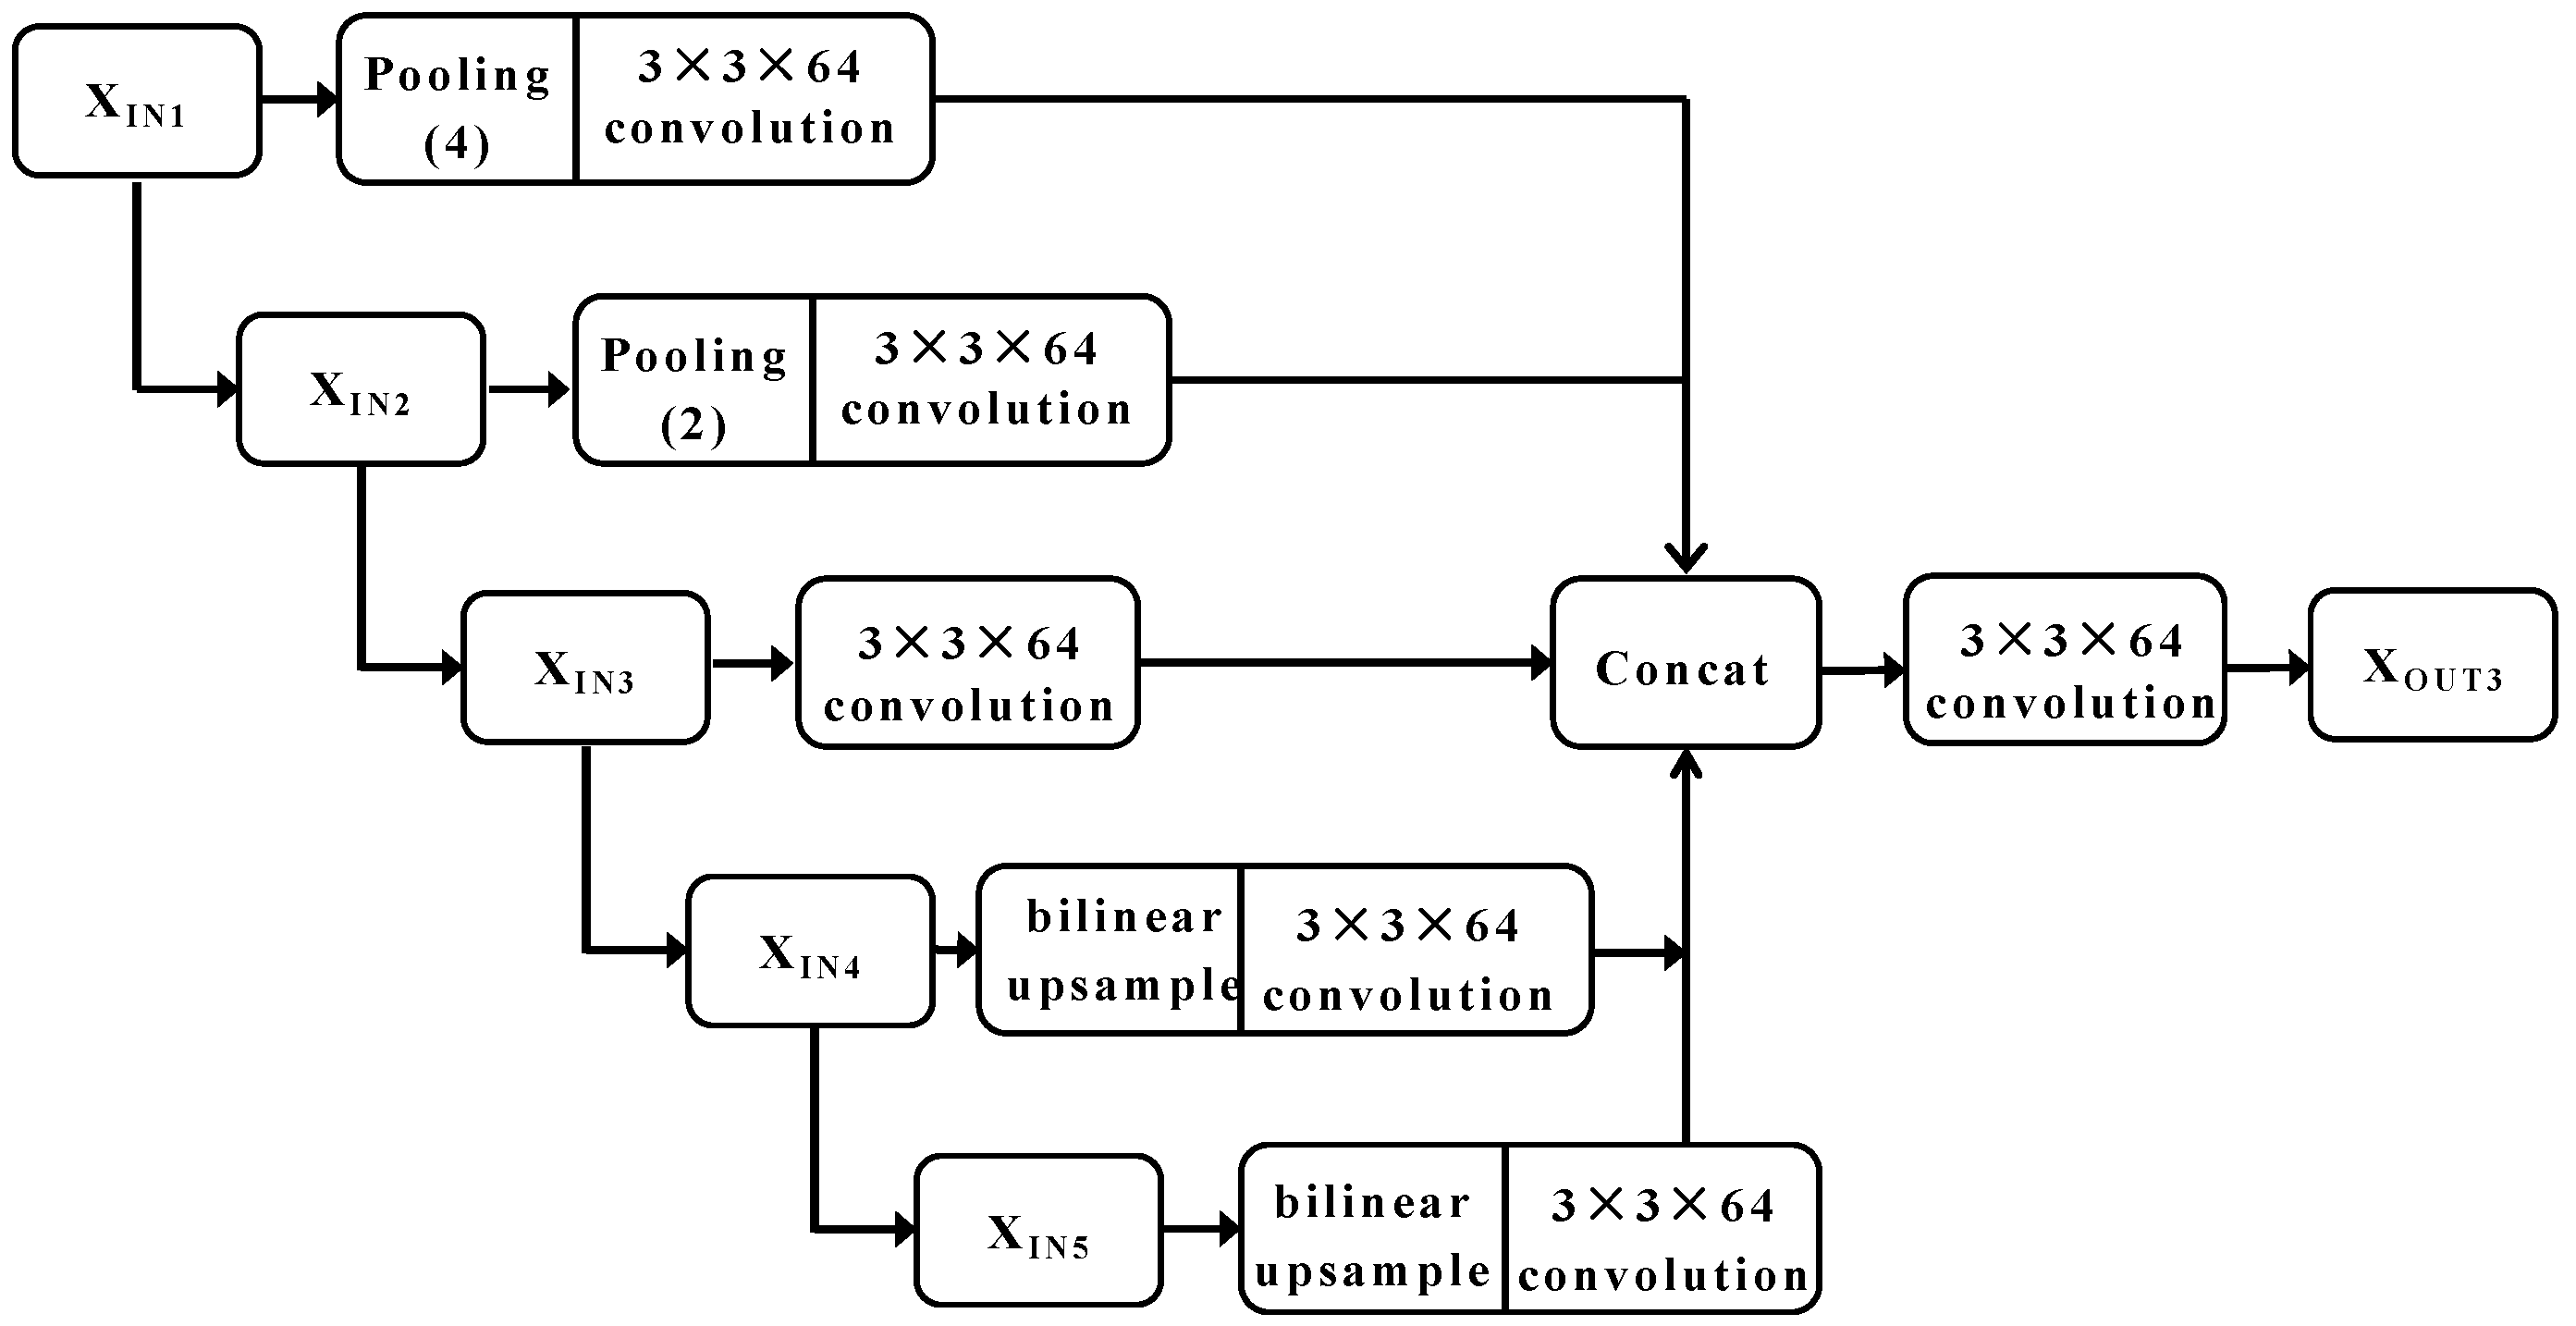
However, in complex and harsh environments, due to the interference of multiple harsh conditions, the water level line is characterised by “weak edges”, which makes the simple “jump” structure unable to ensure the complete extraction of “shallow” information (spatial and temporal information), which is not conducive to the accurate determination of the water level orientation and boundary. The TRCAM-Unet model was structured using a global connectivity approach to maximize the representation of feature information, especially shallow localization information, at multiple scales. In the full-scale connectivity framework, each level of the decoder includes both the decoded feature maps at each scale and the feature maps at the shallow level of the decoder, and the connectivity is shown in Figure 7.
The encoder of this structure output features mappings of five different scales, and the feature mappings of all scales are fused to the decoder output to achieve the fusion of the full-scale information. The outputs of the encoder and decoder feature mappings for each scale were defined as , , , and the specific formulas are shown below.
where denotes the multi-scale fusion operation by convolution and splicing; is the convolution; is the up-sampling operation; and is the down-sampling operation.
Since the data, , that are output from the encoder at different scales have different dimensions, when performing data fusion at different scales, the data need to be adjusted to make the data dimensions exactly the same before the splicing and fusion work can be completed. For ~, it was downgraded by a pooling operation to maintain the same dimension as ; for ~, it was upgraded by bilinear interpolation to reach the same dimension; for , feature extraction was performed by a convolution operation. The process first transformed the feature maps of different scales into 64-bit channels (same scale as ), and then performed the splicing operation on them, and, finally, expanded the number of channels to 320, and then used the convolution kernel (3 × 3 × 64) for the convolution to obtain the final output feature maps.
In the full-scale connectivity structure, the feature maps of each scale in the encoder were fused into the decoder so that the deep structure of the network incorporated more shallow information. Therefore, this enables the features of different depths in the encoder feature maps to be retained more efficiently.
2.3.4. Transformer Module
Convolutional neural networks (CNNs) can fully extract shallow features to obtain local spatial and temporal information in images. However, the water level line in the figure often runs through a specific region, and its position in the image changes slightly and shows strong regional correlation, which is significantly different from the traditional water level detection. Therefore, if the regional correlation between the targets can be fully explored, the semantic information acquisition and expression ability of the model for the target will be greatly improved, which is of great significance for improving robustness in complex and harsh environments.
Currently, Transformer technology is developing rapidly in the field of computer vision [24]. Because the Transformer itself performs long correlation, it can obtain stronger feature information by paying attention to itself, meaning it has a stronger long-distance correlation learning ability and stronger multimodal feature fusion ability. Compared with CNN, the Transformer has a stronger self-attention ability, can effectively mine more long-distance correlation, has stronger parallelism, and can carry out optimal inference learning for different tasks.
In this study, we incorporated the Transformer-MHSA (Muti-Head-Self-Attention) technology into the TRCAM-Unet network structure to improve its semantic description of objects. In this module, each head adopts its own autonomous attention strategy, which was able to mine and learn the corresponding higher-order features in multiple representation subdomains according to the characteristics of the water surface data to improve the recognition performance of TRCAM-Unet. In MHSA, the computational equation for a single attention head is as follows:
where denotes the -th attentional endpoint; , , , are the input feature maps; , , are the convolutional layer weights; is the positional coding matrix; , , are the positional feature vectors that can be trained to acquire vertical and horizontal information; and is the activation function. The formula is shown below:
where is the corresponding feature channel pixel; is the number of feature channels. The structure of feature extraction for a single attention endpoint is shown in Figure 8.
In this way, the multiple self-attention mechanism can be expressed as follows:
The feature map obtained from MHSA, which is fused with features using a Multilayer Perceptron (MLP), is the complete structure of the Transformer module in TRCAM-Unet, as shown in Figure 9. Its output can be expressed as follows:
where stands for the regularization operation, which can be used to accelerate training by using the process of transformation and amplification to avoid gradient vanishing or bursting, while reducing the probability of overfitting.
2.3.5. Residual Channel Attention Module
In TRCAM-Unet networks, in addition to enhancing the extraction of local features, the suppression of noise is also a key factor in improving the overall performance of the network. In deep learning, the attention mechanism allows the model to find the data that are more important to the current task out of a huge amount of data, reduce or eliminate other unimportant data, and then improve the processing efficiency and accuracy of the data. To this end, we added SEblock [25] to TRCAM-Unet to focus more on the water surface features while ignoring the noise in various complex backgrounds. SEblock is an attention module based on channel dimensions, which extracts the feature information that is beneficial to the task from each channel of the feature map and achieves the suppression of globally useless information. Meanwhile, similar to the hopping structure, SEblock adds the residual structure [26] to achieve the preservation of shallow features (regional features) in order maintain the feature information that originally existed in the feature map when changing the weights of the channels. The residual channel attention module is shown in Figure 10.
First, the overall features were extracted by global average pooling (GAP), which transformed the overall features into a real number, , that can represent the overall features, as shown in Equation (15).
where and denote the width and height of the feature map; denotes the grey value of the corresponding position in the feature map.
On this basis, the image features were extracted by two fully connected layers. Specifically, in the first fully connected layer, the number of all the feature channels were adjusted to 1/16 of the original number, while in the second fully connected layer, the number of all the feature channels were restored to 1/16 of the original number. This method has the following advantages: it can efficiently fuse the features between the channels, which greatly reduces the computational complexity of the model. The first fully connected layer used an activation function, (Rectified Linear Unit), with Equation (16). The second fully connected layer used an activation function, (The activation function is a commonly used continuous, smooth “s” type activation function), expressed in Equation (17) below.
Then, a residual structure was added to the output of SEblock by superimposing the original feature map with the SEblock results to obtain a residual channel attention model. The output of it this represented by Equation (18).
3. Results
3.1. Experimental Results and Analysis of Water Level Detection Method without Water Stage Gage Based on Target Detection Technique
3.1.1. Experimental Program
First, the dataset was produced. A total of 4175 water level images of various types were collected in the field. The water level line was labelled, and according to the original YOLOv5 preset a priori box size, the medium-scale anchor box [50, 120] was selected as the size of the labelling box, and when labelling, it was ensured that the midpoint of the labelling box was close to the water level line, and that continuity should be maintained between the labelling boxes (as shown in Figure 11, the blue box is the labelling anchor box). The labelled images are proportionally divided into a training set (3675 images) and a test set (500 images). To prevent overfitting, the training set was augmented through dataset augmentation to 13,875 images.
Then, the aforementioned deep learning network was built and trained to test the performance of the training algorithm using a test set. Meanwhile, the original YOLOv5 algorithm was built to train and predict the water level as a comparison experiment.
During the experiment, the hyperparameters took the same value. The batch size was set to 32, the initial learning rate was 0.01, and this was updated using the cosine annealing algorithm. The maximum number of iterations was 500. The experimental hardware environment used was Intel Xeon Gold 5218 R CPU, 256 G RAM, Nvidia Quadro RTX6000 24 GB GPU. The software environment used was 64-bit Windows 10, Python3.8 + Pytorch1.7.1.
3.1.2. Evaluation of Indicators
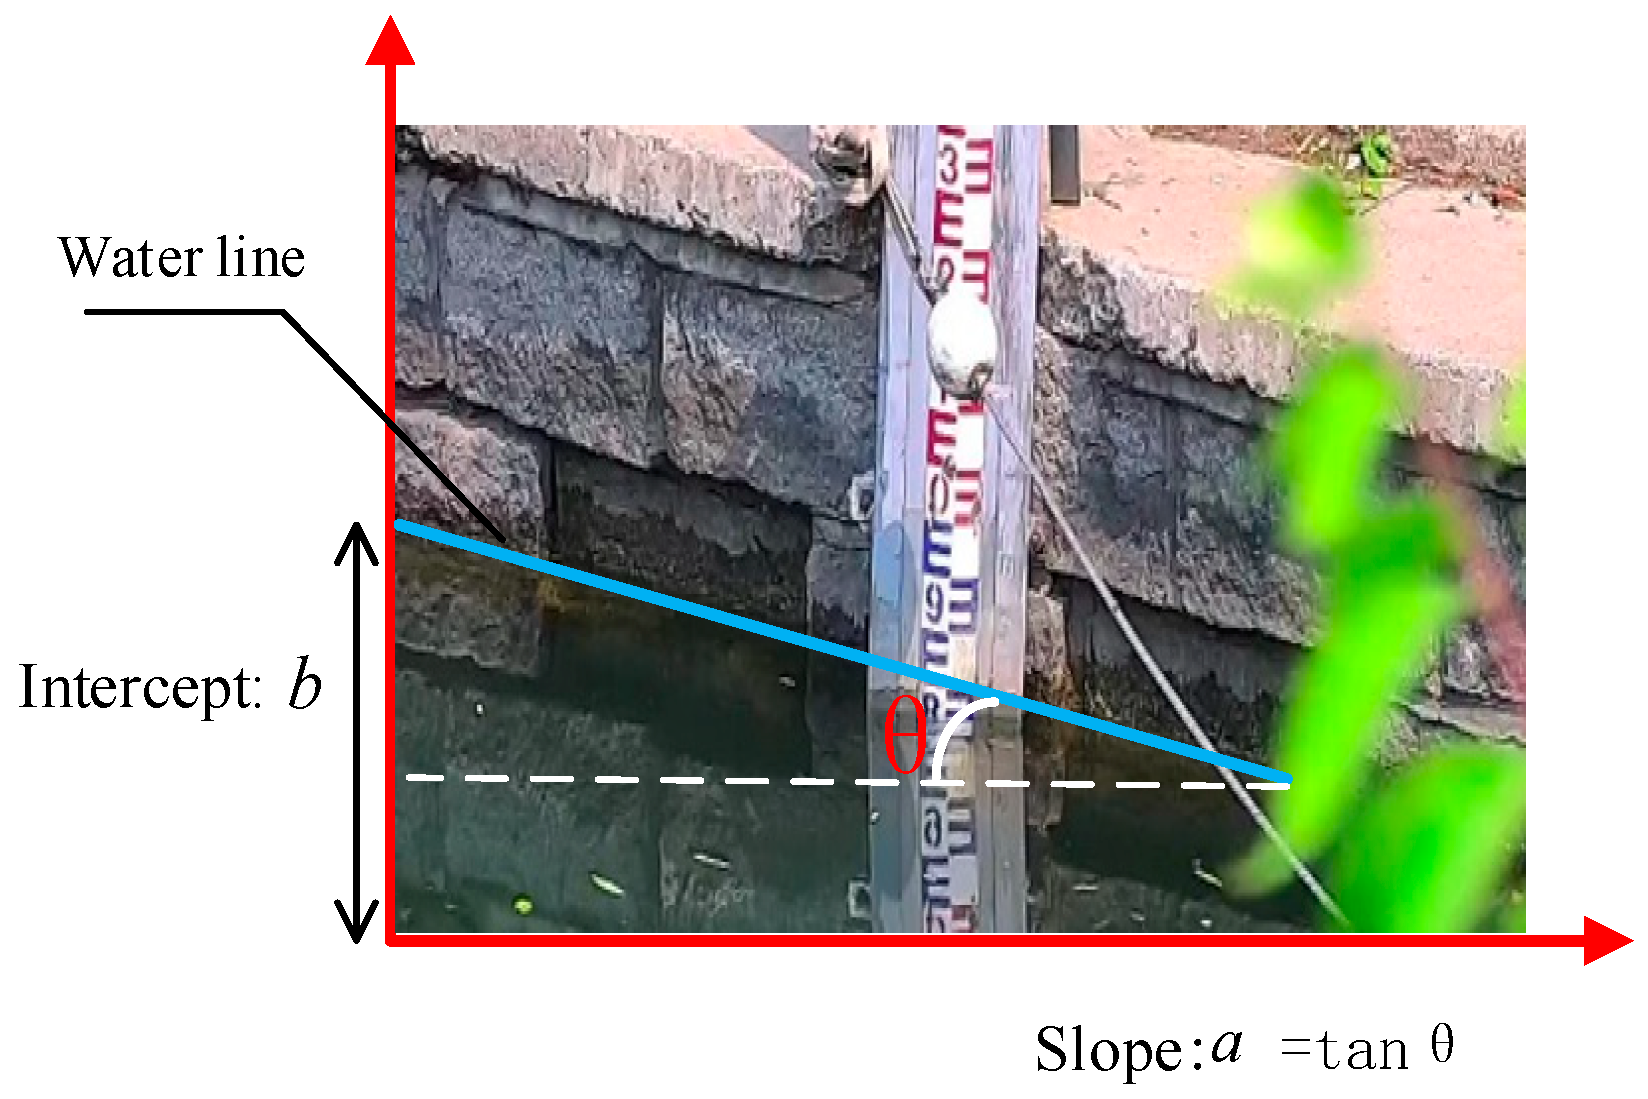
Usually, the performance of target detection algorithms is evaluated using the average precision (AP), mean average precision (mAP), accuracy, and recall. However, the water level line is infinitely large in the extension direction and infinitely small in the normal direction, leading to the failure of the above evaluation metrics. Because the water level elevation described in this study was obtained by solving the water level line expression (Equation (1)), the accuracy of the water level line expression directly affects the pass rate of water level detection. Therefore, we established a new evaluation index of the water level line detection accuracy based on the characteristics of the water level line, and , which measured the slopes of the predicted water level line and the discrepancy between the intercept and true value.
where is the predicted slope value, is the predicted intercept value, is the true slope value, and is the true intercept value. The true values of the slope and intercept for each water level line in the dataset are calculated as shown in Figure 12, where the left end of the water body in the image is connected to the right end to obtain a manually labelled straight water level line, the labelling ensures that the endpoints of the water body are selected accurately, and the true values of the slope and the intercept are solved by the manually labelled water level line.
3.1.3. Analysis of Experimental Results
The experimental results are analysed and illustrated in terms of the number of algorithmic parameters and the effect of ablation experiments, respectively.
- (1)
- Number of algorithmic parameters
The algorithm parameter count results are shown in Table 2. The method in this study reduces the number of network layers by 11%, the parameter scale by 5.6%, and the number of floating-point operations by 6.7% compared with the original algorithm. This indicates that the algorithm of this method is more lightweight, and the water level detection speed is faster.
- (2)
- Effect of ablation experiment
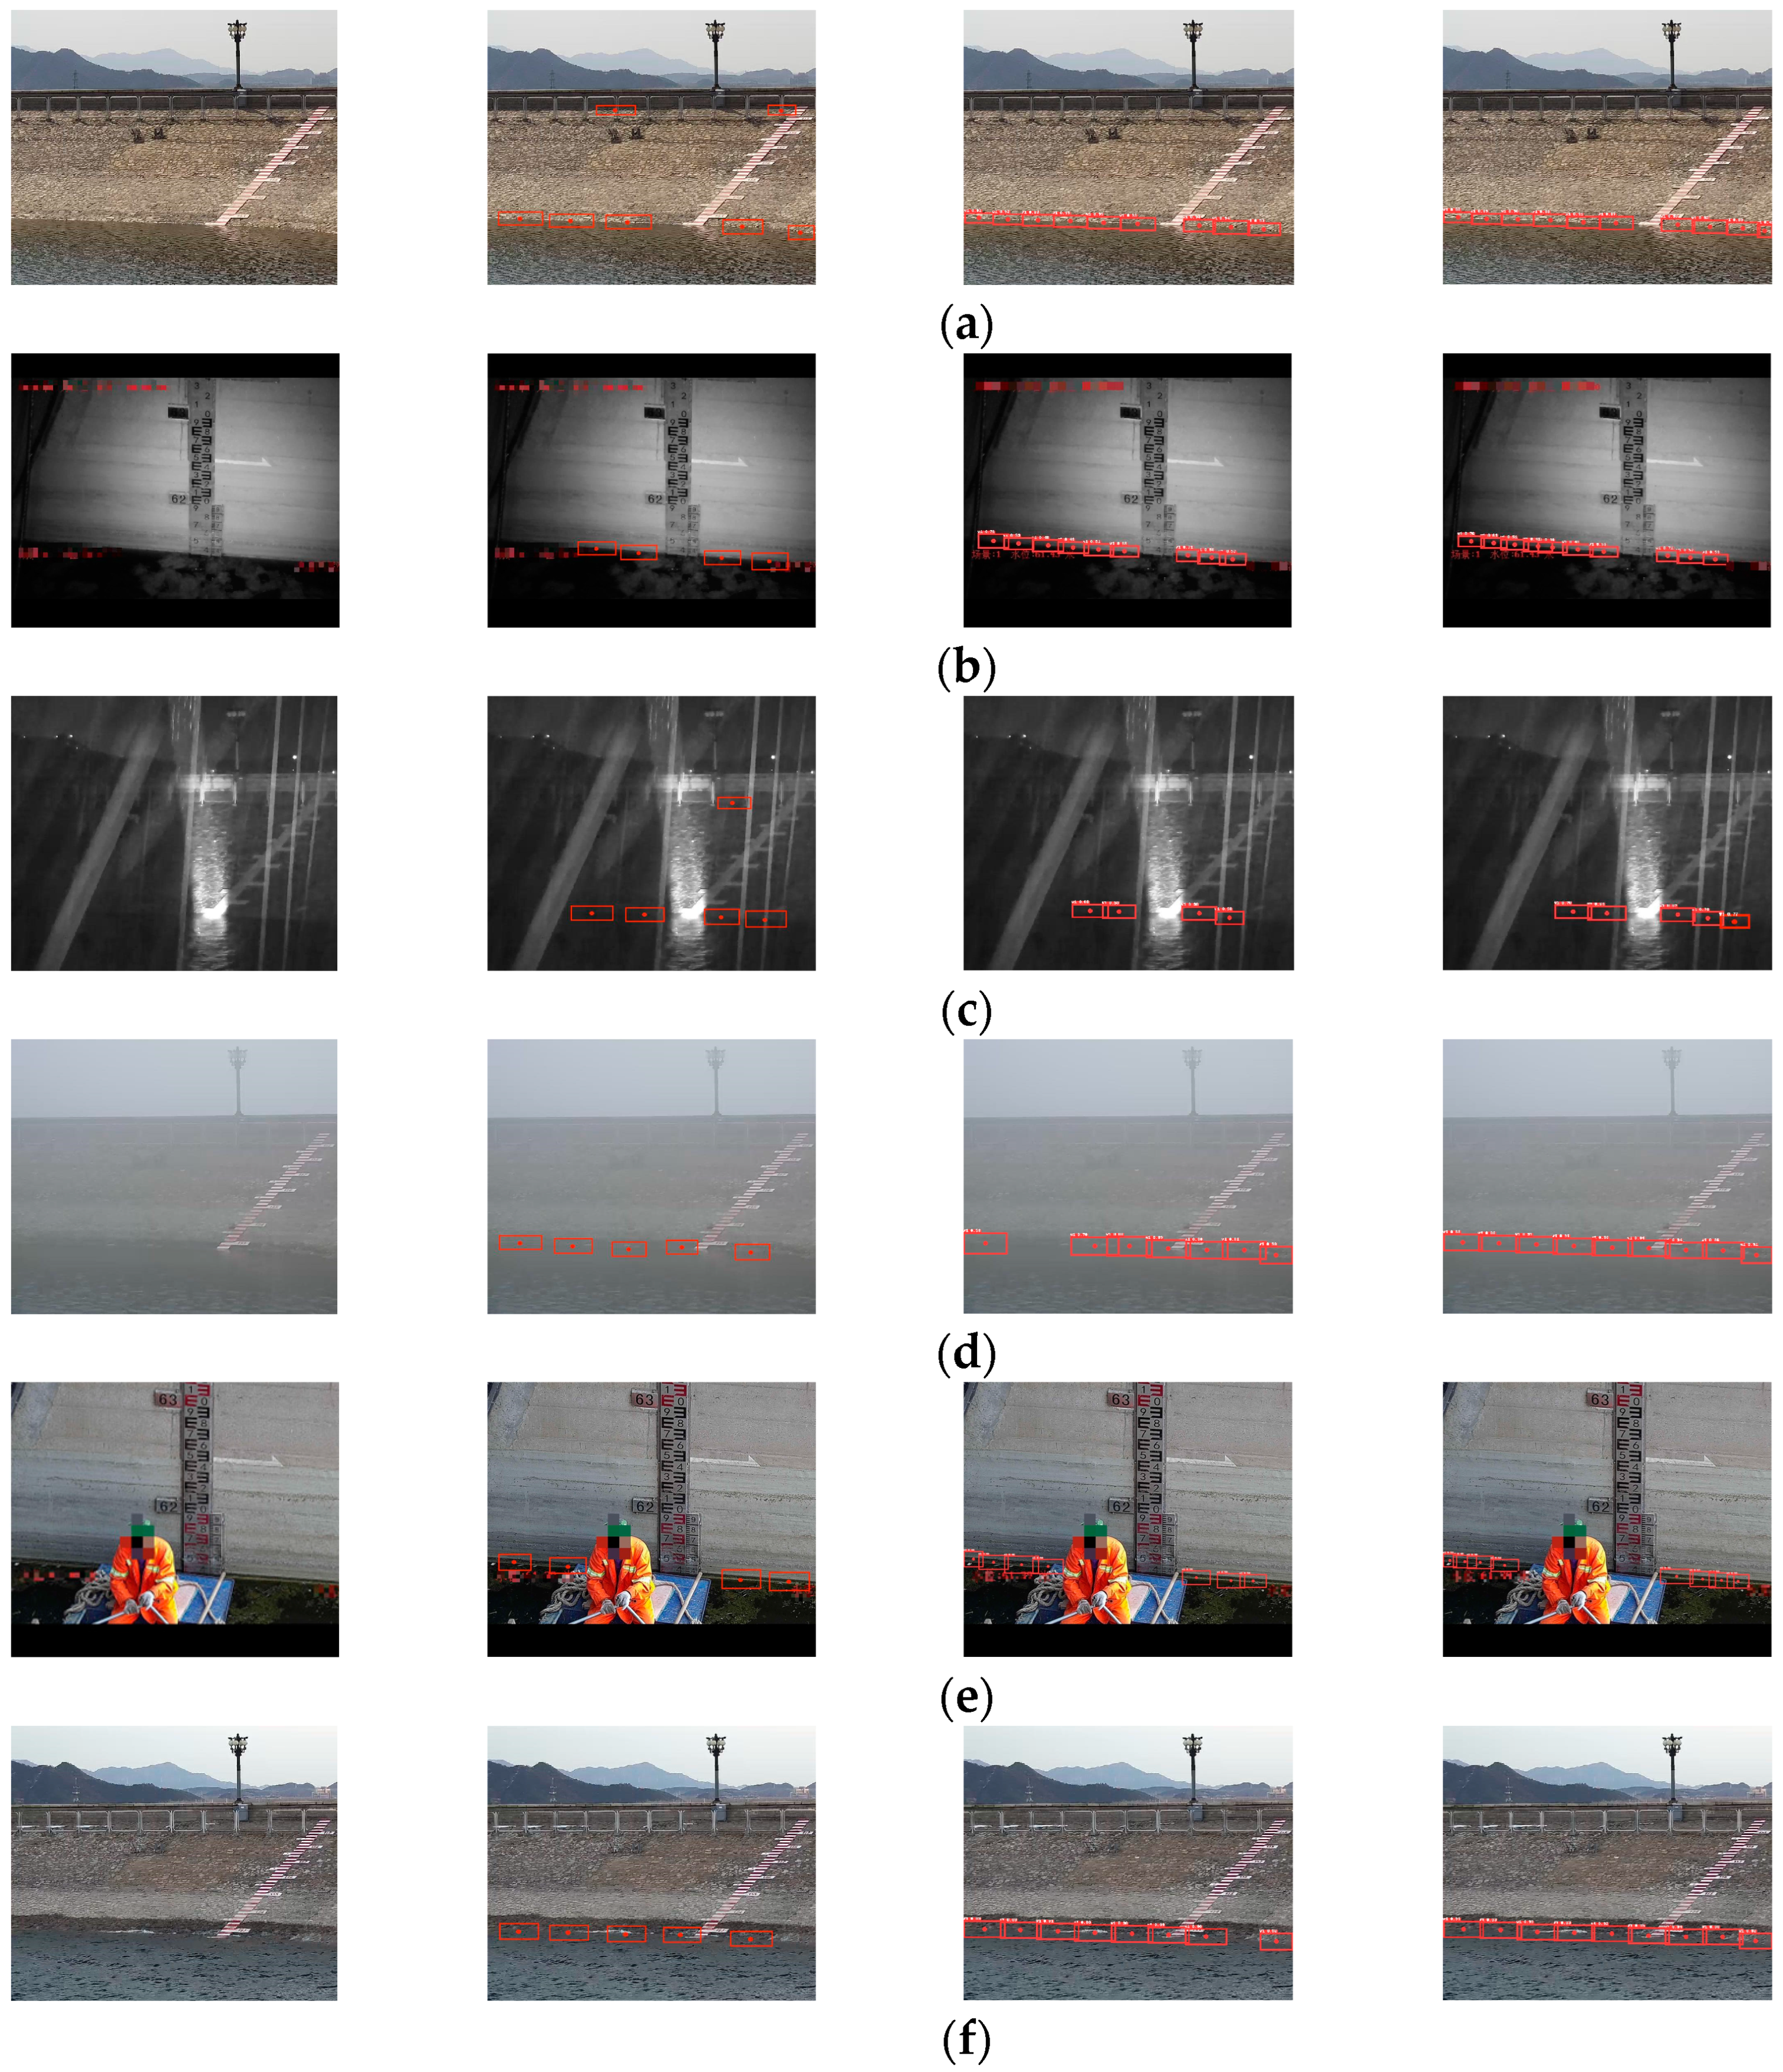
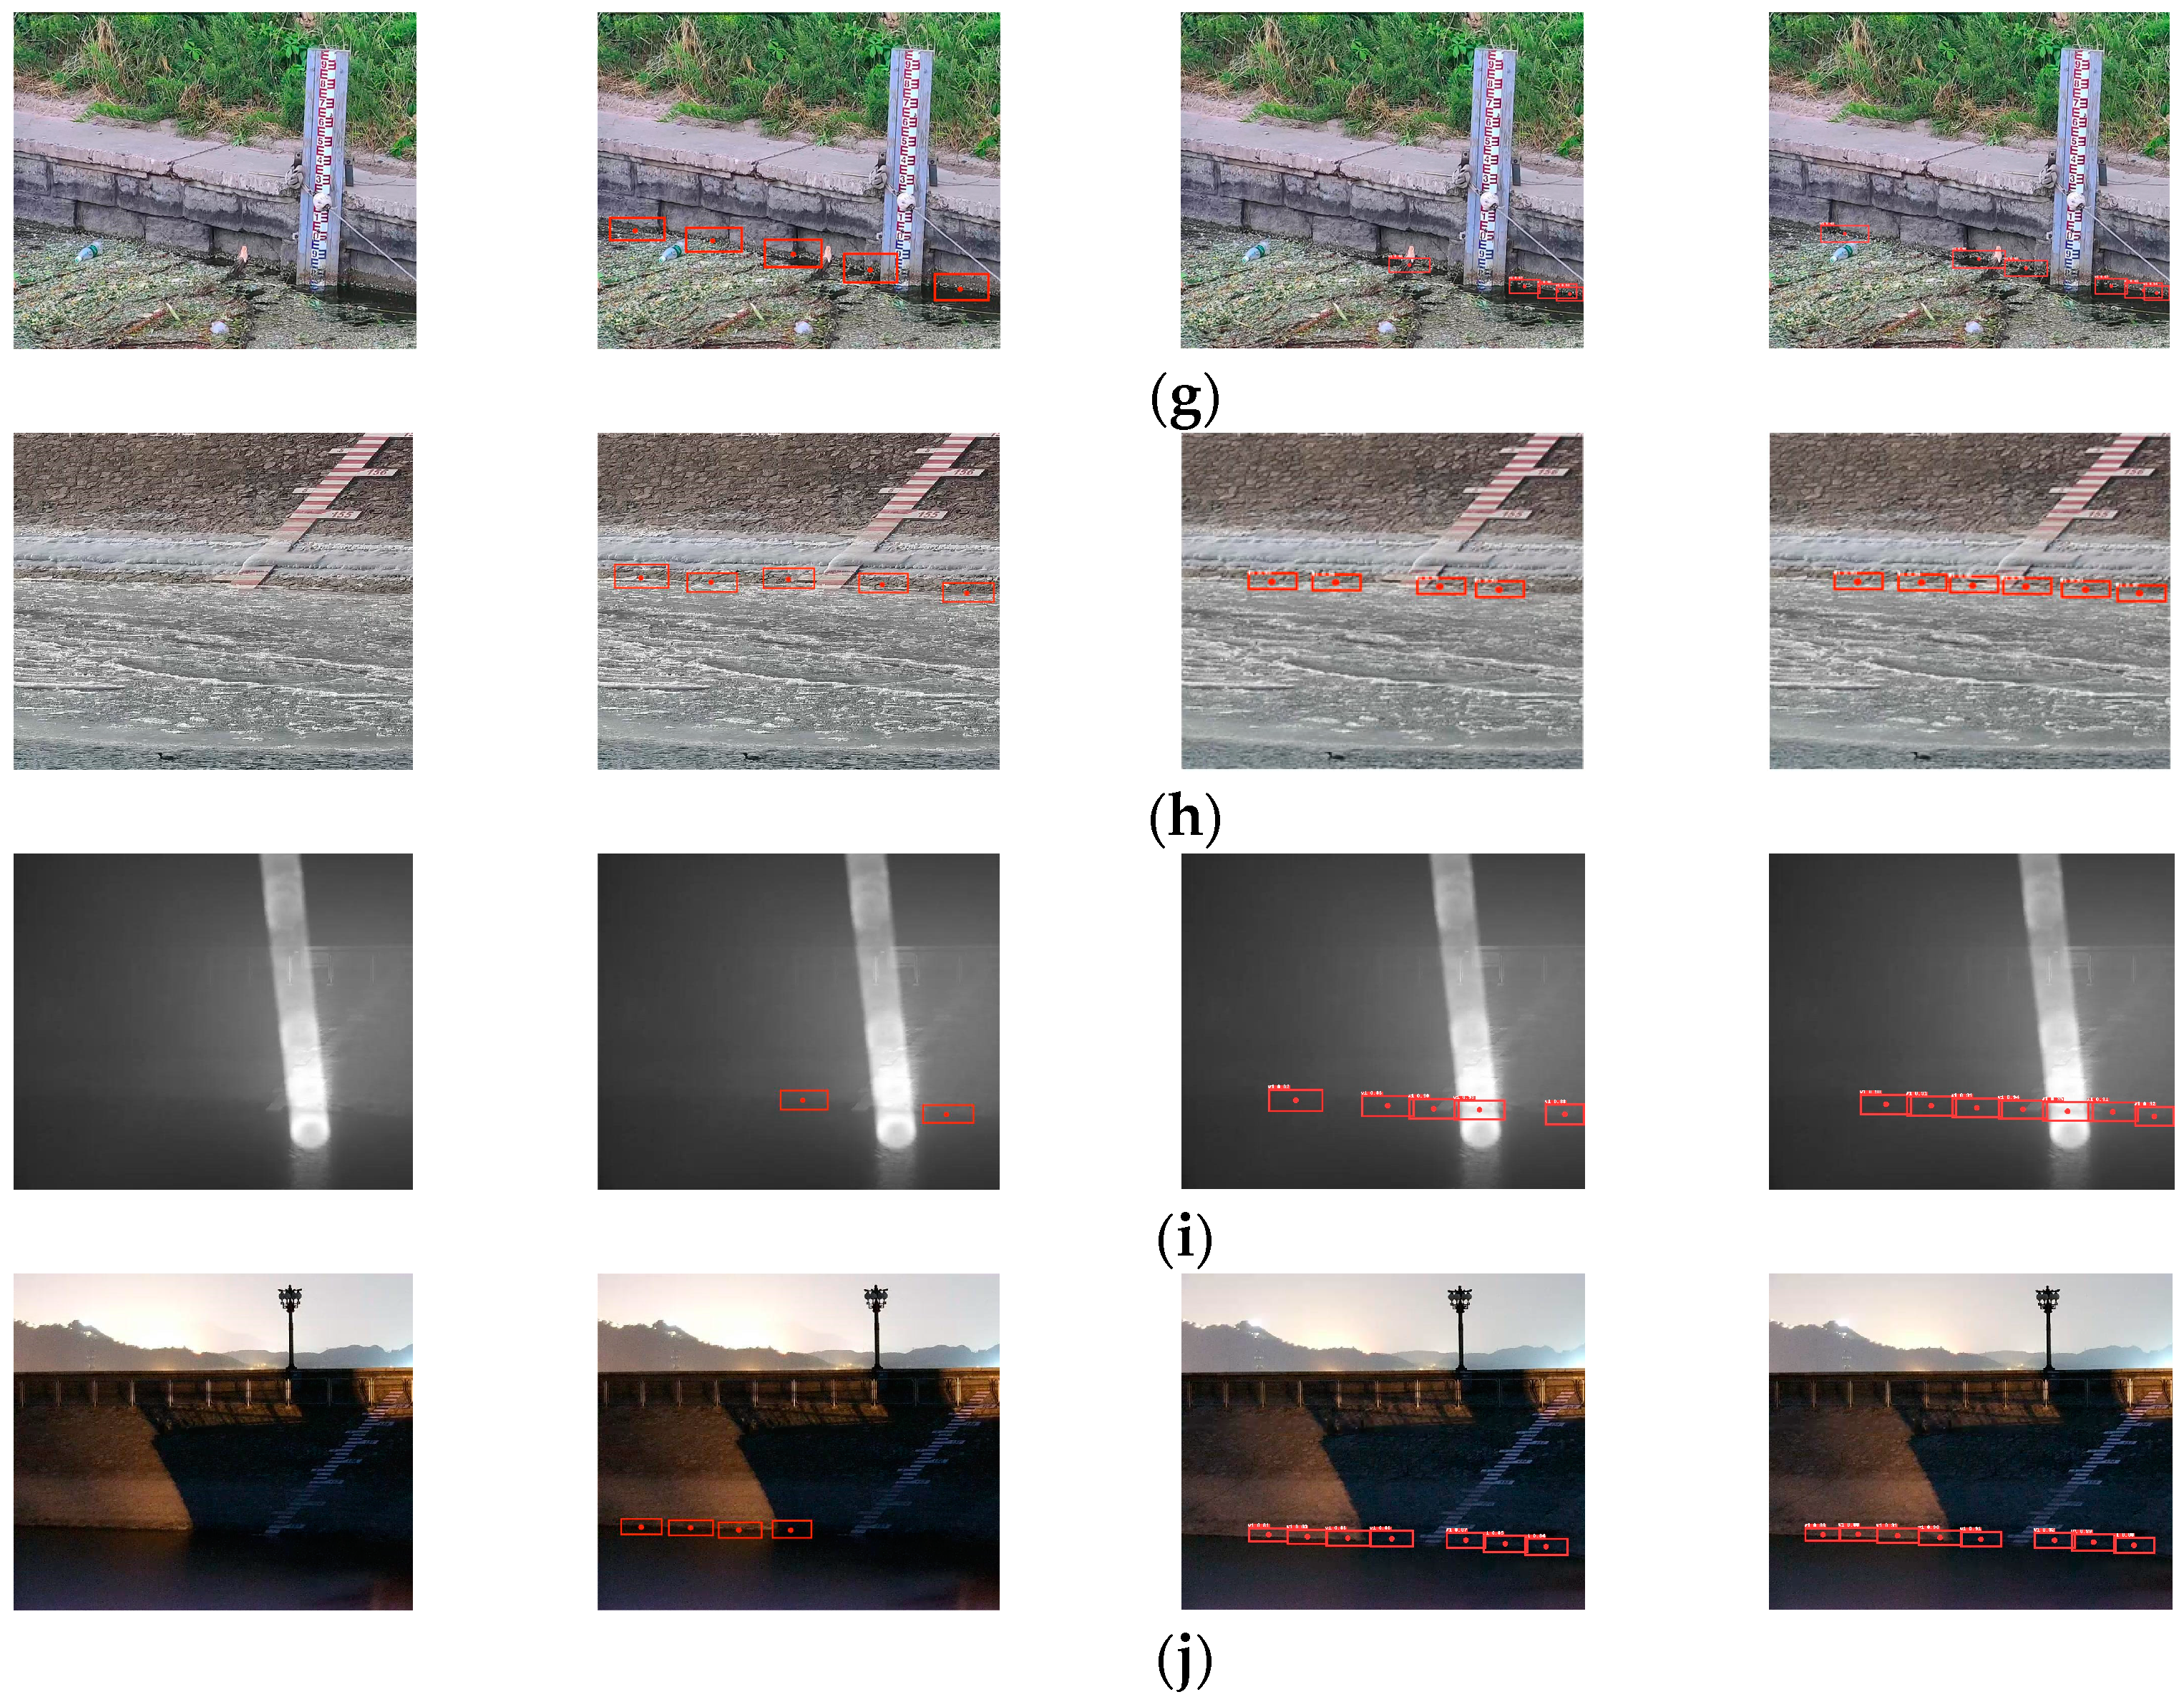
In order to verify the improvement in the water level detection performance achieved by each module, the following ablation experiments were designed. The results of the accuracy indexes are shown in Table 3, and the results of the water level recognition are shown in Figure 13 (in Figure 13, the detection maps of the original, YOLOv3, YOLOv5, and the method used in this study are shown from left to right, respectively. Moreover, three different scenarios are included in Figure 13: reservoir, river, and dike). Among them, YOLOv5 and the improved YOLOv5 represent the original YOLOv5 network and the improved YOLOv5 network in this study, respectively; YOLOv5-K and the improved YOLOv5-K represent the intelligent detection method of the water level that integrates the improved YOLOv5 with the Kalman filtering principle, and the intelligent method of water level detection that integrates the improved YOLOv5 with the Kalman filtering principle, respectively; and and are the mean values of the aforementioned water level line detection accuracy evaluation indexes, and .
As can be seen in Figure 13, the real water level lines all pass through the centre of the predicted anchor frames; the method in this study outputs more anchor frames, and more anchor frames imply higher fitting accuracy. It can be seen that the method in this study is more capable of recognizing the water level line in complex and harsh environments with a higher generalization performance. The ablation experimental data in Table 3 also support the above conclusion: the slope accuracy of the method in this study is 97.3%, which is 2.4% higher than the original algorithm; the intercept accuracy is 99.3%, which is 0.5% higher than the original algorithm.
3.2. Experimental Results and Analysis of Water Level Detection Method without Water Stage Gage Based on Semantic Segmentation Technology
3.2.1. Experimental Program
The models compared were several of the more popular semantic disambiguation networks, such as Deeplab [27] and PSPNet [28]. All the network models used the same software and hardware experimental protocols (Table 4) and had the same parameter settings. In this experiment, the batch size was 4; the training batch was 50; , , and in the Adam optimizer were set to 0.9, 0.999, and 10−8, respectively, and the initial learning rate was 0.01.
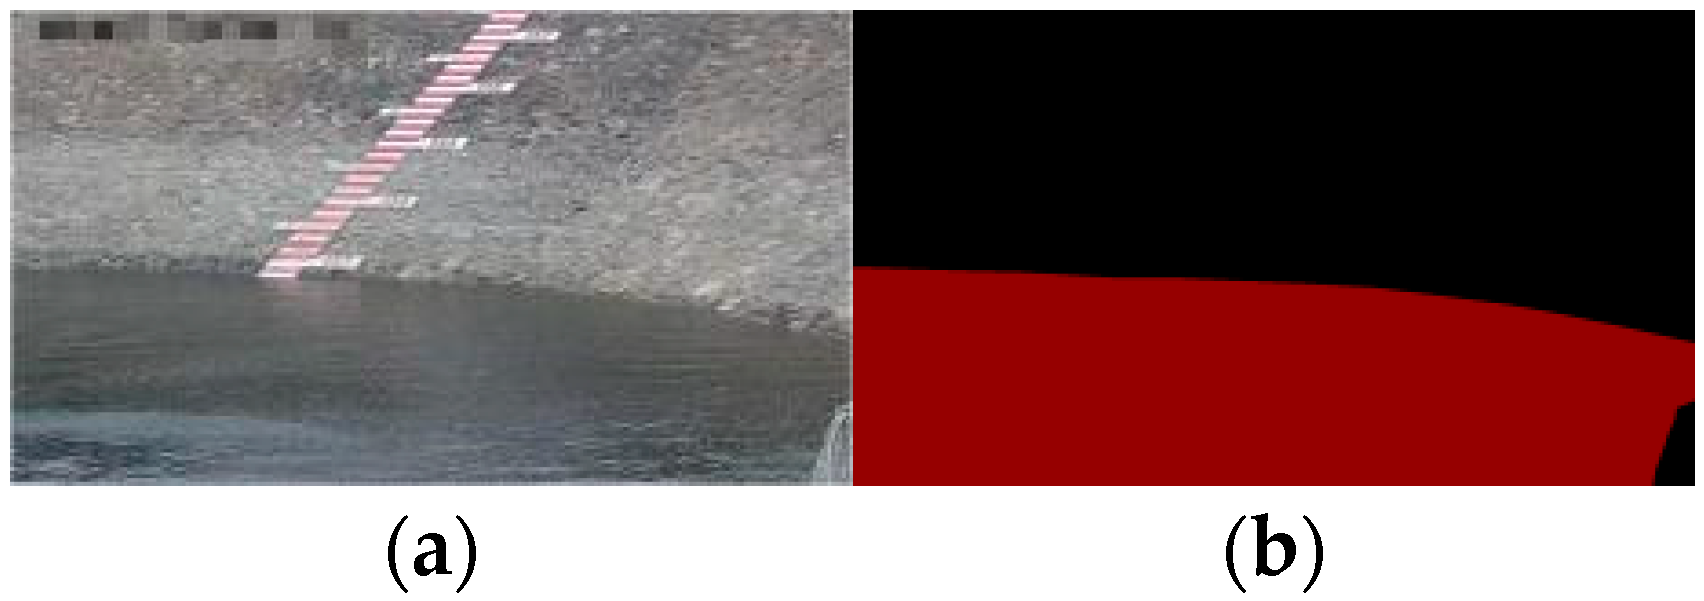
The experiment utilised 6028 water surface images, including those taken in daytime and nighttime, with ice and snow cover, light, shadow, waves, rain, fog, etc. The images were associated with a variety of severe weather types. The images were labelled using Labelme (see Figure 14) and the dataset was enhanced with the image data.
The sum of the cross-entropy loss function and the Dice loss function was utilized as the model loss function. The cross-entropy loss represented the difference between the true probability distribution of the image and the predicted probability distribution, and its equation is shown below:
where N is the number of categories categorized; is the classification number; is the classification target for the actual true value, expressed as 1 in the case of the corresponding object category, and 0 in all other cases; is the predicted probability value; and is taken from the bottom, , where not otherwise specified.
The Dice loss indicates the proportion of incorrectly categorized information to correct information with the following expression:
where and denote the predicted and true values of pixel ; is the total number of pixels.
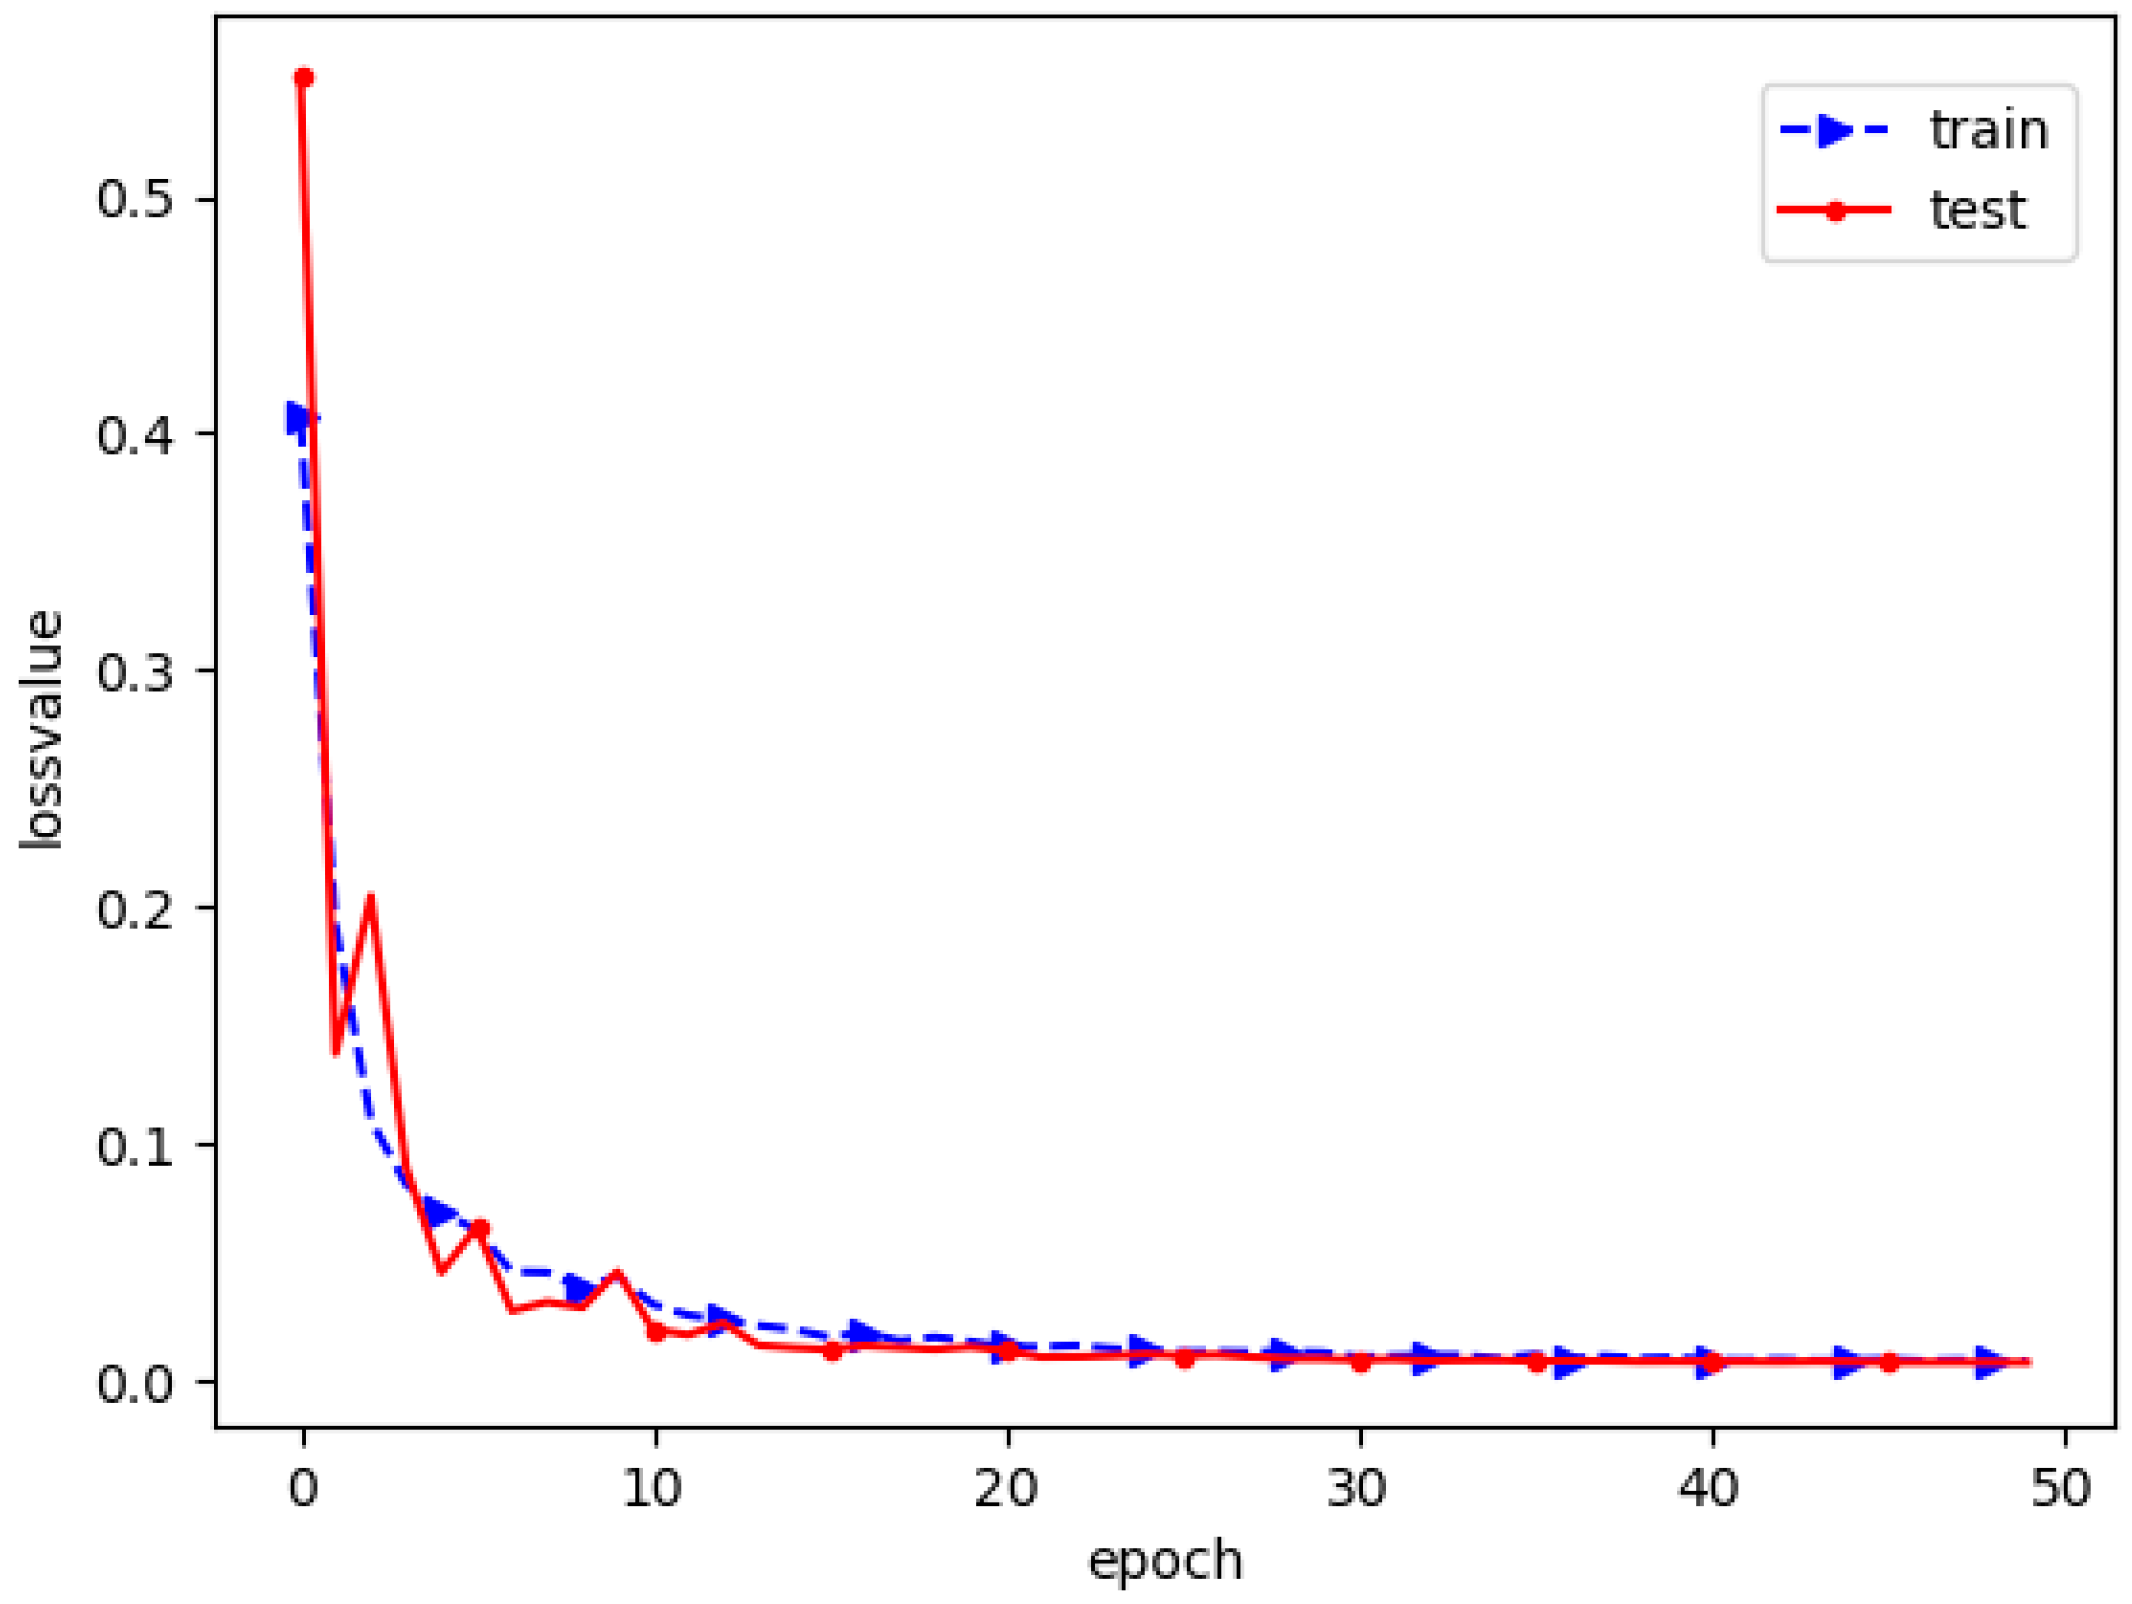
Fifty rounds of training were performed based on the above loss function and the change in model loss values was recorded (see Figure 15, lossvalue is a parameter value in model training, the lower the value is, the better the model training effect is; epoch is the number of iterations in model training).
3.2.2. Evaluation of Indicators
Currently, evaluation methods based on the Mean Intersection Ratio (MIOU) and the Mean Pixel Accuracy (MPA) for categories are widely used. The IOU represents the ratio of the intersection and concatenation between the true and predicted values, and the MIOU represents the average of the IOU values for each category in a global context, as follows:
where denotes the number of categories categorized; denotes the pixels correctly categorized; denotes the pixels that would have belonged to category but were classified in category ; and denotes the pixels that would have belonged to category but were classified in category .
The PA value indicates the ratio of correctly categorized pixels to all pixels, while the MPA value is the average PA value for each category across the region, as follows:
where denotes the total number of pixels corresponding to the classification.
Because the test data were taken from the same points, the mean water level difference (MLD) can be used as a measure of the water level discrimination accuracy:
where denotes the total number of detected images; and denote the true value of the water level and the predicted value of the network.
3.2.3. Analysis of Experimental Results
The two different methods proposed in this study were compared, and the effectiveness of the two methods were verified by ablation experiments, the results of which are shown in Table 5. The numbers 1–5 in the table represent the different model structures based on the Unet model, and a circle indicates that the model contains the corresponding structure.
The experimental results are shown in Table 6. It can be seen that the experimental groups achieved some improvements on the basis of Unet’s semantic segmentation model. Compared with the first experiment, the second experiment replaced all the convolutional layers of the original encoder’s single scale with the Transformer structure, and the second experiment improved the detection accuracy with the Transformer structure. The parameters were reduced dramatically, which effectively improved the correlation between the local features. Compared to the first experiment, the third experiment added a residual channel attention module between the encoder and the decoder, thus improving the network accuracy without changing any parameters. The fourth experiment combined the two improvement methods of Experiment 3 and Experiment 2, and the result was that both Experiment 3 and Experiment 2 provided better results than the single improvement method. Under the assumptions of the fifth experiment, which replaced the basic jump structure with a full-scale connectivity structure, a significant reduction in the number of parameters was achieved and the detection accuracy of the model was improved. In conclusion, these improvements can enhance the performance of net detection. The test set had a total of 600 water surface images, covering a variety of different harsh environments. Due to the space limitation of the layout, eight images with typical significance were selected for presentation. In Figure 16, from left to right, the detection maps of the original image, the method used in this study, Deeplab, PSPNet, and Unet are shown, respectively. The effect image after segmentation is enlarged for the convenience of presentation, the plane area after segmentation is marked in red, and in the bottom surface, the dike is marked in black. The low illumination and rainfall-obscured water level areas in Figure 16a,h were enlarged and are shown in Figure 17. It can be seen from Figure 16 and Figure 17 that the surface edges obtained by segmentation under various complex and harsh environments are closer to the actual surface edges, as suggested in this study for the TRCAM-Unet model, whereas the other network models tend to produce segmentation edges that are unstable and false areas of recognition. The experimental results show that this method can achieve more high-precision water level detection.
From Table 6, it can be seen that the TRCAM-Unet model proposed in this study exhibits an MIOU evaluation index of 98.84% and an MPA evaluation index of 99.42%, which has a better segmentation accuracy. TRCAM-Unet has only a 9.717 × 10⁻³ m average difference in the detection of water, which is a small difference compared with other types of network models. Compared with other semantic segmentation methods, the TRCAM-Unet method can be better applied to water level detection in various complex and harsh environments.
3.3. Comparison of the Practical Results of Two Methods of Water Level Detection without a Scale
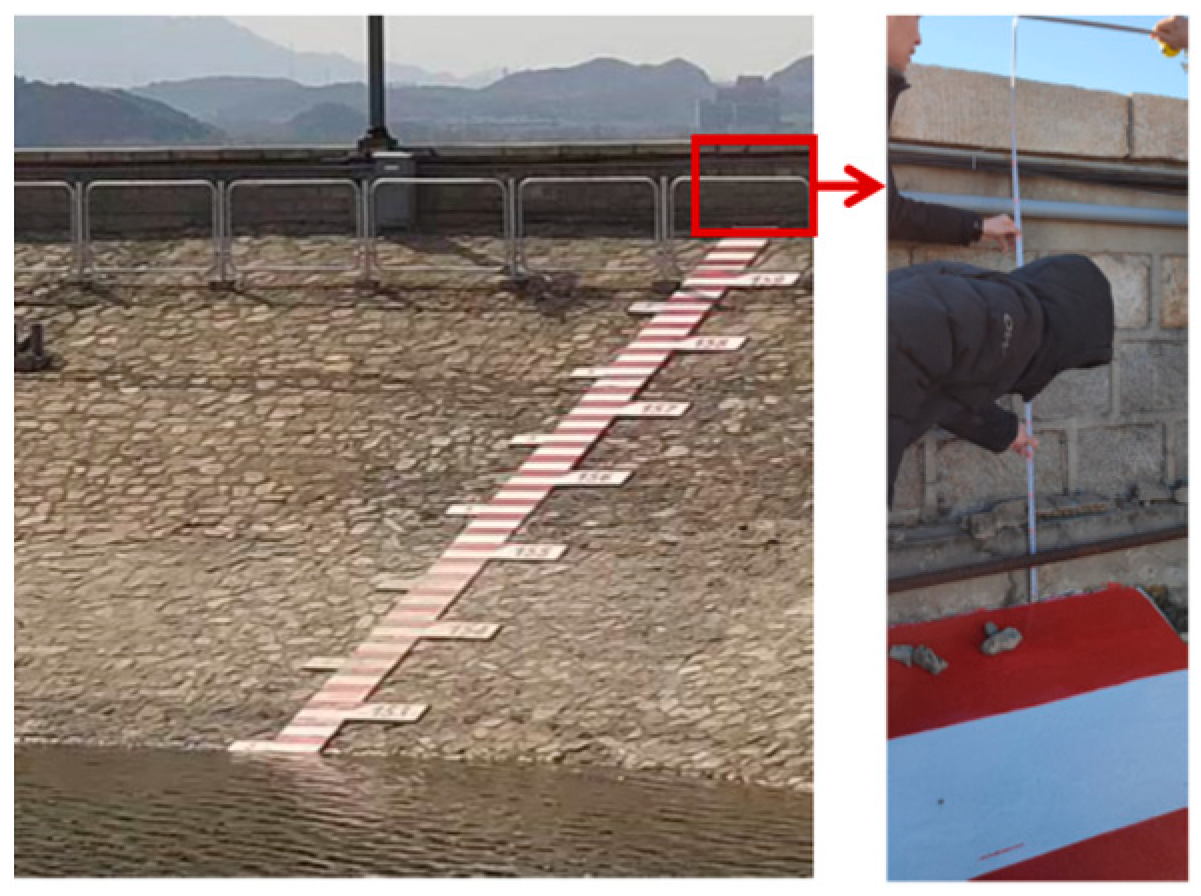
A reservoir was selected as a practice point. In order to facilitate the analysis of the accuracy of the method used in this study, the water level image acquisition point was arranged in a water stage gage area. Due to the limitations of the terrain, the camera was far away from the acquisition target, about 150 m. Since the wave protection wall above the reservoir can be seen clearly in the image, and its position is fixed and not easily deformed, the wave protection wall was selected as the detection marker. As shown in Figure 18, the actual length of the wall is 1.46 m measured manually and accurately. The proportion coefficient K between the pixel and the real length is converted in real time by detecting the pixel length of the marker and is used for the subsequent conversion of the actual water level elevation. The water level at the site was monitored from 22 March to 8 April 2022, using the two no-water-ruler detection methods described in this study. The images were taken every 1 h during monitoring, and a total of 420 images were captured. Among them, 173 images were taken during normal daytime, 120 images during normal darkness, 48 images during foggy days, 41 images during rainy days, 11 images under shadow, and 11 images with waves. The water level at this location was monitored from 22 March–8 April 2022 using the two detection methods in this paper. Images were taken at 1 h intervals during monitoring, and a total of 420 images were captured. Among them, 173 images were taken during normal daytime, 120 images were taken during normal darkness, 48 images were taken during foggy days, 41 images were taken during rainy days, 11 images were taken during shadows, and 11 images were taken during waves. The true water levels were extracted by using manually observed water level scales.
The water level detection results from harsh environments obtained using the fusion of the improved YOLOv5 and Kalman filter principle of water level detection without a water stage gage are shown in Figure 19, where the red line is the detected water level line, the green line is the virtual water stage gage, and the yellow line is the detected water level elevation. The overall detection data are shown in Figure 20, and there were no misidentification results obtained during the entire monitoring period, and the maximum error between the detected water level elevation value and the manually observed value is only 0.09 m.
The water level detection results in harsh scenarios obtained using the TRCAM-Unet-based water level detection method without a water stage gage are shown in Figure 21, and the overall detection data are shown in Figure 22. Throughout the entire detection process, the water level detected by this study’s method had a very small deviation from the real water level, with a maximum deviation of no more than 0.08 m, and its MLD was only 1.609 × 10⁻² m.
The real-time processing capability of the model is expressed by the FPS value, and Table 7 shows the FPS values of the two methods proposed in this study, and it can be seen that the response speeds of the two models for processing an image belong to the millisecond level, which meets the needs of practical applications.
4. Discussion
The experiments performed in this study show that the two water level detection methods described can accurately identify the water level in complex and harsh environments, with an error less than 0.1 m. As shown in Table 8, the intelligent water level detection method without a ruler that combines the improved YOLOv5 and Kalman filtering principle does not rely on the water stage gage, and since the method uses linear fitting to obtain the water level line, it can reduce the impact of a small number of detection errors. However, it is prone to failing in cases of water surfaces with large undulations, so the method should be applied to an area with a gentle water surface. Moreover, the number of parameters in the algorithm is low, and is 61.4% less than the number of parameters in the TRCAM-Unet-based model proposed in this study; the TRCAM-Unet-based water level detection method without a ruler also does not rely on the water stage gage and tends to be applicable to all water level detection scenarios, and has a higher compatibility. However, the number of parameters in the algorithm is large, and the requirements for the computing equipment are high, which is not conducive to the deployment of the model in mobile applications.
5. Conclusions
In order to solve the problem of water level detection in complex and harsh environments, we proposed a fusion of an improved YOLOv5 and the Kalman filtering principle for intelligent water level detection without a water stage gage. (1) Aiming at the characteristics of the water level line being infinitely large in the extension direction and infinitely small in the normal direction of the water level line, we proposed a multi-level feature fusion method to improve YOLOv5 by reinforcing the meso-scale features. We utilized the improved YOLOv5 algorithm to capture an anchor frame of a specific size of the water level line, and we approximated the real water level line by fitting the centre point of the anchor frame. The Kalman filter was used to introduce the a priori knowledge to improve the model’s generalization performance within complex and harsh environments. (2) The relevant experiments show that the present technique effectively improves the accuracy of water level detection: the accuracy of the slope is 97.3%, which is improved by 2.4% compared with the original algorithm, and the accuracy of the intercept is 99.3%, which is improved by 0.5% compared with the original algorithm.
However, there is a certain risk of failure in detecting the water level using only target detection techniques, so this study used the deep learning semantic segmentation technique to detect the water level and output of a near-real water level line contour to satisfy the demand of water level detection in each scenario. The TRCAM-Unet model was proposed to achieve the following: (1) To achieve multi-level feature fusion through a full-scale connection structure; to enhance the network’s relevance to the features of the water surface image region through the Transformer module; to enhance the useful feature information and reduce the influence of useless noise through the residual channel attention module; and to reduce the influence caused by water surface obstruction under unfavourable environments. (2) In real-world unfavourable environments, the water level image test experiments and application showed that the TRCAM-Unet model achieves an MIOU score of 98.40% and an MPA score of 99.20%, the maximum error of the water level detection is no more than 0.08 m at a distance of 150 m, and the mean value of the water level deviation (MLD) is only 1.609 × 10⁻² m, which is far better than the mainstream Deeplab, PSPNet, and Unet semantic segmentation network models.
Relevant engineering practices show that the technology proposed in this study can automatedly and accurately detect water level elevation under complex and harsh environments, such as night, haze, rain, snow, floating objects, shadows, and so on, with an error of less than 0.1 m.
Author Contributions
Investigation, C.S. and Y.L.; methodology, C.S. and Y.W.; software, Y.W.; resources, W.W. and Z.W.; writing—original draft preparation, Y.W.; writing—review and editing, C.S. and Y.L.; supervision, Z.W.; funding acquisition, C.S. All authors have read and agreed to the published version of the manuscript.
Funding
This research was funded by the National Key Research and Development Program of China [2022YFC2905700, 2022YFB3205800], and the Fundamental Research Programs of Shanxi Province [202203021212129, 202203021221106, 20210302123047], and the Shanxi Water Conservancy Science and Technology Research and Promotion Project [2023GM31].
Data Availability Statement
Data available on request due to restrictions (e.g., privacy or ethics). The data presented in this study are available on request from the corresponding author.
Conflicts of Interest
The authors declare no conflicts of interest.
References
- Khampuengson, T.; Wang, W. Deep Reinforcement Learning Ensemble for Detecting Anomaly in Telemetry Water Level Data. Water 2022, 14, 2492. [Google Scholar] [CrossRef]
- Iwahashi, M.; Udomsiri, S. Water level detection from video with FIR filtering. In Proceedings of the 2007 16th International Conference on Computer Communications and Networks, Honolulu, HI, USA, 13–16 August 2007; pp. 826–831. [Google Scholar]
- Bao, J.; Tao, Q.; Zhang, P. An Algorithm of Water Level Detection Based on Image Processing. Water Resour. Power 2015, 33, 96–99. [Google Scholar]
- Chuanmeng, S.; Xinyu, L.; Jiaxin, C.; Zhibo, W.; Yong, L. Coal-Rock Image Recognition Method for Complex and Harsh Environment in Coal Mine Using Deep Learning Models. IEEE Access 2023, 11, 80794–80805. [Google Scholar] [CrossRef]
- Sun, C.; Xu, R.; Wang, C.; Ma, T.; Chen, J. Coal rock image recognition method based on improved CLBP and receptive field theory. Deep Undergr. Sci. Eng. 2022, 1, 165–173. [Google Scholar] [CrossRef]
- Li, X.; Sun, C.; Wei, Y.; Yuan, Y.; Wu, Z.; Li, Y. Water level intelligent detection method based on fuse transformer residual channel attention mechanism in harsh environments. J. Electron. Meas. Instrum. 2023, 37, 59–69. [Google Scholar]
- Cheng, S.; Zhao, K.; Zhang, S.; Zhang, D. Water Level Detection Based On U-net. Acta Metrol. Sin. 2019, 40, 361–366. [Google Scholar]
- Xiao, Z.; Tao, Q.; Shen, J. A Video Water-Level Recognition Based on SSD Object Detect Network. Mod. Comput. 2019, 09, 60–64. [Google Scholar]
- Liao, Y.; Duan, Q.; Liu, J.; Zhou, H. Water Line Detection Algorithm Based on Deep Learning. J. Comput. Appl. 2020, 40, 274–278. [Google Scholar]
- Wang, L.; Chen, M.; Meng, K.; Wen, J.; Zhou, P. Research on water level recognition method based on deep learning algorithms. Water Resour. Informatiz. 2020, 2020, 39–43+56. [Google Scholar]
- Xia, P.; Wang, F.; Lei, B.; Shi, D. Intelligent Visual Water Level Recognition Algorithm Based on Super-pixel and Graph Cut Segmentation. Comput. Simul. 2021, 38, 430–436+441. [Google Scholar]
- Rak, J.R.; Tchórzewska-Cieślak, B.; Pietrucha-Urbanik, K. A Hazard Assessment Method for Waterworks Systems Operating in Self-Government Units. Int. J. Environ. Res. Public Health 2019, 16, 767. [Google Scholar] [CrossRef] [PubMed]
- Zhang, K.; Wang, J.; Zhang, G.; Liu, M. Review of Image Water Level Detection. Electron. Meas. Technol. 2021, 44, 104–113. [Google Scholar]
- Chen, C.; Liu, M.Y.; Tuzel, O.; Xiao, J. RCNN for small object detection. In Computer Vision—ACCV 2016; Springer: Cham, Switzerland, 2016; Volume 10115. [Google Scholar]
- Cui, X.; Wang, Q.; Li, S.; Dai, J.; Liang, K.; Li, L. Intelligent Recognition of Cracks in Double Block Sleeper Based on YOLO-v5. J. China Railw. Soc. 2022, 44, 104–111. [Google Scholar]
- He, K.; Zhang, X.; Ren, S.; Sun, J. Spatial Pyramid Pooling in Deep Convolutional Networks for Visual Recognition. IEEE Trans. Pattern Anal. Mach. Intell. 2015, 37, 1904–1916. [Google Scholar] [CrossRef] [PubMed]
- Lin, T.Y.; Dollár, P.; Girshick, R.; He, K.; Hariharan, B.; Belongie, S. Feature Pyramid Networks for Object Detection. In Proceedings of the IEEE Conference on Computer Vision and Pattern Recognition (CVPR), Honolulu, HI, USA, 21–26 July 2017. [Google Scholar]
- Liu, S.; Qi, L.; Qin, H.; Shi, J.; Jia, J. Path Aggregation Network for Instance Segmentation. In Proceedings of the IEEE Conference on Computer Vision and Pattern Recognition (CVPR), Salt Lake City, UT, USA, 18–22 June 2018. [Google Scholar]
- Ren, S.; He, K.; Girshick, R.; Sun, J. Faster R-CNN: Towards Real-Time Object Detection with Region Proposal Networks. IEEE Trans. Pattern Anal. Mach. Intell. 2017, 39, 1137–1149. [Google Scholar] [CrossRef] [PubMed]
- Liu, W.; Anguelov, D.; Erhan, D.; Szegedy, C.; Reed, S.; Fu, C.Y.; Berg, A.C. SSD: Single Shot Multi Box Detector. In Computer Vision—ECCV 2016; Springer: Cham, Switzerland, 2016. [Google Scholar]
- Redmon, J.; Farhadi, A. YOLOv3: An Incremental Improvement. arXiv 2018, arXiv:1804.02767. [Google Scholar]
- Du, X.; Chen, D.; Liu, H.; Ma, Z.; Yang, Q. Real-time hand tracking based on YOLOv4 model and Kalman filter. J. China Univ. Posts Telecommun. 2021, 28, 86–94. [Google Scholar]
- He, N.; Fang, L.; Plaza, A. Hybrid first and second order attention Unet for building segmentation in remote sensing images. Sci. China Inf. Sci. 2020, 63, 140305. [Google Scholar] [CrossRef]
- Dosovitskiy, A.; Beyer, L.; Kolesnikov, A.; Weissenborn, D.; Zhai, X.; Unterthiner, T.; Dehghani, M.; Minderer, M.; Heigold, G.; Gelly, S.; et al. An Image is Worth 16 × 16 Words: Transformers for Image Recognition at Scale. arXiv 2020, arXiv:2010.11929. [Google Scholar]
- Hu, J.; Shen, L.; Sun, G. Squeeze-and-Excitation Networks. In Proceedings of the IEEE Conference on Computer Vision and Pattern Recognition (CVPR), Salt Lake City, UT, USA, 18–22 June 2018. [Google Scholar]
- He, K.; Zhang, X.; Ren, S.; Sun, J. Deep residual learning for image recognition. In Proceedings of the IEEE Computer Society Conference on Computer Vision and Pattern Recognition (CVPR), Las Vegas, NV, USA, 27–30 June 2016; pp. 770–778. [Google Scholar]
- Chen, L.-C.; Papandreou, G.; Kokkinos, I.; Murphy, K.; Yuille, A.L. DeepLab: Semantic Image Segmentation with Deep Convolutional Nets, Atrous Convolution, and Fully Connected CRFs. IEEE Trans. Pattern Anal. Mach. Intell. 2018, 40, 834–848. [Google Scholar] [CrossRef] [PubMed]
- Zhao, H.; Shi, J.; Qi, X.; Wang, X.; Jia, J. Pyramid Scene Parsing Network. In Proceedings of the IEEE Conference on Computer Vision and Pattern Recognition (CVPR), Honolulu, HI, USA, 21–26 July 2017. [Google Scholar]
Figure 1.
Examples of sampling conducted in different environments. (a) Daytime, (b) night, (c) rain, (d) fog, (e) sheltered, (f) wavy, (g) drift, (h) ice-covered, (i) Tyndall effect, and (j) shadow.
Figure 1.
Examples of sampling conducted in different environments. (a) Daytime, (b) night, (c) rain, (d) fog, (e) sheltered, (f) wavy, (g) drift, (h) ice-covered, (i) Tyndall effect, and (j) shadow.

Figure 2.
Flow chart of water level detection scheme without water gauge.

Figure 3.
Improved YOLOv5 network structure.

Figure 4.
A flow chart of the intelligent detection method of water level in this study.

Figure 5.
Water level detection program without water gauge.

Figure 6.
TRCAM-Unet module.

Figure 7.
Full-scale connected framework.

Figure 8.
Feature extraction mechanism for single attention head.

Figure 9.
Transformer module.

Figure 10.
Residual channel attention module.

Figure 11.
Example diagram of water level label (The red boxes are label boxes.).

Figure 12.
Schematic diagram of the intercept and slope of the water level line.

Figure 13.
Comparison of predictive effectiveness of different network models. (a) daytime, (b) night, (c) rain, (d) fog, (e) sheltered, (f) wavy, (g) flotage, (h) snow, (i) Tyndall effect, and (j) shadow. (The original image, YOLOv3, YOLOv5, and the methods in this study are arranged from left to right, and the red box is the recognition result box).


Figure 14.
Dataset label. (a) Original image. (b) Label image.

Figure 15.
Training effect of network model loss function.

Figure 16.
Comparison of prediction effects of different network models. (a) Low light level. (b) Haze. (c) Snow. (d) Tyndall effect. (e) Camera shake. (f) Wavy. (g) Water surface freezing. (h) Rain. (The original image, TRCAM-Unet, Deeplab, PSPNet, and Unet are arranged from left to right).
Figure 16.
Comparison of prediction effects of different network models. (a) Low light level. (b) Haze. (c) Snow. (d) Tyndall effect. (e) Camera shake. (f) Wavy. (g) Water surface freezing. (h) Rain. (The original image, TRCAM-Unet, Deeplab, PSPNet, and Unet are arranged from left to right).

Figure 17.
Semantic segmentation effect details display. (a) Low light detail display. (b) Rain block detail display.
Figure 17.
Semantic segmentation effect details display. (a) Low light detail display. (b) Rain block detail display.

Figure 18.
Schematic diagram of marker selection.

Figure 19.
Detection results of water level without water gauge in complex and harsh environment. (a) Wavy, (b) rain, (c) fog, (d) shadow, and (e) Tyndall effect.
Figure 19.
Detection results of water level without water gauge in complex and harsh environment. (a) Wavy, (b) rain, (c) fog, (d) shadow, and (e) Tyndall effect.

Figure 20.
Overall monitoring results of water level in a reservoir (22 March 2022–8 April 2022).

Figure 21.
Detection results of water level without water gauge in complex and harsh environment.

Figure 22.
Overall monitoring results of water level in a reservoir. (22 March 2022–8 April 2022).


Table 1.
Test results of different target detection algorithms on COCO dataset.
| Evaluation Index | Faster-RCNN | SSD | YOLOv3 | YOLOv4 | YOLOv5 |
|---|---|---|---|---|---|
| mAP (%) | 59.1 | 48.5 | 55.3 | 65.7 | 69.6 |
| Frames per second | - | 22 | 35 | 33 | 40 |
Table 2.
Number of model participants.
| Algorithm | Layer Number | Parameters | Giga Floating Point Operations per Second |
|---|---|---|---|
| The original YOLOv5 | 283 | 6.74 M | 16.5 |
| Method used in this study | 252 | 6.36 M | 15.4 |
Table 3.
Water level line detection data statistics.
| Environment | Photo Count | YOLOv5 | YOLOv5 | Improved YOLOv5 | Improved YOLOv5 | YOLOv5-K | YOLOv5-K | Improved YOLOv5-K | Improved YOLOv5-K |
|---|---|---|---|---|---|---|---|---|---|
| daytime | 104 | 95.4% | 99.3% | 97.5% | 99.6% | 95.4% | 99.3% | 97.5% | 99.6% |
| night | 60 | 95.0% | 98.9% | 96.3% | 99.1% | 95.7% | 99.2% | 97.6% | 99.4% |
| rain | 37 | 94.4% | 98.5% | 96.2% | 98.8% | 95.5% | 98.8% | 97.1% | 99.0% |
| fog | 35 | 94.4% | 98.3% | 95.4% | 98.5% | 94.8% | 98.6% | 96.6% | 98.8% |
| sheltered | 50 | 95.0% | 98.9% | 97.4% | 99.4% | 96.0% | 99.0% | 97.4% | 99.4% |
| wavy | 58 | 95.2% | 99.1% | 97.6% | 99.6% | 96.5% | 99.1% | 97.6% | 99.6% |
| flotage | 60 | 94.7% | 98.6% | 97.4% | 99.1% | 96.2% | 98.9% | 97.4% | 99.1% |
| snow | 49 | 94.5% | 98.4% | 95.9% | 98.6% | 94.9% | 98.5% | 96.7% | 98.9% |
| Tyndall | 47 | 94.6% | 98.3% | 95.5% | 98.6% | 95.0% | 98.6% | 96.9% | 99.0% |
| average | 94.9% | 98.8% | 96.6% | 99.0% | 95.5% | 98.9% | 97.3% | 99.3% |
Table 4.
Hardware and software parameters.
| Type | Parameter |
|---|---|
| CPU | Intel Xeon Gold 5218 R CPU |
| GPU | Nvidia Quadro RTX6000 |
| RAM | 256 GB |
| VRAM | 24 GB |
| Operating system | Windows 10 |
| Cuda | 11.3 |
| Deep learning framework | Pytorch1.7.1 |
| Language | Python 3.8 |
| Other key libraries | Numpy 1.92.2, Pillow 8.2.0 |
Table 5.
Ablation experiments.
| Structure | 1 | 2 | 3 | 4 | 5 |
|---|---|---|---|---|---|
| Unet | ◎ | ◎ | ◎ | ◎ | ◎ |
| Full connection | ◎ | ||||
| Transformer | ◎ | ◎ | ◎ | ||
| Residual attention | ◎ | ◎ | ◎ | ||
| MPA/% | 98.12 | 99.21 | 99.32 | 99.39 | 99.42 |
| MIOU/% | 96.09 | 98.45 | 98.64 | 98.79 | 98.84 |
| Parameters/106 | 23.84 | 19.32 | 23.88 | 19.35 | 16.48 |
Table 6.
Semantic segmentation results of each model with water level monitoring results.
| TRCAM-Unet | Deeplabv3 | Unet | Pspnet | |
|---|---|---|---|---|
| MIOU/% | 98.84 | 97.35 | 96.09 | 97.87 |
| MPA/% | 99.42 | 98.67 | 98.12 | 98.96 |
| MLD/m | 9.717 × 10⁻³ | 4.915 × 10⁻² | 4.405 × 10⁻² | 4.279 × 10⁻² |
| Parameters/×106 | 16.48 | 2.76 | 23.84 | 2.45 |
Table 7.
Real-time processing capabilities of different models.
| Model | Frames per Second (FPS) |
|---|---|
| Improved YOLOv5 | 48 |
| TRCAM-Unet | 31 |
Table 8.
Comparison of the methods proposed in this study.
| Methodology | Applicable Scenarios | Advantages | Disadvantages |
|---|---|---|---|
| A method of water level detection without a water stage gage by integrating improved YOLOv5 and Kalman filtering principle | Scenarios of water level detection without a water stage gage with gentle water surface | Small number of model parameters, thus facilitating mobile deployment | Limited suitable scenarios |
| A method for water level detection without a water stage gage based on TRCAM-Unet | All water level detection scenarios without dipstick | Higher compatibility for all scenarios | Higher number of model participants |
Disclaimer/Publisher’s Note: The statements, opinions and data contained in all publications are solely those of the individual author(s) and contributor(s) and not of MDPI and/or the editor(s). MDPI and/or the editor(s) disclaim responsibility for any injury to people or property resulting from any ideas, methods, instructions or products referred to in the content. |
© 2024 by the authors. Licensee MDPI, Basel, Switzerland. This article is an open access article distributed under the terms and conditions of the Creative Commons Attribution (CC BY) license (https://creativecommons.org/licenses/by/4.0/).
Share and Cite
MDPI and ACS Style
Sun, C.; Wei, Y.; Wang, W.; Wu, Z.; Li, Y. Water Level Inversion Detection Method for Water Level Images without a Scale in Complex Environments. Water 2024, 16, 1176. https://doi.org/10.3390/w16081176
AMA Style
Sun C, Wei Y, Wang W, Wu Z, Li Y. Water Level Inversion Detection Method for Water Level Images without a Scale in Complex Environments. Water. 2024; 16(8):1176. https://doi.org/10.3390/w16081176
Chicago/Turabian StyleSun, Chuanmeng, Yu Wei, Wenbo Wang, Zhibo Wu, and Yong Li. 2024. "Water Level Inversion Detection Method for Water Level Images without a Scale in Complex Environments" Water 16, no. 8: 1176. https://doi.org/10.3390/w16081176
Note that from the first issue of 2016, this journal uses article numbers instead of page numbers. See further details here.