


Water Budget for Lake Trafford, a Natural Subtropical Lake in South Florida: An Example of Enhanced Groundwater Influx in a Subtropical Lake Subsequent to Organic Sediment Dredging
 , ,
, ,
Abstract
:1. Introduction
2. Materials and Methods
2.1. Hydrogeology of Lake Trafford
2.2. Measurement of the Lake Bathymetry
2.3. Sediment and Floc Accumulation in Lake Trafford
2.4. Measured Components of the Lake Trafford Water Budget
2.5. Measurement of Groundwater Fluxes in and out of the Lake
2.6. Measurement of Surface Water Influx from Canals
2.7. Measurement of Rainfall into the Lake and Estimation of Evapotranspiration
2.8. Change in Storage
2.9. Final Water Budget
3. Results
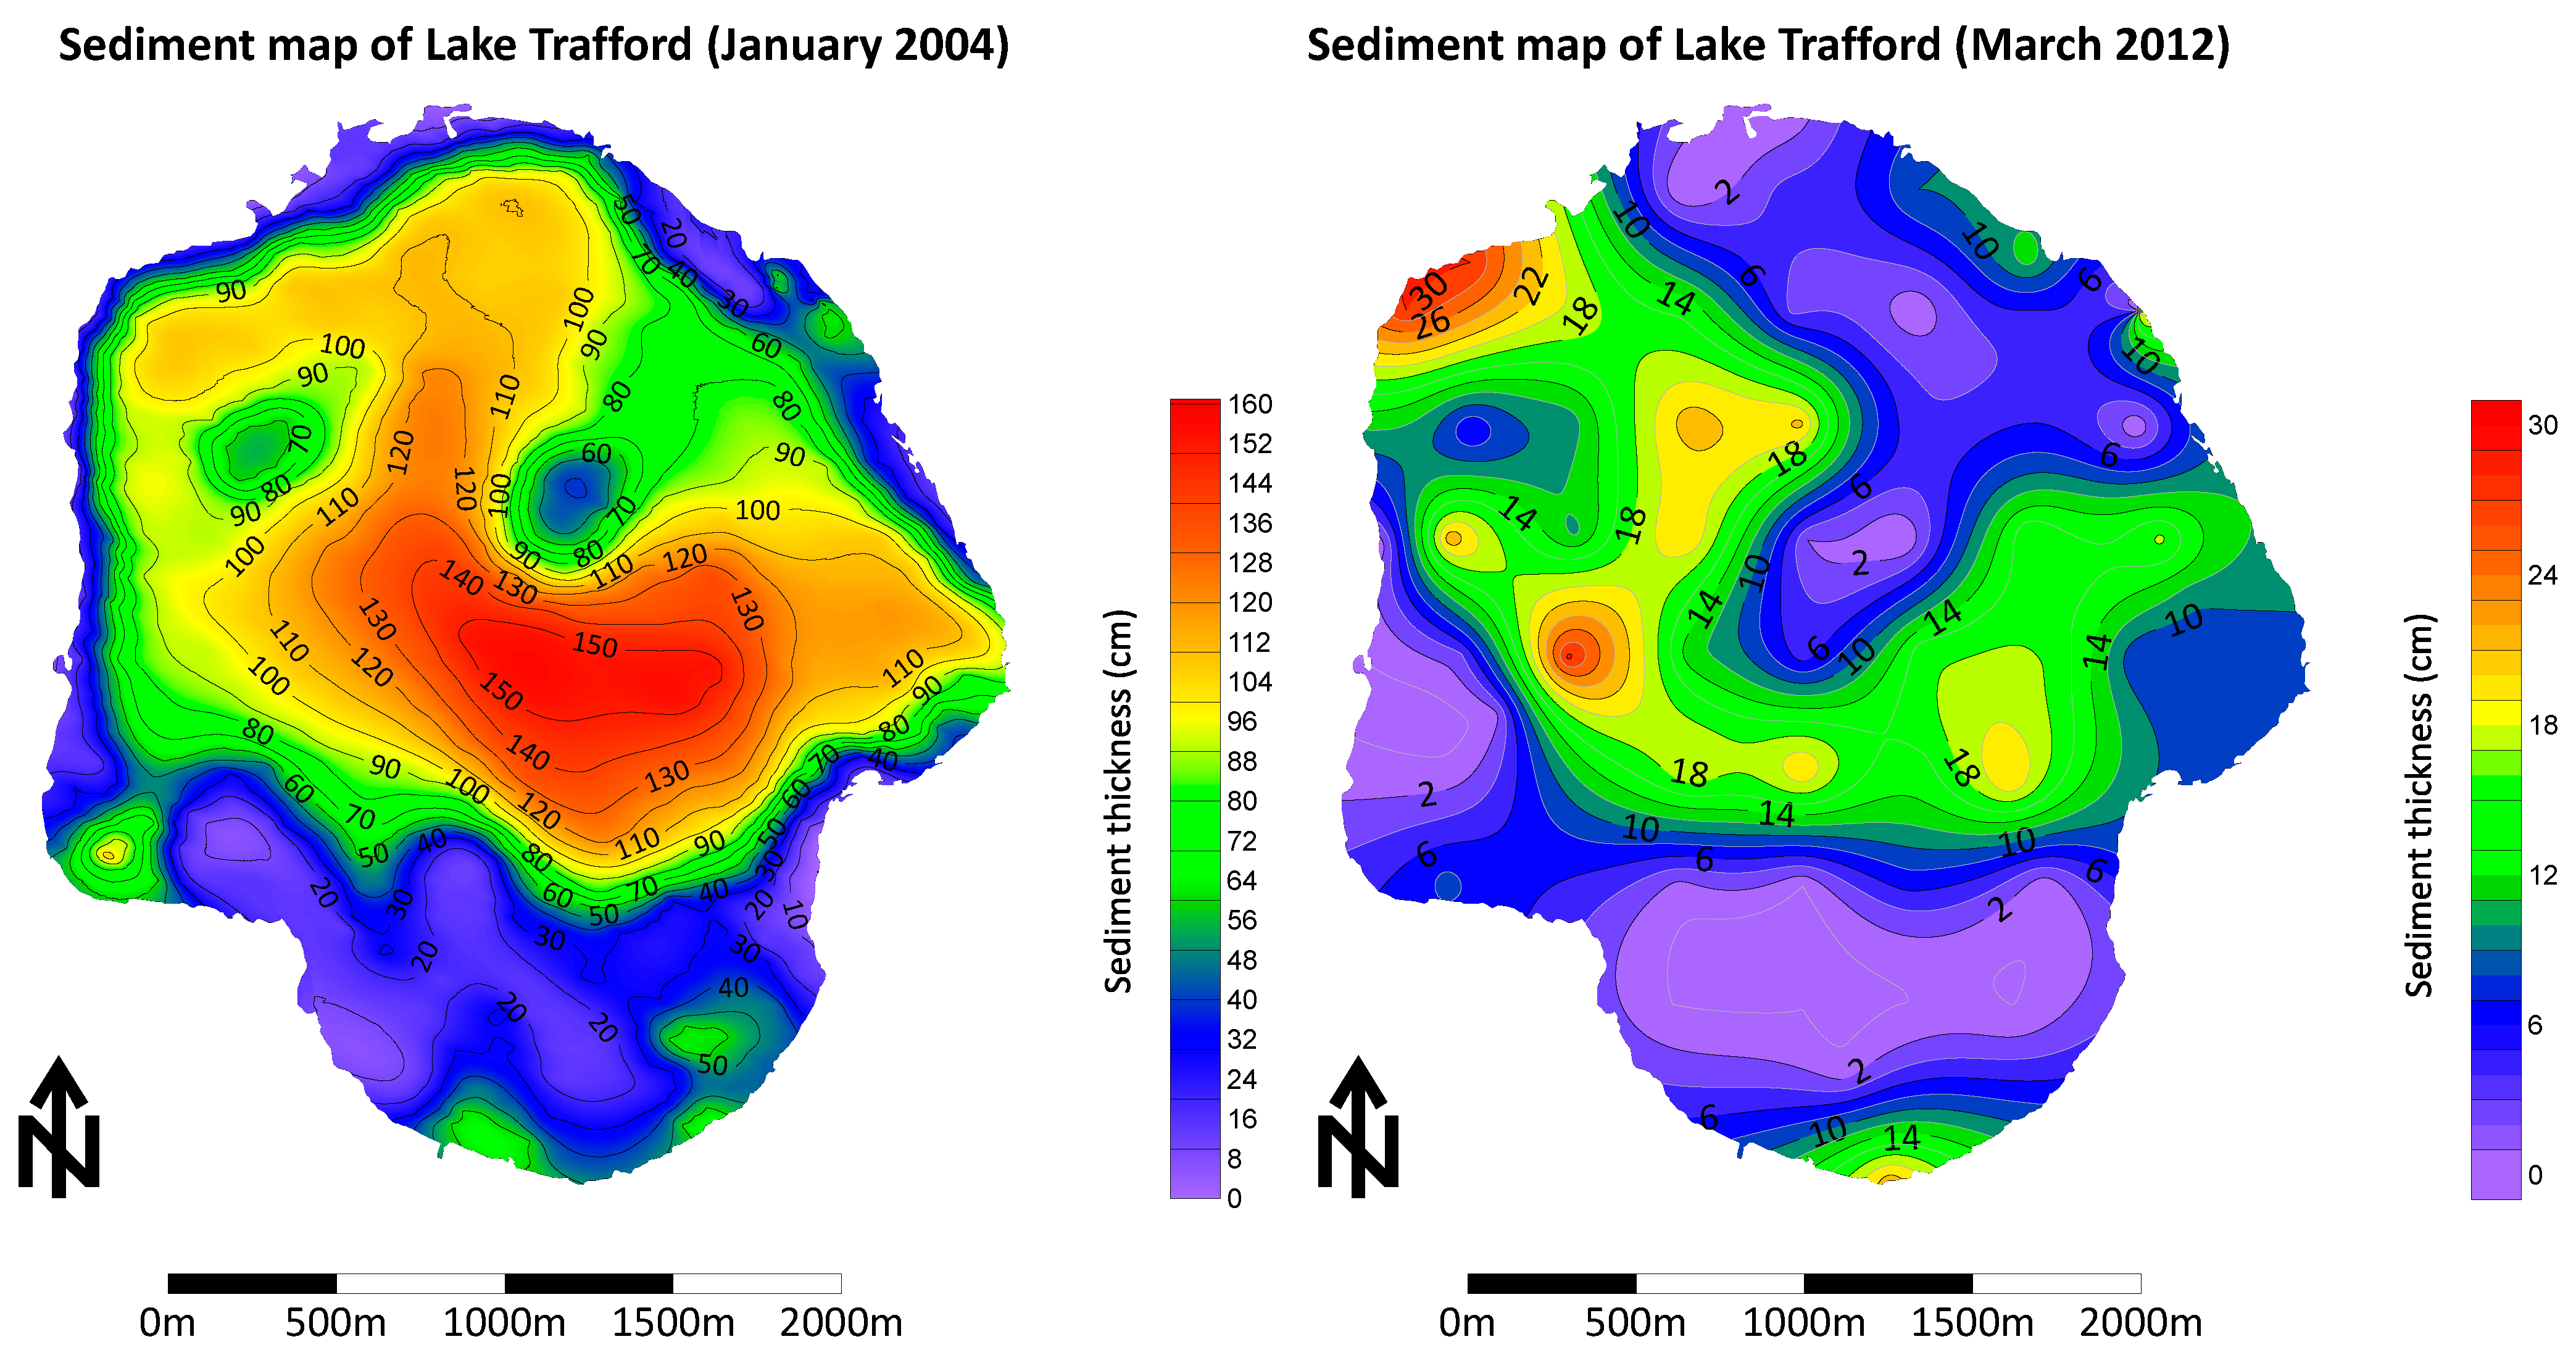
3.1. Bathymetry
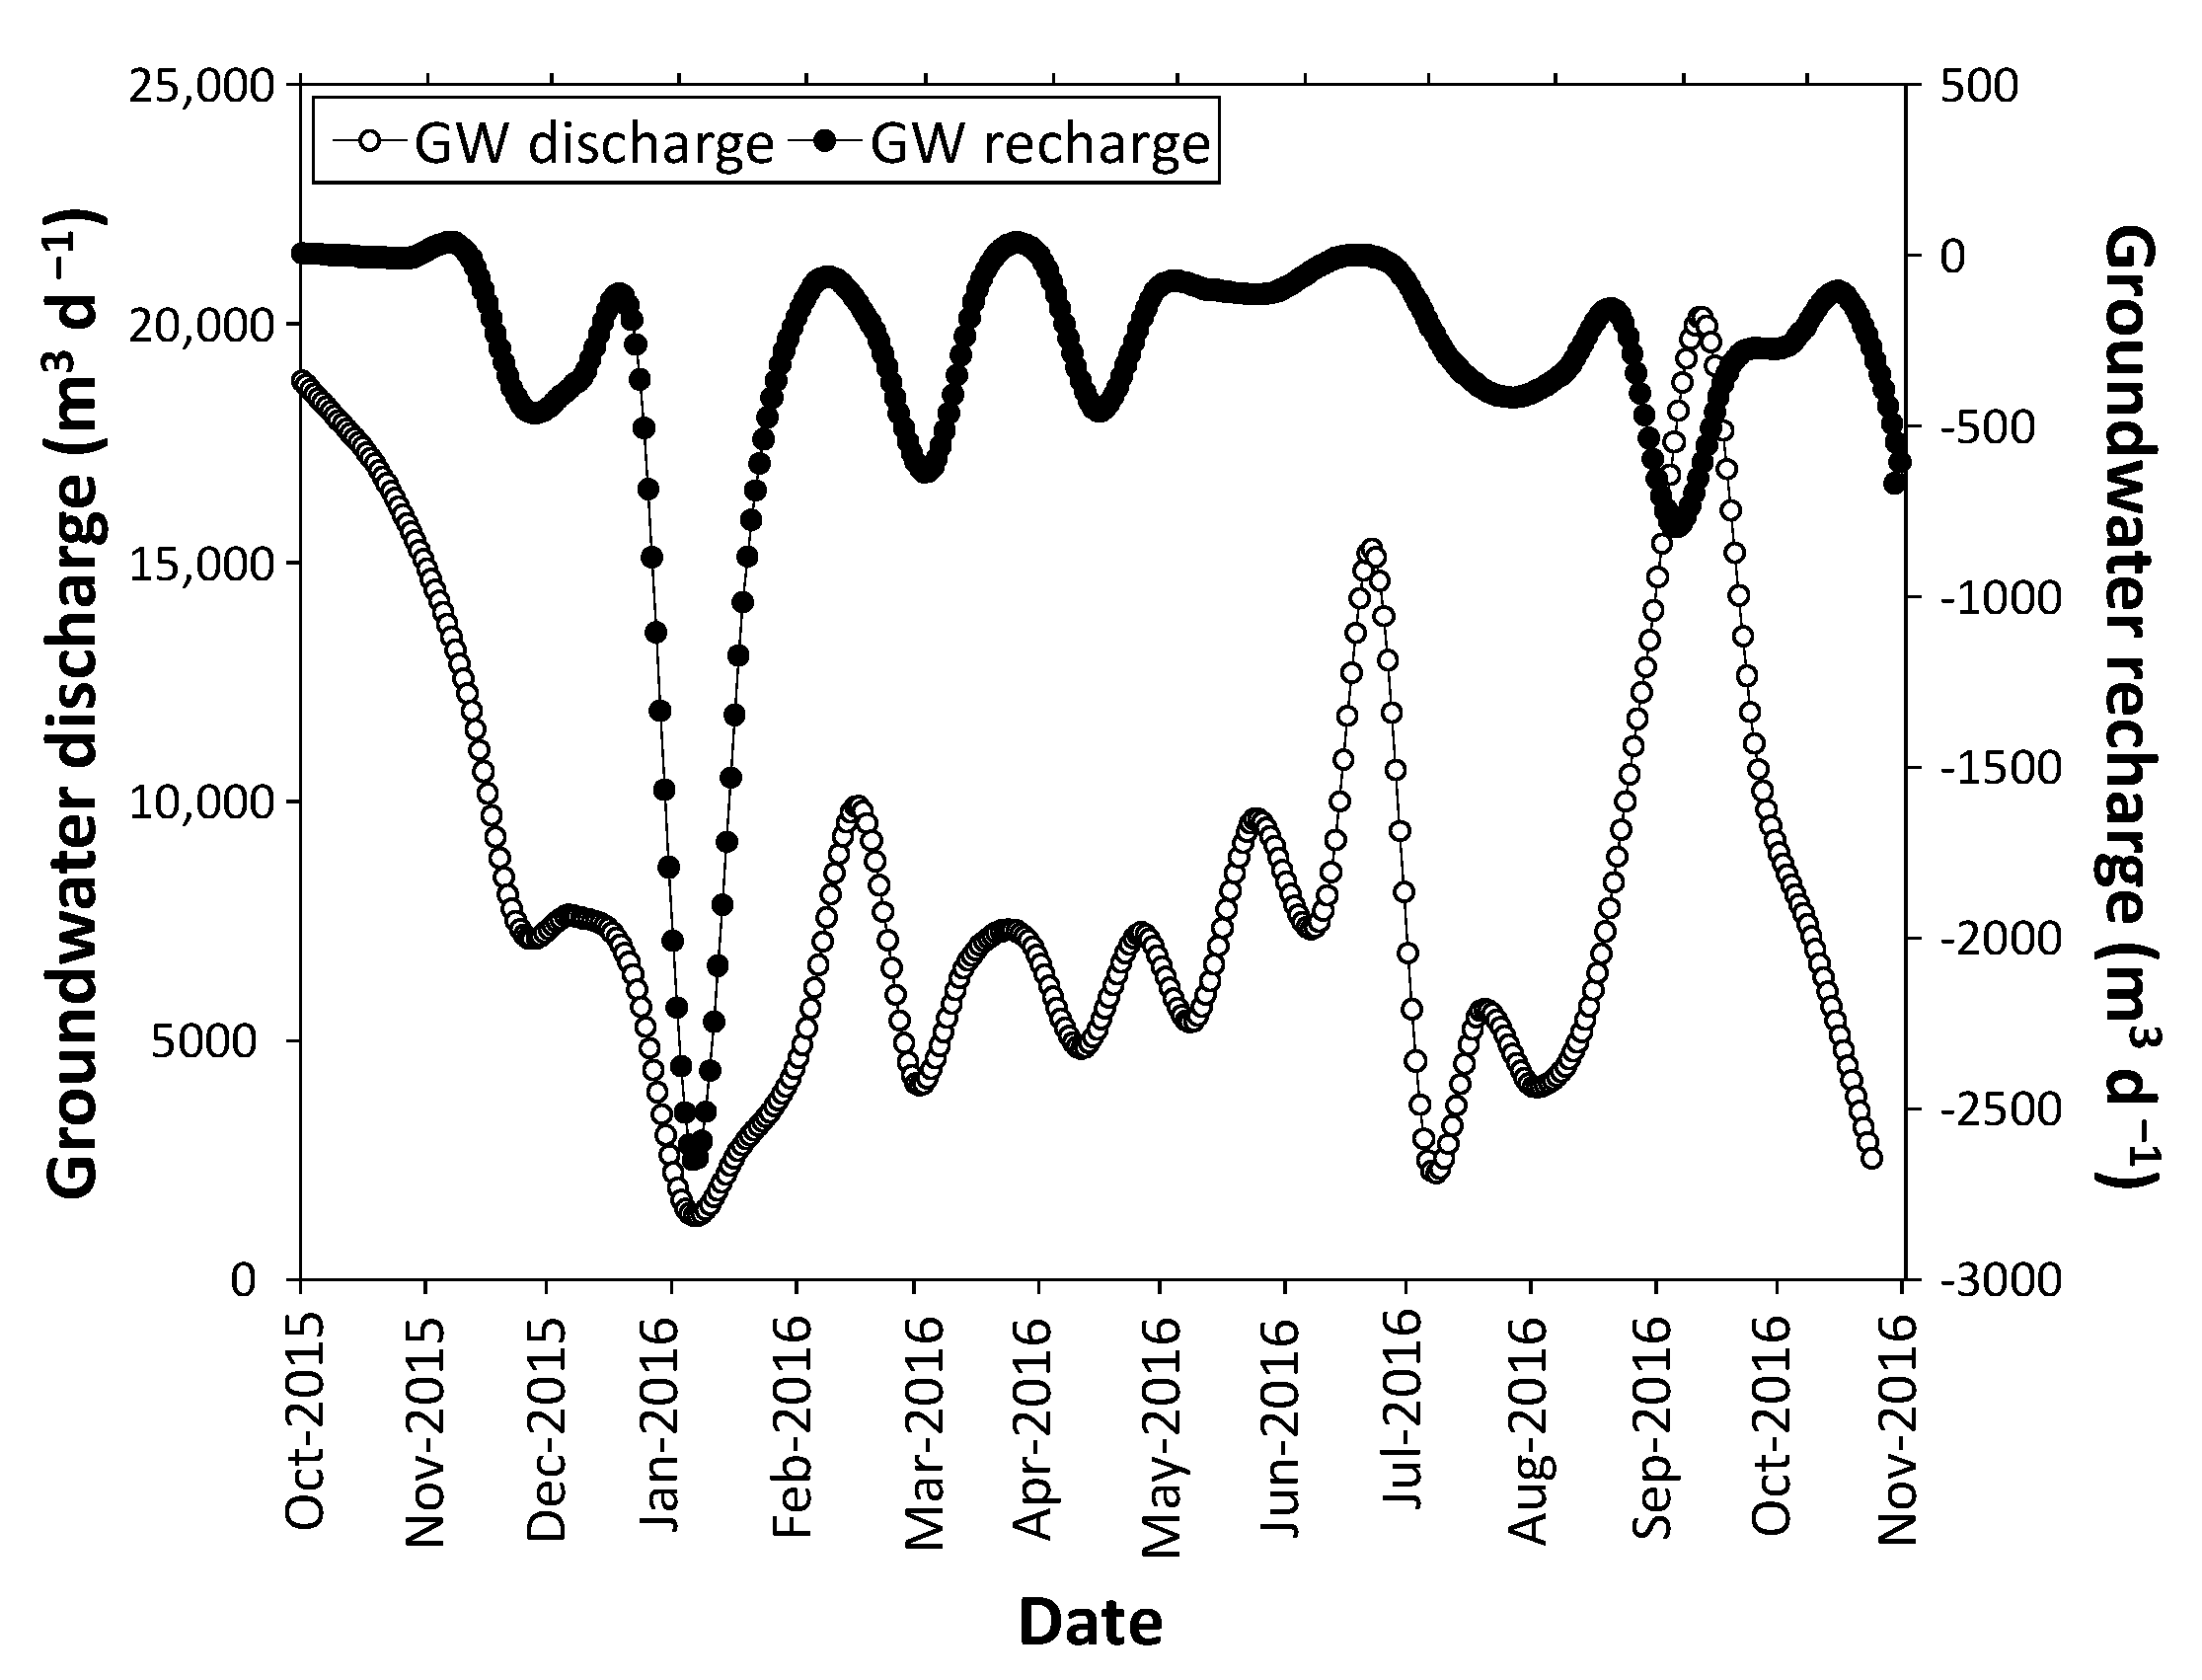
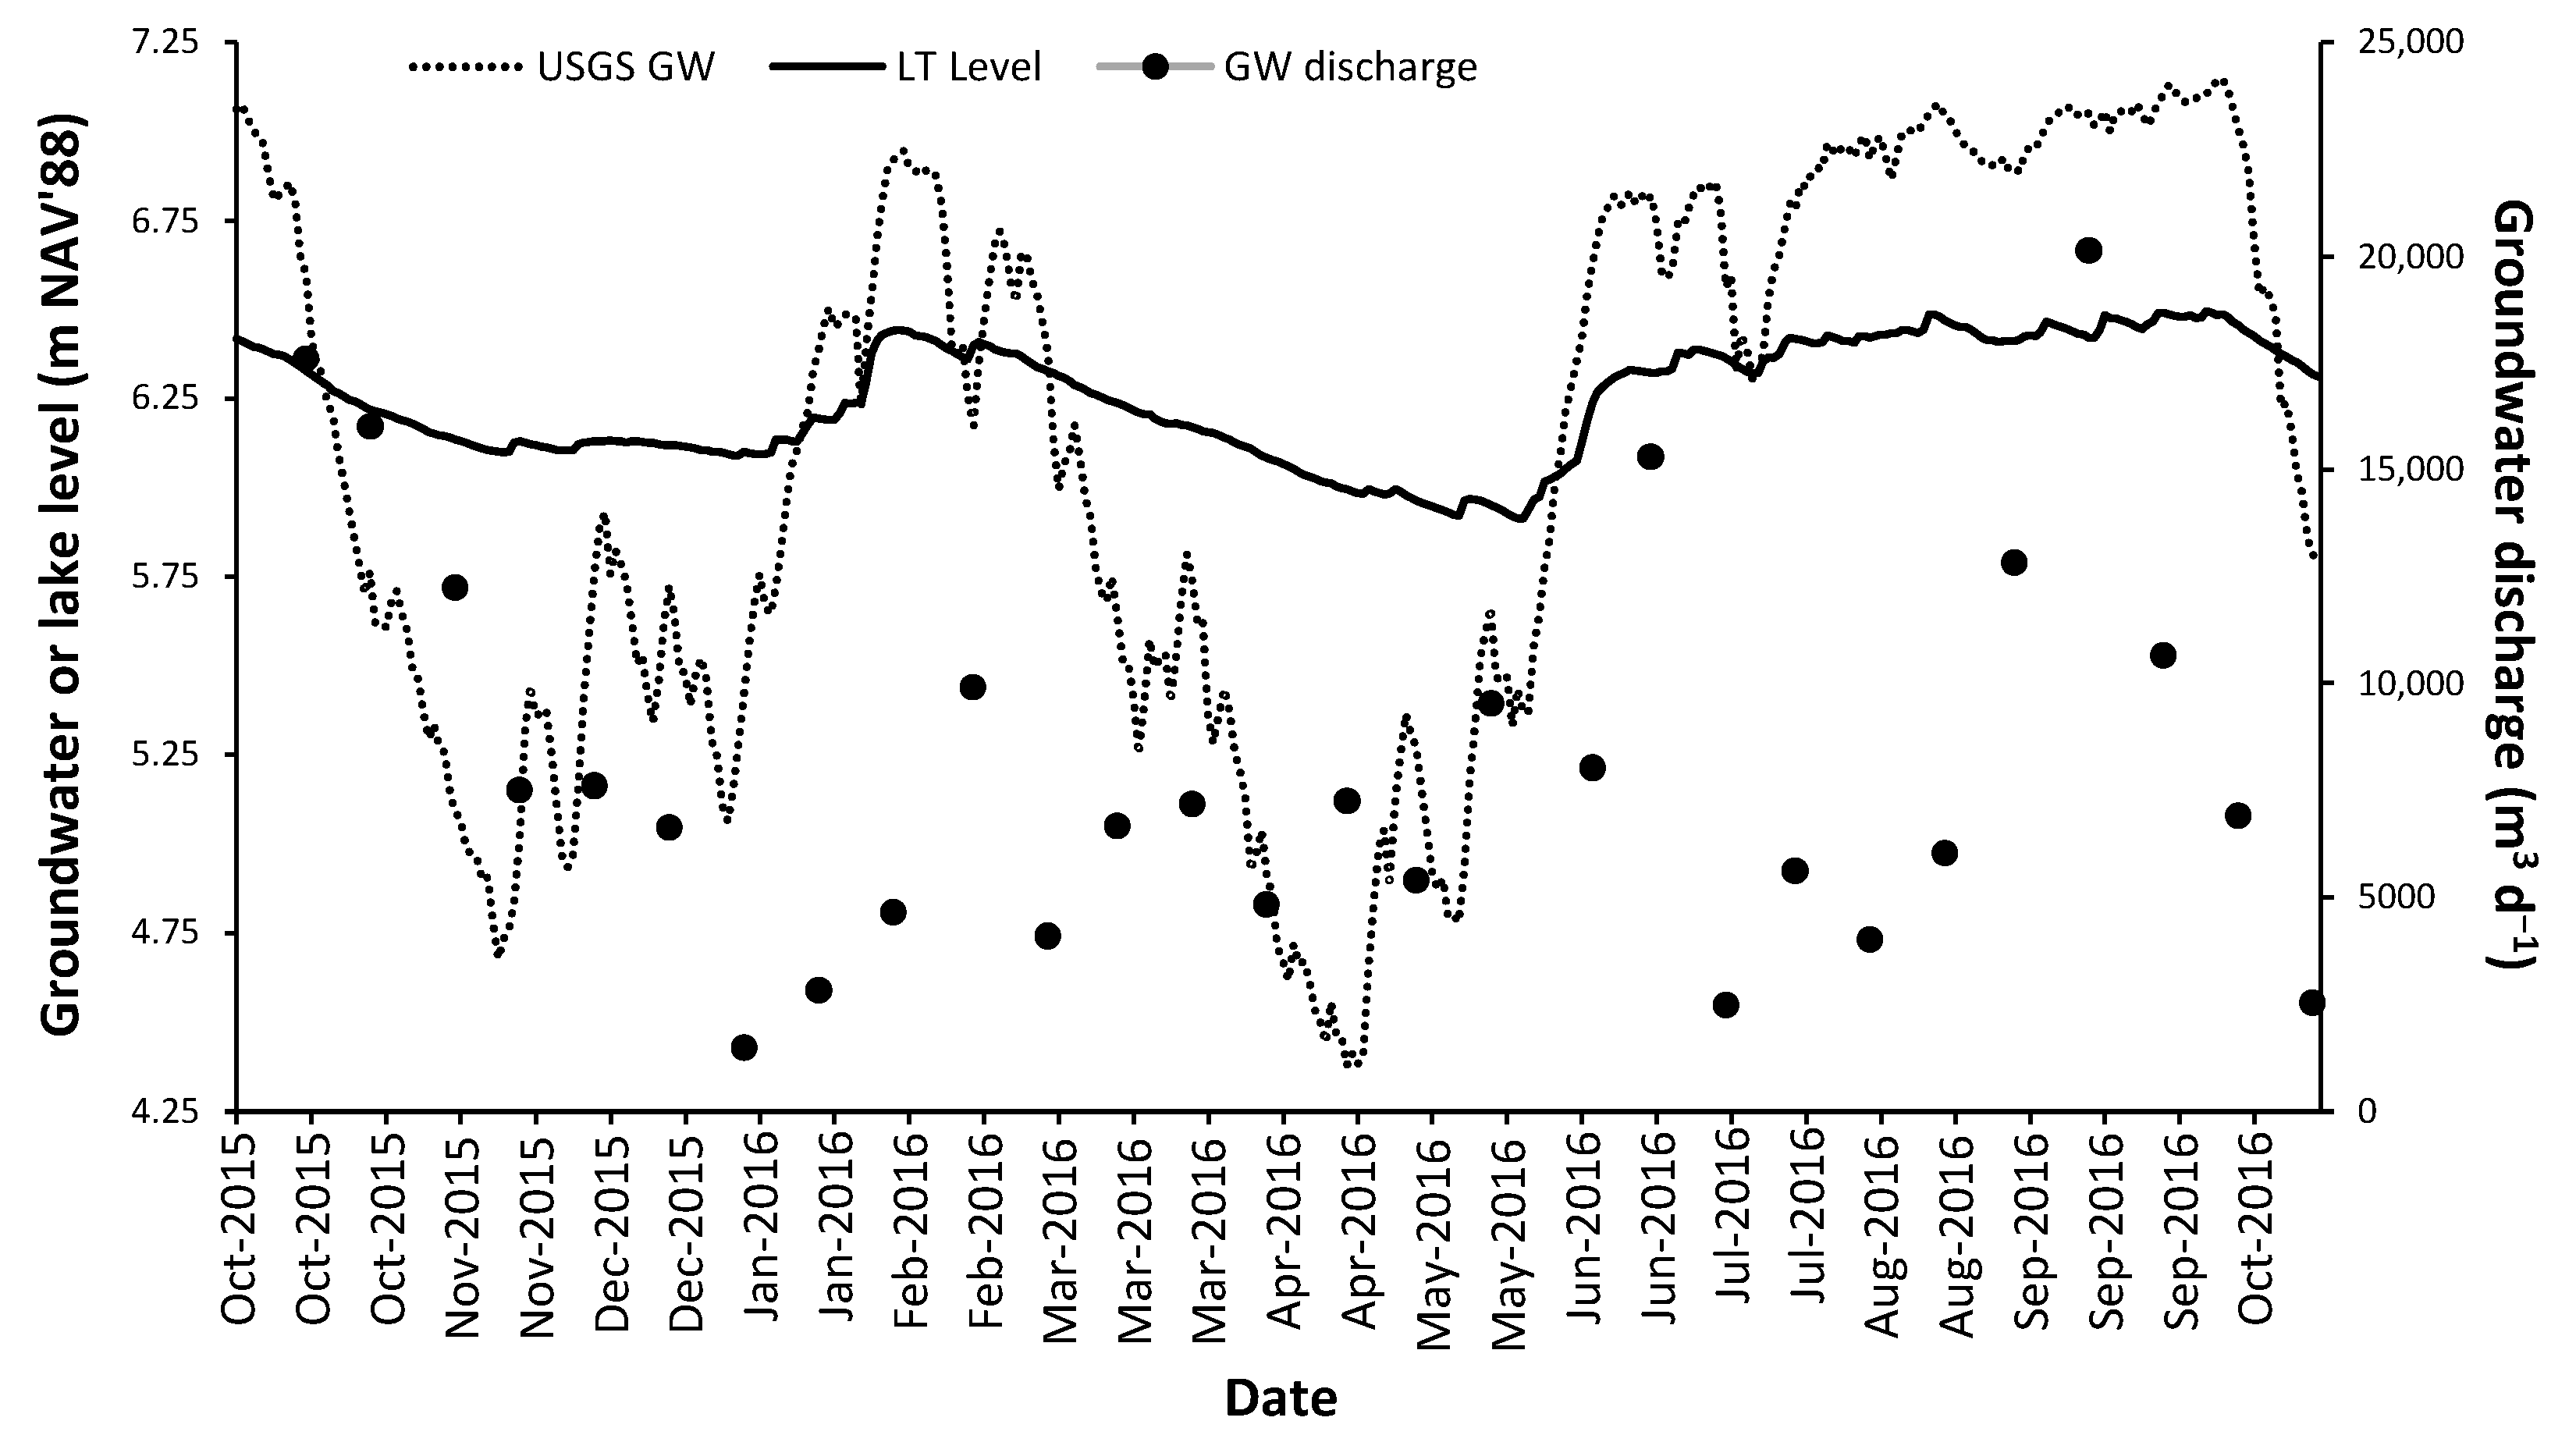
3.2. Groundwater Inflow
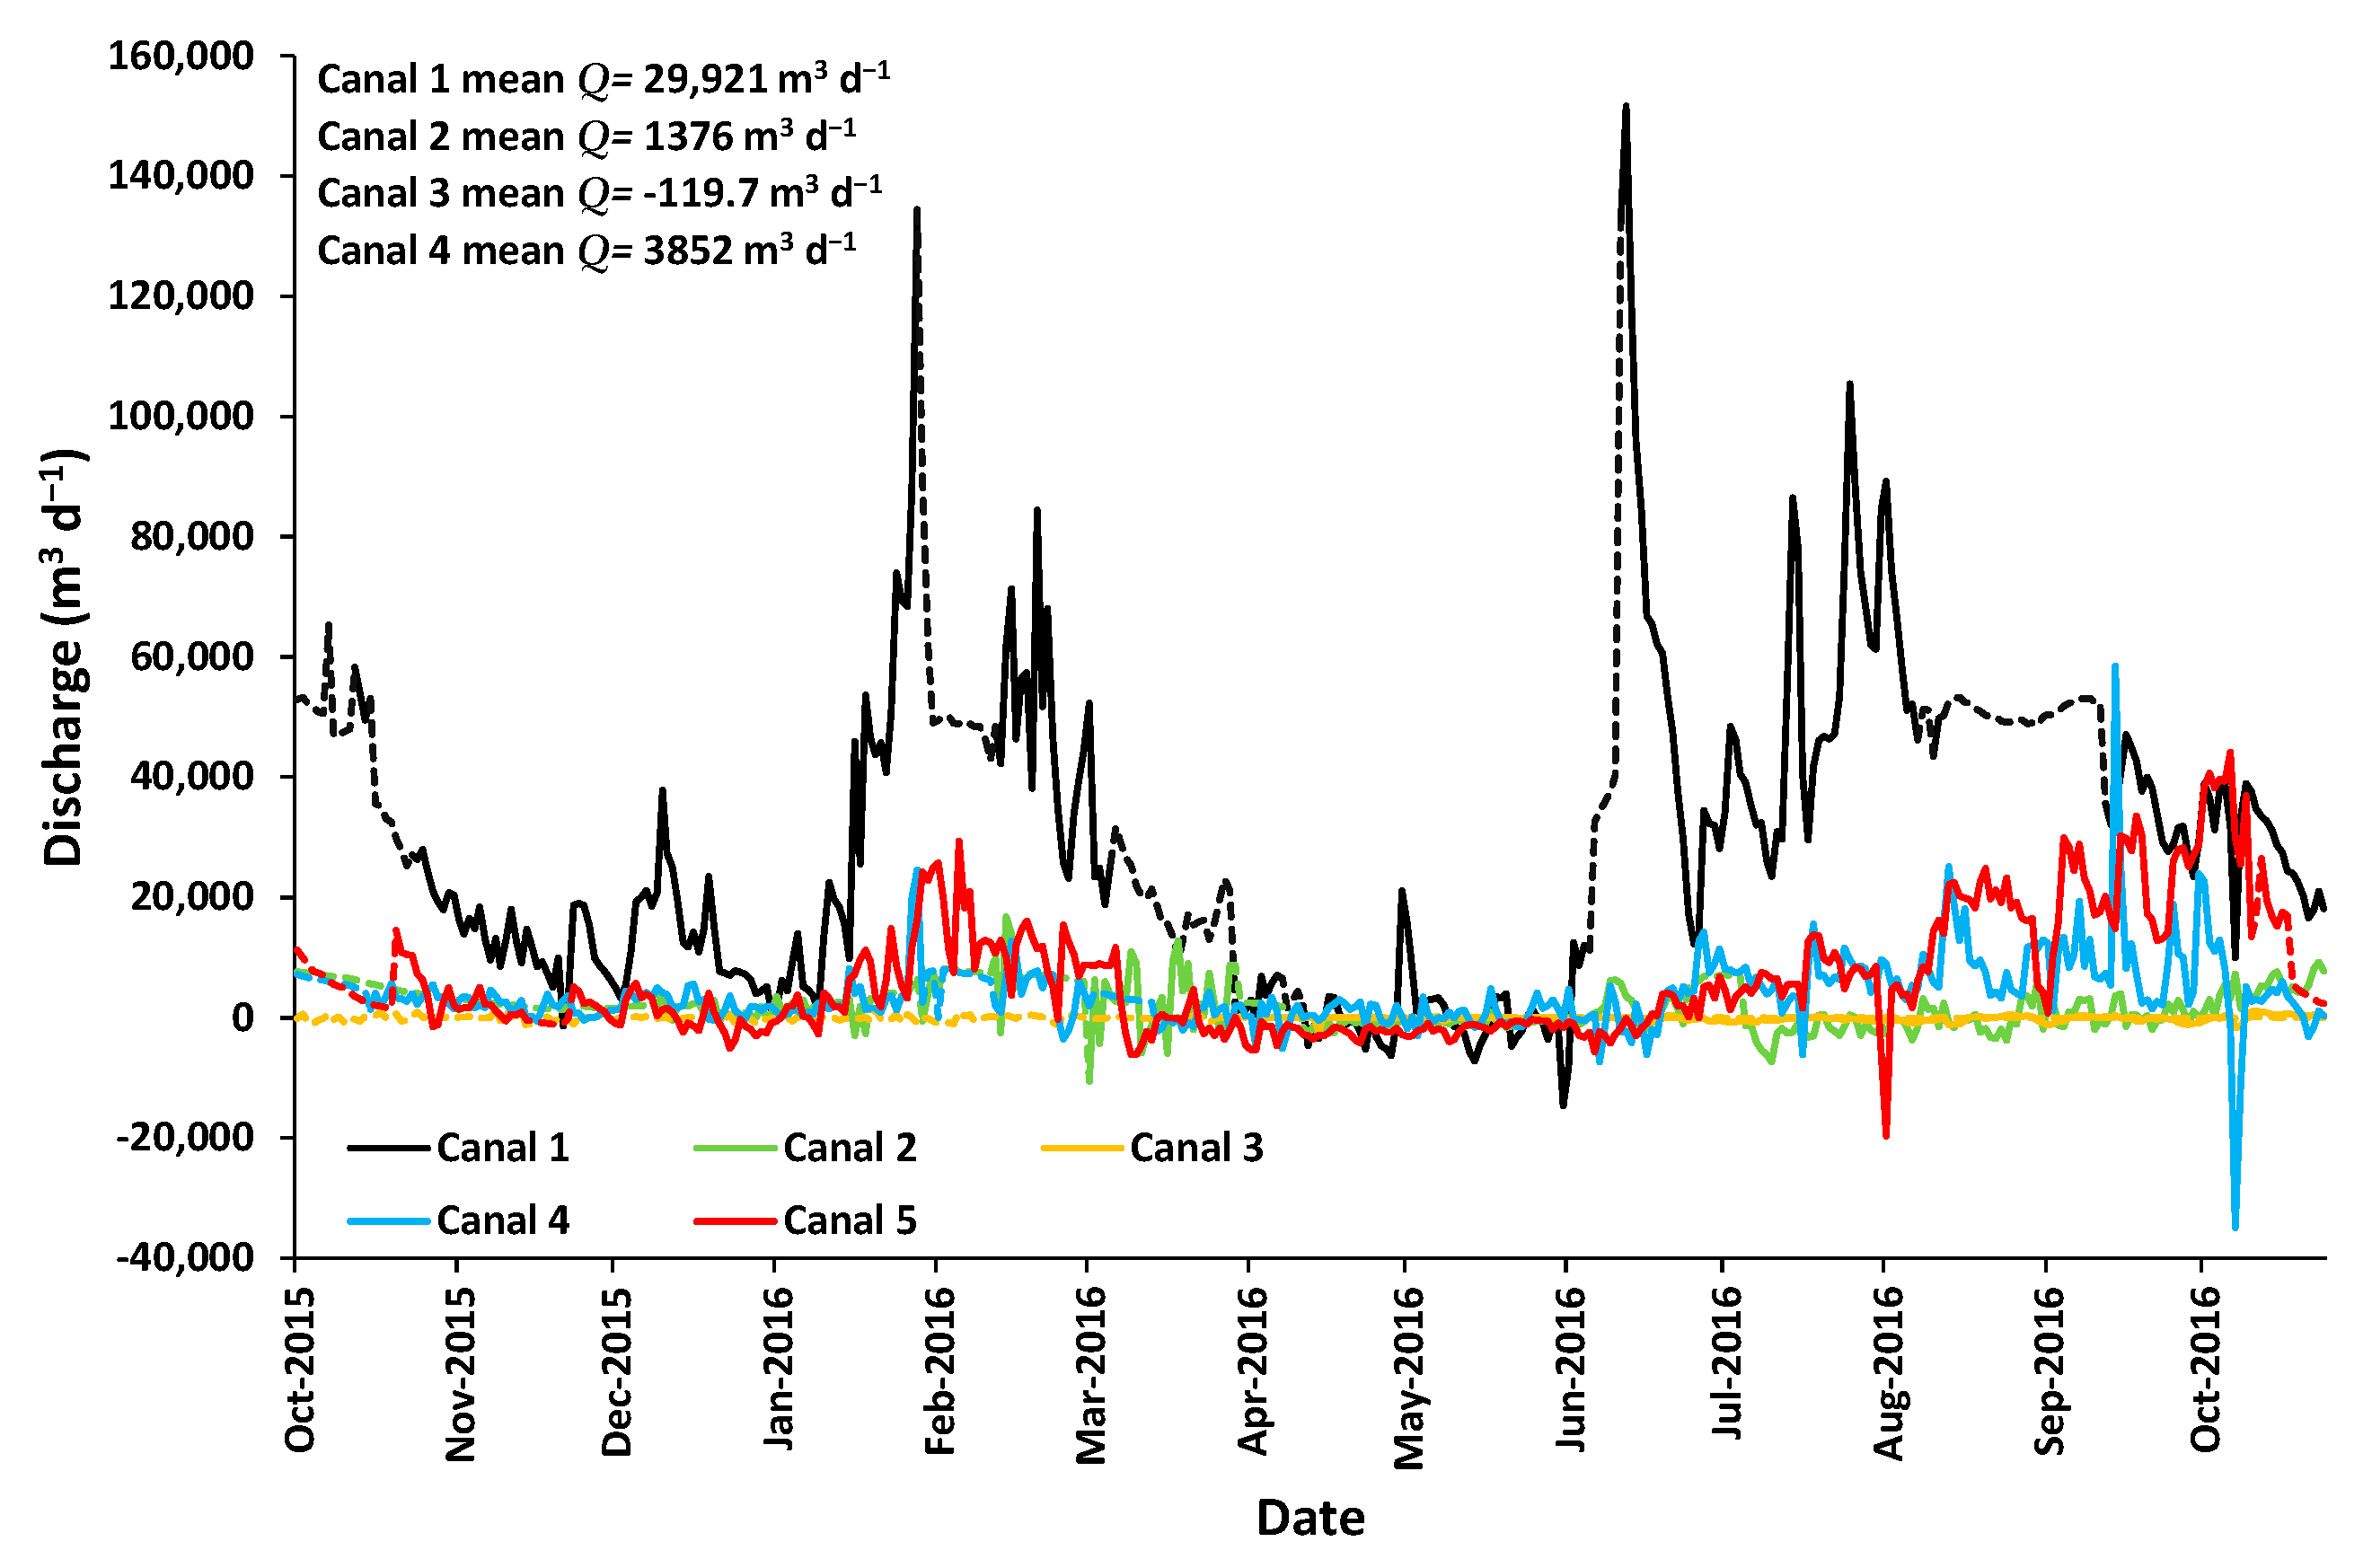
3.3. Surface Water Inflow
3.4. Meteorological Data—Rainfall, Evapotranspiration, and Change in Storage
3.5. Water Budget
3.6. Organic Sediment Removal
4. Discussion
4.1. Influence of Groundwater Flow
4.2. Usage of Groundwater Seepage Meters
4.3. Canal Influence
4.4. Rainfall
4.5. Water Budget
4.6. Future Study
5. Conclusions
Supplementary Materials
Author Contributions
Funding
Data Availability Statement
Acknowledgments
Conflicts of Interest
References
- Carpenter, S.R. Submersed vegetation: An internal factor in lake ecosystem succession. Am. Nat. 1981, 118, 372–383. [Google Scholar] [CrossRef]
- Carpenter, S.R.; Caraco, N.F.; Correll, D.L.; Howarth, R.W.; Sharpley, A.N.; Smith, V.H. Nonpoint pollution of surface waters with phosphorus and nitrogen. Ecol. Appl. 1998, 8, 559–568. [Google Scholar] [CrossRef]
- Schindler, D.W. Recent advances in the understanding and management of eutrophication. Limnol. Oceanogr. 2006, 51, 356–363. [Google Scholar] [CrossRef]
- Pearl, H.W. Coastal eutrophication in relation to atmospheric nitrogen deposition: Current perspectives. Ophelia 1995, 41, 237–259. [Google Scholar] [CrossRef]
- Smith, S.V.; Swaney, D.P.; Talaue-Mcmanus, L.; Bartley, J.D.; Sandhei, P.T.; McLaughlin, C.J.; Dupra, V.C.; Crossland, C.J.; Buddemeier, R.W.; Maxwell, B.A.; et al. Humans, hydrology, and the distribution of inorganic nutrient loading to the ocean. BioScience 2003, 53, 235–245. [Google Scholar] [CrossRef]
- Dodds, W.K. Trophic state, eutrophication and nutrient criteria in streams. Trends Ecol. Evol. 2007, 22, 669–676. [Google Scholar] [CrossRef] [PubMed]
- Scheffer, M.; Hosper, S.H.; Meijer, M.L.; Moss, B.; Jeppesen, E. Alternative equilibria in shallow lakes. Trends Ecol. Evol. 1993, 8, 275–279. [Google Scholar] [CrossRef] [PubMed]
- Art, H.W. A Dictionary of Ecology and Environmental Science, 1st ed.; Henry Holt and Company: New York, NY, USA, 1993. [Google Scholar]
- Nixon, S.W. Eutrophication and the macroscope. Hydrobiologia 2009, 629, 5–19. [Google Scholar] [CrossRef]
- Hutchinson, G.E. Eutrophication. The scientific background of a contemporary practical problem. Am. Sci. 1973, 61, 269–279. [Google Scholar]
- U. S. Environmental Protection Agency (U.S.E.P.A.). Summary of the Clean Water Act of 1972. 33 U.S.C. §1251 et seq. 1972. Available online: https://www.epa.gov/laws-regulations/summary-clean-water-act (accessed on 20 March 2023).
- U. S. Environmental Protection Agency (U.S.E.P.A.). National Water Quality Inventory; U. S. Environmental Protection Agency: Washington, DC, USA, 2017. Available online: https://www.epa.gov/sites/default/files/2017-12/documents/305brtc_finalowow_08302017.pdf (accessed on 20 March 2023).
- Schindler, D.W. The dilemma of controlling cultural eutrophication of lakes. Proc. R. Soc. B Biol. Sci. 2012, 279, 4322–4333. [Google Scholar] [CrossRef]
- Evans, W.L., III. Lake Hydrology: An Introduction to Lake Mass Balance, 1st ed.; Johns Hopkins University Press: Baltimore, MD, USA, 2021. [Google Scholar]
- Mitsch, W.J.; Dorage, C.L.; Wiemhoff, J.R. Ecosystem dynamics and a phosphorus budget of an alluvial cypress swamp in southern Illinois. Ecology 1979, 60, 1116–1124. [Google Scholar] [CrossRef]
- Grubbs, J.W. Evaluation of Ground-Water Flow and Hydrologic Budget of Lake Five-O, a Seepage Lake in Northwestern Florida; Water-Resources Investigations Report 94-4145; U.S. Geological Survey: Tallahassee, FL, USA, 1995. [CrossRef]
- Swancar, A.; Lee, T.M.; O’Hare, T.M. Hydrogeologic Setting, Water Budget, and Preliminary Analysis of Ground-Water Exchange at Lake Starr, a Seepage Lake in Polk County, Florida; Water-Resources Investigation Report No. 2000-4030; U. S. Geological Survey: Tallahassee, FL, USA, 2000. [CrossRef]
- Kirk, J.A.; Wise, W.R.; Delfino, J.J. Water budget and cost-effectiveness analysis of wetland restoration alternatives: A case study of Levy Prairie, Alachua County, Florida. Ecol. Eng. 2004, 22, 43–60. [Google Scholar] [CrossRef]
- Ceilley, D.W.; Thomas, S.; Everham, E.M., III. Lake Trafford Management Action Plan. Lake Trafford Management Action Team; Prepared for the South Florida Water Management District (SFWMD) Contract E: West Palm Beach, FL, USA, 2013. [Google Scholar]
- Ferlita II, J.A. Ecological Indicators of Restoration Success: Zooplankton as Indicators of Lake Change in a Dredged Southwest Florida Lake. Master’s Thesis, Florida Gulf Coast University, Fort Myers, FL, USA, 2014. [Google Scholar]
- Wallace, K.M. Watershed Delineation in a Flat Landscape with Competing Topographic and Hydraulic Controls and Its Implications for TMDL and BMAP Development. Master’s Thesis, University of Florida, Gainesville, FL, USA, 2017. [Google Scholar]
- Kang, W.J.; Gilbert, D. TMDL Report: Nutrient, Un-Ionized Ammonia, and DO TMDLs for Lake Trafford (WBID 3259W); Florida Department of Environmental Protection: Tallahassee, FL, USA, 2008. Available online: https://floridadep.gov/sites/default/files/traffordfinal091208_0.pdf (accessed on 15 January 2024).
- Sutton, D.; Portier, K.M. Density of tubers and turions of Hydrilla in South Florida. J. Aquat. Plant Manag. 1992, 23, 64–67. [Google Scholar]
- Haller, W.T.; Sutton, D.L. Community structure and competition between Hydrilla and Vallisneria. Hyacinth Control. J. 1975, 13, 48–50. [Google Scholar]
- Canfield, D.E.; Langeland, K.A.; Linda, S.B.; Haller, W.T. Relations between water transparency and maximum depth of macrophyte colonization in lakes. J. Aquat. Plant Manag. 1985, 23, 25–28. [Google Scholar]
- Søndergaard, M.; Jensen, J.P.; Jeppesen, E. Role of sediment and internal loading of phosphorus in shallow lakes. Hydrobiologia 2003, 506, 135–145. [Google Scholar] [CrossRef]
- Scheffer, M.; Carpenter, S.; Foley, J.A.; Folke, C.; Walker, B. Catastrophic shifts in ecosystems. Nature 2001, 413, 591–596. [Google Scholar] [CrossRef]
- ART Engineering. Lake Trafford Critical Restoration Project—Aquascan Radar Survey Report. Consultant’s Report to Collier County, FL, USA, 2004. Available online: https://www.art-engineering.com/Projects/Lake-Trafford-Report.pdf (accessed on 15 January 2024).
- Zhong, J.; Fan, C. Advance in the study on the effectiveness and environmental impact of sediment dredging. J. Lake Sci. 2007, 19, 1–10. [Google Scholar] [CrossRef]
- Harper, H.H. Evaluation of Sediment Impacts on Hydrologic and Nutrient Loadings from Groundwater Seepage to Lake Jesup; Final Consultant’s Report; Environmental Research & Design, Inc.: Orlando, FL, USA, 2013; Available online: http://erd.org/ERD%20Publications/Eval%20of%20Sediment%20Impacts%20on%20Hydrologic-Nutrient%20Loadings%20from%20Groundwater%20Seepage%20to%20Lake%20Jesup-June%202013.pdf (accessed on 10 March 2024).
- Thomas, S.; Everham, E.M., III; Ceilley, D.W.; Lucius, M. Lake Trafford Aquatic Vegetation Monitoring and Mapping; Final Report; Technical Report; South Florida Water Management District: West Palm Beach, FL, USA, 2015.
- Hutchinson, G.E. A Treatise on Limnology, Geography, Physics, and Chemistry; John Wiley & Sons: New York, NY, USA, 1957. [Google Scholar]
- Geddes, E.; Richardson, E.; Dodd, A. Hydrogeological Unit Mapping Update for the Lower West Coast Water Supply Planning Area; Technical Publication WS-35; South Florida Water Management District: West Palm Beach, FL, USA, 2015. Available online: https://www.sfwmd.gov/sites/default/files/documents/ws-35_lwc_hydrogeologic_mapping_083115.pdf (accessed on 10 March 2024).
- Missimer, T.M. Stratigraphic relationships of sediment facies within the Tamiami Formation of Southwest Florida: Proposed intraformational correlations. In The Plio-Pleistocene Stratigraphy and Paleontology of South Florida; Scott, T.M., Allman, W.D., Eds.; Special Publication No. 36; Florida Geological Survey: Tallahassee, FL, USA, 1992; pp. 63–92. [Google Scholar]
- Missimer, T.M. Pliocene stratigraphy of South Florida: Unresolved issues of facies correlation in time. In The Florida Neogene; Scott, T.M., Ed.; Special Publication 37; Florida Geological Survey: Tallahassee, FL, USA, 1993; pp. 33–42. [Google Scholar]
- Bennett, M.W. A Three-Dimensional Finite Difference Ground Water Flow Model of Western Collier County, Florida; Technical Publication 92-04; Hydrogeology Division, Department of Research and Evaluation, South Florida Water Management District: West Palm Beach, FL, USA, 1992. Available online: http://dpanther.fiu.edu/sobek/content/FI/12/09/03/10/00001/FI12090310.pdf (accessed on 10 March 2024).
- Belanger, T.V.; Mikutel, D.F. On the use of seepage meters to estimate groundwater nutrient loading to lakes. J. Am. Water Res. Assoc. 1985, 21, 265–272. [Google Scholar] [CrossRef]
- Rosenberry, D.O.; LaBaugh, J.W.; Hunt, R.J. Use of monitoring wells, portable piezometers, and seepage meters to quantify flow between surface water and ground water. In Field Techniques for Estimating Water Fluxes between Surface Water and Ground water; U. S. Geological Survey Techniques and Methods 4-D2; U.S. Department of the Interior: Reston, VA, USA, 2008. Available online: https://pubs.usgs.gov/tm/04d02/pdf/TM4-D2-chap2.pdf (accessed on 10 March 2024).
- Erickson, D.R. A Study of Littoral Groundwater Seepage at Williams Lake, Minnesota, Using Seepage Meters and Wells. Master’s Thesis, University of Minnesota, St. Paul, MN, USA, 1981. [Google Scholar]
- Shaw, R.D.; Prepas, E.E. Anomalous, short-term influx of water into seepage meters. Limnol. Oceanogr. 1989, 34, 1343–1351. [Google Scholar] [CrossRef]
- Rosenberry, D.O.; Lewandowski, J.; Meinikmann, K.; Nützmann, G. Groundwater—The disregarded component in lake water and nutrient budgets. Part 1: Effects of groundwater on hydrology. Hydrol. Process. 2015, 29, 2895–2921. [Google Scholar] [CrossRef]
- Rosenberry, D.O.; Duque, C.; Lee, D.R. History and evolution of seepage meters for quantifying flow between groundwater and surface water: Part 1—Freshwater settings. Earth-Sci. Rev. 2020, 204, 103167. [Google Scholar] [CrossRef]
- Fryberger, S.G.; Dean, G. Dune forms and wind regime. In A Study of Global Sand Seas; McKee, E., Ed.; U.S. Geological Survey Professional Paper 1052; U.S. Government Printing Office: Washington, DC, USA, 1979; pp. 137–170. [Google Scholar] [CrossRef]
- Gunderson, L.H. Accounting for discrepancies in pan evaporation calculations. Water Resour. Bull. 1989, 25, 573–579. [Google Scholar] [CrossRef]
- Abtew, W.; Obeysekera, J.; Iricanin, N. Pan evaporation and potential evapotranspiration trends in South Florida. Hydrol. Process. 2011, 25, 958–969. [Google Scholar] [CrossRef]
- Jones, F.E. Evaporation of Water with Emphasis on Applications and Measurements; CRC Press: Boca Raton, FL, USA, 1992. [Google Scholar]
- Turc, L. Estimation of irrigation water requirements, potential evapotranspiration: Simplified and updated formula. Ann. Agron. 1961, 12, 13–49. [Google Scholar]
- Harper, H.H. Evaluation of Hydrologic and Nutrient Loadings from Groundwater Seepage to Lake Jesup; Final Consultant’s Report; Environmental Research & Design, Inc.: Orlando, FL, USA, 2013; Available online: http://erd.org/ERD%20Publications/Eval%20of%20Hydrologic-Nutrient%20Loadings%20from%20Groundwater%20Seepage%20to%20Lake%20Jesup-July%202013.pdf (accessed on 10 March 2024).
- Schiffer, D.M. Hydrology of Central Florida Lakes—A Primer; Technical Publication 1137; United States Geological Survey Circular: Tallahassee, FL, USA, 1998. [CrossRef]
- Asbury, C.E. The Role of Groundwater Seepage in Sediment Chemistry and Nutrient Budgets in Mirror Lake, New Hampshire. Ph.D. Dissertation, Cornell University, Ithaca, NY, USA, 1990. [Google Scholar]
- Genereux, D.; Bandopadhyay, I. Numerical investigation of lakebed seepage patterns: Effects of porous medium and lake properties. J. Hydrol. 2001, 241, 286–303. [Google Scholar] [CrossRef]
- Belanger, T.V.; Montgomery, M.T. Seepage meter errors. Limnol. Oceanogr. 1992, 37, 1787–1795. [Google Scholar] [CrossRef]
- Thomas, S.; Lucius, M.A. Groundwater seepage nutrient loading in a recently dug wet detention stormwater pond. Fla. Sci. 2016, 79, 132–146. [Google Scholar]
- South Florida Water Management District (SFWMD), South Florida Water Management District Model (SWIMM), South Florida Water Management District, West Palm Beach, FL, USA, 1995. Available online: https://www.sfwmd.gov/science-data/sfwmm-model (accessed on 10 March 2024).
- Abtew, W. Evaporation estimation for Lake Okeechobee in south Florida. J. Irrig. Drain. Eng. 2001, 127, 140–147. [Google Scholar] [CrossRef]


| Groundwater Site | Meter A (Mean Flux) (L m−2 d−1) | Meter B (L m−2 d−1) | RMSE |
|---|---|---|---|
| 3 | 1.607 | 1.518 | 2.201 |
| 5 | 0.058 | 0.262 | 0.782 |
| 10 | 0.326 | −0.231 | 1.152 |
| 13 | −0.008 | −0.004 | 0.695 |
| 15 | 1.308 | 1.718 | 2.034 |
| Statistic | Lake Volume (m3) | Rainfall Volume (m3 d−1) | Canals (m3 d−1) | GW in (m3 d−1) | GW out (m3 d−1) | ET (m3 d−1) | Net Sheet Flow (m3 d−1) |
|---|---|---|---|---|---|---|---|
| Average | 11,483,262 | 13,325 | 35,066 | 8320 | −333 | 23,544 | −49,052 |
| S.D. | 884,197 | 44,892 | 40,237 | 4600 | 464 | 15,004 | 80,441 |
| Min | 9,792,532 | 0 | −13,508 | 1322 | −2649 | 2522 | −243,249 |
| Max | 13,188,166 | 331,501 | 185,919 | 20,135 | 0 | 70,280 | 355,396 |
Disclaimer/Publisher’s Note: The statements, opinions and data contained in all publications are solely those of the individual author(s) and contributor(s) and not of MDPI and/or the editor(s). MDPI and/or the editor(s) disclaim responsibility for any injury to people or property resulting from any ideas, methods, instructions or products referred to in the content. |
© 2024 by the authors. Licensee MDPI, Basel, Switzerland. This article is an open access article distributed under the terms and conditions of the Creative Commons Attribution (CC BY) license (https://creativecommons.org/licenses/by/4.0/).
Share and Cite
Thomas, S.; Lucius, M.A.; Kim, J.-Y.; Everham, E.M., III; Dettmar, D.L.; Missimer, T.M. Water Budget for Lake Trafford, a Natural Subtropical Lake in South Florida: An Example of Enhanced Groundwater Influx in a Subtropical Lake Subsequent to Organic Sediment Dredging. Water 2024, 16, 1188. https://doi.org/10.3390/w16081188
Thomas S, Lucius MA, Kim J-Y, Everham EM III, Dettmar DL, Missimer TM. Water Budget for Lake Trafford, a Natural Subtropical Lake in South Florida: An Example of Enhanced Groundwater Influx in a Subtropical Lake Subsequent to Organic Sediment Dredging. Water. 2024; 16(8):1188. https://doi.org/10.3390/w16081188
Chicago/Turabian StyleThomas, Serge, Mark A. Lucius, Jong-Yeop Kim, Edwin M. Everham, III, Dana L. Dettmar, and Thomas M. Missimer. 2024. "Water Budget for Lake Trafford, a Natural Subtropical Lake in South Florida: An Example of Enhanced Groundwater Influx in a Subtropical Lake Subsequent to Organic Sediment Dredging" Water 16, no. 8: 1188. https://doi.org/10.3390/w16081188