
A Proposal for Sediment Control Countermeasures in Non-Flowing Mountain Streams
1
MCC Research Institute, Mitsui Consultants Co., Ltd., Osaka 552-0007, Japan
2
Faculty of Engineering, Ritsumeikan University, Kusatsu 525-8577, Japan
3
Faculty of Agriculture, Kyoto University, Kyoto 606-8502, Japan
*
Author to whom correspondence should be addressed.
Water 2024, 16(9), 1197; https://doi.org/10.3390/w16091197
Submission received: 12 March 2024
/
Revised: 20 April 2024
/
Accepted: 22 April 2024
/
Published: 23 April 2024
Abstract
:In Japan, the heavy rain disaster that occurred in July 2018 revealed that about 70% of the streams affected by debris flows that resulted in human casualties were small, steep mountain streams with a catchment area < 0.05 km2. Generally, many streams that are close to residential houses or roads do not have a constant flow of water and are known to pose a high risk of human fatalities when a debris flow occurs. This study aimed to promote sediment control as debris flow countermeasures in non-flowing mountain streams, utilizing secondary manufactured products (permeable debris flow barriers) with excellent constructability, focusing on the mechanism of sediment outflow from the gaps between a permeable debris flow barrier and mountain stream side banks. The necessity and effectiveness of preventative measures based on preliminary experimental results are presented. When impermeable structures were installed at both ends of the permeable debris flow barrier side, compared to using only a permeable debris flow barrier (covering the entire width with permeable debris flow barriers), we found that the capture function improved significantly, achieving a 200% increase in effectiveness.
1. Introduction
Debris flows can lead to disastrous consequences for downstream infrastructure due to their fast-moving nature along valleys [1,2,3]. These flows are massive and highly mobile, posing significant risks to human lives and facilities downstream [4,5,6]. Mitigation structures, such as slit dams [7,8], are commonly strategically installed along the expected flow path to abate such destructive hazards. However, reports from on-site tests of log crib check dams indicate that although these dams may have lower load-carrying capacity compared to concrete check dams, they demonstrate a remarkably high tolerance to debris flow events, as experienced during the East Gate Landslide [9]. In recent years, flexible barriers have been used increasingly to moderate debris flows, debris/rock/snow avalanches, and rock-falls [10,11,12]. In particular, due to the advantages of low construction costs and increased hydraulic continuity, a flexible barrier with wire mesh as an open-type debris flow countermeasure has recently been employed [13,14,15]. This flexible barrier has the advantage of filtering debris materials and inducing deposition by absorbing the dynamic energy of debris flows.
In Japan, during the heavy rain disaster in July 2018, approximately 70% of the streams where human casualties occurred due to debris flows were small, steep mountain streams with a catchment area < 0.05 km2 [16]. Generally, many streams that are close to residential houses or roads do not have a constant water flow and are known to be at a high risk of human fatalities when a debris flow occurs [17,18,19]. Furthermore, the construction of traditional concrete check dams often faces geographical constraints, such as dense downstream residential areas or the need for construction access roads. Therefore, it is considered important to promote the development of debris flow countermeasure facilities using significant secondary manufactured products in these streams.
In recent years, efforts have focused on new debris flow countermeasures for non-flowing mountain streams and the promotion of strategies based on permeable structures (secondary manufactured products) [16]. Non-flowing mountain streams are defined as “streams with unclear channels where there is no constant flow of water, and no sediment movement is expected under normal conditions”, and “streams where the gradient of the streambed exceeds approximately 10° at the reference point up-stream, and the entire catchment area is susceptible to debris flow initiation and movement” [16]. Additionally, there is a concern that the frequency and magnitude of sediment outflow during moderate-to-small discharges are lower compared to general debris flows and that the duration of sediment movement and flooding is shorter, with large boulders not concentrating at the debris flow front and instead reaching down-stream [20]; this outcome may prevent the permeable part from clogging, thus reducing the capture function and, as such, requiring attention. On the other hand, the out-flow of sediment downstream due to biased flow from the sides of permeable debris flow barriers in these streams has been pointed out, necessitating measures such as attached constructs (measures to prevent sediment runoff along the sides using wire mesh or impermeable structures), as shown in Figure 1, to fill the gaps between the lateral ends of the permeable debris flow barrier and the mountain stream side bank [16]. However, further discussion is needed on the mechanism of sediment outflow due to this biased flow and the specific structure of these measures. When considering how to prevent sediment runoff from the sides, an alternative that extends the permeable structure to the sides, making the entire width a permeable structure for better constructability, is also conceivable. Thus, further discussion on these structures is desired.
Firstly, this study aimed to understand the risk of sediment outflow from the sides of permeable debris flow barriers in non-flowing mountain streams, focusing on the outflow mechanism, sediment capture function, and impact of changes in the gap width of the permeable barrier, with experiments conducted to verify these aspects [16]. Secondly, with the goal of enhancing measures to prevent sediment runoff from the sides, this research examined effective structures to this end and conducted experiments to validate these structures.
2. Experimental Study of the Risk of Sediment Outflow from the Lateral Ends of the Permeable Debris Flow Barrier
2.1. Outline
An overview of the permeable debris flow barrier design (a general design without measures to prevent sediment runoff on the side) for small mountain streams is shown in Figure 2. As illustrated in the figure, for stone debris flows [22] that descend straight down from upstream in a stepwise manner, small-scale steel-type check dams (secondary manufactured products) have been adopted to provide significant structural stability. These facilities are often placed close to the stream banks within the possible installation range and positioned alone (without measures to prevent sediment runoff). However, in these streams, countermeasure works are often installed directly upstream of residential houses and roads, raising concerns about the impact of sediment outflow downstream through the gaps between the countermeasure facility and the mountain stream side bank [16].
Therefore, as shown in Figure 3, focusing on the structure of the permeable debris flow barrier envisioned based on the conventional small-scale steel-type check dam, the effect of the countermeasure width W1 of the permeable debris flow barrier relative to the total flow width W0 on sediment capture (capture mechanism and changes in the capture function) was examined using basic flume experiments to understand the trends and reveal potential issues requiring a more cautious approach.
2.2. Materials and Methods
An overview of the experimental flume in the laboratory is shown in Figure 4 and Figure 5. The flume conditions involved a slope (θw = 15°, [23]) covered with uniform and saturated gravel (silica sand [24], diameter d = 7 or 4 mm) along the bottom, spanning 1000 mm in length and 100 mm in width, with a scale of 1/20 assumed, considering the general fluid similarity laws. Water was supplied from upstream at a flow rate of qin (1.1 L/s) until either all the riverbed gravel had been eroded away, indicating the completion of debris flow initiation, or the re-erosion of the sediment captured by the countermeasure facility stabilized [t = ~30 s]. The permeable debris flow barrier was installed vertically to the riverbed, with corner members (2 mm × 2 mm) placed horizontally at equal intervals (spacing = 3.5 mm). During the experiments, the countermeasure width W1, among other variables, was altered. Each setup was tested three times, and the average result was calculated.
2.3. Results and Discussion
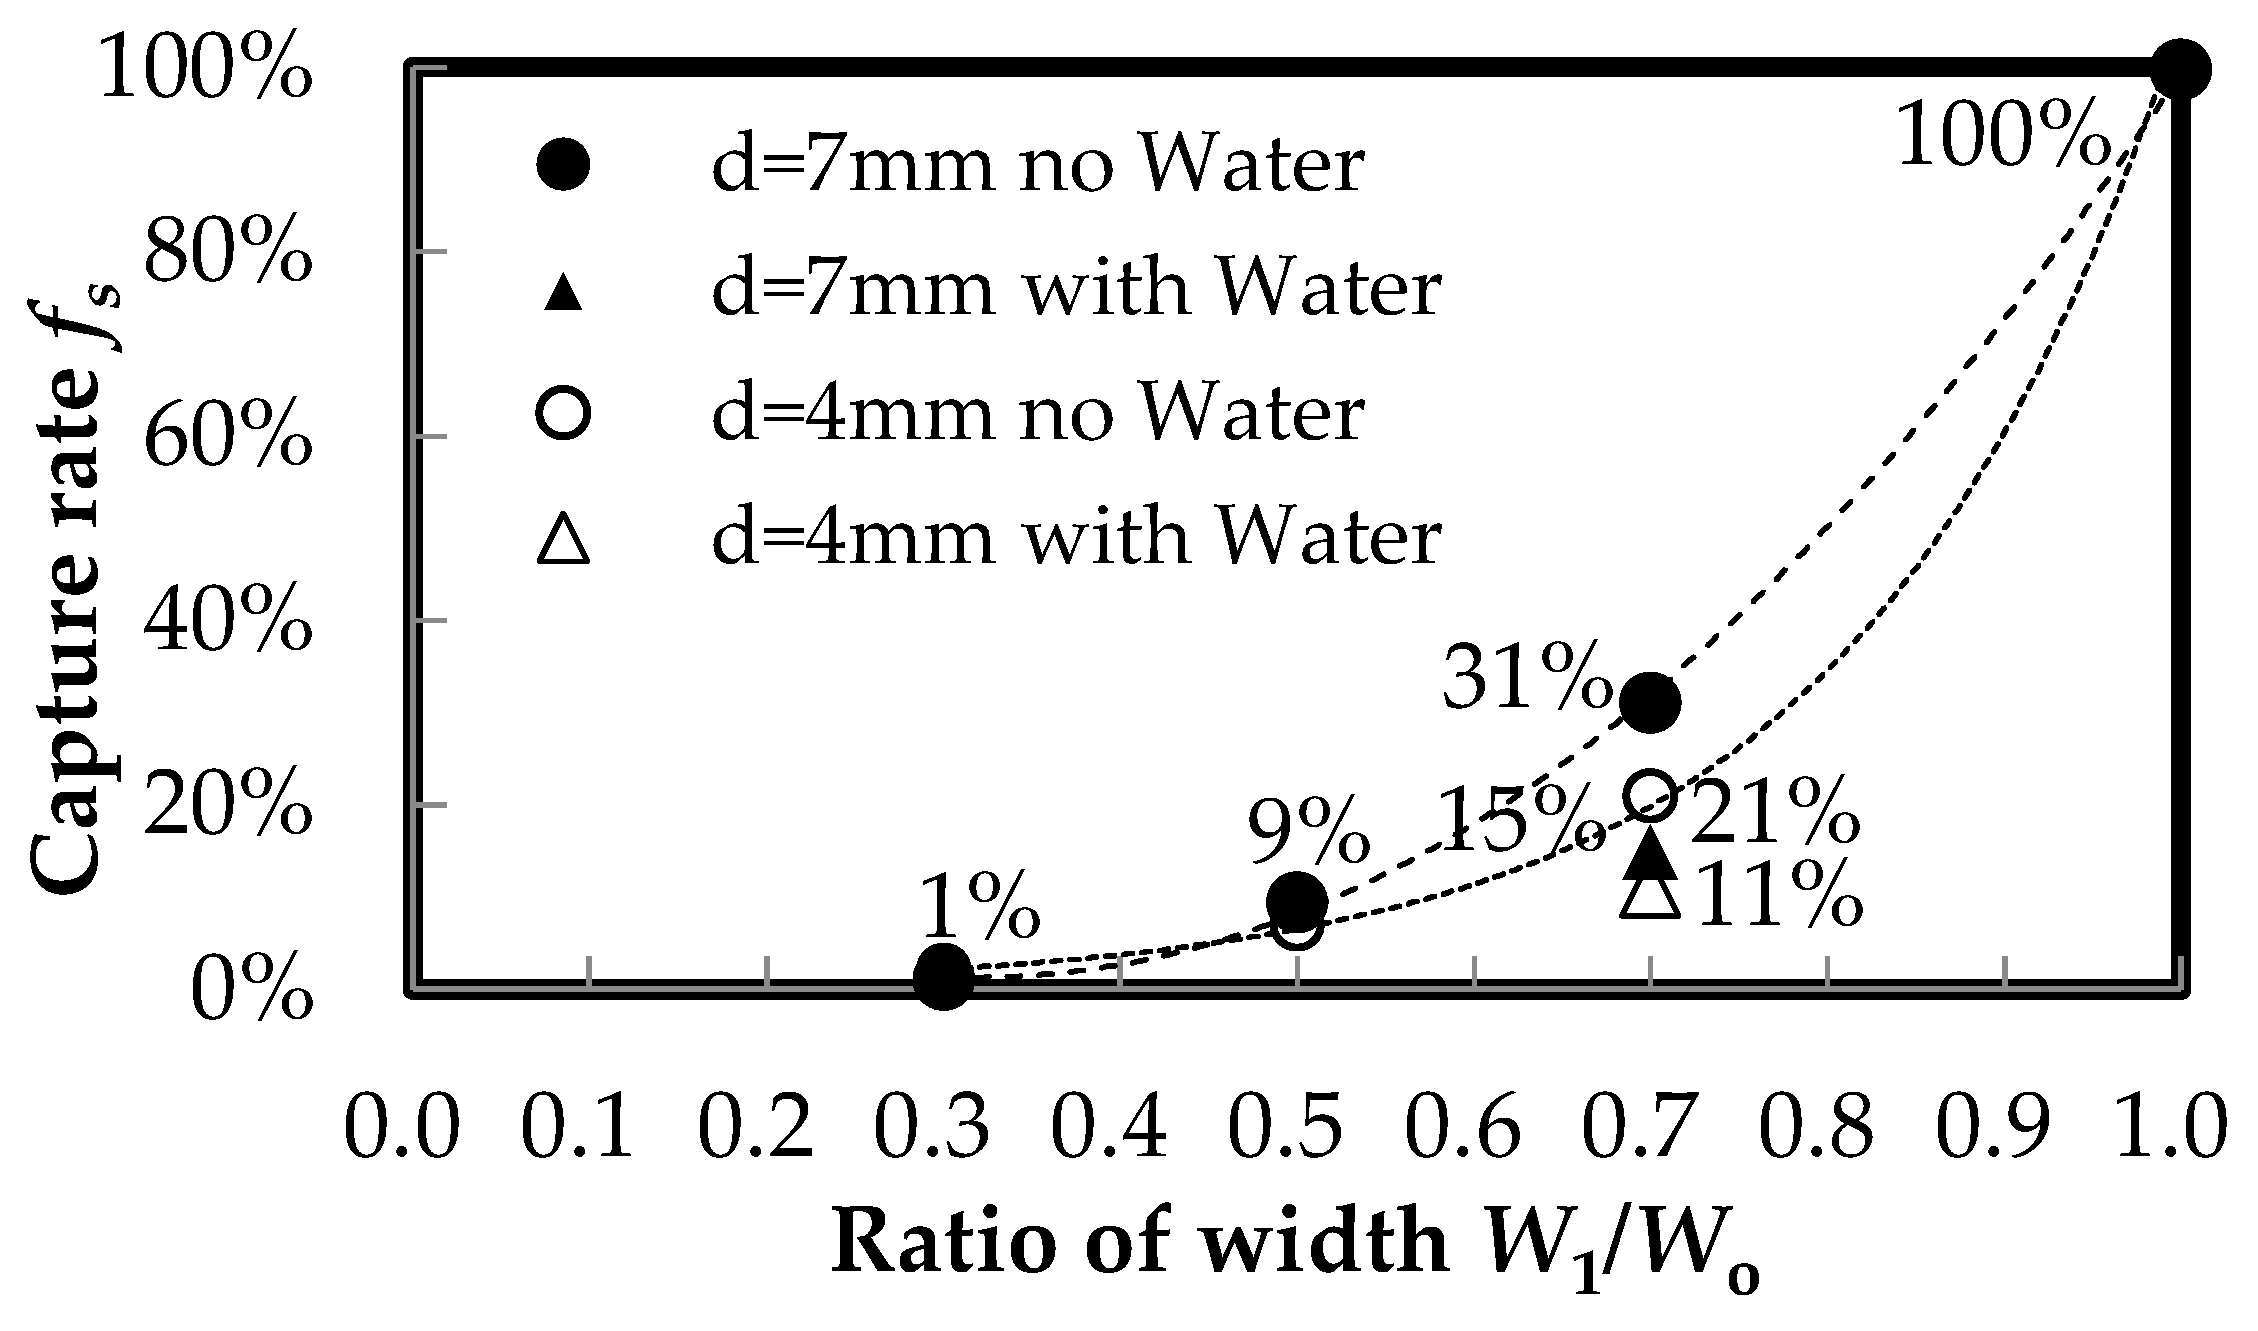
The results from the experiment showing the change in the sediment capture rate, fs, due to the difference in the ratio of the countermeasure width W1 to the total flow width W0 (W1/W0: Figure 3), are depicted in Figure 6. The sediment capture rate, fs, is defined as
where qsout is the dry weight of the sediment not captured by the countermeasure facility that flows downstream, and qsin is the weight of the sediment laid on the riverbed (assuming all of it has been eroded). As shown in Figure 6, when water is supplied until the completion of debris flow using sediment (d = 7 mm) (with no re-erosion after capture: no water), sediment outflow due to bypassing through the gaps on the sides of the countermeasure construct was observed. Moreover, the capture rate fs was <10% when the countermeasure width W1 was about half of the total flow width W0, indicating a significant decrease in capture function. The capture rate fs was about 30% when the countermeasure width W1 was about 70% of the total flow width W0. On the other hand, when water was supplied until re-erosion of the captured and accumulated sediment stabilized (with re-erosion after capture with water), re-erosion of the accumulated sediment due to biased flow to the outside (affected by the shape of the sediment accumulation) was observed, eventually reducing the capture rate fs to 15%. For finer gravel (d = 4 mm), the capture rate fs decreased further. One reason for this could be that smaller particle sizes are more susceptible to the effects of flow, such as biased flow, resulting in the sediment being carried downstream with the flow.
fs = (qsin − qsout)/qsin
These results demonstrate that the capture function decreased significantly even in the small gaps between the permeable debris flow barrier and the mountain stream side bank, indicating the necessity for reliable measures to prevent sediment runoff on the sides. The outflow mechanisms identified include direct bypassing during the debris flow descent and re-erosion associated with biased flow influenced by the shape of the sediment accumulation after capture by the countermeasure facility.
3. Experimental Advancements in Structures for Measures to Prevent Sediment Runoff at the Lateral Ends of the Permeable Debris Flow Barrier
3.1. Outline
To further enhance the structure of measures to prevent sediment runoff at the lateral ends of the permeable debris flow barrier during debris flow countermeasures in non-flowing mountain streams, this section explores effective structures with high-capture function based on fundamental experiments.
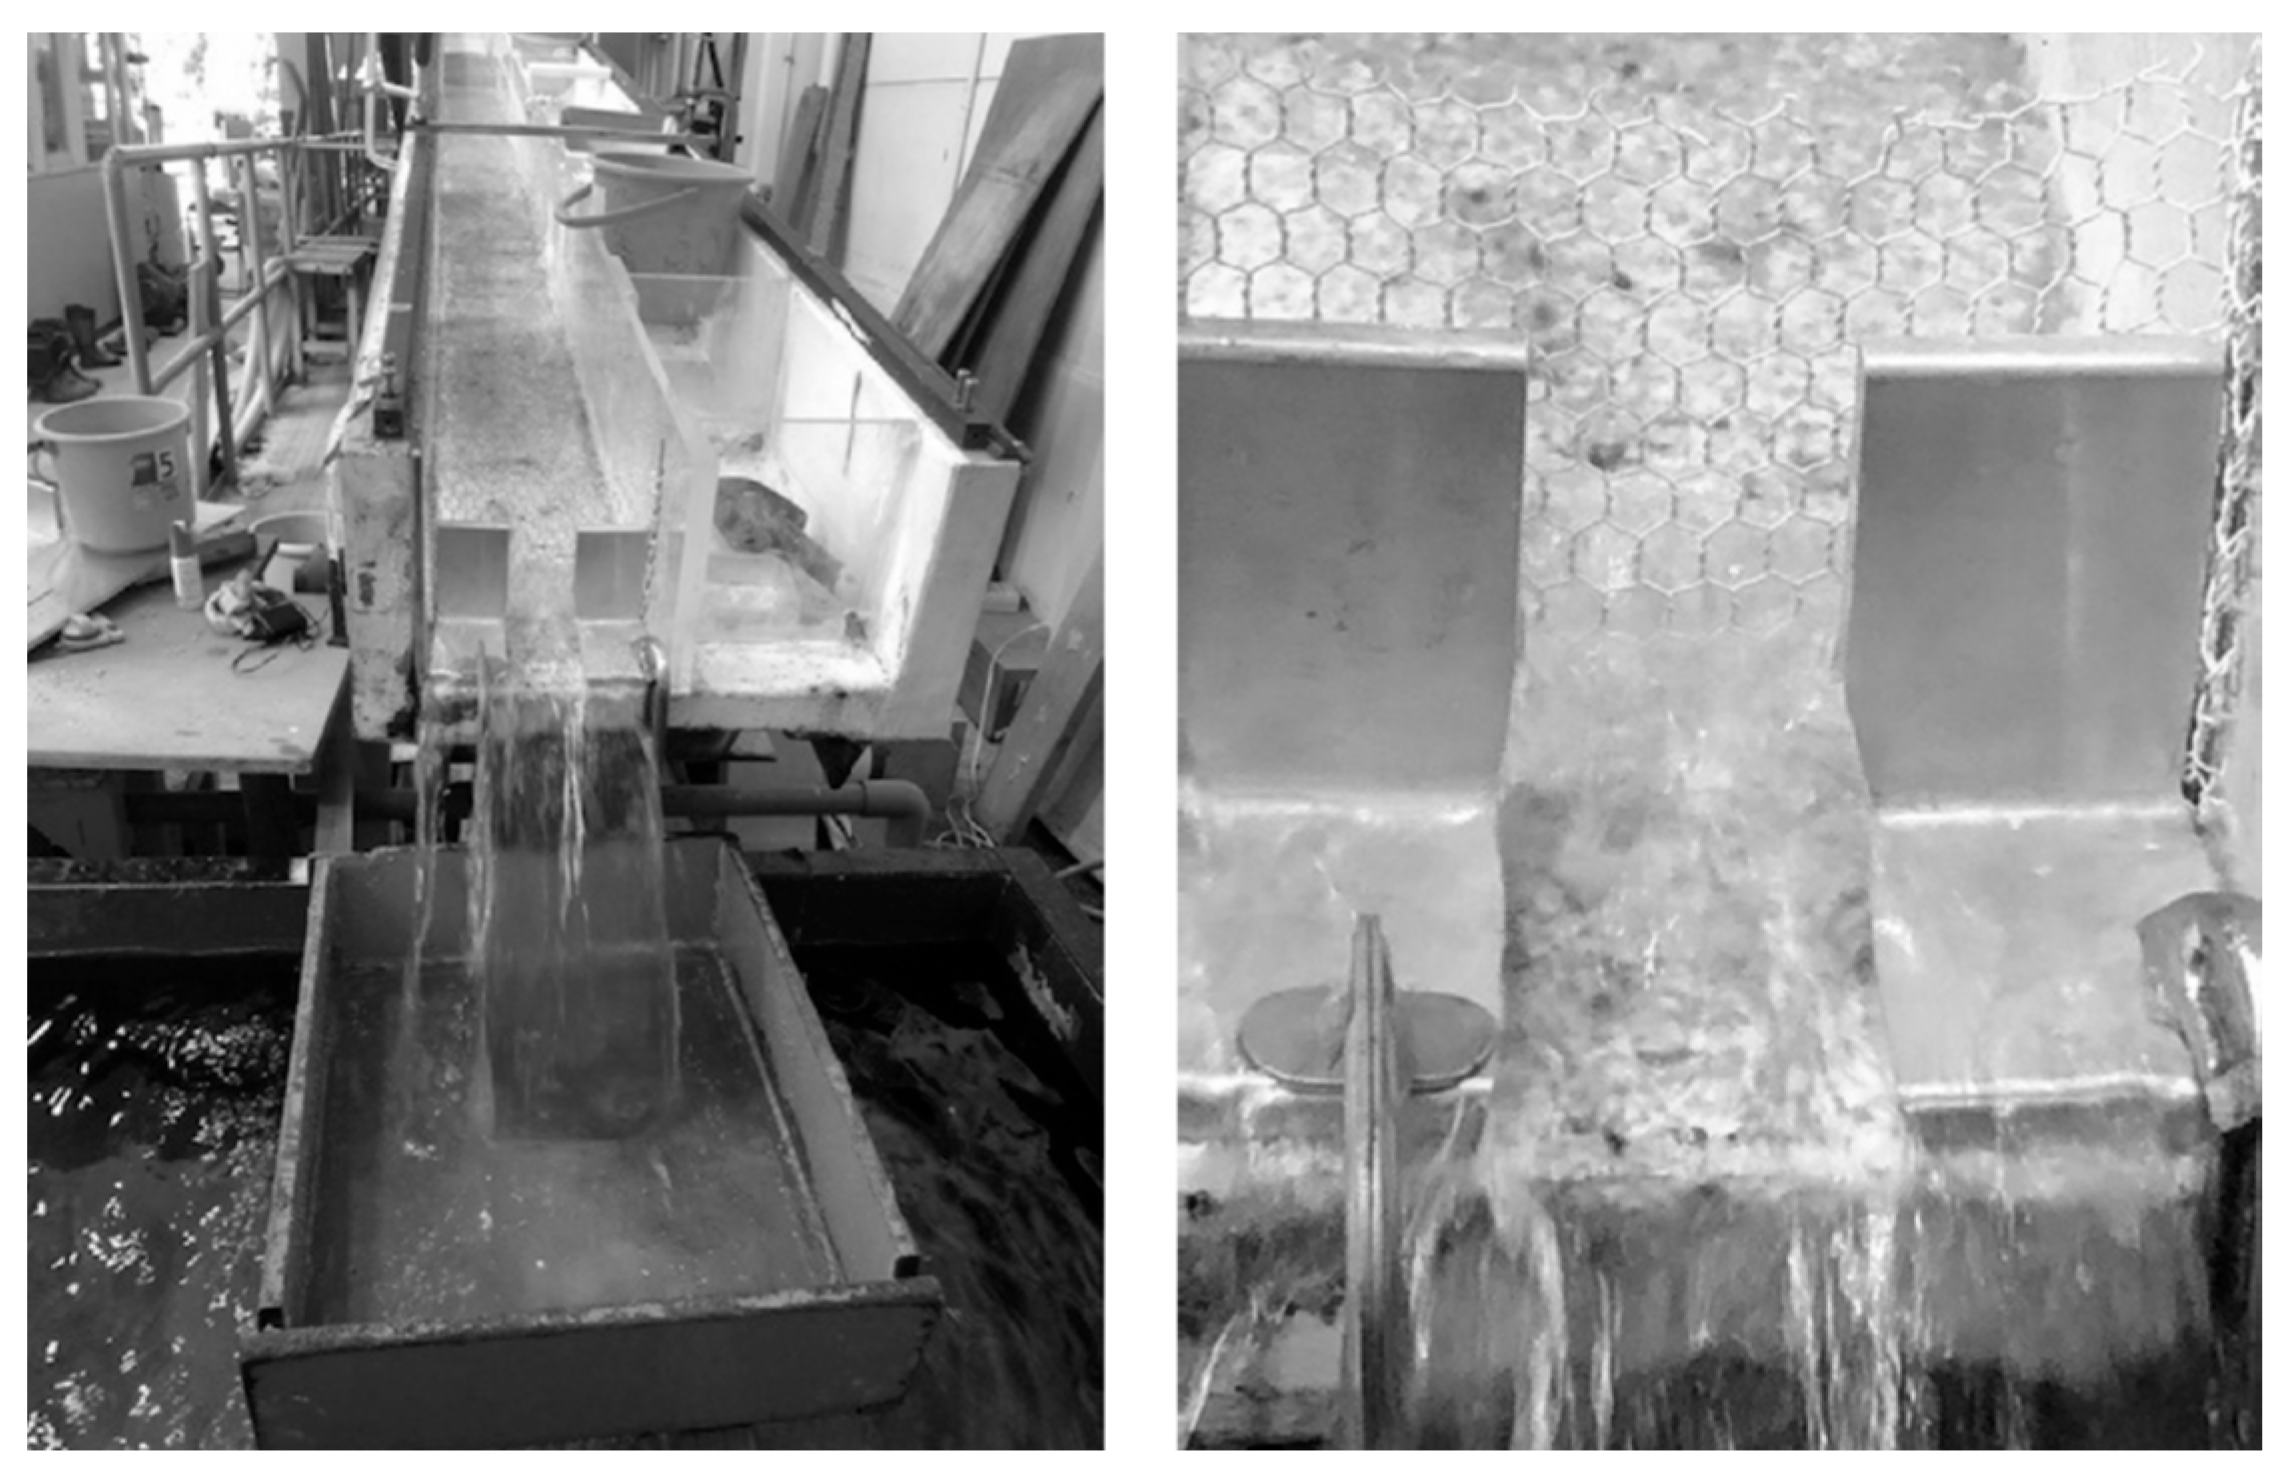
3.2. Materials and Methods
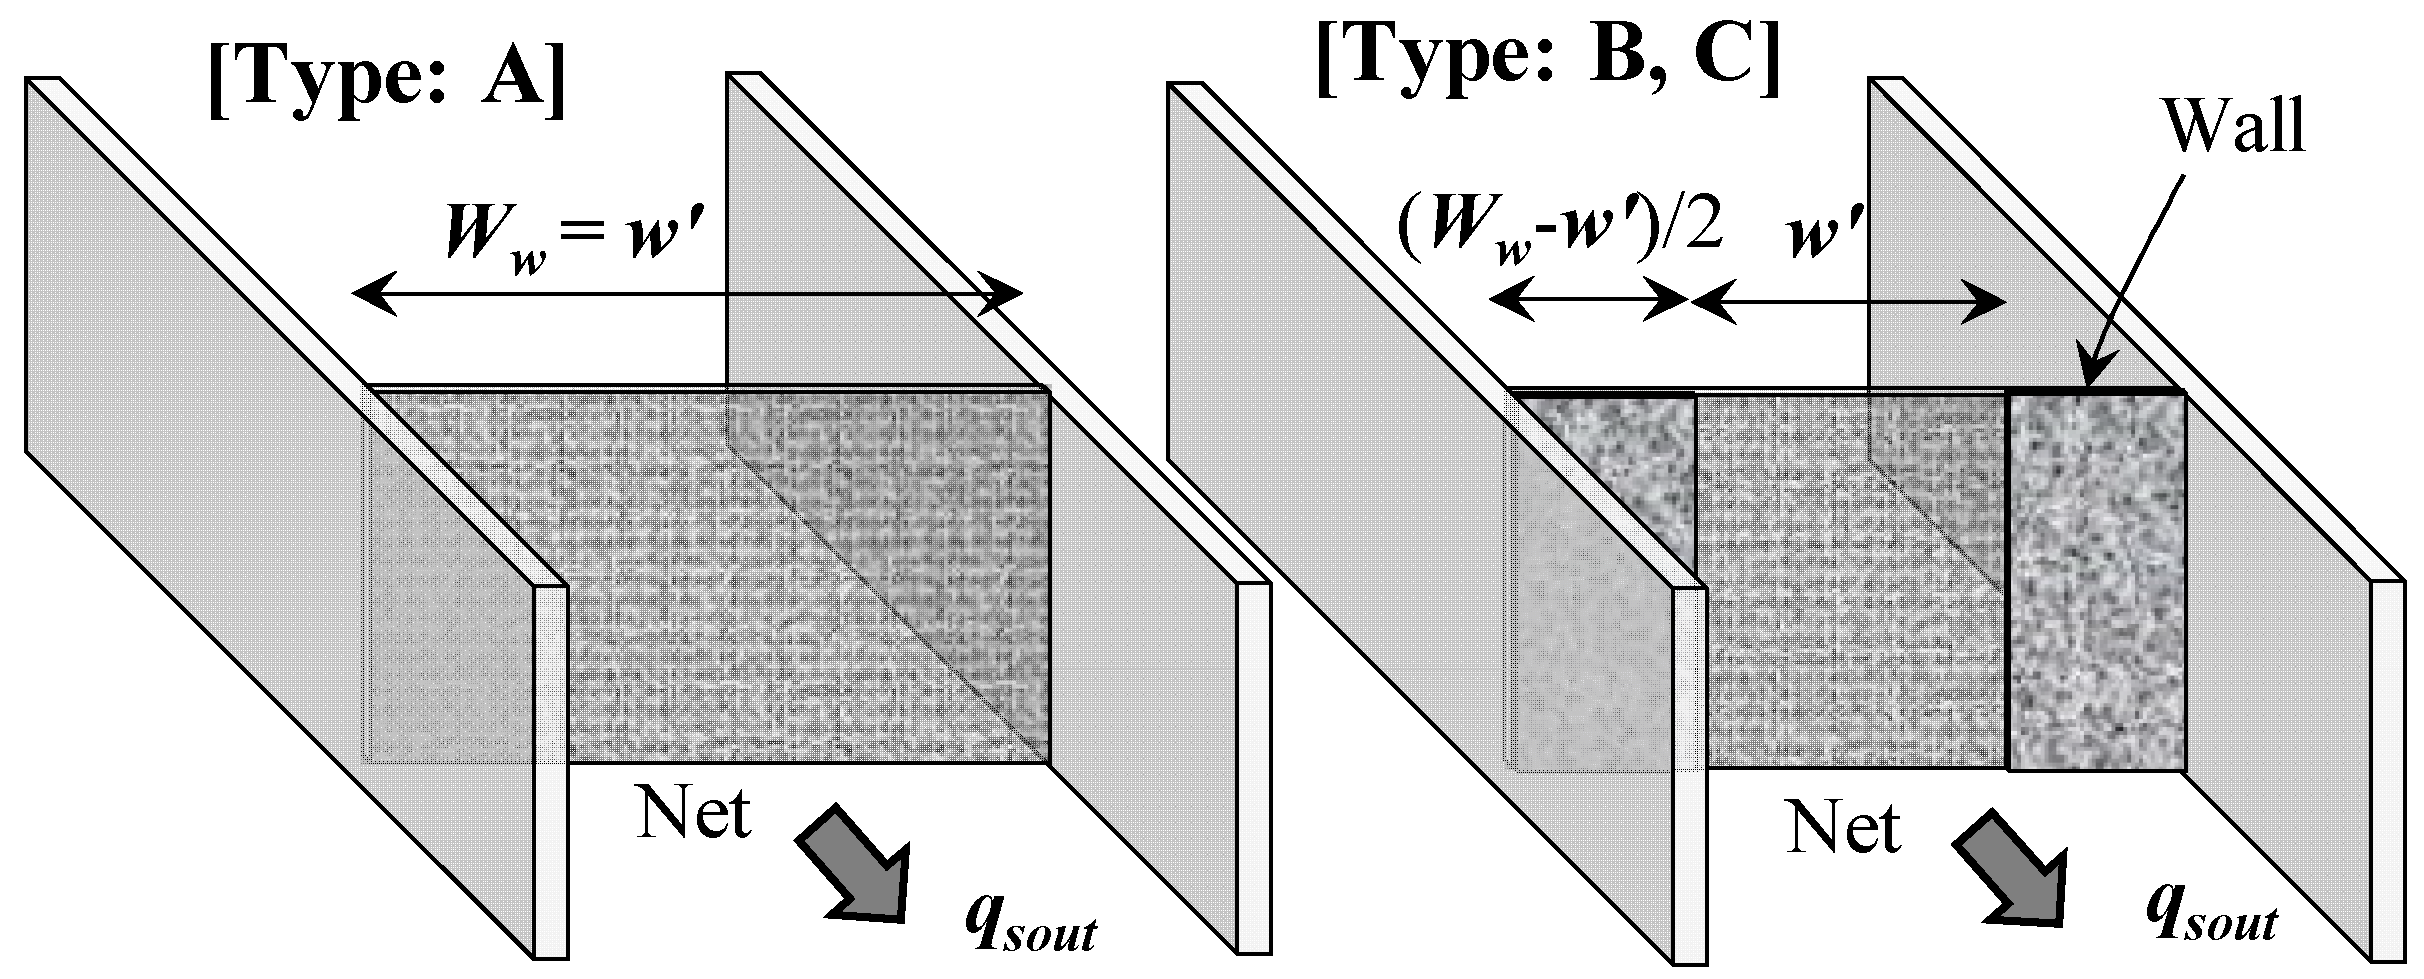
An overview of the flume in the laboratory is shown in Figure 7. The flume conditions involved laying gravel (silica sand [24]; diameter d = 7 mm, 4 mm, 0.6 mm, either uniform or mixed in equal parts) on the bottom and inclining it (θw = 10° to 15°) in a flume (length: 500–2000 mm; width: 200 mm; scale assumed: 1/10). Water was supplied from upstream at a flow rate of qin (0.7–1.5 L/s) to induce debris flow [t = ~30 s]. The weight of the sediment (gravel) not captured by the permeable debris flow barrier installed in the downstream part of the flume (counter-measure type: net) that flowed downstream through the grid of the net was measured. The permeable debris flow barrier installed in the center was assumed to be of the fence net type, considered effective for debris flow countermeasures [25], taking into account the constructability and the characteristics of non-flowing mountain streams (e.g., when there is no concentration of large boulders at the head of the debris flow or when water supply sufficient for sediment capture cannot be expected). These structures can flexibly change their shape, even under the strict construction conditions of steep terrain. An analysis of the permeable debris flow barrier and measures to prevent sediment runoff from the sides, as shown in Figure 8 and Figure 9, were carried out in an attempt to better understand the change in capture function due to the presence or absence of the impermeable part on the sides as follows: Type A: without the impermeable part—permeable width w′ = 200 mm; Type B: with impermeable part—permeable width w′ = 134 mm; Type C: with impermeable part—permeable width w′ = 66 mm; and Combination: left, only the permeable part (Type A); and right, permeable part with the impermeable part (Type B/C).
The net structure of the permeable debris flow barrier installed in the center (Figure 10) was designed to be hexagonal (wc = 10 mm, hc = 12 mm; pure spacing) in anticipation of dispersing the stress during capture in multiple vertical directions. The grid spacing was intended to be sufficiently wide (greater than or equal to the diameter of the sediment) to evaluate the change in capture function due to the differences in the structure of the measures to prevent sediment runoff, with an arch action effect expected [26]. Attention was also given to driftwood [16] assumed to flow down simultaneously with the debris flow, introducing it from upstream along with the water (however, using cylindrical supports, diameter φ = 3 mm, and driftwood length lw = 50 mm, with a specific gravity of about 0.75 in a dry state) to understand its impact on the sediment capture function. The water supply was set to continue until the point where all the riverbed sediment had been eroded, indicating the completion of debris flow initiation (no water). Additionally, structures with only the impermeable part (wall structure) on the sides (without a permeable type in the center: Cases 7-1–7-3) were also carried out for reference.
To understand the effects of different conditions on the capture function and the shape of sediment accumulation at the permeable debris flow barrier, the amount of supplied water qin, the presence of driftwood, the presence of an impermeable part, and the permeable width (w′: Figure 8) were altered (16 cases: Table 1). The capture function and post-capture sediment accumulation shape (for an example, see Figure 11) were evaluated under each condition. To account for variability in the experimental results, each condition was tested three times and averaged. The capture rate fs at the permeable debris flow barrier is represented by the same Equation (1) as before. The following discusses characteristic experimental results.
3.3. Results and Discussion
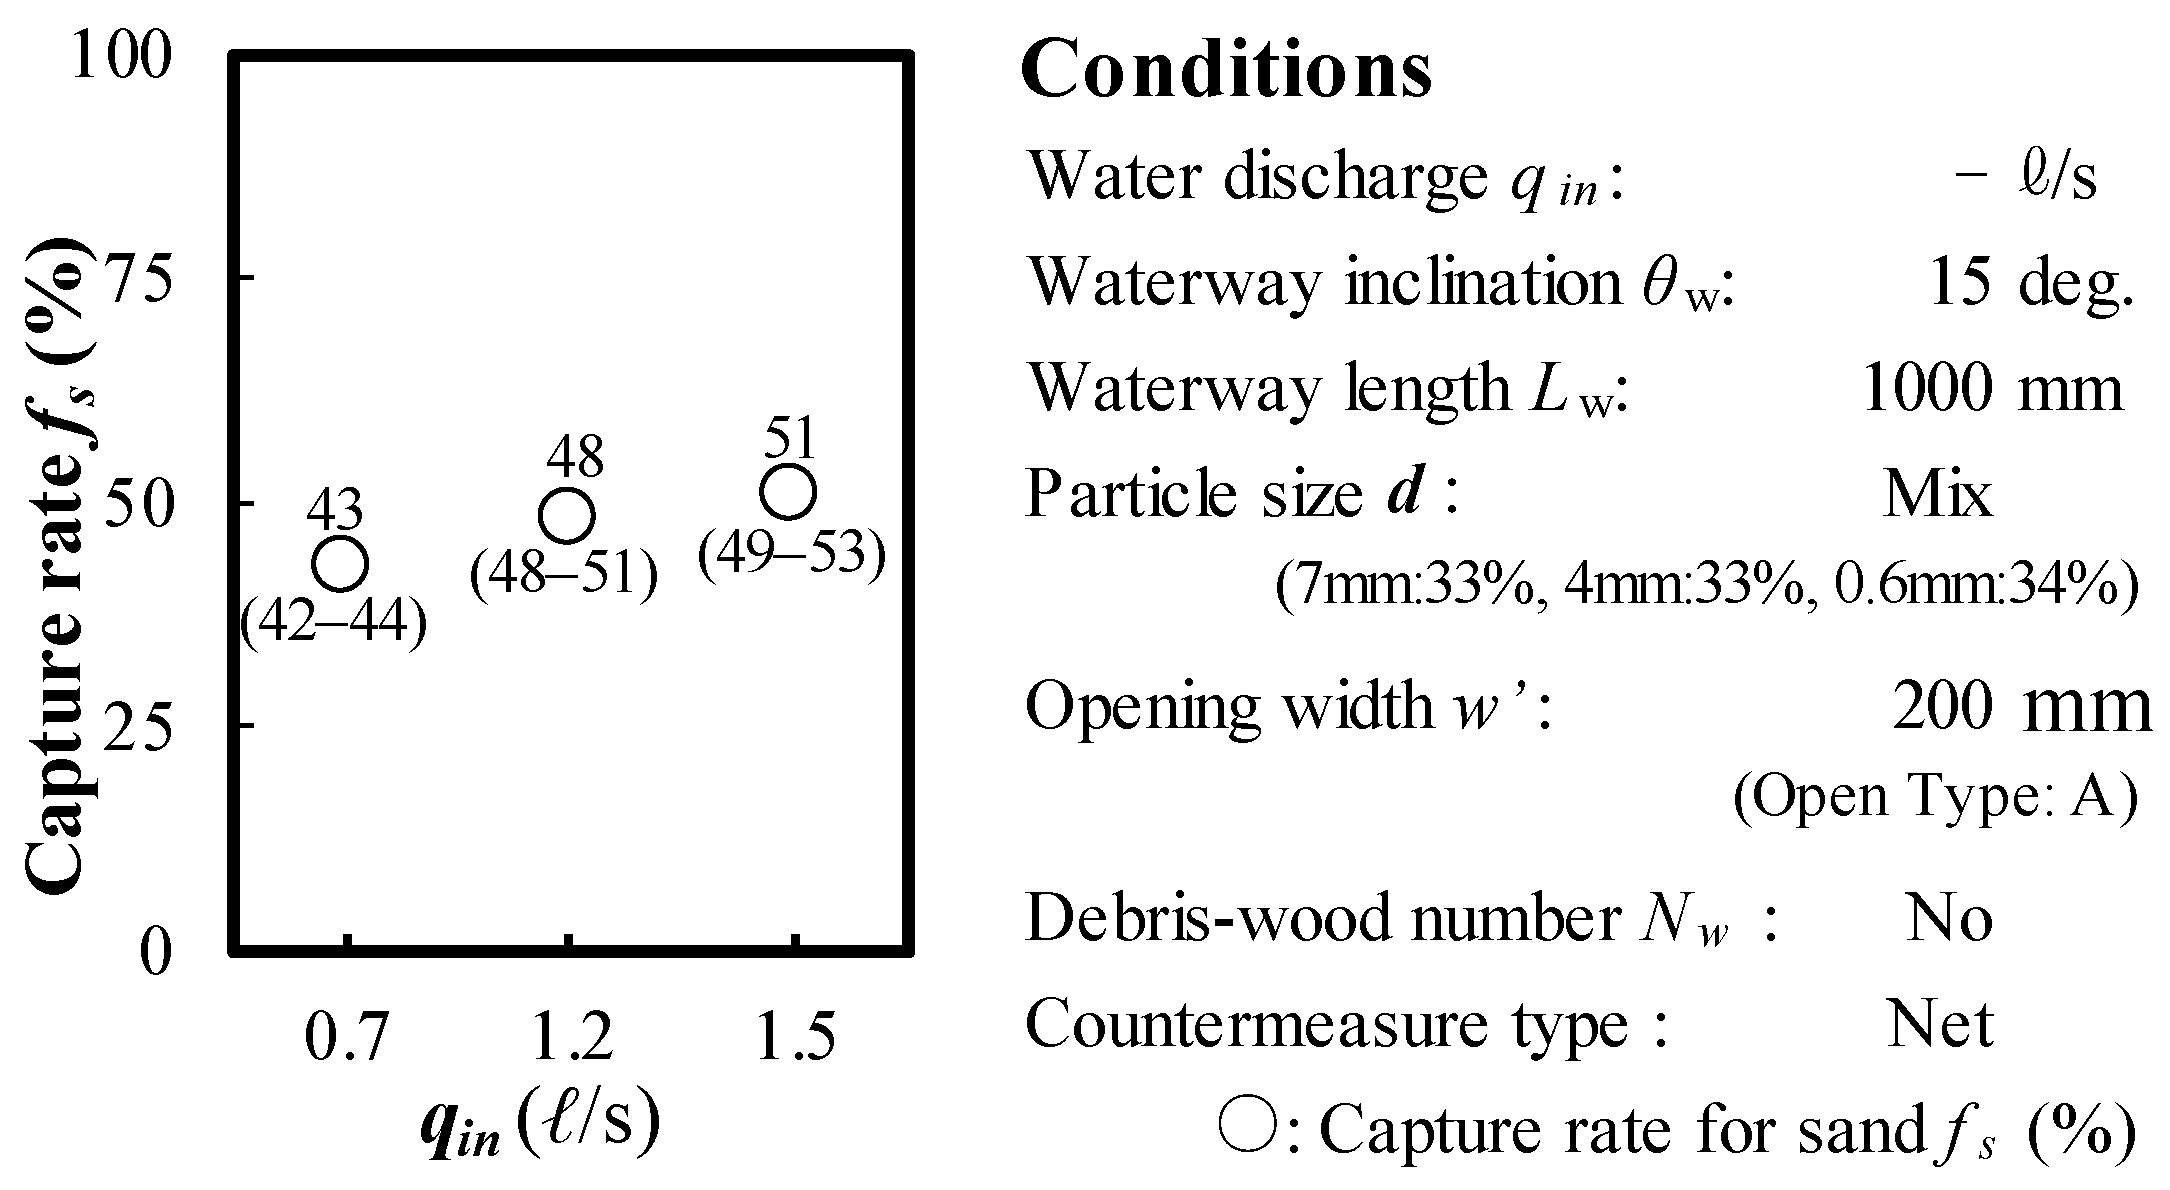
Figure 12 shows the change in capture rate fs at the permeable debris flow barrier (entirely permeable type; Type A) due to different supply flow rates qin. The numbers in the figure represent the average values, and the range of three outcomes are in parentheses. The capture function improved as the supply flow rate qin increased. One possible reason for this is that an increase in the flow rate caused a sudden and massive erosion of the riverbed sediment, leading to a higher concentration of debris flow at the front that made it more susceptible to clogging.
Figure 13 illustrates the change in capture rate fs at the permeable debris flow barrier (Type A) due to differences in flume length Lw. Interestingly, a shorter flume length Lw resulted in improved capture function. As the distances in this experiment were not sufficient to accumulate large boulders, observations indicated that instead of accumulating at the head of the typical debris flow, sediment within the debris flow tended to disperse upstream and downstream. Therefore, as the distance increased, the amount of sediment at the head of the debris flow decreased; ultimately, a lack of sufficient arch action led to a reduction in the capture function. These results indicate the importance of setting a sufficiently narrow grid spacing in small-scale streams compared to typical debris flow streams. Further verification is needed.
Figure 14 shows the change in capture rate fs at the permeable facility (Type A) due to different sanding conditions (uniform particle size, mixed particle sizes). While most of the sediment with a uniform particle size of d = 7 mm was captured, almost all of the sediment with a uniform particle size of d = 4 mm passed through the net grid (Figure 10) without sufficient arch action and flowed downstream. In the case of a mixed particle size, in which fine sand of d = 0.6 mm was added to particles of d = 7 and 4 mm in equal parts (one-third each), the capture rate fs at the permeable facility was about 50%. Observations during the experiment confirmed arch action by the larger boulders (d = 7 mm) at the head of the debris flow.
Figure 15 illustrates the change in capture rate fs at the permeable debris flow barrier (Type A) according to the presence and number of driftwood pieces. The capture function tended to improve as the proportion of driftwood increased. Observations during the experiment revealed that the lighter driftwood that had accumulated at the head of the flow was captured by the net structure and effectively blocked, subsequently leading to effective capture of the following sediment. The capture rate fs of driftwood at the permeable facility was about ≥80%, significantly improving the sediment capture function.
Figure 16 shows the change in the sediment capture rate fs at the permeable debris flow barrier according to the presence or absence of an impermeable part and differences in the permeable width (w′; Type A, Type B/C). As illustrated in Figure 16, when an impermeable part was included (Type B/C), the capture rate was approximately 1.5–2 times higher than in the absence of an impermeable part, significantly improving the capture function. Figure 17 displays the observed differences in sediment accumulation shapes (both planar and cross-sectional) during the experiment according to the presence or absence of the impermeable part. In the absence of an impermeable part (Type A; Figure 17, top left), sediment tended to accumulate more in the center and was more prone to outflow to the sides due to biased flow caused by the accumulation shape. By contrast, the presence of an impermeable part (Type B/C; Figure 17, middle right, bottom right) significantly increased the capture height, resulting in a larger quantity of sediment being captured. One reason for this could be an early arch action caused by the accumulation of large boulders in the center, facilitated by the impermeable parts (wall structures) on both sides, effectively capturing the following finer sediments.
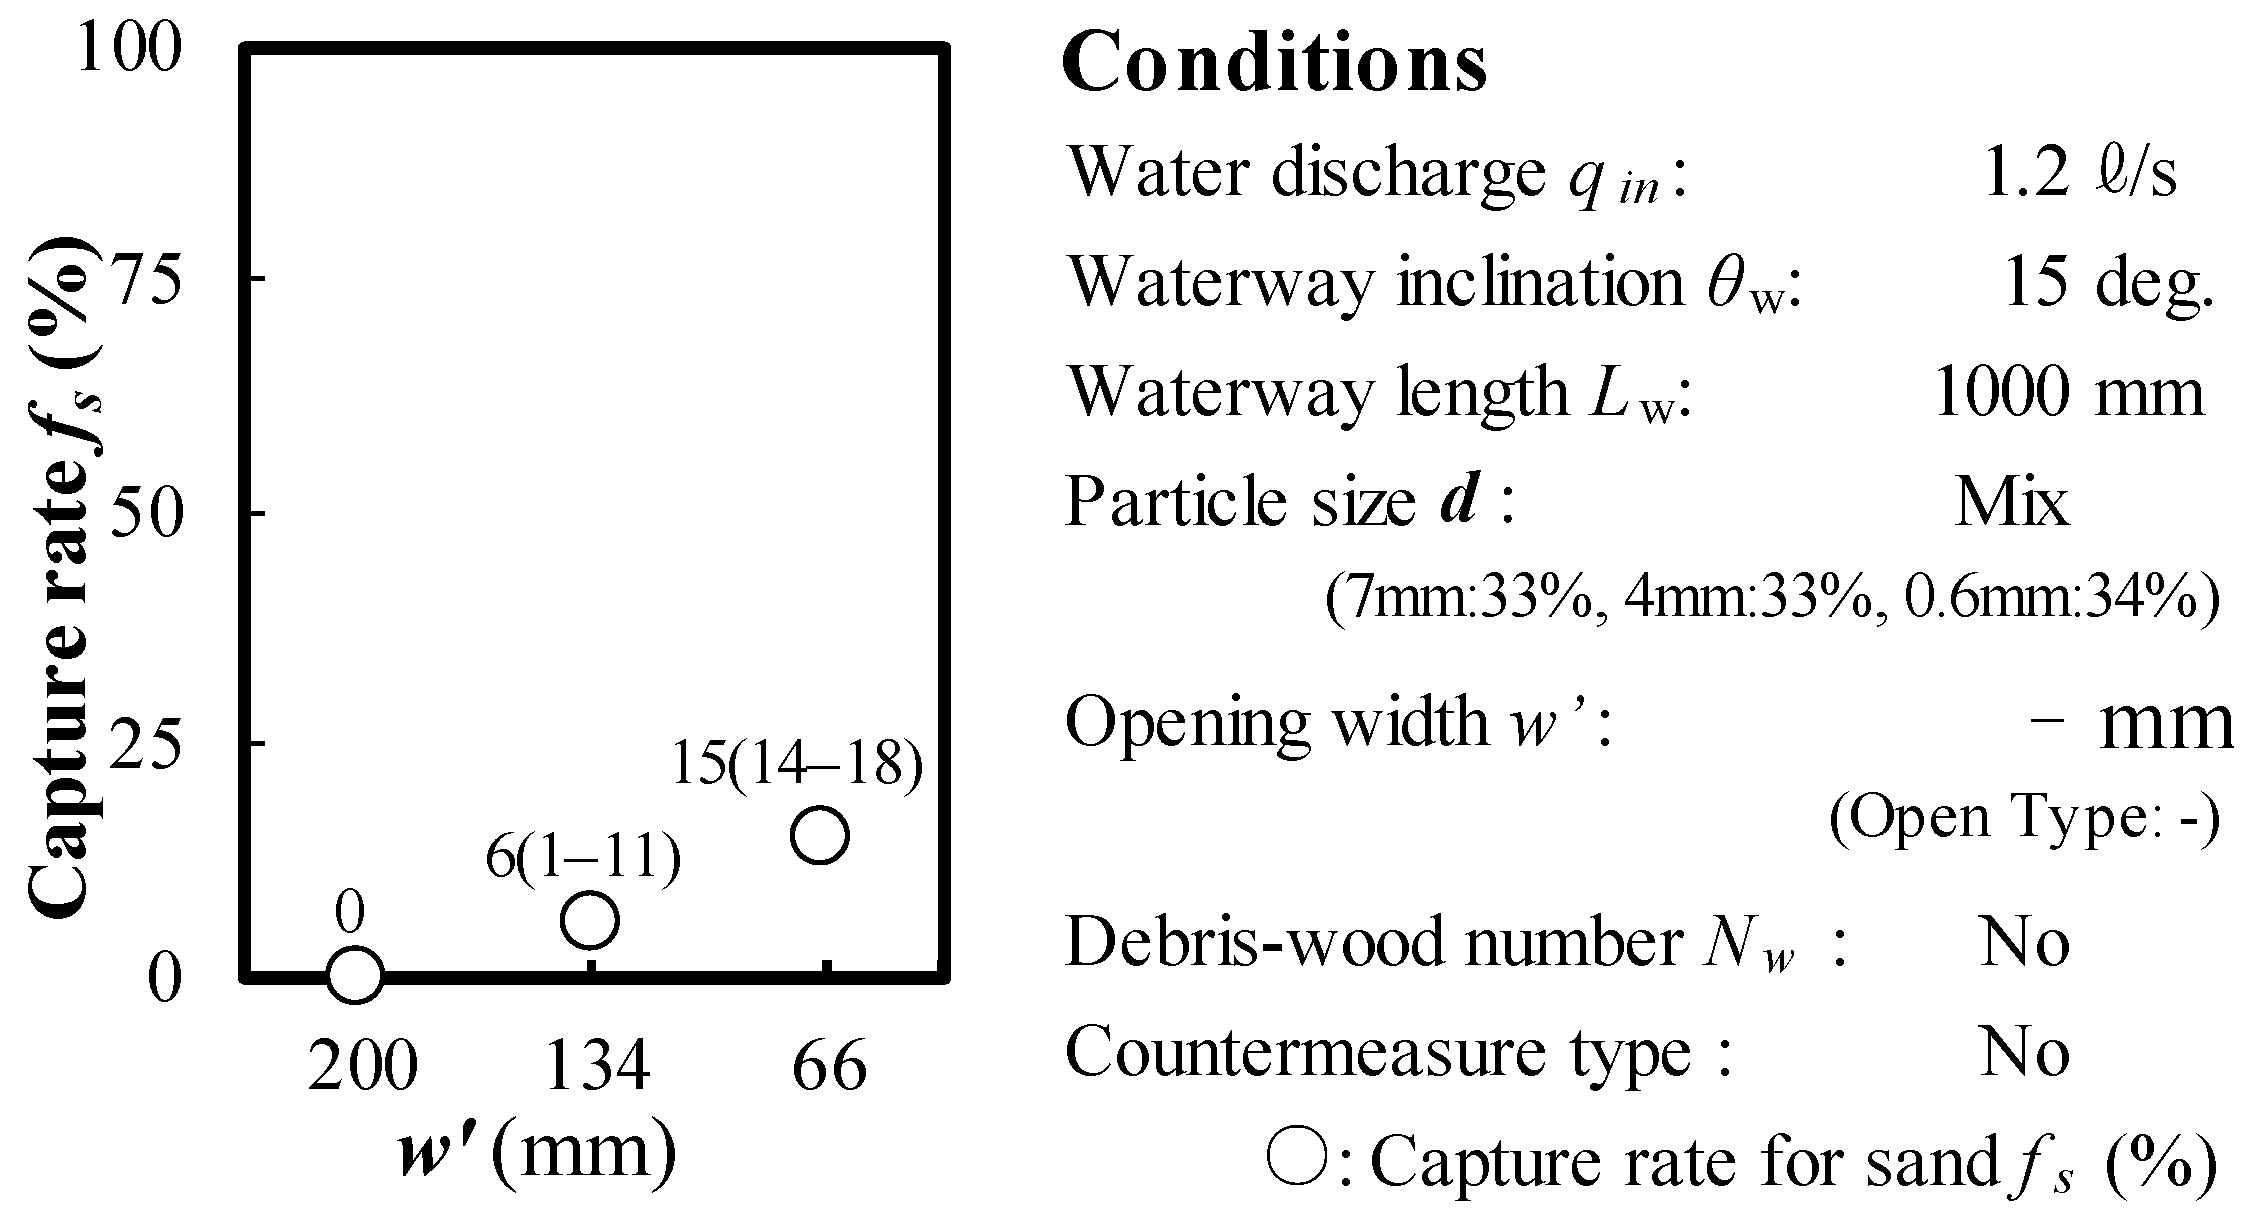
Figure 18 illustrates the change in the capture rate fs due to differences in the permeable width (w′) with only the impermeable part present (central permeable debris flow barrier absent, no counter-measure net). Even with only the impermeable part on the sides (central permeable part absent), some sediment was captured. Observations during the experiment revealed that some sediment accumulated (residual) directly upstream of the impermeable part (wall structure) due to the effect of the planar vortices that formed. This phenomenon was similar to the effects of conventional hydraulic engineering structures [27]. Thus, when there is an impermeable part on the sides, sediment can also be captured along the bank sides, potentially preventing riverbank erosion around the countermeasure structure.
This study was conducted in a basic straight flume. Further verification is needed of the effects of planar curved flows, changes in the cross-sectional shapes of water-ways, different grid shapes (other than hexagonal), scaling up the experimental size, perspectives on maintenance over medium to long terms, and the impacts of vegetation.
4. Conclusions
In this study, while focusing on small-scale streams (non-flowing mountain streams) where there is hardly any constant flow of water, we aimed to promote sediment control countermeasures (such as sediment disaster prevention and road construction projects) utilizing secondary manufactured products of permeable debris flow barriers [25], known for their excellent constructability. We investigated the mechanism of sediment outflow from the gaps between the permeable debris flow barrier and the mountain stream side bank, as well as the necessity and effectiveness of preventive measures based on basic experimental results. The findings obtained from this study are summarized as follows. When there was a gap between the side of the permeable debris flow barrier and the mountain stream side bank, there was a significant reduction in the capture function. One of the main reasons for this is the direct outflow of sediment downstream due to bypassing during debris flow movement and the re-erosion of captured sediment (gravel) caused by biased flow to the sides, which is influenced by the shape of the sediment accumulation. When impermeable structures were installed at both ends of the side of the permeable debris flow barrier to prevent sediment runoff, the capture function improved significantly compared with the use of only the permeable debris flow barrier (covering the entire width with permeable debris flow barriers), achieving a 200% increase in effectiveness. One reason for this is that large boulders accumulate in the center due to effects commonly seen in hydraulic engineering works, leading to clogging through the arch action effect of the sediment that then effectively captures subsequent finer sediment particles. Furthermore, it was discovered that when there was an impermeable part on the sides, sediment could also be captured along the bank sides, suggesting a potential function to prevent riverbank erosion at both ends of the countermeasure facility. This study was conducted in a basic straight flume. Further verification is needed of the effects of planar curved flows, changes in the cross-sectional shapes of water-ways, different grid shapes (other than hexagonal), scaling up the experimental size, perspectives on maintenance over medium to long terms, and the impacts of vegetation.
Author Contributions
Investigation, N.H.; Writing—original draft, N.H.; Writing—review & editing, Y.S.; Supervision, T.M. All authors have read and agreed to the published version of the manuscript.
Funding
This research received no external funding.
Data Availability Statement
Data are contained within the article.
Conflicts of Interest
Author Norio Harada was employed by the company Mitsui Consultants Co., Ltd. The remaining authors declare that the research was conducted in the absence of any commercial or financial relationships that could be construed as a potential conflict of interest.
References
- Hübl, J.; Suda, J.; Proske, D.; Kaitna, R.; Scheidl, C. Debris flow impact estimation on steep slopes. In Proceedings of the 11th International Symposium on Water Management and Hydraulic Engineering, WMHE, Ohrid, North Macedonia, 1–5 September 2009. [Google Scholar]
- Hungr, O.; Morgan, G.C.; Kellerhals, R. Quantitative analysis of debris torrent hazards for design of remedial measures. Can. Geotech. J. 1984, 21, 663–677. [Google Scholar] [CrossRef]
- Kinoshita, A.; Tsutsui, K.; Nishioka, T.; Fukuda, K.; Tanaka, Y.; Shimada, T.; Ekawa, M.; Yamada, S. Investigation of the flooding mechanism of the Iseki district in the Nachi River basin by typhoon Talas, 2011, focusing on driftwood behavior and riverbed rise due to the sedimentation by big boulders. Adv. River Eng. 2018, 24, 433–438. [Google Scholar] [CrossRef]
- Hungr, O.; McDougall, S.; Bovis, D. Entrainment of material by debris flows. In Debris-Flow Hazards and Related Phenomena; Jakob, M., Hungr, O., Eds.; Praxis and Springer; Springer: Berlin/Heidelberg, Germany, 2005; pp. 135–158. [Google Scholar]
- Shen, W.; Zhao, T.; Zhao, J.; Dai, F.; Zhou, G.G.D. Quantifying the impact of dry debris flow against a rigid barrier by DEM analyses. Eng. Geol. 2018, 241, 86–96. [Google Scholar] [CrossRef]
- Fujita, M.; Mizuyama, T.; Musashi, Y. Sediment runoff control by a series of Sabo dams. Proc. Hydraul. Eng. 2001, 45, 697–702. [Google Scholar] [CrossRef]
- Armanini, A.; Larcher, M. Rational criterion for designing opening of slit-check dam. J. Hydraul. Eng. 2001, 127, 94–104. [Google Scholar] [CrossRef]
- Takahara, T.; Matsumura, K. Experimental study of the sediment trap effect of steel grid-type Sabo dams. Int. J. Eros. Control Eng. 2008, 1, 73–78. [Google Scholar] [CrossRef]
- Busslinger, M.; Jakob, M.; Singer, R.; Calder, R. Log crib check dam performance under multiple debris-flow loadings—East Gate Landslide, British Columbia, Canada. E3S Web Conf. 2023, 415, 06002. [Google Scholar] [CrossRef]
- Iverson, R.M. Debris-flow protection systems for mountain torrents. Rev. Geophys. 1997, 35, 245–296. [Google Scholar] [CrossRef]
- Ng, C.W.; Song, D.; Choi, C.E.; Liu, L.H.D.; Kwan, J.S.; Koo, R.C.H.; Pun, W.K. Deciphering controls for the impact of geophysical flows on a flexible barrier: Insights from coupled CFD-DEM modeling. Can. Geotech. J. 2017, 54, 188–206. [Google Scholar] [CrossRef]
- Wendeler, C. Debris-Flow Protection Systems for Mountain Torrents; WSL Berichte 44; Swiss Federal Institute for Forest, Snow and Landscape Research WSL: Birmensdorf, Switzerland, 2016; 267p. [Google Scholar]
- Jang, W.; Kim, B.-J.; Choi, S.-K.; Kwon, T.-H.; Yune, C.-Y. Effect of multiple debris flow countermeasures on flow characteristics and topographic changes through real-scale experiment. E3S Web Conf. 2023, 415, 06007. [Google Scholar] [CrossRef]
- Kong, Y.; Guan, M. Deciphering controls for the impact of geophysical flows on a flexible barrier: Insights from coupled CFD-DEM modeling. E3S Web Conf. 2023, 415, 06010. [Google Scholar] [CrossRef]
- Miyahara, Y.; Horiguchi, T.; Takeya, K.; Mantoku, M. Debris flows load experiment subjected to an open Sabo dam supported by cables. J. Struct. Eng. 2024, 70, 1092–1105. [Google Scholar]
- Ministry of Land, Infrastructure, Transport, and Tourism, Sediment Control Division. Technical Notes on Debris Flow Countermeasures in Non-Flowing Mountain Streams; Ministry of Land, Infrastructure, Transport, and Tourism, Sediment Control Division: Tokyo, Japan, 2022.
- Ishikawa, Y.; Maeda, A.; Kusano, S. A method for determining the risk of debris flow occurrences on mountain roads. J. Jpn. Soc. Eros. Control Eng. 1996, 49, 1. [Google Scholar]
- Yazawa, A.; Mizuyama, T.; Suzuki, H. Process of debris flow occurrences on mountain roads. Civ. Eng. Tech. Mater. 1987, 29, 9–14. [Google Scholar]
- Japan Highway Public Corporation. Guidelines for Debris Flow Countermeasures; Japan Highway Public Corporation: Tokyo, Japan, 2003. [Google Scholar]
- Harada, N.; Wada, T.; Furuya, T.; Nakatani, K.; Mizuyama, T.; Satofuka, Y. Basic experiments on the accumulation process of large particles at the head of debris flows. J. Jpn. Soc. Eros. Control Eng. 2015, 68, 39–43. [Google Scholar]
- Yoshida, M.; Tatsuta, N.; Nishida, Y.; Inoue, S. The shockload experiment of the falling stone protect reinforcement soil wall which reinforced prestress. Geosynth. Eng. J. 2003, 18, 131–138. [Google Scholar] [CrossRef]
- Takahashi, Y. Study on the occurrence and flow of debris flows. In Annual Report of the Disaster Prevention Research Institute, Kyoto University; The Disaster Prevention Research Institute (DPRI): Uji, Japan, 1976; Volume 20, p. B-2. [Google Scholar]
- Kamataki, T.; Kodachi, S.; Saito, N.; Watanabe, K. Study on the influence of structures on the sediment transport due to the tsunami run-up to river. J. Jpn. Soc. Civ. Eng. 2021, 77, I_277–I_282. [Google Scholar] [CrossRef] [PubMed]
- Sonoda, Y.; Fukunaga, K. Impact resistance performance check of wire ring net guard fence using full scale test and numerical analysis. J. Struct. Eng. 2018, 64, 811–818. [Google Scholar]
- Takahashi, Y.; Nakagawa, I.; Satofuka, Y.; Wang, H. Clogging model of grate-type Sabo dams. Proc. Hydraul. Eng. 2001, 45, 697–702. [Google Scholar]
- Fukuoka, S.; Nishimura, T.; Takahashi, A.; Kawaguchi, A.; Oka, N. Study on the design method of overtopping type hydraulic control works. Trans. Jpn. Soc. Civ. Eng. 1998, 593, 51–67. [Google Scholar]
- Takahashi, T. A review of Japanese debris flow research. Int. J. Eros. Control Eng. 2009, 2, 1–14. [Google Scholar] [CrossRef]
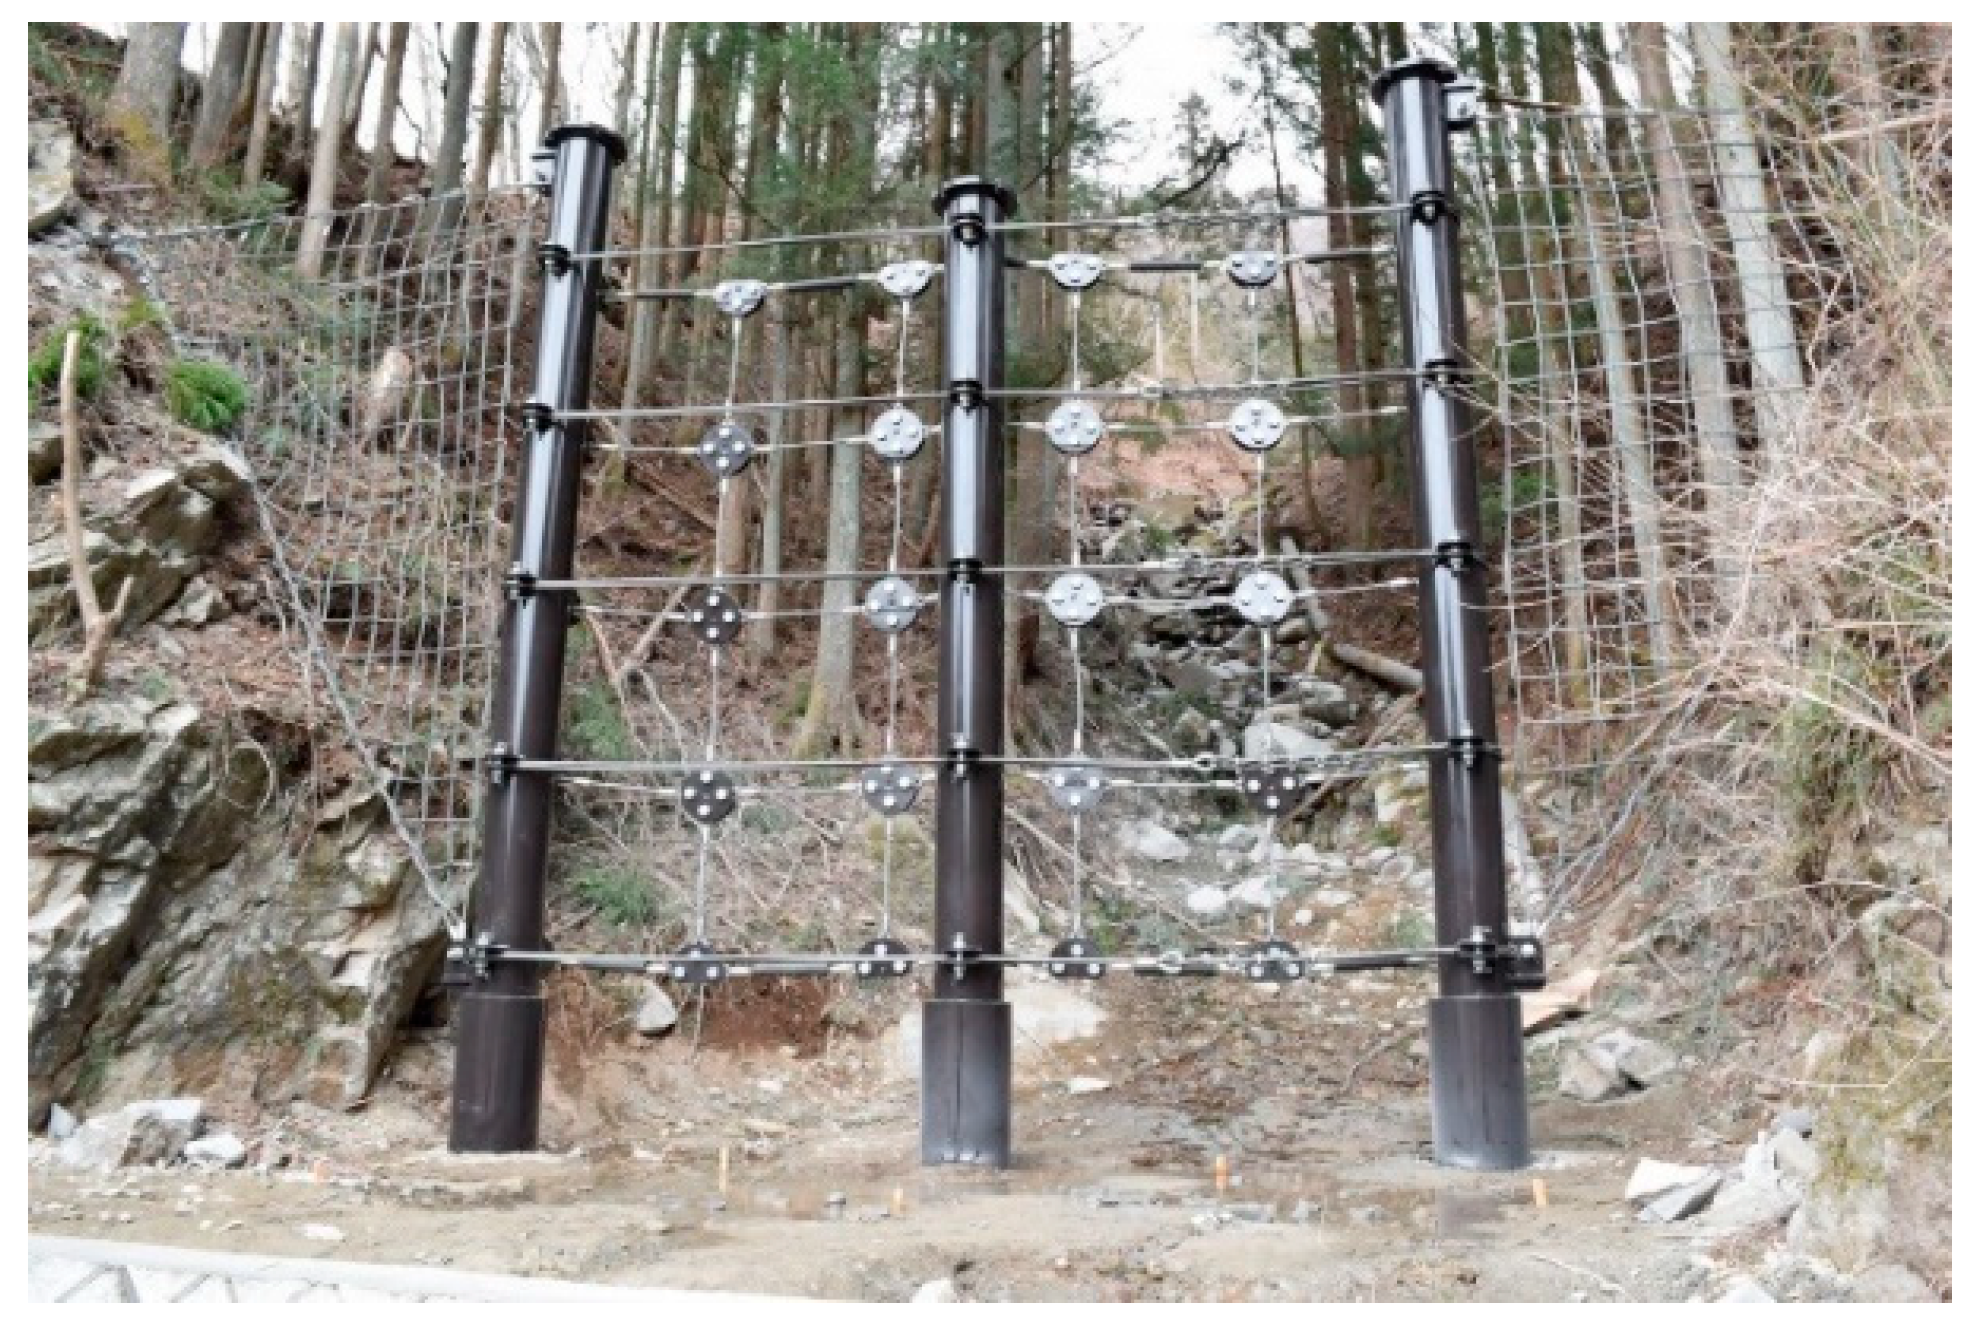
Figure 1.
Example of secondary manufactured products (permeable debris flow barrier) and measures to prevent sediment runoff from the side (with wire mesh) in small-scale streams [21].
Figure 1.
Example of secondary manufactured products (permeable debris flow barrier) and measures to prevent sediment runoff from the side (with wire mesh) in small-scale streams [21].

Figure 2.
Examples of steel-type check dam installations in small-scale streams used to date.

Figure 3.
Installation conditions of the structure in the experiment.

Figure 4.
Schematic diagram of the experimental flume.

Figure 5.
Photo of the experimental flume.

Figure 6.
Impact of countermeasure width of the permeable debris flow barrier on the capture function.
Figure 6.
Impact of countermeasure width of the permeable debris flow barrier on the capture function.

Figure 7.
Schematic diagram of the experimental flume.

Figure 8.
Schematic diagram of the permeable debris flow barrier used in the experiments.

Figure 9.
Photo of the permeable debris flow barrier used in the experiments.

Figure 10.
Net structure of the permeable debris flow barrier used in the experiments.

Figure 11.
Overview of the sediment captured by the permeable debris flow barrier (net structure).

Figure 12.
Impact of different supply flow rates on the capture function (Type A).

Figure 13.
Impact of flume length on the capture function (Type A).

Figure 14.
Impact of sand supply conditions on the capture function (Type A).

Figure 15.
Impact of driftwood inclusion on the capture function (Type A).

Figure 16.
Impact of the presence or absence of an impermeable part on the sides on the capture function (Type A-w′: 200 mm, Type B: 134 mm,
Type C: 66 mm).
Figure 16.
Impact of the presence or absence of an impermeable part on the sides on the capture function (Type A-w′: 200 mm, Type B: 134 mm,
Type C: 66 mm).

Figure 17.
Changes in the captured (accumulated sediment) shape due to the presence or absence of a side impermeable debris flow barrier (top: plan view, middle: longitudinal view, bottom: cross-sectional view).
Figure 17.
Changes in the captured (accumulated sediment) shape due to the presence or absence of a side impermeable debris flow barrier (top: plan view, middle: longitudinal view, bottom: cross-sectional view).

Figure 18.
Impact of an impermeable debris flow barrier (alone) on the capture function (with only the side impermeable structure, i.e., without the net structure).
Figure 18.
Impact of an impermeable debris flow barrier (alone) on the capture function (with only the side impermeable structure, i.e., without the net structure).


Table 1.
Experimental conditions.
| Case | Water Flow Rate qin (L/s) | Particle Size d (mm) | Flume Length Lw (mm) | Opening Width w′ (mm) | Debris-Wood Nwin (Number) | Countermeasure: Net |
|---|---|---|---|---|---|---|
| 1-1 | 1.2 | Mix | 1000 | 200 | - | Exist |
| 1-2 | 1.5 | |||||
| 1-3 | 0.7 | |||||
| 2-1 | 1.2 | 7 | ||||
| 2-2 | 4 | |||||
| 3-1 | Mix | 500 | ||||
| 3-2 | 2000 | |||||
| 4-1 | 1000 | 20 | ||||
| 4-2 | 40 | |||||
| 4-3 | - | 20 | ||||
| 5-1 | Mix | 134 | - | |||
| 5-2 | 66 | |||||
| 6-1 | 20 | |||||
| 7-1 | 200 | - | No | |||
| 7-2 | 134 | |||||
| 7-3 | 66 |
Disclaimer/Publisher’s Note: The statements, opinions and data contained in all publications are solely those of the individual author(s) and contributor(s) and not of MDPI and/or the editor(s). MDPI and/or the editor(s) disclaim responsibility for any injury to people or property resulting from any ideas, methods, instructions or products referred to in the content. |
© 2024 by the authors. Licensee MDPI, Basel, Switzerland. This article is an open access article distributed under the terms and conditions of the Creative Commons Attribution (CC BY) license (https://creativecommons.org/licenses/by/4.0/).
Share and Cite
MDPI and ACS Style
Harada, N.; Satofuka, Y.; Mizuyama, T. A Proposal for Sediment Control Countermeasures in Non-Flowing Mountain Streams. Water 2024, 16, 1197. https://doi.org/10.3390/w16091197
AMA Style
Harada N, Satofuka Y, Mizuyama T. A Proposal for Sediment Control Countermeasures in Non-Flowing Mountain Streams. Water. 2024; 16(9):1197. https://doi.org/10.3390/w16091197
Chicago/Turabian StyleHarada, Norio, Yoshifumi Satofuka, and Takahisa Mizuyama. 2024. "A Proposal for Sediment Control Countermeasures in Non-Flowing Mountain Streams" Water 16, no. 9: 1197. https://doi.org/10.3390/w16091197
Note that from the first issue of 2016, this journal uses article numbers instead of page numbers. See further details here.