
Multiscale Analysis of Water Area, Level and Flow and Their Relationships for a Large Lake Connected to Rivers: A Case Study of Dongting Lake, China

1
School of Hydraulic and Environmental Engineering, Changsha University of Science and Technology, Changsha 410114, China
2
Chinese Academy of Surveying and Mapping, Beijing 100039, China
3
School of Geosciences and Info-Physics, Central South University, Changsha 410083, China
*
Author to whom correspondence should be addressed.
Water 2024, 16(9), 1198; https://doi.org/10.3390/w16091198
Submission received: 15 March 2024
/
Revised: 12 April 2024
/
Accepted: 19 April 2024
/
Published: 23 April 2024
Abstract
:Exploring the different characteristics of water status at different time scales is essential for the understanding of the complex hydrological processes in lakes connected to rivers. Taking Dongting Lake, a large-scale lake connected to the Yangtze River, as an example, this study employed wavelet analysis and multiple models to explore the temporal characteristics of water area, level, and flow and the water level–area and flow–area correlations from 2000 to 2021 on annual, seasonal, and monthly scales. The results show that the interannual variations in annual, seasonal, and monthly water area anomalies demonstrated rather consistent overall trends, but there were differences in the variation ranges at different temporal scales. The dominant amplitudes for annual and seasonal area anomalies were close, while for monthly anomalies, they were sometimes much larger. The dominant amplitudes of the water level and flow anomalies generally followed the order annual < seasonal < monthly. The water level–area and flow–area correlations are strongest at Chenglingji station and on the seasonal scale. This study provides a multiscale perspective on hydrological conditions and will support the management of water resources and the prevention of drought and flood disasters.
1. Introduction
Lakes that are connected to rivers are formed by the oscillation and diversion of rivers, often receiving water from rivers and then flowing into rivers after regulation and storage. The relationship between rivers and lakes is complex, and the shoreline is winding [1,2]. It is greatly affected by climate, and the lake surface often changes greatly at different times, forming a seasonal hydrological fluctuation pattern of rising and falling. Lakes are indispensable components of aquatic ecosystems and play an important role in regulating water storage, supplying water sources, performing irrigation, and regulating the climate [3,4,5]. Studying the evolution of the water and hydrological characteristics of lakes connected to rivers in different periods can be very useful for a profound understanding of the relationships between rivers and lakes, effective utilization of water resources, protection of ecological functions, and enhancement of drought and flood disaster warning and risk prevention systems.
Many studies have been conducted from different perspectives. Some studies have explored variations in hydrological conditions, such as water level, inflow and discharge, and their relationships in lakes connected to rivers based on time series data from hydrological monitoring stations [6,7,8,9]. With the development of computing science, these methods are being developed into multiscale, multidimensional, and comprehensive methods [10,11,12]. In addition to traditional methods such as trend analysis and periodic analysis, many newly emerging methods, including wavelet analysis and machine learning, have been introduced into hydrological time series analysis [13,14]. Some studies have analyzed the spatiotemporal patterns of water areas for lakes connected to rivers with remote sensing techniques. Water area information is extracted from various types of satellite images, such as moderate-resolution imaging spectroradiometer (MODIS), Landsat, and Sentinel images [15,16,17,18,19]. Despite the advantages of remote sensing such as wide coverage and low cost, unfavorable weather conditions, revisit periods and complex terrains can lead to varying degrees of spatiotemporal gaps in some areas [20]. Moreover, seasonal differences, physical and chemical properties, and many other factors can also affect the accuracy of the extraction results for monitoring lakes [15,21,22]. Therefore, the water surface areas used in these studies can be uncertain and discontinuous to some degree, which may demonstrate different characteristics at different temporal scales. These characteristics may be ignored by studies based on traditional time series analysis methods at a single temporal scale. Some studies have established a fitting model between satellite-derived water area and hydrological monitoring data to explore the relationships between rivers and lakes and to simulate changes in water area [23,24,25,26]. They could reveal the characteristics of the relationship to some extent, but similar to the analysis of lake water area, they usually analyzed at a single scale and established a unified relationship model between hydrological indicators (mainly water level) and area. However, in different periods of rising and falling and in different seasons, the amount of water incoming from rivers to lakes will change, and the periodicity of hydrologic fluctuations between years may also differ [27,28,29]. Hence, it is necessary to systematically depict the variation in water surface area and its relationship with hydrological conditions for lakes connected to rivers at different temporal scales so that we can better understand their series of water problems, such as drought and flood disasters and seasonal shortages of water resources, and provide support for improving disaster prevention and control strategies and water resource management.
Dongting Lake is the second largest freshwater lake in China and one of the most important large lakes in the middle and lower reaches of the Yangtze River. The water from the upper reaches of the Yangtze River and four rivers in the southern area enters Dongting Lake and then flows into the Yangtze River, forming a complex relationship with the Yangtze River [30]. The seasonal changes in the water boundary of the lake are significant, and the differences between the geometry of the lake and rivers are significant. Dongting Lake plays an irreplaceable role in intercepting water from the upper reaches, diverting and storing floods in the middle reaches, alleviating flood disasters in the lower reaches of the Yangtze River, regulating the regional climate, and maintaining the ecosystem balance [24,26,28]. In recent decades, due to increasingly natural activities, especially human activities, the morphology of Dongting Lake has undergone significant changes. Extreme hydrological events such as droughts and floods have occurred frequently, and the hydrological characteristics of the Dongting Lake area have undergone certain changes [31,32]. The relationship between the Yangtze River and Dongting Lake has also been continuously evolving.
Therefore, taking Dongting Lake as an example, this study employed wavelet analysis to explore the temporal characteristics of the water area, level, and flow of Dongting Lake from 2000 to 2021 on annual, seasonal and monthly scales based on a water area dataset derived from remote sensing images and monitoring data of water level and flow for four hydrological monitoring stations. Moreover, five types of models—including linear, exponential, logarithmic, quadratic polynomial, and cubic polynomial regressions—were used to fit and compare the water level–area and water flow–area correlations, and tenfold cross-validation was used to verify the reliability of these models. Our goal was to provide a new perspective for exploring the variation patterns of water area and the hydrological conditions of large lakes connected to rivers, to depict the complex relationships between rivers and lakes, and to support the management and regulation of water resources in lake areas as well as the early warning and prevention of drought and flood disasters.
2. Materials and Methods
2.1. Study Area
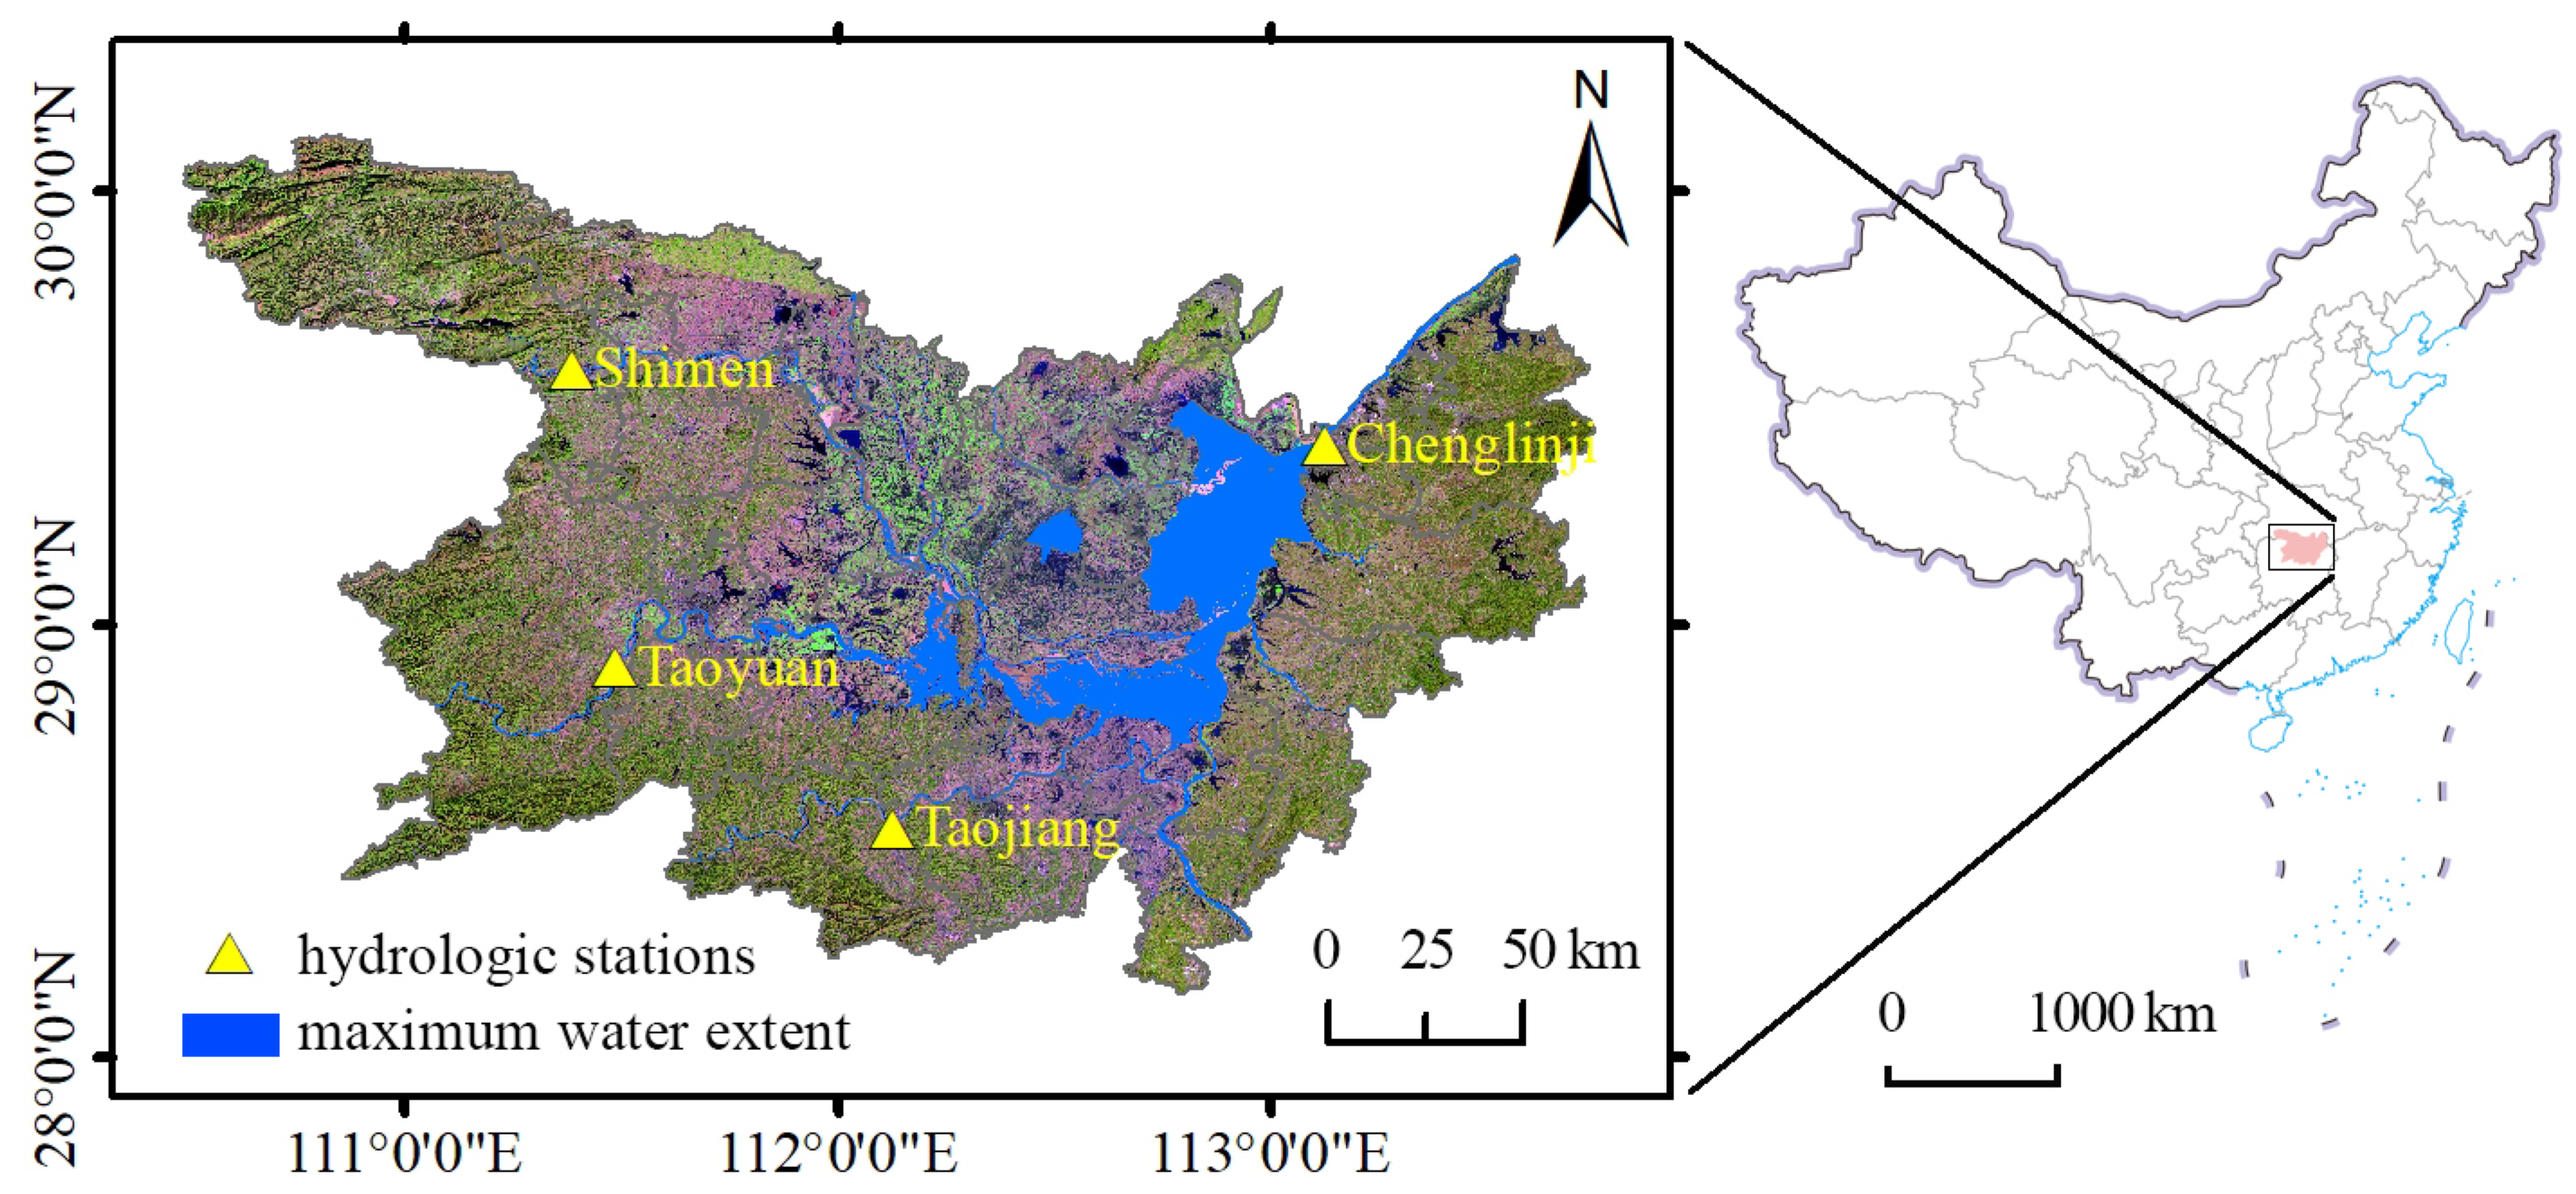
Dongting Lake District is located between 28°07′ N–30°08′ N and 110°29′ E–113°45′ E (Figure 1). It covers 23 districts and the counties of 4 cities, namely, Yueyang, Changde, Yiyang, and Changsha. The water from the upper reaches of the Yangtze River enters Dongting Lake through Songzi, Taiping, and Ouchi. Dongting Lake also receives water from four rivers, namely, Xiang, Zi, Yuan, and Li. After regulation and storage, it flows into the Yangtze River through the Chenglingji Port. It is a humid subtropical area with a monsoon climate, and the precipitation significantly differs seasonally.
2.2. Data Collection and Preprocessing
2.2.1. Surface Water Data
The research data include surface water data and water level and water flow monitoring data. Surface water data were derived from the Global Surface Water v4 provided by the Joint Research Centre (JCR). Global Surface Water v4 is a globally consistent, validated dataset documenting surface water location and seasonality; it is produced using many Landsat satellite images with expert systems, visual analytics and evidential reasoning at a 30 m resolution. We downloaded monthly and annual surface water data covering the Dongting Lake District from January 2000 to December 2021 from https://global-surface-water.appspot.com (accessed on 28 July 2023). Due to cloudy and rainy weather conditions, there are missing data for some months. The annual surface water data include two parts: permanent water and seasonal water. We therefore merged the permanent surface water of the corresponding year and monthly surface water of months or around months with missing areas through the raster calculator tool to replace the defective data. All surface water data during the study period are overlaid with Boolean OR operations, and the connected area with the largest area is extracted as the maximum water extent in the Dongting Lake District (Figure 1). Based on the maximum water extent, monthly water areas within the region are calculated. The seasonal means of spring (March, April, May), summer (June, July, August), autumn (September, October, November), and winter (December, January, February) and the annual means are also calculated for further analysis.
2.2.2. Water Level and Water Flow Data
Water level and water flow data were collected from the National Water and Rainfall Information platform (http://xxfb.mwr.cn/sq_dtcx.html) (accessed on 22 November 2023). This study collected hourly water level (m) and water flow (m3/s) data from four hydrological monitoring stations, Chenglingji, Shimen, Taojiang, and Taoyuan (Figure 1), around the maximum water extent within the Dongting Lake District from 1 January 2000, to 31 December 2021. Among them, Chenglingji is a control station on Dongting Lake where it meets the Yangtze River; Shimen, Taojiang, and Taoyuan are the hydrological stations for the Li, Zi, and Yuan Rivers, respectively. The sampling rate of the hydrological monitoring stations was once a day in the dry season, and the sampling time was 8:00; the sampling time lasted one hour a day in the flood season. We used measurements from 8:00 to calculate the monthly, seasonal, and annual means of water level and water flow.
2.2.3. Anomaly Calculation
Anomaly calculations were employed to analyze the variations in the monthly, seasonal and annual water area, water level, and flow from 2000 to 2021. Anomalies refer to the difference between the indicator value within a certain time period and the historical average of the same period, as shown below:
where represents the anomalies of monthly, seasonal and annual water area, level and flow for the ith year; is the monthly, seasonal and annual water area, level and flow for the ith year; and represents the average values of monthly, seasonal and annual water area, level and flow during the study period (2000–2021 in this study).
2.3. Wavelet Analysis of Water Area, Level and Flow Anomalies
Wavelet analysis was used to explore the temporal characteristics of water area, level and flow from 2000 to 2021 on annual, seasonal and monthly scales. Wavelet analysis is a new time–frequency localization and signal analysis method developed on the basis of Fourier analysis. It is very suitable for the analysis of nonstationary time series data and has been widely applied in hydrological data analysis.
Wavelet analysis decomposes the original signal into multiple scales. It is defined as a set of basic functions , also known as wavelet basis functions, that can be generated by translating and scaling the mother wavelet , as shown below:
where t is the time; a is the scaling parameter defining the scale at which the signal is analyzed; and b is the shift (localization) parameter determining the time at which the signal is studied.
There are many types of mother wavelets, among which the Morlet wavelet is a nonorthogonal complex function, with both the real and imaginary parts being Gaussian functions, which is suitable not only for statistical analyses but also for pattern recognition. We used the Morlet wavelet to conduct the continuous wavelet transform (CWT) in this study. The Morlet wavelet has the following form:
where t is the time; is the frequency.
The output of CWT is given as follows:
where is the original signal; is the time–frequency signal after transformation, i.e., the CWT coefficients constitute a two-dimensional scalogram of which one dimension is scale (1, 2, …, m) and the other is wavelength (or waveband, 1, 2, …, n).
The matrices of are calculated and defined as a wavelet scalogram of the function to explore the periodic patterns of water data. The matrices can yield the so-called ‘wavelet variance’ or wavelet spectrum, as shown below:
where is the wavelet variance, and are CWT coefficients. The larger the wavelet variance of a scale is, the more likely it is that the scale is the dominant amplitude for the data.
2.4. Correlation Analysis of Water Area and Water Level and Flow
The variation patterns of the monthly, seasonal, and annual water area, water level, water area and water flow at the four stations from 2000 to 2021 are compared. Moreover, taking water level/flow as the dependent variable and water area as the independent variable, five types of models—including linear, exponential, logarithmic, quadratic polynomial, and cubic polynomial regressions—are used to fit and compare the level–area and flow–area correlations at different temporal scales. Moreover, tenfold cross-validation is used to verify the reliability of these models. Tenfold cross-validation is used to randomly divide the dataset into 10 equal subsets. One subset is used as test data, and the remaining nine subsets are used as training data to construct the model and predict the test data. This process will be repeated ten times until every subset has been used as test data. The actual and predicted values of the test samples are then compared to calculate the coefficient of determination (R2), root mean square error (RMSE), and average relative error (ARE) to evaluate the performance of the models.
where represents the actual values of test samples, is the mean value for all test samples, and represents the predictive values of test samples.
3. Results
3.1. Multiscale Characteristics of the Water Area
3.1.1. Spatial Patterns of Surface Water
The spatial patterns of surface water in the Dongting Lake area from 2000 to 2021 are shown in Figure 2. Overall, the permanent water in Dongting Lake changed relatively little during the study period, while the amount of seasonal water varied significantly with time. The water area can be roughly characterized into three periods: 2000–2005, 2006–2015, and 2016–2021. The areas for the first and third periods are relatively large, and those for the second period are relatively small. Small fluctuations in the water area can also be found during each period. The large water areas for the first period, especially in 2000 and 2002, may be related to the relatively humid climate. During this period, the precipitation increased, and more catastrophic flooding occurred. For example, in 2002, the Dongting Lake District experienced continuous rainstorms from April to October, and floods occurred in five rivers that entered the lake. Continuous sunny and hot weather may have led to small water areas for the second period, especially in 2006, 2009, 2011, and 2013. For example, the middle and lower reaches of the Yangtze River experienced a rare drought in 2009, and in October of that year, the water level of Dongting Lake decreased to the lowest level in nearly 18 years. In 2013, most areas south of the Yangtze River in China experienced historically rare sustained high temperatures, with the highest number of scorching days occurring in nearly 50 years. The water areas gradually increased during the third period and were more significant in 2016, 2017, and 2020. Floods frequently occur in the Xiang, Zi, Yuan, and Li Rivers. In 2016, the Yangtze River experienced two large flood events, and the middle and lower reaches of the Yangtze River (as well as Dongting Lake and Poyang Lake) exceeded the warning level for the first time since 1999. In 2017, the entire Dongting Lake basin experienced a large flood event, and in 2020, Dongting Lake continued to exceed the warning level for 60 days.
3.1.2. Water Surface Area Anomalies
The annual, seasonal, and monthly water surface area anomalies of Dongting Lake from 2000 to 2021 are presented in Figure 3a. The annual anomalies roughly demonstrate a decreasing trend followed by an increasing trend. The anomalies from 2006 to 2015 are generally negative. The lowest and highest values were −406.67 km2 in 2011 and 306 km2 in 2020, respectively. This result is consistent with the hydrological trend in the study area. The extent of the variation in the seasonal anomalies followed the order autumn > summer > spring > winter. The lowest and highest values occurred in different years for different seasons, but they basically conformed to the three periods of spatial patterns. The area anomalies for the four seasons ranged from −323.46 km2 in 2011 to 518.51 km2 in 2016, from −658.27 km2 in 2008 to 596.04 km2 in 2002, from −746.17 km2 in 2006 to 811.28 km2 in 2020, and from −180.79 km2 in 2006 to 103.24 km2 in 2017. The general trends of the monthly water area anomalies were similar to those of the corresponding seasons (i.e., three periods), but there are certain differences among the months. For the four seasons, May, August, October, and January had the largest variation ranges, while March, July, November, and December had the smallest variation ranges. The largest ranges were −540.17 km2 (2011) to 1090.96 km2 (2003), −927.43 km2 (2006) to 1113.45 km2 (2020), −799.74 km2 (2006) to 1860.35 km2 (2017), and −254.80 km2 (2006) to 176.68 km2 (2017), while the smallest ranges were −214.58 km2 (2011) to 321.53 km2 (2017), −825.75 km2 (2008) to 605.86 km2 (2016), −382.35 km2 (2011) to 882.72 km2 (2020), and −158.27 km2 (2006) to 159.41 km2 (2016).
3.1.3. Wavelet Variance of Water Area Anomalies
Figure 3b shows the wavelet variance of annual, seasonal, and monthly area anomalies of Dongting Lake under different time scales (1–22a). The annual interval (scale) with the highest wavelet variance of the annual area anomalies was 9a, with a value of 2.10 × 10⁴. This means that the amplitudes of the annual area anomalies were dominant. The dominant amplitudes for seasonal area anomalies in spring, summer, autumn, and winter were different, at 8a, 11a, 9a, and 8a, respectively. The wavelet variances were 2.0 × 10⁴, 5.61 × 10⁴, 5.31 × 10⁴, and 2.50 × 10³, respectively. Within the four seasons, there were significant differences in the dominant amplitudes for the monthly area anomalies of Dongting Lake. The dominant amplitudes for March, April, and May were 19a, 17a, and 8a, with wavelet variances of 1.81 × 10⁴, 2.51 × 10⁴, and 8.69 × 10⁴, respectively. For June, July, and August, the dominant amplitudes were 11a, 9a, and 22a, and the wavelet variances were 1.21 × 10⁵, 8.79 × 10⁴, and 7.17 × 10⁴, respectively. The wavelet variances in August increased with scale without a decreasing trend; hence, 22a may only be the dominant amplitude during the study period. The dominant amplitudes and wavelet variances for September, October, and November were 7a, 20a, 9a and 1.40 × 10⁵, 1.43 × 10⁵, 3.58 × 10⁴, respectively, while those for November, January, and February were 9a, 8a, 16a and 2.14 × 10³, 5.45 × 10³, 6.51 × 10³.
3.2. Multiscale Characteristics of Water Level and Water Flow
3.2.1. Water Level and Water Flow Anomalies
The annual, seasonal, and monthly water level and water flow anomalies at Chenglingji station from 2000 to 2021 are presented in Figure 4a,c, while those at Shimen, Taojiang, and Taoyuan stations are presented in the Supplementary File (Figures S1a,c, S2a,c and S3a,c). As shown in the figures, the annual water level anomalies at Chenglingji station generally exhibited a decreasing trend. The level anomalies from 2006 to 2021 were generally negative except for those in 2010 and 2020. The lowest and highest values were −1.53 m in 2011 and 3.22 m in 2002, respectively. The water flow anomalies exhibited a similar trend to that of the water level, and the lowest and highest values were 3689.86 m3/s in 2011 and 8413.07 m3/s in 2002, respectively. The annual water level and water flow anomalies at Shimen and Taojiang stations demonstrated consistent variation trends; they varied greatly before 2006/2007 and then stabilized during the follow-up. The lowest and highest water level and water flow anomalies at Shimen station were −0.92 m and −456.04 m3/s, respectively, in 2006 and 1.38 m and 2108.47 m3/s in 2003. Those at Taojiang station were −1.45 m in 2018 and −450.71 m3/s in 2011, and 3.24 m and 1503.36 m3/s in 2002. For Taoyuan station, the water level and water flow anomalies varied notably; the lowest water level and water flow anomalies were −1.66 m in 2018 and −1828.03 m3/s in 2011, respectively, and the highest anomalies were 2.27 m and 3299.75 m3/s in 2005.
The extent of the seasonal variation in water level anomalies at Chenglingji station followed the order autumn > summer > spring > winter, which is consistent with the pattern of water area anomalies. The water flow anomalies at Chenglingji station and the water level and flow anomalies at Shimen, Taojiang, and Taoyuan stations followed the order summer > spring > autumn > winter. The level anomaly ranges at Chenglingji station for spring, summer, autumn, and winter were −2.09 m in 2011 to 2.15 m in 2016, −2.32 m in 2006 to 2.40 m in 2020, −2.78 m in 2006 to 2.57 m in 2020, and −0.85 m in 2004 to 0.76 m in 2016, respectively; the ranges of the flow anomalies were −4845.36 m3/s in 2011 to 4177.43 m3/s in 2016, −5042.50 m3/s in 2011 to 7448.05 m3/s in 2002, −3633.04 m3/s in 2006 to 5929.10 m3/s in 2020, and −1605.41 m3/s in 2004 to 1342.88 m3/s in 2016. The seasonal water level and water flow anomalies at Shimen, Taojiang, and Taoyuan stations ranged from −1.45 m in 2006 to −2.02 m in 2011 and −1.46 m in 2006; from −861.82 m3/s in 2006 to −686.03 m3/s in 2011 and −2300.45 m3/s in 2006; from 2.27 m in 2003 to 3.59 m in 2002 and 2.98 m in 2004; and from 3612.65 m3/s in 2003 to 1924.16 m3/s in 2002 and −4663.64 m3/s in 2004 in summer. In winter, they ranged from −0.55 m in 2004 to −0.96 m in 2018 and −1.49 m in 2017; from −126.89 m3/s in 2004 to −260.13 m3/s in 2004 and −455.72 m3/s in 2016; from 0.45 m in 2018 to 1.81 m in 2002, and 0.77 m in 2003; and from 131.45 m3/s in 2018 to 209.87 m3/s in 2020 and 666.09 m3/s in 2020.
The variation patterns of the monthly water level and water flow anomalies during the study period at the four stations were moderately different in summer and quite different in autumn and winter from the patterns of the area anomalies. The largest and smallest variation ranges of the level and flow anomalies occurred in May and March (in spring), respectively, for all four stations. In summer, the variation trends at Chenglingji and Taojiang stations were similar and consistent with those of the area anomalies, with the largest variation occurring in August and the smallest occurring in July. Shimen and Taoyuan stations, however, exhibited the greatest variation in July, while the smallest variation occurred in August and June. In autumn, the largest variation ranges of level and flow anomalies occurred in September at Chenglingji and Shimen stations and in November at Taojiang and Taoyuan stations. The level and flow anomaly variation ranges were smallest in November at Chenglingji station, while they were smallest in October for the other three stations. In winter, the variation pattern at Taojiang station differed from that at the other three stations. The largest and smallest ranges for Taojiang station and the other stations occurred in February and December and in December and January, respectively.
3.2.2. Wavelet Variance of Water Level and Water Flow Anomalies
Figure 4b,d show the wavelet variance of the annual, seasonal, and monthly water level and water flow anomalies at Chenglingji station on the different time scales (1–22a), while those at Shimen, Taojiang, and Taoyuan stations are presented in the Supplementary File (Figures S1b,d, S2b,d and S3b,d). The dominant amplitudes for the annual water level and flow anomalies at Chenglingji station were both 5a; their wavelet variances were 0.92 and 3.61 × 10⁶, respectively, which were smaller than those of the area anomalies (9a). The dominant amplitudes for the level and flow at Shimen, Taojiang, and Taoyuan stations were (4a and 4a), (5a and 5a), and (4a and 6a), respectively; their wavelet variances were (0.12 and 1.55 × 10⁵), (1.28 and 1.24 × 10⁵), and (0.49 and 9.61 × 10⁵), respectively.
The dominant amplitudes for the seasonal water level and water flow anomalies at Chenglingji station in spring, summer, autumn, and winter were different (13a, 9a, 9a, and 12a and 5a, 5a, 20a, and 12a, respectively). The dominant amplitudes at Shimen station in spring and summer were similar to the annual values, while those in autumn and winter were much greater (4a, 4a, 9a, and 9a and 5a, 5a, 20a, and 12a, respectively). Except for that of autumn, which has relatively larger dominant amplitudes for seasonal water flow anomalies, the dominant amplitudes at Taojiang station for the other seasons were close to the annual amplitudes (3a, 5a, 3a, and 3a and 5a, 5a, 9a, and 5a, respectively). For Taoyuan station, the dominant amplitudes were larger than those at the other stations, especially for autumn and winter (4a, 7a, 19a, and 18a and 5a, 6a, 9a, and 20a), respectively.
There were significant differences in the dominant amplitudes of the monthly water level and water flow anomalies between stations and between months. The wavelet variances of January and February were not calculated for Shimen, Taojiang, and Taoyuan stations due to the lack of monitoring data. The dominant amplitudes for the monthly water level and for the monthly water flow anomalies at Chenglingji station for March, April, and May were (20a, 18a, and 4a) and (19a, 18a, and 5a), respectively. For June, July, and August, the dominant amplitudes were (12a, 11a, and 7a) and (11a, 19a, and 6a), respectively. The three months of autumn had the same dominant amplitudes for level and flow, with values of 21a, 20a, and 9a. For November, January, and February, the dominant amplitudes were (17a, 16a, and 20a) and (17a, 17a, and 20a), respectively. The dominant amplitudes for level and flow anomalies in March, April, May, June, July, August, September, October, November, and December were (17a, 4a, 3a, 5a, 4a, 9a, 9a, 7a, 10a, and 14a) and (18a, 4a, 3a, 5a, 4a, 9a, 13a, 7a, 10a, and 15a) at Shimen station; (6a, 3a, 5a, 5a, 5a, 4a, 8a, 3a, 10a, and 3a) and (17a, 12a, 5a, 7a, 19a, 3a, 21a, 21a, 9a, and 15a) at Taojiang station; and (11a, 19a, 4a, 9a, 6a, 5a, 21a, 19a, 10a, and 17a) and (17a, 16a, 4a, 16a, 6a, 5a, 21a, 20a, 10a, and 17a) at Taoyuan station.
3.3. Water Level–Area and Flow–Area Variations of Dongting Lake
The variations in the annual, seasonal, and monthly water areas of Dongting Lake and the water levels and flows at Chenglingji, Shimen, Taojiang, and Taoyuan stations from 2000 to 2021 and their relationships are summarized in Figure 5. In general, among the four stations, the water level and flow at Chenglingji station were most significantly related to the water area of Dongting Lake, and the significance followed a temporal order of seasonal > monthly > annual.
3.3.1. Water Level–Area and Flow–Area Variations at the Annual Scale
At the annual scale, except for 2002 to 2003 (28.99–27.28 m vs. 2183.05–2191.68 km2) and 2012 to 2013 (25.81–24.62 m vs. 1928.06–2010.82 km2), which had opposite change trends, the water level at Chenglingji station and water area showed similar increasing and decreasing trends during the study period. There were certain differences in the increasing and decreasing trends between the water flow and water area. These changed in the opposite direction from 2002 to 2003 (17,156.03–9912.95 m3/s vs. 2183.05–2191.68 km2), from 2004 to 2005 (9845.94–9046.66 m3/s vs. 2124.35–2194.95 km2), and from 2012 to 2013 (8979.12–7147.86 m3/s vs. 1928.06–2010.82 km2). The differences between the variation rates of flow and area were relatively large from 2001 to 2002, 2009 to 2010, and 2010 to 2011, with rates of 124.27% vs. 8.09%, 73.79% vs. 12.06%, and 77.70% vs. 18.89%, respectively. Moreover, the water levels at Shimen, Taojiang, and Taoyuan stations and the water area exhibited varying degrees of difference in terms of change trends, which was most notable at Shimen station; they exhibited opposite change trends in 8, 5, and 5 years, respectively. The water flow and water area correlation slightly differed from the level–area correlation. Shimen station had fewer years (i.e., 5 years) with opposite trends, while Taoyuan and Taojiang stations had more (i.e., 7 and 6 years).
3.3.2. Water Level–Area and Flow–Area Variations on the Seasonal Scale
On the seasonal scale, water level–area and flow–area correlations at Chenglingji station exhibited similar trends in variation. In contrast, they exhibited opposite trends from summer to autumn (2014, 2017, and 2021) and from winter to spring (2001, 2007, 2010, and 2014). Moreover, the level and area exhibited opposite trends from autumn to winter in 2006 and from summer to autumn in 2008, and the flow and area exhibited opposite trends from autumn to winter (2016 and 2019). The differences between the variation rates of level and area were greater than 30% in 8 out of 88 seasons, while the differences between the variation rates of flow and area were greater than 100% in 14 seasons. The season change was from spring to summer and from winter to spring, respectively.
Comparatively, more seasons experienced opposite variation trends, and the differences between the variation rates were greater at Shimen, Taojiang, and Taoyuan stations. At Shimen station, opposite variation trends occurred in 16 seasons for level–area correlation and in 20 seasons for flow–area correlation. A total of 33 seasons had level–area differences greater than 30%, and 10 seasons had differences greater than 50%. Twenty-seven seasons had flow–area differences greater than 100%. For Taojiang station, 31 seasons exhibited opposite level–area changes, and 29 seasons exhibited opposite flow–area changes. Thirty-six seasons had level–area differences larger than 30%, and in these same seasons, Shimen station had differences larger than 50%. Sixteen seasons had flow–area differences greater than 100%. For Taoyuan station, opposite variation trends occurred in 18 seasons for level–area and flow–area. Thirty-one seasons had level–area differences greater than 30%. Moreover, except for 2004, seasons with level–area differences larger than 50% at Taoyuan station were the same as those at Shimen and Taojiang stations. Some 22 seasons had flow–area differences greater than 100%, and in 15 of these seasons, the season change was from winter to spring.
3.3.3. Water Level–Area and Flow–Area Variations at the Monthly Scale
At the monthly scale, 66 out of 264 months at Chenglinji station exhibited opposite level–area changes. February, March, and December were the top three months for opposite trends, occurring 10, 10, and 9 times, respectively. In contrast, 79 months had opposite flow–area changes, and February, June, and December were the top three months (9, 9, and 12, respectively). A total of 27 months had level–area differences greater than 30%, and 13 months had level–area differences greater than 50%. There were 13 months with flow–area differences greater than 100%. At Shimen, Taoyuan, and Taojiang stations, 119, 113, and 96 out of 262 months had opposite level–area changes; 119, 111, and 95 months had opposite flow–area changes. The top months for opposite level–area changes were February, August, and December; February, June, August, and December; and June, August, and November. The number of months with opposite change trends were 13, 16, and 13; 14, 11, 13, and 11; and 12, 13, and 10, respectively. The top months for opposite flow–area changes for these stations were January, August, and December; February, June, and August; and June, August, and November. The number of months with opposite change trends were 12, 16, and 14; 13, 11, and 12; and 13, 15, and 10, respectively. Moreover, 46, 43, and 41 and 18, 18, and 16 months had level–area differences larger than 30% and 50%, respectively; 61, 31, and 40 months had flow–area differences larger than 100%. These differences usually occurred in March, April, and May; October and December; and March, April, and May, respectively.
3.4. Water Level–Area and Flow–Area Correlation Models for Dongting Lake
3.4.1. Tenfold Cross-Validation Accuracy
The results of tenfold cross-validation for annual, seasonal, and monthly water level–area and flow–area correlation models of Dongting Lake from 2000 to 2021 are presented in Table 1 and Table 2.
For the level–area correlation, the validation R2, RMSE, and ARE for the annual exponential model at Chenglingji station were 0.4, 0.92 m, and 2.49%, respectively, while those for the linear model were close to the same R2 and RMSE but had a higher ARE (2.51%). There was no statistical significance in any of the five annual models for Shimen station. The best-performing annual models for Taojiang and Taoyuan stations were logarithmic, and their validation R2, RMSE, and ARE values were 0.08, 1.22 m, and 2.9% and 0.15, 0.9 m, and 2.03%, respectively. At the seasonal scale, the R2, RMSE, and ARE for the quadratic polynomial model at Chenglingji station were 0.8, 1.37 m, and 4.53%, respectively, while those for the linear and cubic polynomial models were close to the same R2 but had higher RMSE and ARE values (1.39 m, 4.55% and 1.38 m, and 4.58%, respectively). The best-performing seasonal models for Shimen and Taojiang station were linear, and their validation R2, RMSE, and ARE values were 0.18, 0.64 m, and 0.95% and 0.07, 1.23 m, and 2.86%, respectively. The best-performing seasonal model for Taoyuan station was exponential, with R2, RMSE, and ARE values of 0.3, 1.31 m, and 3.14%, respectively. At the monthly scale, R2, RMSE, and ARE for the quadratic polynomial model at Chenglingji station were 0.72, 1.81 m, and 5.62%, respectively, while those for the cubic polynomial model were close, with the same accuracy. The best-performing monthly models for Shimen and Taojiang stations were exponential, and their validation R2, RMSE, and ARE values were 0.13, 0.83 m, and 1.13% and 0.06, 1.4 m, and 3.21%, respectively. The best-performing monthly model for Taoyuan station was logarithmic, with R2, RMSE, and ARE values of 0.23, 1.72 m, and 3.86%, respectively.
For flow–area correlation, the validation R2, RMSE, and ARE values for the annual exponential model at Chenglingji station were 0.29, 2051.1 m3/s, and 13.1%, while those for the linear model were similar, at 0.28, 2059.37 m3/s, and 13.17%. There was no statistical significance in any of the five annual models for Shimen station. The best-performing annual models for Taojiang and Taoyuan stations were exponential and quadratic polynomial, respectively, and their validation R2, RMSE, and ARE values were 0.12, 372.84 m3/s, and 24.68% and 0.16, 1163.8 m3/s, and 30.74%, respectively. At the seasonal scale, the models for the four stations were all linear. Their accuracy ranked in the following order: Chenglingji > Taojiang > Taoyuan > Shimen. Their R2, RMSE, and ARE values were 0.6, 2712.39 m3/s, and 34.72%; 0.14, 533.67 m3/s, and 207.87%; 0.16, 430.96 m3/s, and 57.11%; and 0.33, 1455.43 m3/s, and 76.14%, respectively. At the monthly scale, the models for the four stations were also linear. The accuracy sequence was the same as the seasonal sequence, and the R2, RMSE, and ARE values were 0.49, 3580.58 m3/s, and 45.07%; 0.08, 758.74 m3/s, and 364.75%; 0.1, 617.66 m3/s, and 84.58%; and 0.21, 2121.65 m3/s, and 108.3%, respectively.
3.4.2. Fitting Curves of Level–Area and Flow–Area Correlations
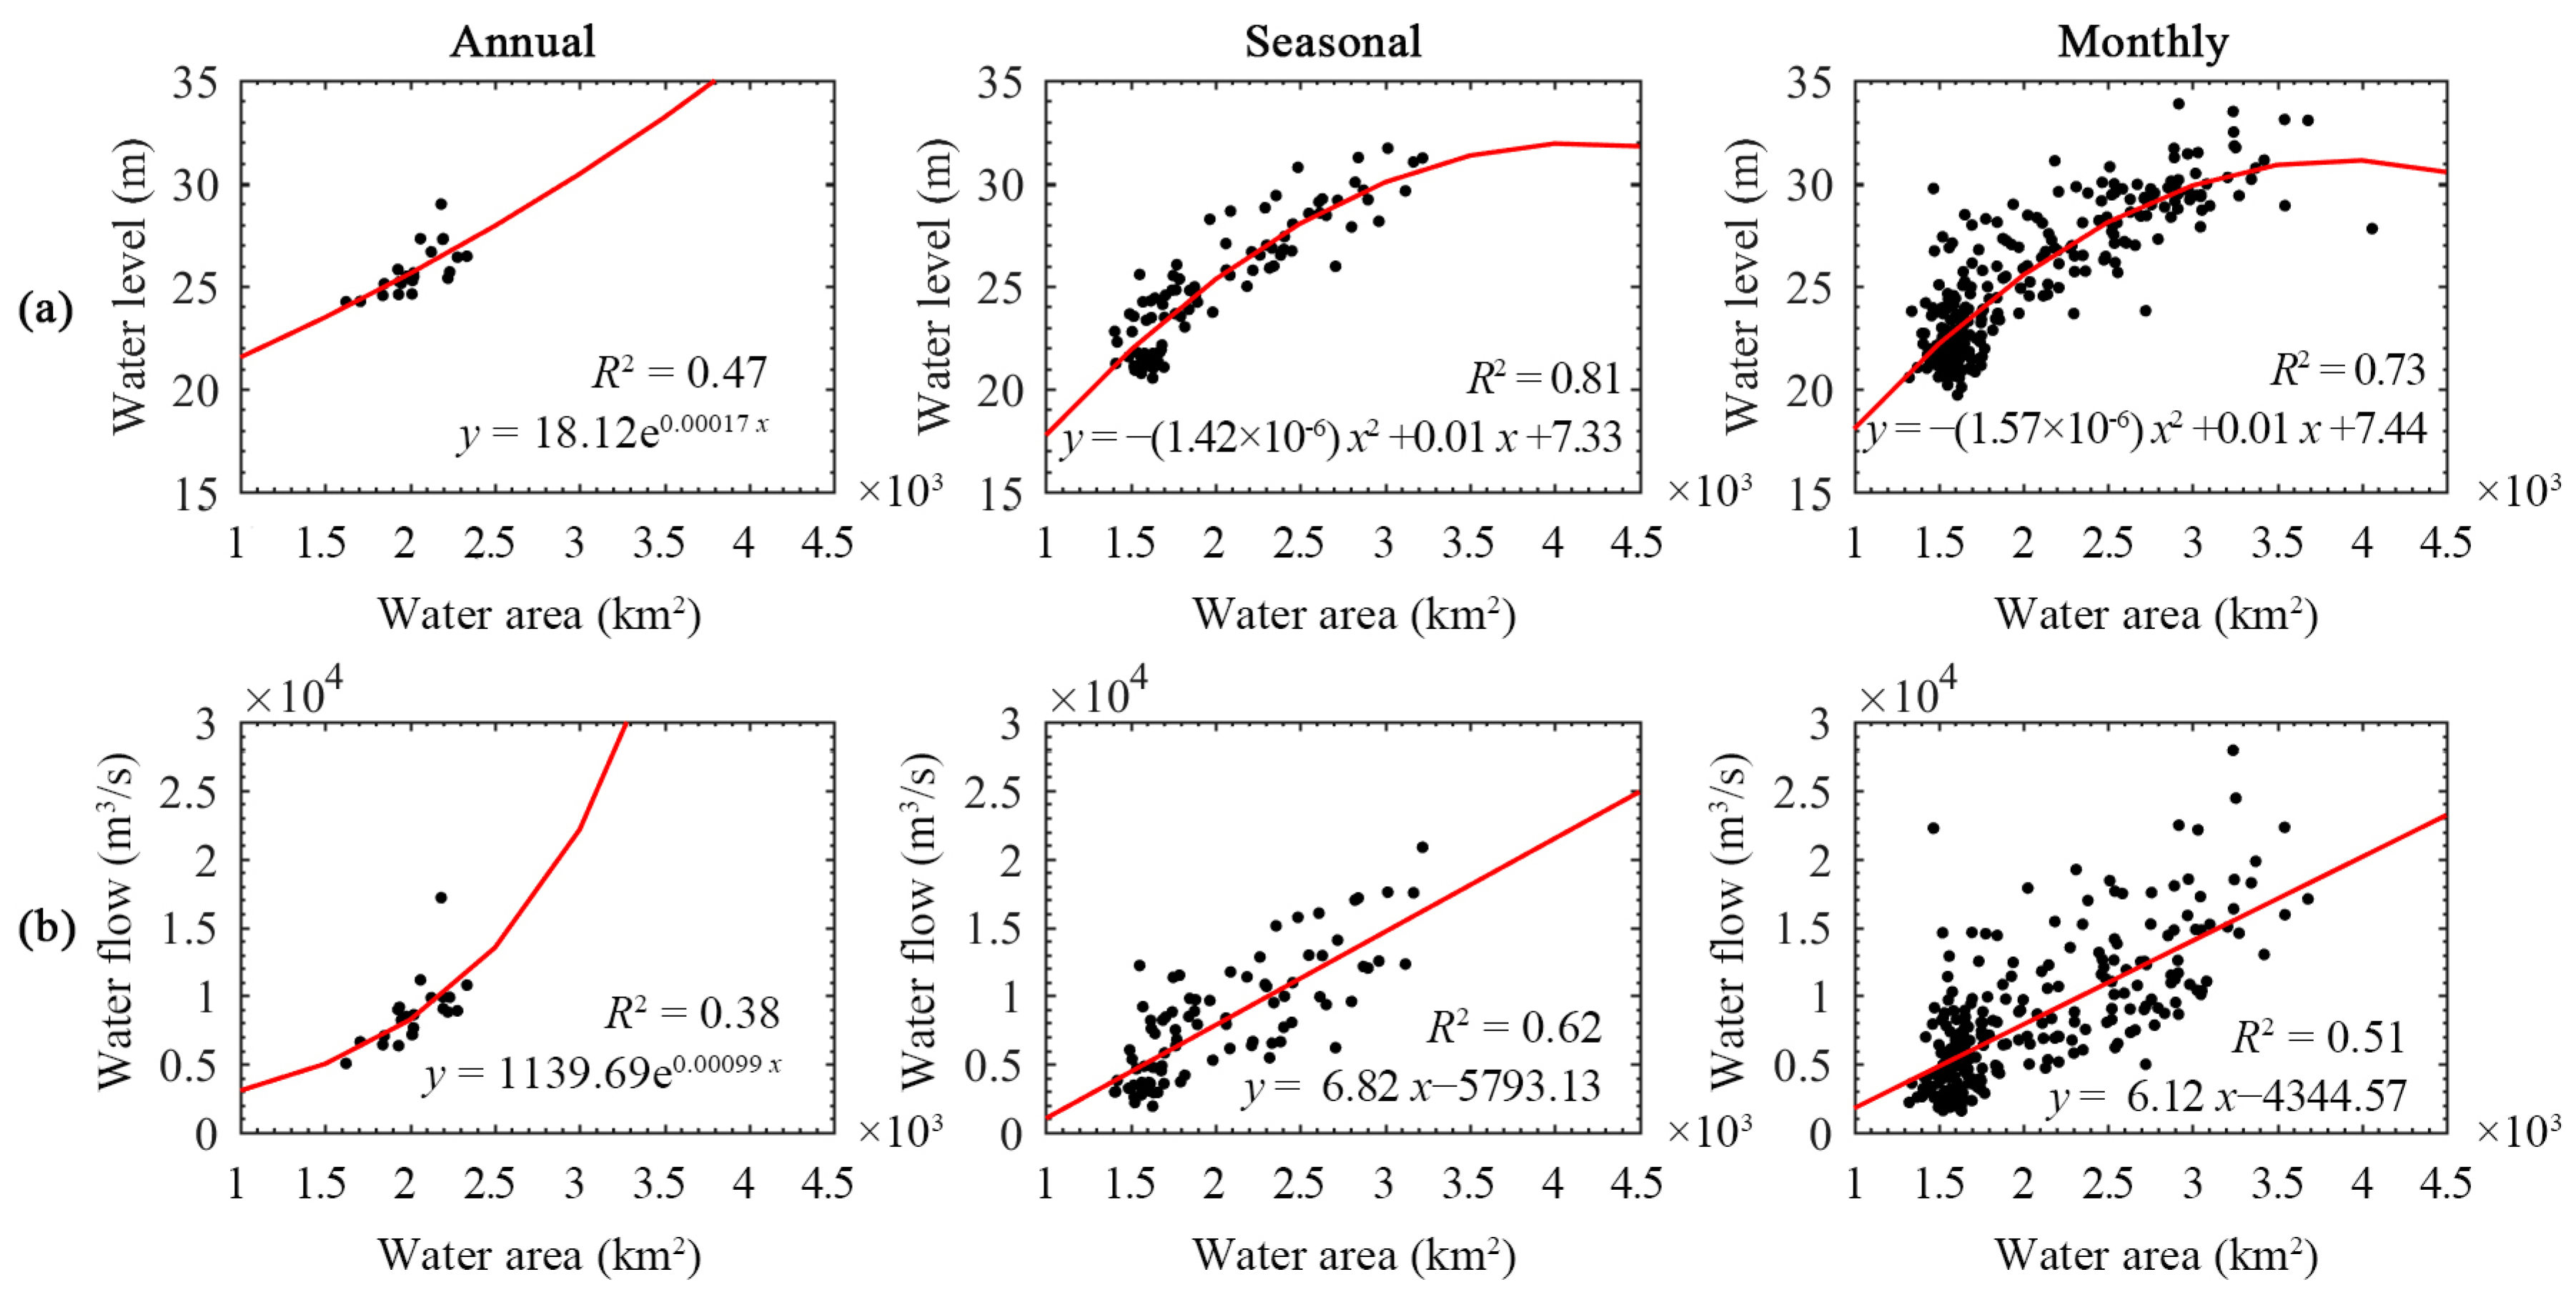
Based on the best performing models of validation results, the fitting curves of the annual, seasonal, and monthly correlations between the water level and water flow at Chenglingji station and the surface water area in Dongting Lake from 2000 to 2021 are shown in Figure 6. The annual, seasonal, and monthly level–area fitting equations were , , and , and the flow–area fitting equations were , , and . The model fitting R2 values of the annual level–area and flow–area models were 0.47 and 0.38, respectively, which were higher than those of the model validation (0.4 and 0.29), possibly because of the limited number of samples at this scale. The model fitting R2 values of the seasonal and monthly level–area and flow–area models were 0.81 and 0.62 and 0.73 and 0.51, respectively, which were 0.01–0.02 greater than those of the model validation models (0.8, 0.6, 0.72, and 0.49).
4. Discussion
4.1. Water Area, Level and Flow Variations and the Hydrological Processes in Dongting Lake
The temporal characteristics of water area in Dongting Lake from 2000 to 2021 indicate that surface water extracted from remote sensing images can reveal the interannual and seasonal variation patterns of Dongting Lake during the study period and, to some extent, can reflect the monthly variation. The overall trends in annual, seasonal, and monthly water area anomalies from 2000 to 2021 were consistent, but there were differences in the variation ranges at different temporal scales. The three periods of 2000–2005 (large), 2006–2015 (small), and 2016–2021 (large) for annual water area anomalies were roughly consistent with the trend of first decreasing and then increasing, as seen in studies by Cao et al. (2020) and Wang et al. (2022) [33,34]. This is probably related to the frequency and severity of hydrological and meteorological droughts or flood events. The human activities in the Yangtze River Basin and around the Dongting Lake, such as the operation of the Three Gorges Dam in 2003, the implementation of the Planning of Dongting Lake Ecological Economic Zone in 2014, etc., may also have a large but gradual impact on the water area changes [35,36]. The extent of variation in seasonal water area anomalies (autumn > summer > spring > winter) is consistent with the study of Wang et al. (2022) [33] but slightly different from the study of Cao et al. (2020) [34] (summer > autumn >spring > winter). The highest and lowest values for different months occurred in different years, which is also similar to the results of Wang et al. (2022) [33]. However, except for the minimum values in July (2008) and August (2006) and the maximum value in October (2020), the specific years of occurrence are different. The consistency of seasonal and monthly water area anomalies between our study and previous studies appeared in the main flood seasons of the Yangtze River main stream (July to September) and the Xiang, Zi, Yuan, and Li Rivers (June to August) as well as the rainy season (April to June) of the study area [37]. The summer and autumn encompass parts of these periods and the possibility of significant changes in the seasonal water area is greater, resulting in a larger range of interannual variation in its anomalies and a larger variance in its wavelet analysis. The differences in seasonal and monthly water area anomalies compared to previous studies are probably because of the differences in the accuracy of the satellite-derived water area and the differences in the study period (2000–2021 vs. 1987–2020, 2001–2017). The dominant amplitudes of wavelet analysis for annual, seasonal, and monthly area anomalies in Dongting Lake were also different; they were similar at annual (9a) and seasonal scales (8~11a), while there were larger amplitudes of monthly variation in each season. This can help us to develop early warning plans and related strategies for drought and flood risk prevention and control from a macro perspective.
The annual, seasonal, and monthly water level and water flow anomalies at different stations varied widely. Among them, Chenglingji station had the largest range of varied level and flow anomalies, and the annual water level anomalies demonstrate a decreasing trend since 2006, which is consistent with the study of Lu et al. (2022) [38]. Moreover, water level at Chenglingji station demonstrated the most consistent seasonal characteristics with the surface water area of Dongting Lake (autumn > summer > spring > winter). This is probably because the Chenglingji station is the only outlet for the water in Dongting Lake to flow into the Yangtze River. It is affected by four rivers as well as the Yangtze River [39]. The ranges of variation in water flow may thus be larger compared to the other three stations, and the seasonal effect of the water level may be more consistent with their flood seasons. The extent of the seasonal variation in water level and water flow anomalies at the other three stations was in the following order: summer > spring > autumn > winter. This may be because the summer and spring overlap with the main flood seasons of the Zi, Yuan, and Li Rivers (June to August) and the rainy season (April to June). Moreover, the monthly water level and water flow of the four hydrological stations deviated from the variation patterns of the three periods for surface water. Some of the lowest level and flow anomalies occurred in the first and third periods (i.e., with relatively large surface water). This is probably because of the water storage and release of large dams in the Yangtze River basin, which to some extent reduced the peak flow and elevated the low flow [39]. The dominant amplitudes of the wavelet analysis for the annual, seasonal, and monthly water level and water flow anomalies at the four stations were also different. The annual level and flow anomalies had rather close dominant amplitudes (3~5a) at all stations, and they were smaller than those of the annual area anomalies. There were significant differences in the dominant amplitudes between seasons and months. Except for at Taojiang station, the dominant amplitudes for seasonal level and flow anomalies in autumn and winter (9~20a) were greater than those for annual anomalies and were close to or greater than those for seasonal area anomalies. Moreover, the dominant amplitudes of the monthly level and flow anomalies were close to or greater than those of the seasonal anomalies. Multiscale analysis of water level and water flow can provide support for further understanding of the hydrological processes in Dongting Lake, precise control and rational utilization of water resources in the middle and lower reaches of the Yangtze River, and maintenance of water safety in Dongting Lake.
4.2. Water Level–Area, Flow–Area and River-Lake Correlations
The satellite-derived water areas of Dongting Lake and the water level and water flow at the four stations exhibited varying degrees of correlation at annual, seasonal and annual scales. Chenglingji station had the most significant correlation, followed by Taoyuan station and then by Taojiang and Shimen stations. This is consistent with the ranges of variation in water level and water flow anomalies for the four stations. We found that the larger the water flow of the station, the more significant the correlation. Hydrological conditions in Chenglingji station are reflective of water in Dongting Lake flowing into the Yangtze River and from four rivers into the Yangtze River; in Taoyuan, Taojiang, and Shimen stations, conditions are reflective of water flow from the Yuan, Zi and Li Rivers. Moreover, the level–area and flow–area correlations were most significant on the seasonal scale, followed by the annual and monthly scales. Some months within summer and winter seasons on the monthly scale exhibited notable differences between the level and area variations and between the flow and area variations. It can be seen that the seasonal effects (drought and flood seasons and rainfall) have a significant impact on the correlations. This is probably because the water in Dongting Lake mainly flows into and from different rivers between seasons. The water mainly flows from four rivers in winter and early spring, and water exchange between Dongting Lake and the Yangtze River during this period is relatively limited. In late spring and summer, the rivers gradually enter the main flood seasons, and water mainly flows from four rivers; water exchange between Dongting Lake and the Yangtze River increases and becomes the main inflow and outflow until early autumn. During the late autumn, water from four rivers and the Yangtze River decreases, but water still flows into the Yangtze River [30]. At the monthly scale, however, there may be a delayed reaction in changes in water area changes in response to variations in water level and water flow. The relatively higher uncertainty compared to seasonal scale in satellite-derived water area could also lead to a disagreement between the water area and the water level and flow [16].
Tenfold cross-validation results of water level–area and flow–area correlation models further confirmed the relationship differences between stations and the seasonal characteristics of the level–area and flow–area correlations. Among the four stations, the water level–area and flow–area correlation models at Chenglingji station performed best, and they followed a scale sequence of seasonal > monthly > annual. This is consistent with the results of the water level–area and flow–area variation analyses. The best-performing annual, seasonal, and monthly models for the level–area were the exponential, quadratic polynomial, and quadratic polynomial, respectively, while for the flow–area, they were the exponential function, linear function, and linear function, respectively. This implies that the variation rates of water area in Dongting Lake can be unsteady and different from those of water level and water flow at Chenglingji station at different scales. Compared with previous studies with relatively high model fitting R2 values for level–area correlations (>0.9) [24,26], the accuracy at the seasonal scale is acceptable, while that at the annual and monthly scales is relatively low. This is probably because (1) unlike previous studies that mainly focused on the East Dongting Lake area directly related to the Chenglingji hydrological station, this study is based on the entire Dongting Lake area and includes parts such as South Dongting Lake and West Dongting Lake; (2) this model of water level–area and water flow-correlations for the study period from 2000 to 2021 at annual, seasonal, and monthly scales, the average process of area, level and flow will smooth the data variation and make correlations more rough compared to studies based on daily water area and water level data; (3) the limited number of samples at the annual scale may influence the performance and representativeness of models; (4) the relatively high uncertainty in water area at the monthly scale can conceal the correlations to some extent. However, still, the exploration of water level–area and flow–area correlations in this study can provides a multiscale perspective on the understanding of the complex relationships between rivers and lakes and will support the establishment and optimization of river and lake dynamic models and the management and regulation of water resources in lakes and rivers.
4.3. Limitations and Future Researches
There are still some limitations to this study. JRC surface water data used in this study were extracted from Landsat images, and despite the good validation performance on most data (accuracy for TM, ETM+ and OLI ranged from 97.8% to 99.7% for permanent water and from 73.8% to 98.8% for seasonal water), there were inevitable missing areas for some months (e.g., April 2000, January 2007, January 2015, etc.) due to unfavorable observation conditions [16]. Even if adjustments have been made, there were greater uncertainties in the water area data of this study than in those extracted from high-quality remote sensing images, with high extraction accuracy. It may influence the analysis results of temporal characteristics of water area and the accuracy of water level–area and flow–area models especially at the monthly scale to some extent. Future work can focus on the extraction of high-quality surface water data at high temporal resolutions. Multi-source remote sensing data such as sentinel, HJ and other higher solution data and deep learning methods for water detection and data fusion can be used. Although the multiscale analysis of water level–area and flow–area correlations can reflect the characteristics of the lake-river relationship to some extent, the underlying mechanisms are complex and a number of factors can influence this relationship besides climate, human activities and topography. Further deep, comprehensive, and quantitative analysis of the cause and influence of the water exchanges is needed. It would be helpful to expand and refine the statistical analysis that combined satellite-derived data and hydrological observation data in this study with hydrological system models, physics-based lumped frameworks of numerical models, and machine learning methods [40,41].
5. Conclusions
This study takes the Dongting Lake District as an example and explores the temporal and periodic characteristics of satellite-derived water area and station-derived water levels and flows and their correlations at monthly, seasonal, and annual scales using wavelet analysis and curve models. The main conclusions are as follows:
- (1)
- The variations in the annual, seasonal, and monthly water area anomalies from 2000 to 2021 exhibited rather consistent overall trends, but the differences in the variation ranges were relatively notable at the different temporal scales. The periodic patterns of the area anomalies also varied with scale; the dominant amplitudes of the annual and seasonal area anomalies ranged from 8a to 11a, while the dominant amplitudes of the monthly anomalies were much greater.
- (2)
- The variations in annual, seasonal, and monthly water level and water flow anomalies from 2000 to 2021 demonstrated different trends among the hydrologic stations. Chenglingji station had the largest variation range among the stations. The dominant amplitudes of the water level and flow anomalies at the different time scales generally followed the order of annual < seasonal < monthly. They ranged from 3a to 5a at the annual scale, while they could be much larger and more variable between seasons, months and stations at seasonal and monthly scales.
- (3)
- The water level–area and water flow–area correlations varied with temporal scale and station. They were most strongly correlated at Chenglingji station, followed by Taoyuan and then by Taojiang and Shimen stations, and they were most strongly correlated on the seasonal scale, followed by the monthly and annual scales. The best performing annual, seasonal, and monthly level–area and flow–area models for Chenglingji station were the exponential, quadratic polynomial, and quadratic polynomial models and the exponential, linear, and linear models, respectively.
Supplementary Materials
The following supporting information can be downloaded at: https://www.mdpi.com/article/10.3390/w16091198/s1, Figure S1: Annual/seasonal/monthly (a) water level anomalies, (b) wavelet variance of water level anomalies, (c) water flow anomalies, and (d) wavelet variance of water flow anomalies at Shimen station of Dongting Lake; Figure S2: Annual/seasonal/monthly (a) water level anomalies, (b) wavelet variance of water level anomalies, (c) water flow anomalies, and (d) wavelet variance of water flow anomalies at Taojiang station of Dongting Lake; Figure S3: Annual/seasonal/monthly (a) water level anomalies, (b) wavelet variance of water level anomalies, (c) water flow anomalies, and (d) wavelet variance of water flow anomalies at Taoyuan station of Dongting Lake.
Author Contributions
Conceptualization, S.X.; Data curation, S.X.; Formal analysis, S.X.; Writing—original draft, S.X.; Writing—review and editing, L.Z., B.Z. and H.S. All authors have read and agreed to the published version of the manuscript.
Funding
This research was funded by the State Key Laboratory of Geo-Information Engineering and Key Laboratory of Surveying and Mapping Science and Geospatial Information Technology of MNR, CASM (2022-02-10).
Data Availability Statement
The surface water data presented in this study are openly available in Joint Research Centre (JCR) at https://global-surface-water.appspot.com (accessed on 28 July 2023). Water level and water flow data are openly available on the National Water and Rainfall Information platform of China at http://xxfb.mwr.cn/sq_dtcx.html (accessed on 22 November 2023).
Conflicts of Interest
The authors declare no conflicts of interest.
References
- Brunner, P.; Simmons, C.T.; Cook, P.G. Spatial and temporal aspects of the transition from connection to disconnection between rivers, lakes and groundwater. J. Hydrol. 2009, 376, 159–169. [Google Scholar] [CrossRef]
- Gardner, J.R.; Pavelsky, T.M.; Doyle, M.W. The Abundance, Size, and Spacing of Lakes and Reservoirs Connected to River Networks. Geophys. Res. Lett. 2019, 46, 2592–2601. [Google Scholar] [CrossRef]
- Yu, S.-Y.; Colman, S.M.; Lowell, T.V.; Milne, G.A.; Fisher, T.G.; Breckenridge, A.; Boyd, M.; Teller, J.T. Freshwater outburst from Lake Superior as a trigger for the cold event 9300 years ago. Science 2010, 328, 1262–1266. [Google Scholar] [CrossRef] [PubMed]
- Woolway, R.I.; Verburg, P.; Lenters, J.D.; Merchant, C.J.; Hamilton, D.P.; Brookes, J.; de Eyto, E.; Kelly, S.; Healey, N.C.; Hook, S.; et al. Geographic and temporal variations in turbulent heat loss from lakes: A global analysis across 45 lakes. Limnol. Oceanogr. 2018, 63, 2436–2449. [Google Scholar] [CrossRef]
- Yao, F.; Livneh, B.; Rajagopalan, B.; Wang, J.; Cretaux, J.-F.; Wada, Y.; Berge-Nguyen, M. Satellites reveal widespread decline in global lake water storage. Science 2023, 380, 743–749. [Google Scholar] [CrossRef] [PubMed]
- Guo, M.; Wu, W.; Zhou, X.; Chen, Y.; Li, J. Investigation of the dramatic changes in lake level of the Bosten Lake in northwestern China. Theor. Appl. Climatol. 2014, 119, 341–351. [Google Scholar] [CrossRef]
- Odongo, V.O.; van der Tol, C.; van Oel, P.R.; Meins, F.M.; Becht, R.; Onyando, J.; Su, Z. Characterisation of hydroclimatological trends and variability in the Lake Naivasha basin, Kenya. Hydrol. Processes 2015, 29, 3276–3293. [Google Scholar] [CrossRef]
- Wrzesiński, D.; Ptak, M. Water level changes in Polish lakes during 1976–2010. J. Geogr. Sci. 2016, 26, 83–101. [Google Scholar] [CrossRef]
- Ye, X.; Xu, C.-Y.; Zhang, Q.; Yao, J.; Li, X. Quantifying the Human Induced Water Level Decline of China’s Largest Freshwater Lake from the Changing Underlying Surface in the Lake Region. Water Resour. Manag. 2017, 32, 1467–1482. [Google Scholar] [CrossRef]
- Yadav, B.; Eliza, K. A hybrid wavelet-support vector machine model for prediction of Lake water level fluctuations using hydro-meteorological data. Measurement 2017, 103, 294–301. [Google Scholar] [CrossRef]
- Huang, F.; Ochoa, C.G.; Guo, L.; Wu, Y.; Qian, B. Investigating variation characteristics and driving forces of lake water level complexity in a complex river–lake system. Stoch. Env. Res. Risk A 2020, 35, 1003–1017. [Google Scholar] [CrossRef]
- Wang, Y.; Liu, G.; Zhu, S.; Hu, W.; Zhang, H.; Zhou, X.; Peng, Z. Assessment of impacts of water transfer on lake flow and water quality in Lake Chaohu using a three-dimensional hydrodynamic-ecological model. J. Hydrol.-Reg. Stud. 2023, 46, 101333. [Google Scholar] [CrossRef]
- Shiri, J.; Shamshirband, S.; Kisi, O.; Karimi, S.; Bateni, S.M.; Hosseini Nezhad, S.H.; Hashemi, A. Prediction of Water-Level in the Urmia Lake Using the Extreme Learning Machine Approach. Water Resour. Manag. 2016, 30, 5217–5229. [Google Scholar] [CrossRef]
- Cheng, V.Y.S.; Saber, A.; Alberto Arnillas, C.; Javed, A.; Richards, A.; Arhonditsis, G.B. Effects of hydrological forcing on short- and long-term water level fluctuations in Lake Huron-Michigan: A continuous wavelet analysis. J. Hydrol. 2021, 603, 127164. [Google Scholar] [CrossRef]
- McCullough, I.M.; Loftin, C.S.; Sader, S.A. High-frequency remote monitoring of large lakes with MODIS 500m imagery. Remote Sens. Environ. 2012, 124, 234–241. [Google Scholar] [CrossRef]
- Pekel, J.-F.; Cottam, A.; Gorelick, N.; Belward, A.S. High-resolution mapping of global surface water and its long-term changes. Nature 2016, 540, 418–422. [Google Scholar] [CrossRef] [PubMed]
- Wu, Y.; Zhang, X.; Zheng, H.; Li, J.; Wang, Z. Investigating changes in lake systems in the south-central Tibetan Plateau with multi-source remote sensing. J. Geogr. Sci. 2016, 27, 337–347. [Google Scholar] [CrossRef]
- Li, M.; Hong, L.; Guo, J.; Zhu, A. Automated Extraction of Lake Water Bodies in Complex Geographical Environments by Fusing Sentinel-1/2 Data. Water 2021, 14, 30. [Google Scholar] [CrossRef]
- Bonnema, M.; David, C.H.; Frasson, R.P.d.M.; Oaida, C.; Yun, S.H. The Global Surface Area Variations of Lakes and Reservoirs as Seen From Satellite Remote Sensing. Geophys. Res. Lett. 2022, 49, e2022GL098987. [Google Scholar] [CrossRef]
- Huang, W.; Wang, F.; Duan, W.; Tang, L.; Qin, J.; Meng, X. Image similarity-based gap filling method can effectively enrich surface water mapping information. ISPRS-J. Photogramm. Remote Sens. 2023, 202, 528–544. [Google Scholar] [CrossRef]
- Song, C.; Huang, B.; Ke, L.; Richards, K.S. Remote sensing of alpine lake water environment changes on the Tibetan Plateau and surroundings: A review. ISPRS-J. Photogramm. Remote Sens. 2014, 92, 26–37. [Google Scholar] [CrossRef]
- Schlaffer, S.; Chini, M.; Dorigo, W.; Plank, S. Monitoring surface water dynamics in the Prairie Pothole Region of North Dakota using dual-polarised Sentinel-1 synthetic aperture radar (SAR) time series. Hydrol. Earth Syst. Sc. 2022, 26, 841–860. [Google Scholar] [CrossRef]
- Cai, X.; Gan, W.; Ji, W.; Zhao, X.; Wang, X.; Chen, X. Optimizing Remote Sensing-Based Level-Area Modeling of Large Lake Wetlands: Case Study of Poyang Lake. IEEE J-STARS 2015, 8, 471–479. [Google Scholar] [CrossRef]
- Long, Y.; Tang, R.; Wu, C.; Jiang, C.; Hu, S. Estimating Real-Time Water Area of Dongting Lake Using Water Level Information. Water 2019, 11, 1240. [Google Scholar] [CrossRef]
- Li, H.; Luo, Z.; Xu, Y.; Zhu, S.; Chen, X.; Geng, X.; Xiao, L.; Wan, W.; Cui, Y. A remote sensing-based area dataset for approximately 40 years that reveals the hydrological asynchrony of Lake Chad based on Google Earth Engine. J. Hydrol. 2021, 603, 126934. [Google Scholar] [CrossRef]
- Song, Q.; Zhao, R.; Fu, H.; Zhu, J.; Li, Y. Water Area Extraction and Water Level Prediction of Dongting Lake Based on Sentinel-1 Dual-Polarization Data Decomposition. Remote Sens. 2023, 15, 4655. [Google Scholar] [CrossRef]
- Dai, X.; Yang, G.; Wan, R.; Li, Y. The effect of the Changjiang River on water regimes of its tributary Lake East Dongting. J. Geogr. Sci. 2018, 28, 1072–1084. [Google Scholar] [CrossRef]
- Liu, Y.; Jiang, C.; Long, Y.; Deng, B.; Jiang, J.; Yang, Y.; Wu, Z. Study on the Water Level–Discharge Relationship Changes in Dongting Lake Outlet Section over 70 Years and the Impact of Yangtze River Backwater Effect. Water 2023, 15, 2057. [Google Scholar] [CrossRef]
- Yin, Y.; Xia, R.; Chen, Y.; Jia, R.; Zhong, N.; Yan, C.; Hu, Q.; Li, X.; Zhang, H. Non-steady state fluctuations in water levels exacerbate long-term and seasonal degradation of water quality in river-connected lakes. Water Res. 2023, 242. [Google Scholar] [CrossRef]
- Ou, C.; Li, J.; Zhou, Y.; Cheng, W.; Yang, Y.; Zhao, Z. Evolution characters of water exchange abilities between Dongting Lake and Yangtze River. J. Geogr. Sci. 2014, 24, 731–745. [Google Scholar] [CrossRef]
- Hu, C.; Fang, C.; Cao, W. Shrinking of Dongting Lake and its weakening connection with the Yangtze River: Analysis of the impact on flooding. Int. J. Sediment Res. 2015, 30, 256–262. [Google Scholar] [CrossRef]
- Guo, W.; Yang, H.; Zhou, H.; Wang, H. Synergistic changes in river-lake runoff systems in the Yangtze River basin and their driving force differences. Ecol. Inform. 2023, 75, 102069. [Google Scholar] [CrossRef]
- Wang, C.L.; Jiang, W.G.; Deng, Y.; Ling, Z.Y.; Deng, Y.W. Long Time Series Water Extent Analysis for SDG 6.6.1 Based on the GEE Platform: A Case Study of Dongting Lake. IEEE J-STARS 2022, 15, 490–503. [Google Scholar] [CrossRef]
- Cao, M.M.; Mao, K.B.; Shen, X.Y.; Xu, T.R.; Yan, Y.B.; Yuan, Z.J. Monitoring the Spatial and Temporal Variations in The Water Surface and Floating Algal Bloom Areas in Dongting Lake Using a Long-Term MODIS Image Time Series. Remote Sens. 2020, 12, 3622. [Google Scholar] [CrossRef]
- Yang, L.; Wang, L.C.; Zhang, M.; Niu, Z.G.; Yao, R.; Yu, D.Q.; Li, C.A.; He, Q.H. Variation of water body in Dongting Lake from in situ measurements and MODIS observations in recent decades. Int. J. Digit. Earth 2021, 14, 959–984. [Google Scholar] [CrossRef]
- Liu, X.Q.; Wang, X.; Chen, K.L.; Li, D. Simulation and prediction of multi-scenario evolution of ecological space based on FLUS model: A case study of the Yangtze River Economic Belt, China. J. Geogr. Sci. 2023, 33, 373–391. [Google Scholar] [CrossRef]
- Yang, P.; Zhang, S.Q.; Xia, J.; Zhan, C.S.; Cai, W.; Wang, W.Y.; Luo, X.G.; Chen, N.C.; Li, J. Analysis of drought and flood alternation and its driving factors in the Yangtze River Basin under climate change. Atmos. Res. 2022, 270, 106087. [Google Scholar] [CrossRef]
- Lu, C.; Jia, Y.F.; Jing, L.; Zeng, Q.; Lei, J.L.; Zhang, S.H.; Lei, G.C.; Wen, L. Shifts in river-floodplain relationship reveal the impacts of river regulation: A case study of Dongting Lake in China. J. Hydrol. 2018, 559, 932–941. [Google Scholar] [CrossRef]
- Cheng, J.X.; Xu, L.G.; Feng, W.J.; Fan, H.X.; Jiang, J.H. Changes in Water Level Regimes in China’s Two Largest Freshwater Lakes: Characterization and Implication. Water 2019, 11, 917. [Google Scholar] [CrossRef]
- Chen, M.H.; Zeng, S.D.; Yang, L.H.; Tang, X.Y.; Xia, J. Detailed attribution of long-term water exchange in the Yangtze-Poyang system at multiple time scales. J. Hydrol. 2022, 612, 128183. [Google Scholar] [CrossRef]
- Zhang, P.P.; Mao, J.Q.; Tian, M.M.; Dai, L.Q.; Hu, T.F. The Impact of the Three Gorges Reservoir on Water Exchange Between the Yangtze River and Poyang Lake. Front. Earth Sci. 2022, 10, 876286. [Google Scholar] [CrossRef]
Figure 1.
The location of Dongting Lake District and hydrologic stations.

Figure 2.
Spatial patterns of Dongting Lake from 2000 to 2021.

Figure 3.
(a) Annual/seasonal/monthly water area anomalies and (b) wavelet variance of area anomalies of Dongting Lake.
Figure 3.
(a) Annual/seasonal/monthly water area anomalies and (b) wavelet variance of area anomalies of Dongting Lake.

Figure 4.
Annual/seasonal/monthly (a) water level anomalies, (b) wavelet variance of water level anomalies, (c) water flow anomalies, and (d) wavelet variance of water flow anomalies at Chenglingji station of Dongting Lake.
Figure 4.
Annual/seasonal/monthly (a) water level anomalies, (b) wavelet variance of water level anomalies, (c) water flow anomalies, and (d) wavelet variance of water flow anomalies at Chenglingji station of Dongting Lake.

Figure 5.
Annual/seasonal/monthly relationship between water areas of Dongting Lake and water levels at (a) Chenglingji, (b) Shimen, (c) Taojiang, and (d) Taoyuan stations and between water areas of Dongting Lake and water flows at (e) Chenglingji, (f) Shimen, (g) Taojiang, and (h) Taoyuan stations.

Figure 6.
Fitting curves of annual/seasonal/monthly (a) water level and (b) water flow at Chenglingji station of Dongting Lake.
Figure 6.
Fitting curves of annual/seasonal/monthly (a) water level and (b) water flow at Chenglingji station of Dongting Lake.


Table 1.
Ten-fold cross validation results for annual, seasonal, and monthly water level–area correlation models.
Table 1.
Ten-fold cross validation results for annual, seasonal, and monthly water level–area correlation models.
| Station 1 | Accuracy | Annual | Seasonal | Monthly | ||||||||||||
|---|---|---|---|---|---|---|---|---|---|---|---|---|---|---|---|---|
| Line 2 | Exp | Log | Poly2 | Poly3 | Line | Exp | Log | Poly2 | Poly3 | Line | Exp | Log | Poly2 | Poly3 | ||
| CLJ | R2 | 0.4 | 0.4 | 0.21 | 0.34 | 0.36 | 0.8 | 0.78 | 0.38 | 0.8 | 0.8 | 0.7 | 0.67 | 0.37 | 0.72 | 0.72 |
| RMSE (m) | 0.92 | 0.92 | 1.05 | 0.97 | 0.95 | 1.39 | 1.43 | 2.42 | 1.37 | 1.38 | 1.89 | 1.95 | 2.71 | 1.81 | 1.81 | |
| ARE (%) | 2.51 | 2.49 | 3.01 | 2.73 | 2.68 | 4.55 | 4.67 | 8.02 | 4.53 | 4.58 | 5.86 | 5.92 | 9.34 | 5.62 | 5.62 | |
| SM | R2 | -- 3 | -- | -- | -- | -- | 0.18 | 0.18 | -- | 0.16 | 0.14 | 0.13 | 0.13 | -- | 0.13 | 0.11 |
| RMSE (m) | 0.51 | 0.51 | 0.7 | 0.54 | 0.62 | 0.64 | 0.64 | 1.4 | 0.65 | 0.66 | 0.83 | 0.83 | 1.66 | 0.84 | 0.84 | |
| ARE (%) | 0.69 | 0.69 | 1.12 | 0.75 | 0.84 | 0.95 | 0.95 | 2.38 | 0.97 | 0.98 | 1.14 | 1.13 | 2.68 | 1.13 | 1.14 | |
| TJ | R2 | -- | -- | 0.08 | -- | -- | 0.07 | 0.07 | -- | 0.05 | 0.01 | 0.06 | 0.06 | -- | 0.03 | 0.05 |
| RMSE (m) | 1.29 | 1.28 | 1.22 | 1.35 | 1.93 | 1.23 | 1.23 | 1.39 | 1.24 | 1.27 | 1.4 | 1.4 | 1.6 | 1.42 | 1.41 | |
| ARE (%) | 3.03 | 3.01 | 2.9 | 3.2 | 3.98 | 2.86 | 2.85 | 3.13 | 2.9 | 2.97 | 3.22 | 3.21 | 3.67 | 3.25 | 3.22 | |
| TY | R2 | 0.11 | 0.11 | 0.15 | 0.06 | -- | 0.3 | 0.3 | 0.3 | 0.29 | 0.27 | 0.22 | 0.22 | 0.23 | 0.2 | 0.21 |
| RMSE (m) | 0.92 | 0.92 | 0.9 | 0.95 | 1 | 1.32 | 1.31 | 1.32 | 1.33 | 1.35 | 1.73 | 1.73 | 1.72 | 1.75 | 1.74 | |
| ARE (%) | 2.1 | 2.09 | 2.03 | 2.21 | 2.37 | 3.14 | 3.14 | 3.1 | 3.22 | 3.23 | 3.85 | 3.82 | 3.86 | 3.87 | 3.89 | |
Notes: 1 Stations CLJ, SM, TJ, and TY refer to Chenglinji, Shimen, Taojiang, and Taoyuan hydrological monitoring stations; 2 Line, Exp, Log, Poly2, and Poly3 are linear, exponential, logarithmic, quadratic polynomial, and cubic polynomial regressions; 3 -- means no statistical significance.
Table 2.
Ten-fold cross validation results for annual, seasonal, and monthly water flow–area correlation models.
Table 2.
Ten-fold cross validation results for annual, seasonal, and monthly water flow–area correlation models.
| Station 1 | Accuracy | Annual | Seasonal | Monthly | ||||||||||||
|---|---|---|---|---|---|---|---|---|---|---|---|---|---|---|---|---|
| Line 2 | Exp | Log | Poly2 | Poly3 | Line | Exp | Log | Poly2 | Poly3 | Line | Exp | Log | Poly2 | Poly3 | ||
| CLJ | R2 | 0.28 | 0.29 | -- | 0.24 | 0.14 | 0.6 | 0.57 | 0.08 | 0.59 | 0.59 | 0.49 | 0.37 | 0.07 | 0.48 | 0.46 |
| RMSE (m3/s) | 2059.37 | 2051.1 | 2515.51 | 2111.29 | 2253.39 | 2712.39 | 2809.49 | 4133.54 | 2769.59 | 2737.58 | 3580.58 | 3992.27 | 4829.63 | 3621.19 | 3686.84 | |
| ARE (%) | 13.17 | 13.1 | 18.8 | 13.95 | 17.77 | 34.72 | 33.24 | 60.96 | 35.65 | 34.96 | 45.07 | 40.66 | 73.7 | 44.13 | 45.18 | |
| SM | R2 | -- 3 | -- | -- | -- | -- | 0.14 | 0.08 | -- | 0.13 | 0.08 | 0.08 | 0.01 | 0.01 | 0.07 | 0.06 |
| RMSE (m3/s) | 542.99 | 536.14 | 538.68 | 549.47 | 571.26 | 533.67 | 552.66 | 578.34 | 537.46 | 550.51 | 758.74 | 787.33 | 790.78 | 765.75 | 768.38 | |
| ARE (%) | 66.91 | 56.34 | 71.67 | 73.28 | 74.04 | 207.87 | 145.3 | 245.49 | 211.34 | 213.09 | 364.75 | 227.16 | 420.23 | 369.33 | 370.83 | |
| TJ | R2 | 0.11 | 0.12 | -- | 0.08 | -- | 0.16 | 0.13 | 0.02 | 0.12 | 0.15 | 0.1 | 0.03 | 0.02 | 0.07 | 0.07 |
| RMSE (m3/s) | 374.93 | 372.84 | 413.15 | 381.13 | 440.21 | 430.96 | 439.77 | 465.75 | 441.04 | 433.44 | 617.66 | 640.94 | 643.89 | 627.3 | 624.62 | |
| ARE (%) | 26.26 | 24.68 | 29.63 | 27.46 | 39.91 | 57.11 | 49.44 | 65.79 | 58.86 | 56.31 | 84.58 | 65.22 | 89.41 | 85.46 | 86.27 | |
| TY | R2 | 0.1 | 0.04 | -- | 0.16 | 0.12 | 0.33 | 0.29 | 0.02 | 0.32 | 0.3 | 0.21 | 0.12 | 0.03 | 0.19 | 0.21 |
| RMSE (m3/s) | 1206.35 | 1245.29 | 1302.56 | 1163.8 | 1190.47 | 1455.43 | 1501.33 | 1762.32 | 1469.67 | 1489.89 | 2121.65 | 2241.34 | 2358.8 | 2145.98 | 2126.2 | |
| ARE (%) | 31.98 | 30.08 | 36.25 | 30.74 | 30.68 | 76.14 | 61.57 | 107.4 | 77.71 | 76.89 | 108.3 | 78.19 | 138.33 | 108.33 | 109.43 | |
Notes: 1 Stations CLJ, SM, TJ, and TY refer to Chenglinji, Shimen, Taojiang, and Taoyuan hydrological monitoring station; 2 Line, Exp, Log, Poly2, and Poly3 are linear, exponential, logarithmic, quadratic polynomial, and cubic polynomial regressions; 3 -- means no statistical significance.
Disclaimer/Publisher’s Note: The statements, opinions and data contained in all publications are solely those of the individual author(s) and contributor(s) and not of MDPI and/or the editor(s). MDPI and/or the editor(s) disclaim responsibility for any injury to people or property resulting from any ideas, methods, instructions or products referred to in the content. |
© 2024 by the authors. Licensee MDPI, Basel, Switzerland. This article is an open access article distributed under the terms and conditions of the Creative Commons Attribution (CC BY) license (https://creativecommons.org/licenses/by/4.0/).
Share and Cite
MDPI and ACS Style
Xu, S.; Zhai, L.; Zou, B.; Sang, H. Multiscale Analysis of Water Area, Level and Flow and Their Relationships for a Large Lake Connected to Rivers: A Case Study of Dongting Lake, China. Water 2024, 16, 1198. https://doi.org/10.3390/w16091198
AMA Style
Xu S, Zhai L, Zou B, Sang H. Multiscale Analysis of Water Area, Level and Flow and Their Relationships for a Large Lake Connected to Rivers: A Case Study of Dongting Lake, China. Water. 2024; 16(9):1198. https://doi.org/10.3390/w16091198
Chicago/Turabian StyleXu, Shan, Liang Zhai, Bin Zou, and Huiyong Sang. 2024. "Multiscale Analysis of Water Area, Level and Flow and Their Relationships for a Large Lake Connected to Rivers: A Case Study of Dongting Lake, China" Water 16, no. 9: 1198. https://doi.org/10.3390/w16091198
Note that from the first issue of 2016, this journal uses article numbers instead of page numbers. See further details here.