Article

Precipitation Changes on the Northern Slope of the Kunlun Mountains in the Past 42 Years

1
State Key Laboratory of Desert and Oasis Ecology, Key Laboratory of Ecological Safety and Sustainable Development in Arid Land, Xinjiang Institute of Ecology and Geography, Chinese Academy of Sciences, Urumqi 830011, China
2
University of Chinese Academy of Sciences, Beijing 100049, China
3
College of Geographic Science and Tourism, Xinjiang Normal University, Urumqi 830017, China
4
College of Biology and Geography, Yili Normal University, Yining 835000, China
*
Authors to whom correspondence should be addressed.
Water 2024, 16(9), 1203; https://doi.org/10.3390/w16091203
Submission received: 27 March 2024 / Revised: 17 April 2024 / Accepted: 18 April 2024 / Published: 24 April 2024
(This article belongs to the Section Water and Climate Change)

Abstract

:
The precipitation on the northern slope of the Kunlun Mountains significantly impacts the green economy of the Tarim Basin’s southern edge. Observations have noted an expansion of the surface water area in this region, though the reasons for this are not yet fully understood. Due to limited instrumental data, this study leverages field measurements from the third Xinjiang comprehensive expedition and multiple gridded datasets. Through trend analysis and a geographical detector model, it examines the precipitation’s decadal, interannual, and seasonal variations across key areas (Hotan River Basin, Keriya River Basin, Qarqan River Basin, and Kumukuli Basin), identifying factors behind the spatial and temporal distribution of regional precipitation. The findings reveal the following: (1) An increase in annual precipitation across the region from 187.41 mm in the 1980s to 221.23 mm in the early 21st century, at a rate of 10.21 mm/decade, with the most significant rise in the eastern Kunlun-Kumukuli Basin. (2) Precipitation exhibits clear seasonal and spatial patterns, predominantly occurring in spring and summer, accounting for 90.27% of the annual total, with a general decrease from the mountains towards downstream areas. (3) Rising average annual temperatures contribute to an unstable atmospheric structure and increased water-holding capacity, facilitating precipitation. Significant influences on precipitation changes include the North Atlantic Oscillation and solar flux, explaining 43.98% and 31.21% of the variation, respectively.

1. Introduction

Against the backdrop of global changes typified by rising temperatures, the atmosphere’s capacity to hold water is increasing at the Clausius–Clapeyron rate of approximately 7% per degree Celsius [1]. This profoundly impacts the hydrological cycle, leading to structural changes in precipitation patterns, characterized by a significant reduction in light rain days and a noticeable increase in heavy rain and stormy days, with droughts and floods becoming more frequent [2]. Precipitation varies significantly across different regions due to energy limitations, generally increasing in mid- to high-latitude and tropical regions while decreasing in subtropical areas [3]. The “Global Climate Status Report 2022” indicates that the years 2015 to 2022 were the warmest on record, with the global average temperature in 2022 being 1.15 °C higher than pre-industrial levels, and projections suggest that 2024 could be even warmer [4]. Rising temperatures are expected to alter precipitation patterns, including the uneven distribution of rainfall and the availability of water resources [5].
The northern slope of the Kunlun Mountains is a vital corridor in the southern core area of China’s “Belt and Road” initiative (Figure 1). Changes in water resources not only affect the restoration and growth of vegetation and ecosystems but are also closely tied to high-quality development along the southern edge of the basin. However, as global climate change intensifies, new characteristics of precipitation have emerged in the northern Kunlun Mountain region, posing new challenges to local water resource management and utilization [6]. Early studies by Xu et al. (1994) identified that the total runoff from the northern slope’s rivers was 87 × 108 m3, with more in the west and less in the east [7]. Recent findings by Wang et al. (2023) indicate an upward trend in runoff volume in the Kunlun Mountain area since the 1970s, with the summer runoff volume in the Yarkant River Basin reaching a maximum of 96.28 × 10⁸ m3 [8]. From 2000 to 2014, glaciers on the eastern northern slope of the Kunlun Mountains thinned overall, with the greatest thinning (36.50 m) occurring at elevations between 4000 and 4200 m, resulting in a glacier volume reduction of 1.28 km3 [9]. Recent observations show an increase in both the number and area of glacial lakes in the Kunlun Mountains, with increases of 39.25% and 81.35%, respectively, compared to 2000 [10]. The area of surface water bodies has also significantly increased, with the size of permanent water bodies expanding by 71.03% ± 27.73% and the area of seasonal water bodies increasing by 170.63% ± 17.50% [11].
Faced with the continuous expansion of surface water area in the northern Kunlun Mountain region, one might wonder about the source of this water. Considering that water resources in arid areas are mainly replenished by precipitation and meltwater from high mountain areas [12], and that glacier meltwater contributes approximately 50% to runoff, it is speculated that precipitation in this region, especially in high mountain areas, has been underestimated [13]. Based on this, the present study utilizes field measurements from the third comprehensive scientific expedition in Xinjiang and various gridded datasets to conduct a detailed analysis of the decadal, interannual, and seasonal variations in precipitation in typical areas of the northern slope of the Kunlun Mountains (including the Hotan River Basin, the Keriya River Basin, the Qarqan River Basin, and the Kumukuli Basin) using trend analysis, geographical detector models, and other methods to interpret the potential causes of these changes. The results aim to address the current state of regional water resources and provide a scientific basis for regional disaster prevention and mitigation policies.

2. Materials and Methods
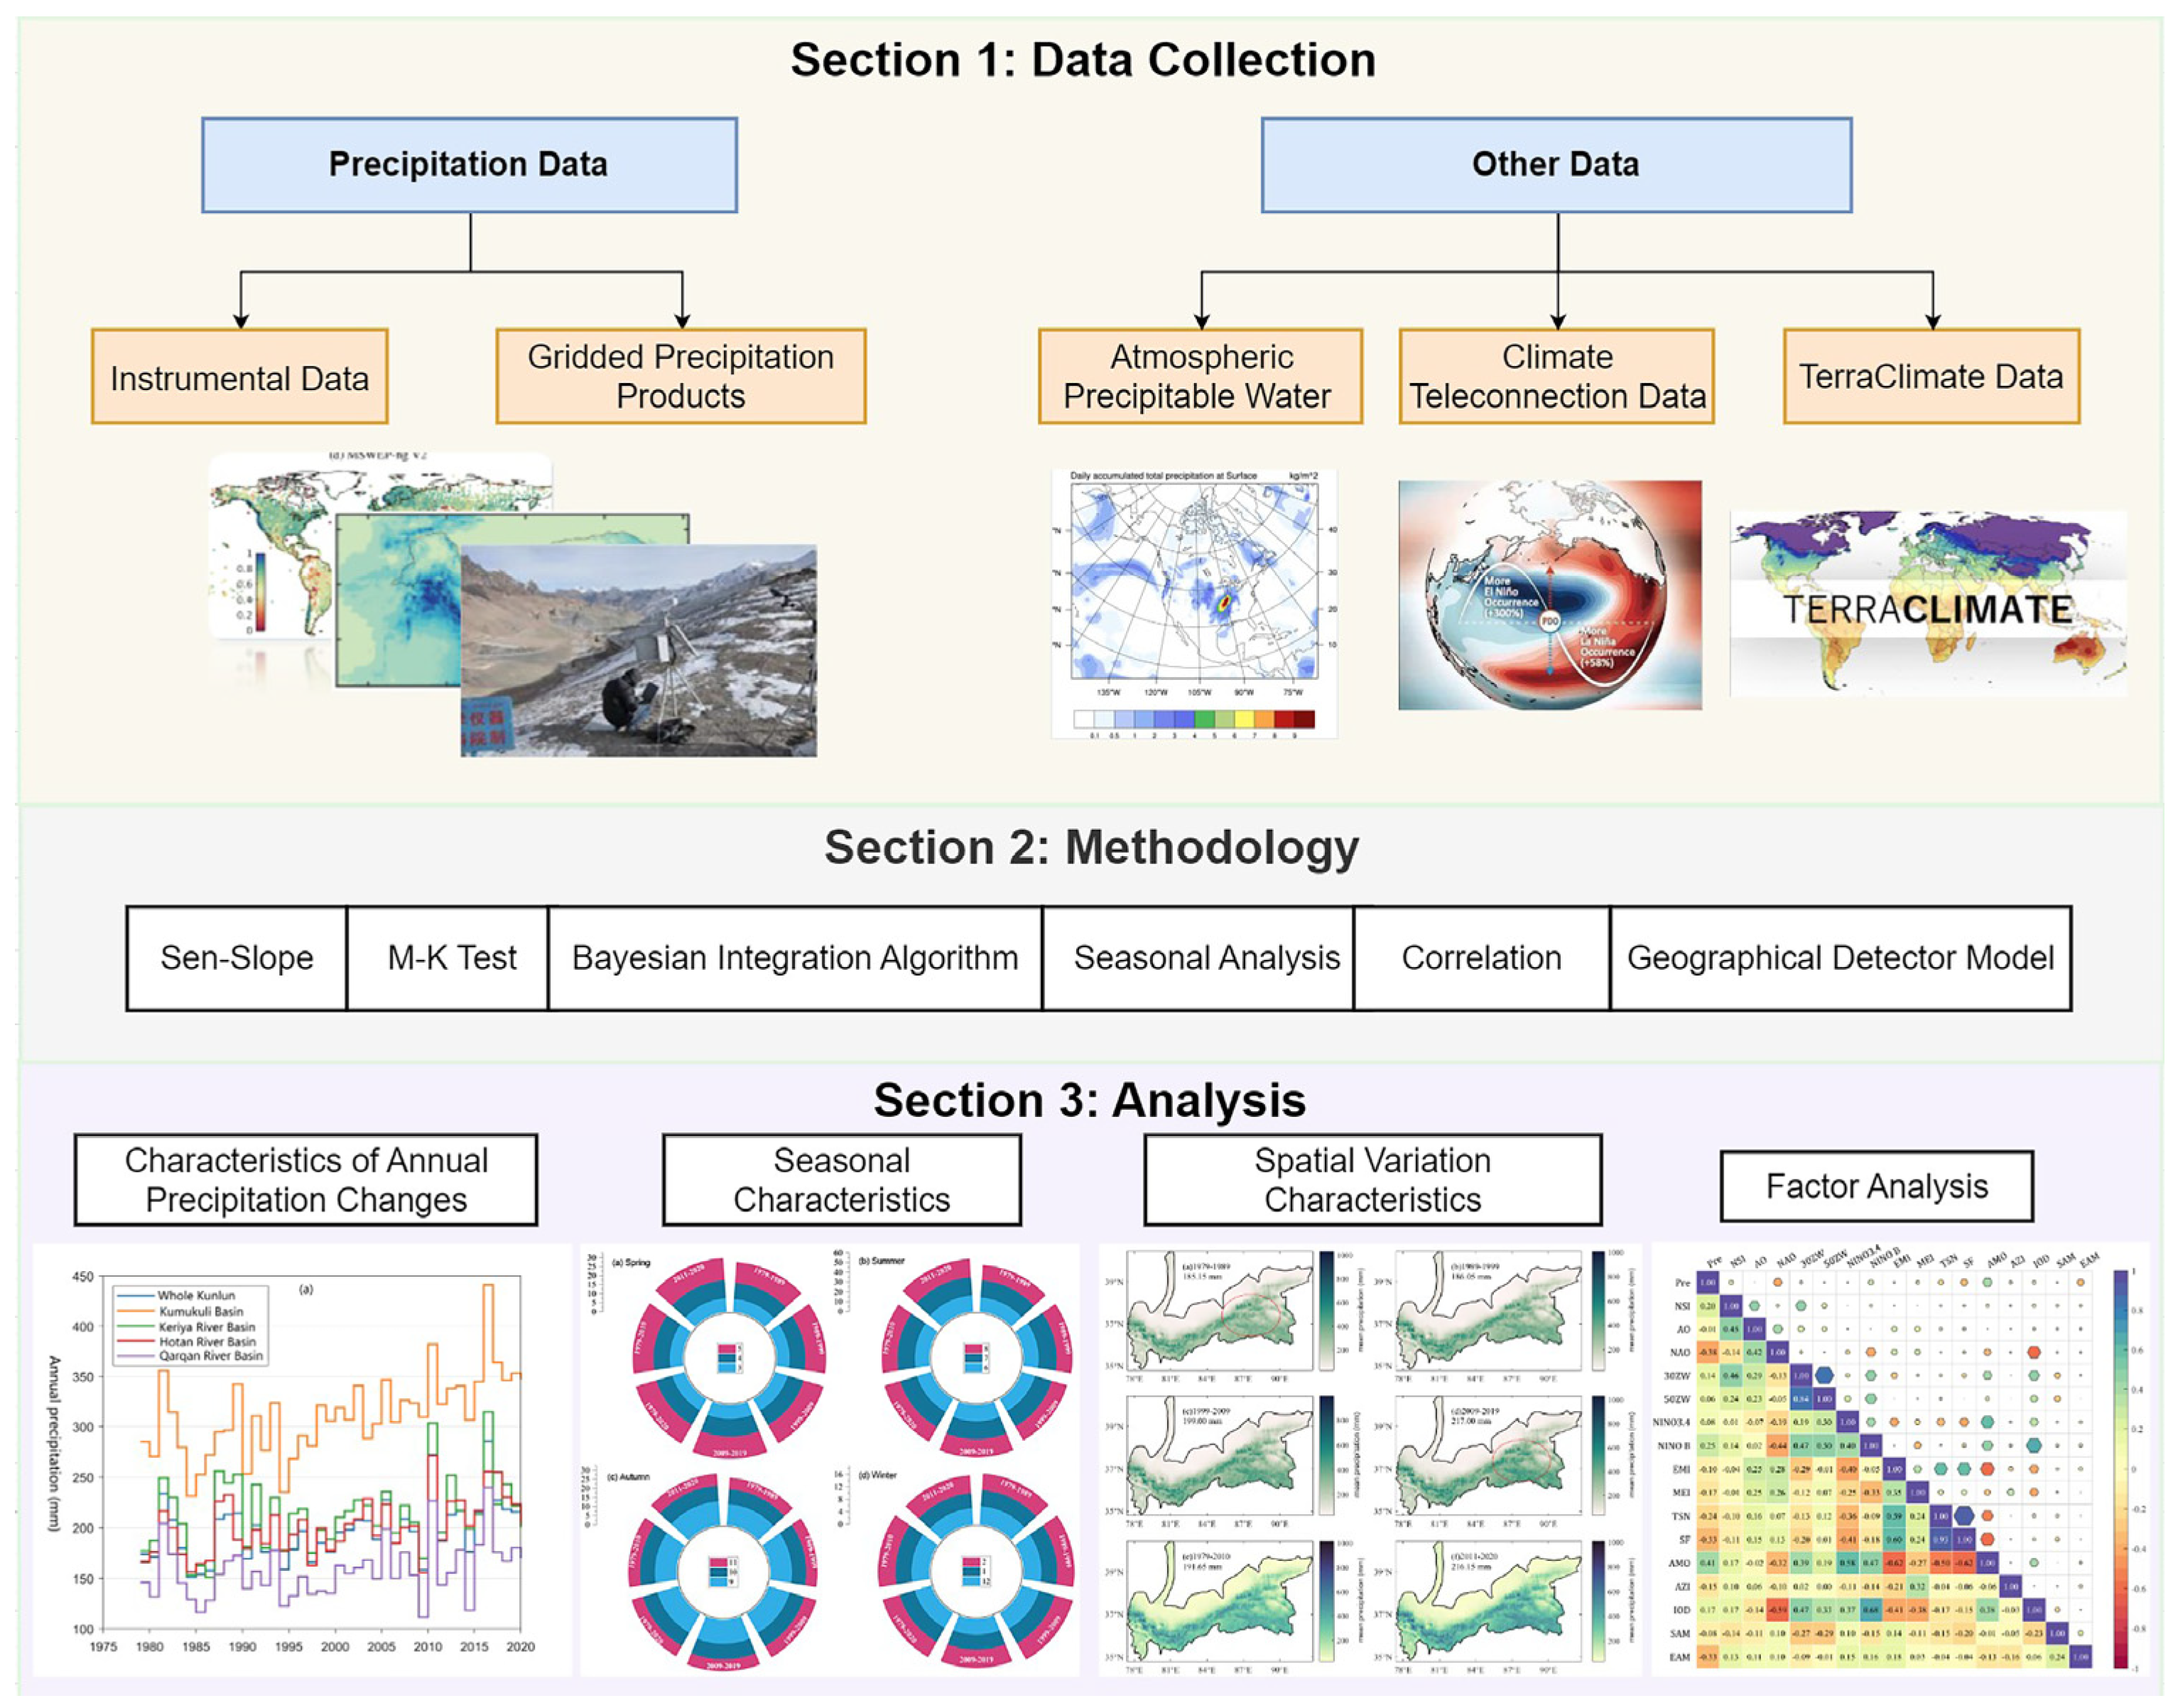
2.1. Data Sources

2.1.1. Precipitation Data

This study builds upon the observed precipitation data collected during the third comprehensive scientific expedition in Xinjiang, comparing three sets of high-precision mainstream precipitation products: CN05.1 (a gridded dataset of daily observational data across China) [14], TPHiPr (a long-term high-resolution precipitation dataset for the Third Pole region) [15], and the China 1 km resolution Monthly Precipitation Dataset [16]. Based on the ability of each product to replicate observed data, we selected the monthly TPHiPr dataset for analysis. Compared to current mainstream gridded precipitation products, this dataset integrates observations from over 9000 rain gauge stations and employs machine learning techniques to downscale ERA5 precipitation data, resulting in a precipitation product with higher accuracy derived from short-term high-resolution WRF simulations [17].

2.1.2. Atmospheric Precipitable Water Data

Utilizing the GEE platform and water vapor content data provided by the NCEP/NCAR reanalysis project, we calculated the historical atmospheric precipitable water over the northern slope of the Kunlun Mountains. These data feature a temporal resolution of 6 h and a spatial resolution of 2.5 degrees [18].

2.1.3. Large-Scale Climate Teleconnection Factors

Considering the regional atmospheric circulation background and existing research findings [19,20,21,22], we selected 16 teleconnection indices with monthly resolution to explore the relationship between precipitation changes in the northern Kunlun Mountain region and related large-scale climate teleconnections. These indices include the North Hemisphere Subtropical High Intensity (NSI), Arctic Oscillation (AO), North Atlantic Oscillation (NAO), 30 hPa Zonal Wind (30ZW), 50 hPa Zonal Wind (50ZW), NINO 3.4 Sea Surface Temperature Anomaly (NINO 3.4), NINO B Sea Surface Temperature Anomaly (NINO B), ENSO Modoki Index (EMI), Multivariate ENSO Index (MEI), Total Solar Sunspot Number (TSN), solar flux (SF), Atlantic Multidecadal Oscillation (AMO), Asian Zonal Circulation Index (AZI), and the Indian Ocean Dipole (IOD) among the 14 large-scale ocean-atmosphere circulation pattern indices (data from the 100 Climate System Indices provided by the China Meteorological Administration National Climate Center, http://cmdp.ncc-cma.net/Monitoring/cn_index_130.php, accessed on 1 October 2023) and two monsoon indices, namely the South Asian Summer Monsoon Index (SAM) and the East Asian Summer Monsoon Index (EAM), sourced from the collaborative work environment toolkit (http://lijianping.cn/dct/page/1, accessed on 3 October 2023).

2.2. Research Methods

Utilizing techniques such as Sen + MK trend analysis, a Bayesian integration algorithm, and a geographical detector model, we studied the spatiotemporal variation characteristics of precipitation and the possible causes of its changes in the northern slope region of the Kunlun Mountains. Figure 2 shows the technical flowchart.

2.2.1. Interannual Precipitation Trend Analysis

This study aggregated the annual precipitation from 1979 to 2020 based on the monthly TPHiPr precipitation data, then employed the Mann–Kendall test combined with the Theil–Sen Slope approach to calculate the trend of annual precipitation changes. The significance of the trend changes was tested using Formula (2). The formula is as follows:
θ s l o p e = n × i = 1 n i × P i i = 1 n i i n P i n × i = 1 n i 2 ( i n i ) 2
In the formula, θslope represents the trend of interannual precipitation changes, where θslope > 0 indicates an increasing trend in precipitation, and vice versa for a decreasing trend; i denotes the year, with the range of i in this study being 1 to 42; n represents the total number of years, i.e., n = 42; Pi denotes the precipitation in the ith year (mm).
Z = ( S 1 ) n n 1 2 n + 5 / 18 ,   S > 0 Z = 0 ,   S = 0   Z = ( S + 1 ) n n 1 2 n + 5 / 18 ,   S < 0
S = i = 1 n 1 j = i + 1 n s g n ( x j x i )
In the formula, xi and xj represent the precipitation in the ith and jth years, respectively; n is the sample size, i.e., n = 42; sgn is the sign function. This study adopts a 95% confidence level for testing, meaning that when Z > 1.96, the increasing trend in precipitation is significant, when Z < −1.96, the decreasing trend in precipitation is significant, and when −1.96 ≤ Z ≤ 1.96, the change trend is not significant.

2.2.2. Seasonal Precipitation Change Analysis

Based on the seasonal division criteria of the study area, the cumulative precipitation for March to May, June to August, September to November, and December to the following February is aggregated to represent the precipitation changes in spring, summer, autumn, and winter, respectively. The calculation formula is as follows:
P s = i = 1 n P i , m n
In the formula, Ps represents the total precipitation for a specified season (spring, summer, autumn, winter) in mm, Pi,m denotes the cumulative precipitation for the ith year corresponding to the months of Ps in mm; i denotes the year, with the range of i in this article being 1 to 42; m represents the corresponding months (for calculating the total spring precipitation, m ranges from 3 to 5); n is the total number of years, i.e., n = 42.

2.2.3. Bayesian Integrated Time Series Decomposition Algorithm

BEAST (A Bayesian Estimator of Abrupt change, Seasonality, and Trend) leverages a combination of multiple models to effectively mitigate the error paradigm of single models, while reducing the uncertainty and overfitting risk of the algorithm. It has become an effective Bayesian regression method for robust change-point detection and non-linear trend analysis [23]. This approach assumes that a time series is composed of four parts: seasonality, trend, abrupt changes, and noise. In Bayesian modeling, all unknown parameters, including the model structure M, coefficients βM, and data noise σ2, are considered random. The distinct feature of this method, compared to current trend analysis techniques, is its ability to infer non-linear dynamics, making BEAST a parametric regression approach that stands out from the majority of heuristic-based breakpoint detection algorithms. It does not require threshold testing or standard optimization but fits a global model to decompose the entire time series in one step, fully revealing change points, trends, and seasonality. For more details, refer to the reference [23].

2.2.4. Geographical Detector Model

The geographical detector model (GDM) is a statistical method used to detect spatial stratified heterogeneity and reveal the underlying driving forces [24,25]. By measuring the q value of single driving factors and pairs of driving factors, we can quantify the explanatory power (contribution) of a single driving factor on the dependent variable (attribute or phenomenon) and assess whether there is an interaction between two factors. For a more detailed introduction to the GDM, please refer to the reference [25]. Owing to its explicit physical mechanism and the absence of a need for linear assumptions, the GDM has been widely applied in the fields of medicine, health, regional development, ecology, atmospheric science, and geoscience [22,26]. Thus, this method can be used to quantify the impact of various large-scale climate teleconnection factors on precipitation.
As the explanatory variables required by the model must be fixed as categorical types, we discretized the 16 selected climate factors using the Jenks natural breaks classification method. The explanatory power (contribution) of a factor is measured by the following formula:
q = 1 S S W S S T
S S W = h = 1 L N h δ h 2
S S T = N δ 2
Here, q represents the degree of explanation (contribution) of a specified factor to the dependent variable, ranging from [0, 1]; SSW is the sum of within-layer variances; SST is the total variance in the entire region; h represents the number of layers for the factor; N and Nh, respectively, denote the number of units in the entire region and in layer h; δ2 and δh2, respectively, indicate the variance in the dependent variable in the entire region and within layer h. A higher q value indicates a greater degree of explanation by the factor on the dependent variable.

3. Results

3.1. Characteristics of Annual Precipitation Changes in the Northern Slope Region of the Kunlun Mountains

Over the past 42 years, the annual precipitation in the northern slope region of the Kunlun Mountains has shown an overall increasing trend, with an average rate of increase of 10.21 mm per decade. Among the areas studied, the Kumukuli Basin experienced the largest increase in precipitation, reaching 20.65 mm per decade, while the Qarqan River Basin saw the smallest increase, at 7.48 mm per decade. In the last two decades, the rate of increase in precipitation has been even more significant, with the Kumukuli Basin experiencing an increase of up to 28.44 mm per decade (Figure 3). The trend of increasing precipitation is evident from the mean changes as well. For instance, between 1979 and 2020, the average annual precipitation across the northern slope region of the Kunlun Mountains was 197.48 mm, with the Hotan River Basin, Keriya River Basin, Qarqan River Basin, and Kumukuli Basin recording average annual precipitations of 201.15 mm, 213.45 mm, 157.81 mm, and 312.19 mm, respectively. Between 2000 and 2010, the average annual precipitation in these four regions changed to 205.27 mm, 219.09 mm, 164.83 mm, and 322.62 mm, respectively; and between 2010 and 2020, it further increased to 227.30 mm, 234.80 mm, 176.28 mm, and 353.20 mm. These results indicate that the precipitation in the northern slope region of the Kunlun Mountains has been on an increasing trend over the last 42 years, with the most significant increase observed in the last decade. The growth rates for the overall region and specifically for the Hotan River, Keriya River, Qarqan River basins, and the Kumukuli Basin were 12.03%, 13.00%, 10.01%, 11.70%, and 13.13%, respectively. It is worth noting that increased precipitation in mountainous areas can disrupt the water balance, affecting water availability and species distribution. It also heightens the risk of landslides and soil erosion, threatening habitats and human settlements. Moreover, it accelerates glacial melting, impacting freshwater downstream. These impacts underscore the need for effective management strategies.
To further verify the changes in precipitation over the past four decades in the northern slope region of the Kunlun Mountains, this study identified potential change points and their probabilities of occurrence during the historical period using a Bayesian ensemble algorithm (Figure 4, Table 1). This method detected four change points between 1979 and 2020, with the year 2010 having the highest probability of being a change point. The average annual precipitation in the study area increased from 191.65 mm (1979–2010) to 216.15 mm (2011–2020).

3.2. Seasonal Variation Characteristics of Precipitation on the Northern Slope of the Kunlun Mountains

The precipitation in the northern slope region of the Kunlun Mountains exhibits distinct seasonal characteristics, with rainfall primarily concentrated in the spring and summer (Figure 5). This is closely related to the unique hydrological conditions of the area, where precipitation in arid regions mainly comes from glacier and snow meltwater in high mountain zones, forest precipitation in mid mountain zones, and fissure water from bedrock in low mountain zones [12]. The higher temperatures in spring and summer not only facilitate the melting of glaciers and snow in the mountain areas but also increase the moisture content in the air, promoting precipitation. As a result, the arid region’s precipitation mainly occurs from April to September, accounting for 90.27% of the annual precipitation. From 1979 to 2020, the average precipitation in the northern Kunlun Mountains during spring, summer, autumn, and winter was 14.89 mm, 39.74 mm, 8.64 mm, and 2.61 mm, respectively, making up 22.60%, 60.23%, 13.12%, and 3.97% of the total annual precipitation. The precipitation proportions in the four sub-regions during these seasons ranged between 20.49 and 23.23% for spring, 58.19 and 62.22% for summer, 10.71 and 15.45% for autumn, and 3.02 and 4.99% for winter. Following the identified change points, there was a noticeable increase in precipitation across all four seasons, with the most significant increase observed in summer (4.76 mm).
The spatial distribution of seasonal precipitation during the historical period (Figure 6) reveals significant spatial heterogeneity in the northern slope region of the Kunlun Mountains, where rainfall is mostly concentrated in mountainous areas, and downstream regions receive less precipitation. Seasonally, summer experiences more rainfall, while winter has less. Within the region, the Kumukuli Basin has high precipitation, whereas the Qarqan River Basin receives less. As a closed highland basin with multiple water collection and runoff areas developed on its southern side, the Kumukuli Basin has become a high precipitation area in the northern slope region of the Kunlun Mountains. Over 30 years, the area of Lake Ayakkum in the region has increased by 513.01 km2 [27].

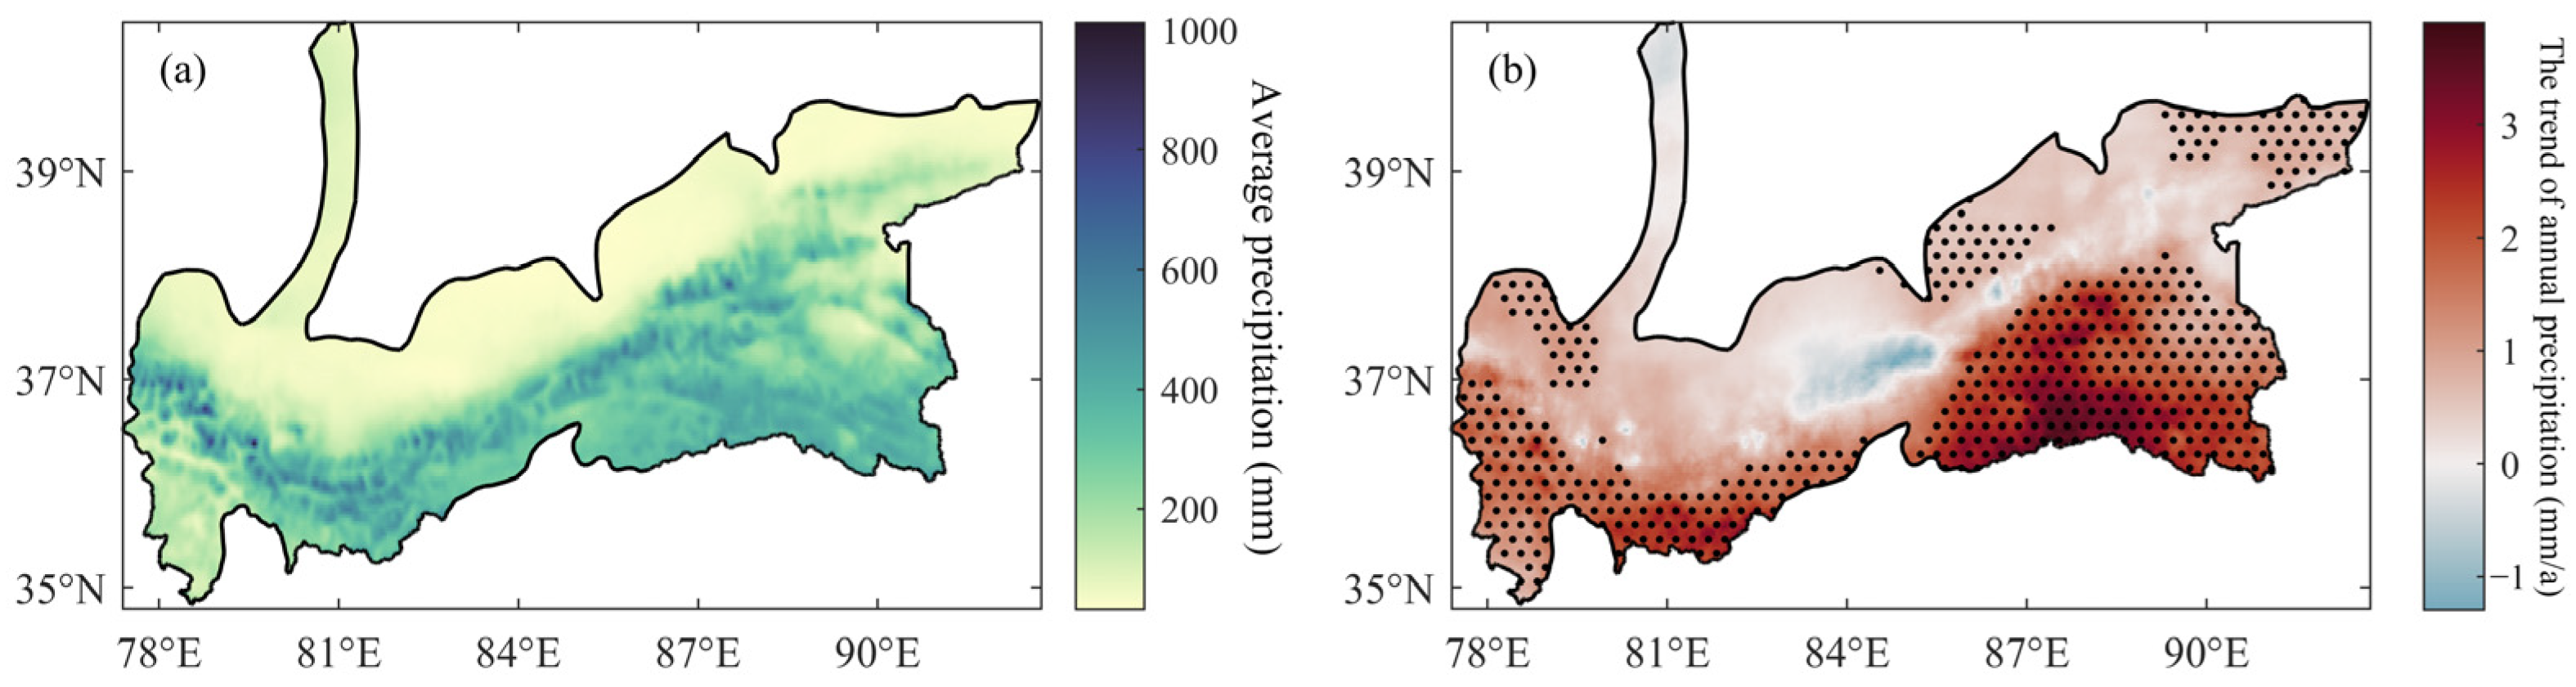
3.3. Spatial Variation Characteristics of Precipitation in the Northern Slope Region of the Kunlun Mountains

Spatially, the precipitation in the northern slope region of the Kunlun Mountains exhibits significant spatial heterogeneity, with rainfall being more concentrated in the mountainous areas and decreasing towards the downstream areas along the eastern Kunlun Mountains (Figure 7). Since 1979, the decadal precipitation in the northern slope region has shown an overall increasing trend. From 1979 to 1989, the average regional precipitation was 185.15 mm, with high-value areas concentrated in the upper reaches of the Hotan River Basin and the intersections of the Kumukuli Basin and the Qarqan River Basin. From 2009 to 2019, the average regional precipitation increased to 217.00 mm, an increase of approximately 31.85 mm from the 1980s, with the most significant increase observed in the Kumukuli Basin region (Figure 7a,d). Based on the change year with the highest probability of occurrence identified by the Bayesian ensemble algorithm, an analysis of the precipitation characteristics before (1979–2010) and after (2011–2020) 2010 was conducted. It was observed that after 2010, the precipitation in the northern slope region of the Kunlun Mountains increased significantly, with the average regional precipitation rising from 191.65 mm to 216.15 mm, an approximate increase of 12.78%. The most noticeable increases were observed on the southwestern side of the Central Kunlun and Kumukuli Basin (Figure 7e,f).
Over the past four decades, significant increases in precipitation have been noted in the northern slope region of the Kunlun Mountains, with most areas showing an increasing trend in precipitation, and most of these trends being statistically significant (Figure 8b). Some areas on the southwestern edge of the Kumukuli Basin even experienced increases in precipitation exceeding 30 mm per decade, and these increasing trends passed the 95% confidence level test. The third comprehensive scientific expedition in Xinjiang also found that the water area of Ayakkum Lake has been expanding continuously over the past 30 years, surpassing the area of Bosten Lake by the end of 2021 to become the largest lake in Xinjiang [13].

4. Discussion

4.1. Spatiotemporal Characteristics of Temperature Changes in the Northern Slope Region of the Kunlun Mountains

Utilizing the monthly climate and climatic water balance dataset (TerraClimate) provided by the University of Idaho, which includes maximum (Tmax) and minimum (Tmin) temperatures, this paper further discusses the potential reasons behind precipitation changes in the northern slope region of the Kunlun Mountains. This dataset integrates CRU Ts4.0/JRA55/WorldClim data, enhanced with climatological interpolation, offering a comprehensive long-term series with high spatial resolution widely applied in climate, ecology, and hydrology studies [28,29].
In the study region, a noticeable jump in both Tmin/Tmax around 1997 was observed, with the multi-year average Tmin at −5.22 °C and Tmax at 8.99 °C from 1979 to 2020; before 1997 (1979–1997), the average Tmin/Tmax were −5.85/8.56 °C, respectively, which then rose to −4.70/9.34 °C post 1997, indicating increases of 1.16 °C and 0.78 °C in the Tmin and Tmax, respectively (Figure 9a). This aligns with findings from existing research where minimum temperatures have risen more significantly under the dual influences of climate change and human activities [30]. The significant rise in Tmin/Tmax post 1997 likely contributed to a rapid increase in atmospheric moisture capacity during the day and, despite quick atmospheric cooling at night, the surface Tmin cooled less rapidly, fostering a thermally unstable atmosphere conducive to convective rainfall [31].
Spatially, the high temperature zones for Tmin and Tmax are concentrated in the downstream areas of the river basins, with the lowest temperatures generally found in mountainous regions, with the downstream area of the Hotan River Basin exhibiting the highest temperatures (Figure 10). The Kumukuli Basin, a high-altitude plateau basin surrounded by numerous mountains, including the Qimantag Mountain, adjacent to the southwest to the highest peak of the Kunlun Mountains—Muztagh Ata—and bordered by the Qiangtang Plateau to the south, has seen a significant increase in precipitation alongside accelerated glacier and snow melt in the surrounding mountainous areas due to rising temperatures, further expanding the area of Ayakkum Lake within the basin [27].

4.2. Characteristics of Changes in Atmospheric Precipitable Water in the Northern Slope Region of the Kunlun Mountains

Atmospheric precipitable water, representing the content of water vapor in the atmosphere, is a key material basis for precipitation occurrence [32]. Existing studies have confirmed a significant positive correlation between atmospheric water vapor content and precipitation, varying with climate type [33]. The atmospheric precipitable water in the northern slope region of the Kunlun Mountains has shown an increasing trend in recent years, with a growth rate of about 0.27 kg/m2 per decade, and the multi-year average atmospheric precipitable water was approximately 10.16 kg/m2, which rapidly increased after 2010, reaching an average of 10.70 kg/m2 in the last decade (Figure 11). Seasonally, atmospheric precipitable water in the region exhibits clear characteristics, with higher amounts in summer and lower amounts in winter. The average summer precipitable water stands at 16.70 kg/m2, approximately 3.04 times that of winter. Post 2010, the atmospheric precipitable water increased during spring, summer, and autumn, with multi-year averages of 10.00, 18.07, and 9.45 kg/m2, respectively, while winter saw a decrease to a multi-year average of 5.29 kg/m2. This indicates that the increase in atmospheric precipitable water over the last decade in the region occurred mainly outside of winter, with the largest increase observed in summer, amounting to 1.37 kg/m2.
The annual variation in atmospheric precipitable water in the region exhibits a unimodal pattern, peaking in July, accounting for 14.79% of the annual atmospheric precipitable water, with the lowest in January, only making up 4.19% of the annual total, consistent with results obtained from ground-based GPS measurements (Table 2) [34]. The seasonal distribution of atmospheric precipitable water closely matches that of precipitation, partly explaining the intra-annual variability in precipitation in the Kunlun Mountain region.

4.3. The Relationship between Precipitation Changes in the Northern Slope Region of the Kunlun Mountains and Large-Scale Climate Teleconnection Factors

The correlation heatmap between annual precipitation and atmospheric teleconnection factors in the northern slope region of the Kunlun Mountains reveals that among the 16 teleconnection factors, NAO, SF, AMO, EAM, and NSI are most closely related to annual precipitation (Figure 12). Subsequently, utilizing the GMD method, we further quantified the explanatory degree of these five closely related atmospheric teleconnection factors on annual precipitation changes (Table 3). From a single-factor perspective, AMO explains the highest degree of spatial variance in annual precipitation, reaching 47%, while NSI has the weakest explanation, at 16%. The interactions between these factors resulted in a varied degree of contribution to the spatial variance in annual precipitation in the northern slope region of the Kunlun Mountains, with the explanatory power of NSI and NAO interaction showing non-linear enhancement. Before interaction, NSI and NAO explained 16% and 44% of the variation in annual precipitation, respectively. After interaction, their combined explanatory power surged to 88%, exceeding the sum of their individual explanatory powers before interaction. Numerous studies have demonstrated the association between weather extremes in Eurasia, particularly extreme cold events, and these large-scale circulations, including the NAO and blocking patterns [35]. Circulation anomalies associated with extreme droughts in northern China are linked to the eastward displacement of the southern center of activity of the NAO during its negative phase in summer [36]. Notably, in the interaction between AMO and EAM, NSI showed a non-linear weakening in explaining annual precipitation, where the explanatory power after interaction was greater than the minimum explanatory power of the two factors before interaction, yet less than their combined sum. This relationship merits further discussion.

5. Conclusions

This article quantitatively analyzes the characteristics of precipitation changes in the northern slope region of the Kunlun Mountains over the past 42 years based on observed data from the third comprehensive scientific expedition in Xinjiang and multiple sets of gridded data. By examining the concurrent changes in temperature, atmospheric precipitable water, and large-scale climate teleconnection factors, it preliminarily addresses the possible reasons for regional precipitation changes. The results indicate the following:
(1)
Over the past four decades, precipitation in the northern slope region of the Kunlun Mountains has significantly increased, with a notable increasing trend in most areas except for certain parts of the Keriya River Basin. Some regions on the southwestern edge of the Kumukuli Basin have even seen increases exceeding 30 mm per decade.
(2)
The precipitation in the northern slope region of the Kunlun Mountains exhibits clear spatial heterogeneity, with higher precipitation concentrated in mountainous areas and less in downstream regions. Seasonally, summer experiences more precipitation, while winter sees less, with the rainfall from April to September accounting for 90.27% of the annual total. Internally, the Kumukuli Basin receives a significant amount of precipitation, while the Qarqan River Basin receives less.
(3)
Between 1979 and 2020, four change points were identified in the northern slope region of the Kunlun Mountains, with the year 2010 having the highest probability of a change. After this change point, the average annual precipitation in the study area increased from 191.65 mm (1979–2010) to 216.15 mm (2011–2020), and the atmospheric precipitable water also saw a rapid increase, from 10.00 kg/m2 to 10.70 kg/m2. The continuous rise in the region’s average annual high and low temperatures contributes to an unstable atmospheric structure of cold air above and warm air below, combined with the increased capacity of the atmosphere to hold water, facilitating precipitation formation.
(4)
Large-scale climate teleconnection factors, such as the North Atlantic Oscillation, solar radiation flux, and the East Asian Summer Monsoon Index, have a closer connection with precipitation changes in the northern slope region of the Kunlun Mountains. The interaction of these factors with others significantly enhances the degree to which they can explain precipitation changes, with explanatory levels ranging from 43% to 88%.

Author Contributions

Conceptualization, Z.X. and Y.C.; methodology, Z.X. and X.Z.; software, X.Z. and Q.X.; validation, C.Z., Y.L. and J.L.; formal analysis, G.F. and Z.X.; investigation, C.Z.; data curation, Q.L.; writing—original draft preparation, Z.X.; writing—review and editing, Y.C. and Z.L.; visualization, X.Z.; supervision, X.Z.; project administration, Y.C. and Z.L.; funding acquisition, C.Z., X.Z. and G.F. All authors have read and agreed to the published version of the manuscript.

Funding

This research was supported by the Third Xinjiang Scientific Expedition program (Funder C.Z. Grant No. 2021xjkk0100), the Postdoctoral Fellowship Program of CPSF (Funder X.Z. Grant No. GZC20232962), and the Tianshan Talent Program of Xinjiang, China (Funder G.F. Grant No. 2022TSYCCX0042).

Data Availability Statement

Data are contained within the article.

Acknowledgments

The authors are grateful to the State Key Laboratory of Desert and Oasis Ecology, Xinjiang Institute of Ecology and Geography, Chinese Academy of Sciences, for their support. Also, we would like to express our gratitude to the National Tibetan Plateau/Third Pole Environment Data Center (http://data.tpdc.ac.cn) for providing foundational data.

Conflicts of Interest

The authors declare no conflicts of interest.

References

  1. Forster, P.M.; Maycock, A.C.; McKenna, C.M.; Smith, C.J. Latest climate models confirm need for urgent mitigation. Nat. Clim. Chang. 2020, 10, 7–10. [Google Scholar] [CrossRef]
  2. Fischer, E.M.; Knutti, R. Observed heavy precipitation increase confirms theory and early models. Nat. Clim. Chang. 2016, 6, 986–991. [Google Scholar] [CrossRef]
  3. Donat, M.G.; Lowry, A.L.; Alexander, L.V.; O’Gorman, P.A.; Maher, N. More extreme precipitation in the world’s dry and wet regions. Nat. Clim. Chang. 2016, 6, 508–513. [Google Scholar] [CrossRef]
  4. News, U.N. World Meteorological Organization: 2023 Breaks Global Temperature Records, 2024 Could Be Even Hotter. Available online: https://news.un.org/zh/story/2024/01/1125667 (accessed on 12 January 2024).
  5. Trenberth, K.E.; Dai, A.; van der Schrier, G.; Jones, P.D.; Barichivich, J.; Briffa, K.R.; Sheffield, J. Global warming and changes in drought. Nat. Clim. Chang. 2013, 4, 17–22. [Google Scholar] [CrossRef]
  6. Han, X. Analysis of Precipitation Variation Characteristics on the Northern Slope of the Central Kunlun Mountains. Yangtze River 2017, 48, 85–88. [Google Scholar] [CrossRef]
  7. Xu, Y.; Gao, Y.; Yang, W. Approach to water resource characteristics of rivers in north slope area of the kunlun mountains. Sci. Geogr. Sin. 1994, 14, 338. [Google Scholar]
  8. Wang, S.; Sun, C.; Chen, W.; Zhang, X.; Zhou, S. Assessing water resource risks in inland river basins of Northwest China from water chemistry and runoff. Acta Geogr. Sin. 2023, 78, 2763–2780. [Google Scholar]
  9. Li, H. Remote Sensing Monitoring of the Main Glacial Changes on the North Slope of the Eastern Karakoram Mountains in the Past 30 Years. Master’s Thesis, Yunnan University, Kunming, China, 2023. [Google Scholar]
  10. Wang, N.; Zhong, T.; Zheng, J.; Meng, C. Prediction of Kunlun Mountain Glacier Lake Distribution Based on Land Use/Cover Prediction Model. Yangtze River 2023, 54, 83–90. [Google Scholar] [CrossRef]
  11. Lu, H.; Zhao, R.; Zhao, L.; Lyu, B.; Wang, J.; Zhang, L. A contrarian growth: The spatiotemporal dynamics of open-surface water bodies on the northern slope of Kunlun Mountains. Ecol. Indic. 2023, 157, 111249. [Google Scholar] [CrossRef]
  12. Chen, Y.; Li, Z.; Fang, G.; Deng, H. Impact of climate change on water resources in the Tianshan Mountians, Central Asia. Acta Geogr. Sin. 2017, 72, 18–26. [Google Scholar]
  13. Agency, X.N. Scientific Exploration Discovers: Ayakkum Lake Becomes the Largest Lake in Xinjiang in Terms of Water Area. Available online: http://www.news.cn/local/2023-03/24/c_1129461404.htm (accessed on 24 March 2023).
  14. Wu, J.; Gao, X.; Giorgi, F.; Chen, D. Changes of effective temperature and cold/hot days in late decades over China based on a high resolution gridded observation dataset. Int. J. Climatol. 2017, 37, 788–800. [Google Scholar] [CrossRef]
  15. Yang, K.; Yaozhi, J. A long-term (1979-2020) high-resolution (1/30°) precipitation dataset for the Third Polar region (TPHiPr). Available online: https://cstr.cn/18406.11.Atmos.tpdc.272763 (accessed on 24 April 2022).
  16. Peng, S.; Zhang, D.Y.; Liu, W.; Zhi, L. 1 km monthly temperature and precipitation dataset for China from 1901 to 2017. Earth Syst. Sci. Data 2019, 11, 1931–1946. [Google Scholar] [CrossRef]
  17. Jiang, Y.; Yang, K.; Qi, Y.; Zhou, X.; He, J.; Lu, H.; Li, X.; Chen, Y.; Li, X.; Zhou, B.; et al. TPHiPr: A long-term (1979–2020) high-accuracy precipitation dataset (1∕30°, daily) for the Third Pole region based on high-resolution atmospheric modeling and dense observations. Earth Syst. Sci. Data 2023, 15, 621–638. [Google Scholar] [CrossRef]
  18. Kalnay, E.; Kanamitsu, M.; Kistler, R.; Collins, W.; Deaven, D.; Gandin, L.; Iredell, M.; Saha, S.; White, G.; Woollen, J.; et al. The NCEP/NCAR 40-Year Reanalysis Project. Bull. Amer. Meteorol. Soc. 1996, 77, 437–472. [Google Scholar] [CrossRef]
  19. Zhang, L.; Liu, Y.-f.; Zhan, H.-b.; Jin, M.; Liang, X. Influence of solar activity and EI Niño-Southern Oscillation on precipitation extremes, streamflow variability and flooding events in an arid-semiarid region of China. J. Hydrol. 2021, 601, 126630. [Google Scholar] [CrossRef]
  20. Zhang, Q.; Lai, Y.-c.; Gu, X.-h.; Shi, P.; Singh, V.P. Tropical Cyclonic Rainfall in China: Changing Properties, Seasonality, and Causes. J. Geophys. Res. Atmos. 2018, 123, 4476–4489. [Google Scholar] [CrossRef]
  21. Dong, Y.; Zhai, J.; Zhao, Y.; Li, H.; Wang, Q.; Jiang, S.; Chang, H.; Ding, Z. Teleconnection patterns of precipitation in the Three-River Headwaters region, China. Environ. Res. Lett. 2020, 15, 104050. [Google Scholar] [CrossRef]
  22. Zhang, X.; Chen, Y.; Fang, G.; Li, Y.; Li, Z.; Wang, F.; Xia, Z. Observed changes in extreme precipitation over the Tienshan Mountains and associated large-scale climate teleconnections. J. Hydrol. 2022, 606, 127457. [Google Scholar] [CrossRef]
  23. Zhao, K.; Wulder, M.A.; Hu, T.; Bright, R.; Wu, Q.; Qin, H.; Li, Y.; Toman, E.; Mallick, B.; Zhang, X.; et al. Detecting change-point, trend, and seasonality in satellite time series data to track abrupt changes and nonlinear dynamics: A Bayesian ensemble algorithm. Remote Sens. Environ. 2019, 232, 111181. [Google Scholar] [CrossRef]
  24. Zhao, W.; Hu, Z.; Guo, Q.; Wu, G.; Chen, R.; Li, S. Contributions of Climatic Factors to Interannual Variability of the Vegetation Index in Northern China Grasslands. J. Clim. 2020, 33, 175–183. [Google Scholar] [CrossRef]
  25. Wang, J.; Xu, C. Geodetector: Principle and prospective. Acta Geogr. Sin. 2017, 72, 116–134. [Google Scholar]
  26. Zhang, X.-X.; Xu, C.-D.; Xiao, G.-X. Spatial heterogeneity of the association between temperature and hand, foot, and mouth disease risk in metropolitan and other areas. Sci. Total Environ. 2020, 713, 136623. [Google Scholar] [CrossRef] [PubMed]
  27. Daily, X. Guardian of “Gold Mountain” All-Media Series Report 3|Ayakkokum Lake “Grows Fat” for 30 Years with New Area Exceeding That of Sayram Lake. Available online: http://www.egi.cas.cn/xwdt/mtsm/202207/t20220722_6492456.html (accessed on 22 July 2022).
  28. Abatzoglou, J.T.; Dobrowski, S.Z.; Parks, S.A.; Hegewisch, K.C. TerraClimate, a high-resolution global dataset of monthly climate and climatic water balance from 1958–2015. Sci. Data 2018, 5, 170191. [Google Scholar] [CrossRef]
  29. Xiao, X.; Qiu, X.; Xu, J. Characteristics of Dry and Wet Climate Change in China from 1960 to 2019 Based on TerraClimate Dataset. J. Yangtze River Sci. Res. Inst. 2023, 40, 27–33+43. [Google Scholar]
  30. Kong, Q.; Ge, Q.; Zheng, J. Spatio-temporal changes in extreme UTCI indices in China. Geogr. Res. 2017, 36, 1171–1182. [Google Scholar]
  31. Yang, P. Analysis of Summer Precipitation Variation Characteristics in Urumqi Region. Agric. Technol. 2018, 38, 144–147. [Google Scholar]
  32. Huang, R.; Wang, K.; Zhang, T.; Lei, X.; Feng, J. Analysis of Temporal and Spatial Variation Characteristics of Atmospheric Precipitation in Shandong Province Based on ERA5 Data. Beijing Surv. Mapp. 2023, 37, 409–414. [Google Scholar] [CrossRef]
  33. Zhang, Z.; Lou, Y.; Zhang, W.; Liang, H.; Bai, J.; Song, W. Correlation Analysis between Precipitation and Precipitable Water Vapor over China Based on 1999–2015 Ground-Based GPS Observations. J. Appl. Meteorol. Climatol. 2022, 61, 1669–1683. [Google Scholar] [CrossRef]
  34. Yu, B.; Liu, J.; An, D.; Zhang, Y. Characteristics of Variations in GPS-Based Atmospheric Precipitable Water over the Western Nanjiang and the Northern Slope of Kunlun Mountains from 2017 to 2019. Desert Oasis Meteorol. 2022, 16, 25–33. [Google Scholar]
  35. Yao, Y.; Luo, D. The North Atlantic Oscillation (NAO) and Europe Blocking and Their Impacts on Extreme Snowstorms: A Review. Advance in Earth Sciences 2016, 31, 581–594. [Google Scholar]
  36. Du, Y.; Zhang, J.; Zhao, S.; Chen, H. Impact of the Eastward Shift in the Negative-Phase NAO on Extreme Drought Over Northern China in Summer. J. Geophys. Res. Atmos. 2020, 125, e2019JD032019. [Google Scholar] [CrossRef]
Figure 1. Overview of study area.
Water 16 01203 g001
Figure 2. The technical flowchart.
Water 16 01203 g002
Figure 3. Annual precipitation changes on the northern slope of the Kunlun Mountains during the historical period. (a) The changes in annual precipitation from 1979 to 2020 for the northern slope region of the Kunlun Mountains and its four sub-regions; (b) the annual precipitation in the northern slope region of the Kunlun Mountains before and after the four identified change points.
Water 16 01203 g003
Figure 4. Decomposition of precipitation and the identification of change points in historical periods on the northern slope of the Kunlun Mountains. Note: The first panel displays the annual precipitation changes in the northern slope region of the Kunlun Mountains from 1979 to 2020, along with the optimal model fit. The second panel shows the probability of occurrence for the detected change points. The third panel presents the slope of the trend component decomposed using the Bayesian ensemble algorithm. The fourth panel illustrates the probability of the trend component’s slope (where red indicates a positive slope, green indicates no change, and blue indicates a negative slope). The fifth panel showcases the residual component decomposed based on the Bayesian ensemble algorithm.
Water 16 01203 g004
Figure 5. Seasonal variation in precipitation on the northern slope of the Kunlun Mountains.
Water 16 01203 g005
Figure 6. Spatial variation in seasonal precipitation on the northern slope of the Kunlun Mountains from 1979 to 2020.
Water 16 01203 g006
Figure 7. Interdecadal variation in precipitation on the northern slope of the Kunlun Mountains from 1979 to 2020. (ad) represent the distribution of annual precipitation in the northern slope region of the Kunlun Mountains for the decades 1979–1989, 1989–1999, 1999–2009, and 2009–2019, respectively; (e,f) depict the spatial distribution of average precipitation before and after the change year (the year with the highest probability of being a change point as identified by the Bayesian ensemble algorithm, specifically 2010).
Water 16 01203 g007
Figure 8. (a) Spatial distribution and (b) trend change of multi-year average precipitation on the northern slope of the Kunlun Mountains. Note: black dot indicates significance at the 95% confidence level.
Water 16 01203 g008
Figure 9. (a) Interannual variation and (b) interdecadal variation in annual mean minimum/maximum temperature in the northern slope of the Kunlun Mountains.
Water 16 01203 g009
Figure 10. Spatial distribution of multi-year average (a) minimum and (b) maximum temperature in the northern slope of the Kunlun Mountains.
Water 16 01203 g010
Figure 11. Seasonal variation characteristics of atmospheric precipitable water vapor content on the northern slope of the Kunlun Mountains from 1979 to 2020.
Water 16 01203 g011
Figure 12. Correlation heat map of annual precipitation and atmospheric teleconnection factors on the northern slope of the Kunlun Mountains.
Water 16 01203 g012
Table 1. Identification of breakpoints of precipitation and their probability based on the Bayesian ensemble algorithm on the northern slope of the Kunlun Mountains.
Change PointsProbability of Occurrence for the Detected Change Points (%)Jump in the Fitted Trend Curve at the Change Point
201022.861.9177
198416.16−0.1220
201615.230.7183
200110.160.3866
Table 2. Changes in atmospheric precipitable water vapor content on the northern slope of the Kunlun Mountains (%).
Periods123456789101112
1979–20204.194.675.987.599.6812.5414.7913.7610.016.855.304.63
1979–20104.324.736.017.539.6712.3914.8813.449.946.885.374.83
2011–20203.794.505.897.779.7012.9614.5314.7310.206.775.114.07
Table 3. The degree to which large-scale climate teleconnection factors explain precipitation changes on the northern slope of the Kunlun Mountains.
NAOSFAMOEAMNSI
SF0.57 (0.31, 0.44)NA
AMO0.79 (0.47, 0.44)0.49 (0.47, 0.31)NA
EAM0.59 (0.20, 0.44)0.52 (0.20, 0.31)0.22 (0.20, 0.47)NA
NSI0.88 (0.16, 0.44)0.61 (0.16, 0.31)0.29 (0.16, 0.47)0.43 (0.16, 0.20)NA
Note: Orange indicates a non-linear enhancement in the interaction between two factors, where the explanatory power after interaction exceeds the sum of their explanatory powers before interaction (p(X1∩X2) > p(X1) + p(X2)). Green denotes a dual-factor enhancement, where the explanatory power after interaction surpasses the maximum explanatory power of the two factors before interaction (p(X1∩X2) > Max(p(X1), p(X2))). Blue represents a non-linear weakening in a single-factor interaction, where the explanatory power after interaction is greater than the minimum explanatory power of the two factors before interaction, yet less than their combined sum (Min(p(X1), p(X2)) < p(X1∩X2) < p(X1) + p(X2)). The values in the table represent p(X1∩X2) (p(X1), p(X2)). For instance, the first row and first column, 0.57 (0.31, 0.44), indicates that SF explains 31% of the precipitation variation, NAO explains 44%, and their interaction leads to a 57% explanation, indicative of a dual-factor enhancement interaction.
Disclaimer/Publisher’s Note: The statements, opinions and data contained in all publications are solely those of the individual author(s) and contributor(s) and not of MDPI and/or the editor(s). MDPI and/or the editor(s) disclaim responsibility for any injury to people or property resulting from any ideas, methods, instructions or products referred to in the content.

