
Climate Variability, Coastal Livelihoods, and the Influence of Ocean Change on Fish Catch in the Coastal Savannah Zone of Ghana


1
Geography Department, Faculty of Arts and Humanities, University of Porto, via Panorâmica Edgar Cardoso, 4150-564 Porto, Portugal
2
Centre of Studies in Geography and Spatial Planning (CEGOT), Geography Department, University of Porto, via Panorâmica Edgar Cardoso, 4150-564 Porto, Portugal
3
Research Centre for Territory, Transports and Environment (CITTA), Rua Dr. Roberto Frias s/n, 4200-465 Porto, Portugal
*
Author to whom correspondence should be addressed.
Water 2024, 16(9), 1201; https://doi.org/10.3390/w16091201
Submission received: 25 March 2024
/
Revised: 17 April 2024
/
Accepted: 19 April 2024
/
Published: 23 April 2024
(This article belongs to the Section Oceans and Coastal Zones)
Abstract
:Coastal zones, despite their contribution to global economies, continue to suffer the negative impacts of climate variability, which limit the livelihoods of people, particularly small-scale fishermen. This study examined climate variability, coastal livelihoods, and the influence of ocean change on the total annual fish catch in Ghana’s Coastal Savannah zone. The mixed-methods approach was used to analyze primary data (semi-structured questionnaires and interviews), secondary data (sea surface temperature (SST) and salinity (SSS), and fish catch), and statistical tests (chi-square, binary logistic regression, and multiple regression). Findings revealed a significant increase in climate variability awareness among fishermen, attributed to the influence of broadcast media. However, they lack sufficient information regarding the transformation of cities, the urbanization process, and its impact on the global climate. Increasing temperatures and sea level rise emerged as the most prevalent impacts of climate variability over the past two decades in the zone. Although the fishermen lack awareness regarding the changes in SSS and their effects on fish, the findings of the multiple regression analysis established that changes in SSS exert a more pronounced effect on the decreasing fishing catch in the zone compared to those in SST. Empirical fish catch records supported the fishermen’s claim of a substantial decrease in total fish catch in the zone over the past 20 years. Aside from climate variability impacts, the involvement of many people and light fishing emerged as additional factors contributing to the decreasing fish catch in the zone. High premix fuel prices or shortages and “saiko” activities were the main obstacles that hindered the fishermen’s activities. “Saiko” is an unlawful activity in which foreign industrial trawlers sell fish directly to Ghanaian canoes or small-scale fishermen at sea. The fishermen lack sufficient means of supporting their livelihoods, as there is a lack of viable alternative livelihood options. Additionally, the majority of the fishermen experience symptoms of fever and headaches. The binary logistic regression analysis showed that the fishermen’s income insufficiency could be substantially reduced if they were to have their own houses, canoes, or fish all year. This situation highlights the need for heightened support from policymakers for improved sustainable livelihood prospects as well as health and well-being.

1. Introduction
The impacts of climate variability are evident in all areas, including the world’s coastal zones [1]. Coastal zones provide numerous benefits such as food provision, fishing, employment, tourism, recreation and leisure, and habitat for aquatic species [2,3]. As a result, they are recognized among the regions of the world that favor population concentration [2,4]. Small and Nicholls [5] emphasized an estimate that 30% of the global population are at or near the coast. Coastal zones thus serve as an important region that contributes significantly to the sustainable development of global economies [6]. Nevertheless, Ahmed [7] asserts that the sustainability of the world’s coastal zones remains uncertain due to the greater threats imposed by climate variability. The combined effects of climate variability and sea level rise, as evidenced by extreme changes in coastal high water levels, could pose threats to both the biophysical and socio-economic systems of the coastal zones [8,9]. The findings of Church et al. [10] and Nicholls et al. [11] have brought attention to the potential rise in mean sea level by one meter or more by the year 2100, as well as between 0.38 and 0.77 m within the same timeframe, as reported by the Intergovernmental Panel on Climate Change [12]. These projections indicate significant implications for coastal zones and their environments. Coastal zones, including their infrastructure, economies, and livelihoods, could be negatively impacted by climate variability and sea-level-rise-related hazards such as coastal erosion, inundation and flooding, shoreline change, intrusion of saline waters, and disruption of aquatic habitats and fisheries, among others [4,13]. Although climate variability and oceanographic changes have numerous effects on the coastal zone, their effects on fish and fisheries continue to be significant. Fisheries serve as an important source of protein [14,15], and account for 17.3% of the global total animal proteins [16].
Aside from their contribution to global food security, fisheries also provide livelihood opportunities to several million people, especially in small-scale fisheries in developing countries [17,18]. For instance, Stacy et al. [18] reported that 2.5 million households are involved in small-scale fisheries in Indonesia. In Africa, about 12.3 million (2.1%) of the people aged between 15 and 64 are engaged in fisheries, which account for more than USD 24 billion or 1.26% of the gross domestic product (GDP) of all African countries [19]. In West Africa, marine artisanal fisheries support the livelihoods of about 6.7 million people, with a catch value of USD 3.5 billion per year [20]. In Ghana, the fisheries sector provides livelihoods to about 2.6 million people, which account for 10% of the entire population and contribute to about three percent of the country’s GDP [21]. The sector also contributes 53.9% of the country’s total animal proteins [16]. Marine artisanal fisheries remain the main source of Ghana’s fish production, livelihood activity, and account for 80% of the total annual fish catch [17,22].
In recent years, the effects of climate variability have had a negative impact on the fish and fisheries sectors [23,24,25,26,27]. The changing global climate affects the physical and biogeochemical characteristics of the ocean, such as temperature, pH, oxygen content, and wind patterns [28]. Sea surface temperature (SST), for example, is considered an important environmental factor for fish habitats [29]. In the northwestern Pacific Ocean, an SST front is reported to affect the distribution of Pacific saury (Cololabis saira) [29]. Between 1982 and 2006, SST in West Africa increased by 0.52 °C, 0.46 °C, and 0.24 °C [30]. The changes in SST thus affect the primary productivity, eco-physiology, and ecology of marine species, which result in shifts in species distribution, phenology, ecosystem functions, and trophic interactions [24,31]. The changes in fish distribution and primary production are projected to cause widespread restructuring of the global catch potential [24]. As a result, Cheung et al. [32] reported an increase and a decrease in catch potential at higher latitudes and in tropical regions, respectively. In West Africa, Lam et al. [33] reported a projected decrease in fish landings by 2050 for the regions along the Gulf of Guinea and a slight increase for those in the Canary Current large marine ecosystem. Barange et al. [34] also predicted an increase of 23.9% in fish catch potential for the Gulf of Guinea regions and a decrease of 14.6% for those along the Canary Current areas. Despite the discrepancies in their studies, all models have revealed the sensitivity of the West African fisheries to climate variability [24]. Apart from climate and oceanographic changes that affect global fish and fisheries, negative anthropogenic activities such as overfishing, unregulated fishing, transshipment, pollution, and habitat degradation are also found to have negative impacts on fish and fisheries [31,35,36]. Alder and Sumaila [37] and Atta-Mills et al. [38] informed us about the increasing pressure of foreign fleets on the West African marine ecosystems. In Ghana, Atta-Mills et al. [38] attributed the decline in fish stocks to overfishing, a lack of good governance, and the use of destructive approaches.
In recent times, research studies on climate variability and the livelihoods of coastal artisanal fisheries have increased in many regions (e.g., [39,40,41,42,43,44,45,46,47,48]), including Ghana (e.g., [23,49,50,51,52,53,54,55,56]. Despite the increase, research on climate variability and the livelihoods of Ghana’s coastal artisanal fisheries is limited to a few sections of the country’s coast. Most studies focus on fishing communities in the western region (Rain Forest zone), at the expense of other equally important fishing communities in the Central, Greater Accra, and Volta regions (Coastal Savannah zone). Ankrah [23] and Koomson et al. [50] made efforts for the Coastal Savannah zone; however, their studies were limited to only coastal Winneba. Their studies, while significant, failed to recognize local variations and the diverse characteristics of individual fishing communities throughout the Coastal Savannah zone. Again, Ayilu et al. [51] focused on the livelihoods of four coastal fishing communities in the Greater Accra region in addition to those studied in the Western region; the researchers did not attempt to recognize the perceived impacts of climate variability on the fishers’ livelihoods. In addition, while Okyere et al. [52] covered the entire Ghanaian coast, their work was limited to the capacity deficit of fishers, which focused more on leadership and governance at the expense of the fisher’s livelihood opportunities. Their work also had limited coverage, as they selected only five fishing communities in the entire coastal stretch of Ghana. The limited locational study may have an impact on policy intervention and direction because policymakers should understand the diverse characteristics of individual communities to make an appropriate decision. Currently, there exists a dearth of information regarding the impact of climate variability on the livelihood of coastal artisanal fisheries in the Volta region, as far as our knowledge extends. These studies failed to demonstrate a comprehensive understanding of the effects of local oceanic component changes on fishery yields.
To fill these gaps, the aim of the present study is to analyze climate variability impacts on the livelihoods of fishers in the Coastal Savannah zone of Ghana. The study specifically examined fishers’ perceived causes and knowledge about climate-related and oceanic impacts, sources of livelihood aside from fishing, and the influence of SST and sea surface salinity (SSS) on the total annual fish catch. This research not only adds to the existing body of knowledge on climate variability and its impact on fisheries but also has the potential to inform the development of effective policies aimed at protecting the livelihoods of coastal fishers in the zone. It also highlights the opportunity and added value of improved fishermen’s climatological literacy and the importance of informal knowledge in science.
2. Materials and Methods
2.1. Study Area
Three coastal portions of the Central, Greater Accra, and Volta regions constitute the Coastal Savannah zone of Ghana. The zone thus forms 20 out of the 26 coastal metropolitan, municipal, and district assemblies (MMDAs) and occupies three out of the four coastal regions of the country [22]. The zone, which contains the three regions, forms about 70% of the country’s 560 km2 coastline and a total of 203 landing beaches, which account for 69% of the country’s total fish landing sites [22]. The remaining 89 (31%) belong to the Western region, as indicated in the earlier work of Owusu and Adjei [55]. Among the three regions, the Central region has a total of 97 (33%) fish landing sites, followed by the Greater Accra region with 59 (20%), and the lowest with 47 (16%) in the Volta region. Although agricultural, commerce, and tourism activities exist, fishing is considered an important occupation and a major source of livelihood for about 2.6 million people, which accounts for 10% of the entire population [17,21,22].
The main fish species caught across the zone include Atlantic little tuna (Euthynnus alleratus), Scad Mackerel (Caranz rhoncus), Chub Mackerel (Scomber colias), Frigate mackerel (Auxis thazard), Sardinella (Sardinella spp.), Threadfin (Galeoides decadactylus), Burrito (Brachydeuterus auritus), Anchovy (Engraulis encrasicolus), Cassava fish (Pseudotolithus senegalensis), and Bumper (Chloroscombrus chyrsurus), among others [22]. The zone has a total of 114 (61%) out of the 186 fishing communities and 73,916 (69%) out of the 107,518 fishermen across the country [22]. Among the three regions, the Central region has the most (44 (39%)) fishing communities, followed by the Greater Accra (42 (37%)), and the Volta (28 (24%)). On the number of fishermen, the majority (33,373 or 45%) are found in the Central region, followed by Greater Accra with 25,844 (35%), and the lowest (14,599 or 20%) in the Volta region [22]. The types of fishing gear used by the fishermen across the zone include purse seines, beach seines, lines, set nets, Ali nets, and drifting nets [22].
The elevation across the zone ranges from the lowest point of −3.8 m on the coast to the highest point of 641.2 m inland [57]. It has a maximum and minimum mean annual temperature of 27.9 °C and 26.6 °C, respectively [57,58]. Although the zone has a bimodal rainfall regime [59], it is considered the driest and receives the lowest rainfall across the country, with the average annual rainfall ranging from a low of 978.4 mm to a high of 1339.9 mm [57].
This study was conducted in 15 communities across the zone (Table 1). These communities were selected due to their significant contributions, number of fishermen, and greater reliance on fishing for livelihood [22]. Prior to the selection of the 15 communities, we read the information report sheet of the 2016 Ghana marine canoe frame survey, an official document by the fisheries and scientific survey division of the fisheries commission under Ghana’s ministry of fisheries and aquaculture development [22]. Several other communities (see Figure 1) met the selection criteria and held equal significance for the study. Nevertheless, these communities were not reachable due to constraints on resources and the time needed to conduct the study.
2.2. Methodology
This study employed both primary and secondary data sources. The primary data sources were obtained from semi-structured questionnaire administration and interviews. The secondary data used in this study included the monthly mean beach SST measured in °C and daily beach SSS in ‰ from the coastal stations of Winneba, Tema, and Keta located in the Coastal Savannah zone (period from 2000–2020). In addition, the study used marine artisanal fish catch data (in metric tons) in the zone for the same period. The above data were obtained from the Ghana Fisheries Commission’s Scientific and Survey Division. The Ghana Fisheries Commission’s Scientific and Survey Division is responsible for the evaluation of Ghana’s marine ecosystem and fisheries, etc. Regarding the marine environment, the Scientific and Survey Division thus monitors and measures oceanographic variables, including the measurement of SST, SSS, and dissolved oxygen, among others. The oceanographic measurements are collected across several coastal stations along Ghana’s coastal areas, including Keta, Tema, Winneba, and Takoradi, among others. On fisheries (fish stock and statistics), the Scientific and Survey Division performs numerous activities, including the estimation of annual fish production, while on fishing gear, it conducts studies on gears and improves on the existing ones (https://www.mofad.gov.gh/agencies/fisheries-commission/fisheries-commission-at-a-glance/, accessed on 30 May 2023).
This study falls under the case study research design [60,61] and uses the mixed-method (both qualitative and quantitative) approach [62] to analyze climate variability impacts on the livelihoods of fishers in the Coastal Savannah zone of Ghana. The case study design, as reiterated by Crowe et al. [60], is used to explore the in-depth nature of complex issues. Yin [61] further highlighted that the case study design is more suitable for obtaining information on highly explanatory questions. The research design followed in this study is one of several considered appropriate due to the complexities in the understanding and explanation of the concept of climate variability’s related impacts on fisheries and livelihoods. The data collection process used in this study was guided by the climate-related risk [63] and sustainable livelihood [64] frameworks and was conducted between February and April 2023.
By employing a simple sample selection technique, a semi-structured questionnaire was administered to 350 fishermen in each of the 15 communities (see Table 1) used in this study, for a total of 5250 participants. Again, the purposive sampling technique was employed to interview 15 leaders of the fishing groups, with one leader from each of the 15 communities. A total of 5265 participants were thus sampled for the study. The study followed Yamane’s [65] formula for sample size to estimate the minimum sample size for the communities used in this study as follows:
where n denotes the sample size, N represents the population size, and e indicates the error term.
Using Equation (1) and assuming a 5% error and a 95% confidence interval, the minimum sample size required for the communities ranged from 232.64 in Cape Coast to 331.03 in Nyanyano, making the sample of 350 used in this study representative.
Leaders of the fishermen’s groups as used here denote fishermen who are natives and have lived in their respective fishing communities for more than 40 years, have bought their own canoes, are actively involved in fishing, and have employed other fishermen. These people were considered key informants based on their level of involvement in the fishing activity and length of stay in the community, and they had a broader understanding of the climatic and livelihood conditions.
This study was directed at only fishermen and no other fisher groups (e.g., fish sellers and fish mongers) because of the components of ocean (sea) changes included in the semi-structured questionnaire. That is, the fishermen are those who go fishing on the sea and could share their perspectives regarding oceanic parameters such as SST and SSS, etc. The participants for the questionnaire administration were randomly selected based on a set of criteria: they lived in the community and had been fishing for at least 10–20 years; they had knowledge about climate variability impacts on coastal environments and fishermen; and they were aware of the major challenges that limited their fishing activity. The reasons behind the selection process were to focus on Indigenous fishermen, or those who have established a longstanding presence within their respective communities, as opposed to individuals who have only recently migrated for the purpose of engaging in fishing activities. For the interview, one must be a native, have lived for more than 40 years in the respective fishing community, operate their own canoe, employ other fishermen, and depend solely on fishing for their livelihoods. The number of years lived and being a native of the community distinguished the participants for the questionnaire administration from those for the interview.
The semi-structured questionnaire employed in this study consisted of four sections, including socio-demographic characteristics, perceived causes of climate variability, perceived climate-related impacts, and alternative livelihood engagement opportunities aside from fishing. Some key questions asked included, but were not limited to: Have you heard about climate variability? If yes, where did you hear it, and what is causing it? In your view, which of the following factors is causing climate variability? Which of the following impacts has been the most common in this area over the last two decades? In your opinion, does climate variability have any impact on fish populations? Do you think changes in SST affect fish and fish stocks? How do you perceive the total number of fish caught over the last two decades? The questionnaire consisted of both closed-ended and open-ended questions. Whereas the closed questions offered the participants options to select from a range of answers, the open-ended questions gave them a chance to express and share their experiences regarding climate variability and the related impacts on coastal environments and on their livelihoods. On average, a questionnaire takes about 20 to 30 min of a participant’s time.
Six field assistants were taken through the questionnaire, the use of the KoboToolbox software version 2021.2.4 (https://www.kobotoolbox.org/), and some ethical issues in data collection. There was diversity in the selection of the field assistants based on the distinct languages (i.e., Fante, Ga-Dangme, and Ewe) spoken in the 15 selected communities. The questionnaire was administered to the respondents via mobile phones utilizing the KoboToolbox between February and April of 2023. The KoboToolbox software (https://www.kobotoolbox.org/) is a robust and insightful data collection tool that allows both online and offline data collection from one’s mobile phone.
Data from the questionnaire administration were exported in Excel format and imported into the Statistical Package for the Social Sciences (SPSS) software (version 26.0) for analysis. Consequently, a suitable statistical analysis was executed. In this study, variables such as age, marital status, education, household size, all-year fishing (fishing trips), house ownership, and canoe ownership were considered independent variables. These variables were considered to independently influence, based on the literature, the income status (sufficiency or insufficiency) of fishermen [66,67,68,69,70], even though other factors such as fishing knowledge, fish gear used, fish prices, and fishing costs have an influence on a fishermen’s income status [69,71,72]. Here, the chi-square test of independence was employed to evaluate the associations between independent variables and the livelihood opportunities of fishermen and others, with the Cramer’s V statistic showing the strength of the associations. Again, the binary logistic regression test was used to evaluate the effects of the independent variables on the livelihood opportunities (i.e., income sufficiency) of the fishermen. The decision to employ binary logistic regression in this study was based on its wide utilization in the existing body of literature concerning climate variability and the livelihood opportunities of fishermen. Several studies, including Macusi et al. [72], Malakar et al. [73], and Muallil et al. [74], have utilized this approach. We selected the statistical procedures based on the categorical nature of the variables in this study, most of which were dichotomous. The purpose was to understand the potential of these variables in predicting the likelihood of a decrease in the insufficiency status of income among fishermen. The multiple linear regression test was also used to determine if changes in SST and SSS predicted the decreased total annual fish catch in the zone.
Questions raised during the interview included, but were not limited to, whether the number of fish caught by their group keeps increasing every year or is the opposite; the major challenges they and other groups face that affect their fishing activity; and the livelihood opportunities (i.e., their satisfaction with the income they make from fishing and whether it is enough to cater for their family’s expenses; the ease of obtaining loans from banks; and whether they and their group engage in other income-earning activities aside from fishing). Before the start of the interview, the participant was presented with a consent form detailing their rights, including that the interview was voluntary, and they had the right to withdraw or request that their already-captured responses be withdrawn or deleted from the research. The participant was assured of anonymity and confidentiality by not revealing their personal traits, such as their name. The abbreviations FL1, FL2, FL3, FL4, FL5, FL6, FL7, FL8, FL9, FL10, FL11, FL12, FL13, FL14, and FL15 were used to represent the fishing group’s leaders’ names, which were then followed by their respective communities. For example, the abbreviations FL1: Elmina, FL2: Cape Coast, FL3: Moree, FL4: Biriwa, FL5: Apam, FL6: Gomoa Fetteh, FL7: Nyanyano, FL8: Bortianor, FL9: James Town, FL10: Teshie, FL11: Azizanya, FL12: Dzita, FL12: Vodza, FL14: Agavedzi, and FL15: Adina represent the fishing group’s leaders in the communities of Elmina, Cape Coast, Moree, Biriwa, Apam, Gomoa Fetteh, Nyanyano, Bortianor, James Town, Teshie, Azizanya, Dzita, Vodza, Agavedzi, and Adina, respectively. The interview started only when the participant agreed and signed the consent form. The interview occurred at a location where the participant was engaged, particularly at their home, and in the instance where the participant was at the shore, the interview was carried out at the place where they were free and without any third party. The interview was conducted using the language the leaders were familiar with (e.g., Fante, Ga-Dangme, Ewe, and Twi). The interviews were taped only with the mutual consent of the interviewer and the participant. Additionally, comprehensive notes were taken, resulting in a cumulative duration of 375 h, with each of the 15 leaders of the fishing groups being interviewed for 25 min.
Prior to starting the interview, the researchers engaged in a comprehensive analysis of positionality and social interactions, considering their potential influence on the process of acquiring data and the subsequent interpretation of results [75]. The first author, a native of the study area, adopted an insider, or emic ontological position, to conduct interviews with the fishing group leaders [75,76]. The leaders of the fishing group developed confidence and perceived the first author as harmless. The leaders of the fishing group were transparent and provided detailed insights on the pattern of fish catch, the major challenges they faced that impacted their fishing activities, and their livelihood opportunities. The first author’s perception as harmless by the fishing group leaders motivated the researcher to pose more detailed questions. This position did not have any impact on the qualitative results but rather contributed to the comprehension of the detailed shared knowledge and experiences of the leaders of the fishing group. In this study, the researchers took measures to maintain objectivity, cultural neutrality, and impartiality towards the biases of the fishing group’s leaders during the interview transcription process, despite the presence of insider positionality [75,76].
This study gained insights from the presentation of the findings in the qualitative study carried out by Arku et al. [77]. The study aimed to achieve three primary research goals: determining the pattern of fish catch, identifying the major challenges encountered by fishing leaders and their groups that impact their fishing activities, and assessing their livelihood opportunities, including income sufficiency, accessibility to bank loans, and alternative activities that engage their livelihoods apart from fishing. The study of interviews performed with leaders of fifteen fishing groups was driven by these aims. The data analysis in this study employed an engaging and inductive qualitative approach, as described by Arku et al. [77] and Strauss and Corbin [78], to directly create themes. The interviews conducted with the fishing group leaders were transcribed from their respective local languages into the English language. The interview notes were thoroughly examined, and the recorded audio was repeatedly reviewed to guarantee the reliability and accuracy of the results [77,79]. The interview transcripts were classified into themes based on the fishing group’s leaders’ observations regarding the pattern of fish catch, the major challenges they faced that impacted their fishing activities, and their livelihood opportunities. The interview transcripts contain direct quotations that represent the themes and constructs that offer contextual information regarding the answers of the leaders of the fishing group. These responses were obtained through interviews conducted between February and April 2023.
2.3. Ethical Considerations
Prior to the start of the research, the research ethics protocol was followed, and approval was obtained from the ethics committee of the Faculty of Arts and Humanities at the University of Porto. The research, including the data collection instruments, was reviewed for ethical conformity and to ensure that it did not involve any risk or disadvantage to the participants. This was approved with resolution No. 31/CEFLUP/.
3. Results
3.1. Socio-Demographic Characteristics of Respondents
The socio-demographic characteristics of the respondents across the entire zone and the individual study communities are shown in Figure 2a–f and Table 2, respectively. Across the zone, the greatest proportion (41% or 2170) of respondents were between the ages of 30 and 40, while the lowest (8% or 393) were above the age of 50 (Figure 2a). All the respondents were male (100% or 5250), and a large proportion of respondents (91% or 4791) were married, with just a few (9% or 459) being single (Figure 2b). Again, across the zone, the majority (55% or 2875) of respondents had primary school education, while none (0 or 0.0%) had senior secondary/high school or higher education (Figure 2c). Furthermore, a greater proportion (52% or 2749) of respondents across the zone had a household size of >5, while the smallest (12% or 610) had a household size of 3 (Figure 2d). The majority (44% or 2335) of respondents had resided in the zone for 41–50 years, with the least (8% or 393) having lived there for 51 years or more (Figure 2e). In addition, a higher proportion (47% or 2472) of respondents across the zone had been fishing for 21–30 years, while the lowest (13% or 694) had been fishing for 10–20 years (Figure 2f).
According to Table 2, the ages of the respondents differ greatly across the study communities. Nevertheless, it appears that most respondents are between the ages of 30–40 and 41–50, followed by <30 years, and the lowest being those >50 years. Dzita, for example, appears to have the majority (59% or 208) of respondents aged 41 to 50 years, followed by Azizanya (58% or 204) and Gomoa Fetteh (57% or 199) for the age range 30 to 40 years, and the lowest in Cape Coast (2% or 8). In terms of marital status, married respondents outnumbered single respondents across the study communities. Azizanya had the largest (99% or 346) number of married respondents among the communities, followed by Cape Coast (98% or 344), Dzita (96% or 336), and the lowest in Azizanya (1% or 4) for single respondents.
Most respondents had either completed primary school or had no formal education, with junior secondary or high school coming next in terms of education level. Most respondents with primary education (73% or 256) appeared in Vodza, then (72% or 253) in Adina, and (0% or 0) for senior secondary/high school and tertiary level in all the communities. The number of households varied substantially among communities. Despite variations, most respondents had household sizes ranging from 4 to >5. Cape Coast had the highest number of respondents (63% or 220) with a household size >5, followed by Dzita (62% or 216) with a household size >5, while Cape Coast had the fewest (2% or 8) with a household size 3.
According to Table 2, the majority of respondents had lived in their communities between the years of 31–40 and 41–50. Dzita had the largest proportion (66% or 230), Agavedzi was second (57% or 198), and Cape Coast had the lowest (2% or 6). Furthermore, most of the respondents in the communities had been fishing between the years 21–30 and 31–40. Gomoa Fetteh had the highest proportion (63%, 220) of respondents who had fished for 21 to 30 years, followed by Nyanyano (60% or 210), and Dzita had the lowest proportion (4% or 14).
3.2. Perceived Causes and Knowledge about Climate Variability
Figure 3a–g demonstrates the respondents’ perceived causes and knowledge of climate variability across the entire zone and the individual study communities, respectively. A significant proportion of respondents across the zone (100% or 5250) were aware of climate variability (Figure 3a). Again, a higher number (81% or 4228) identified television as their primary source of information regarding climate variability, followed by radio (19% or 1008) and newspapers (0% or 14) (Figure 3b). Furthermore, a larger number (45% or 2347) of respondents attributed climate variability to negative human actions, followed by both negative human actions and natural events (27% or 1416), and the lowest (5% or 282) to the punishment of God (Figure 3c). Deforestation was additionally recognized as the most significant (72% or 3776) factor contributing to climate variability across the zone, followed by natural events (28% or 1467), and the least significant (0% or 0) factors being urbanization and vehicular fumes or carbon monoxide (Figure 3d).
A similar situation can be found in the individual study communities. For example, all (100% or 350) respondents in each study community are aware of climate variability. The sources of information about climate variability in the communities ranged from a high of 91% or 319 for television in Moree to a low of 4% or 14 for newspapers in Apam (Figure 3e). Adina had the most (57% or 201) attribution to negative human actions for the causes of climate variability, whereas Dzita, Vodza, Agavedzi, and Adina had the lowest (0% or 0) attribution to God’s punishment (Figure 3f). Respondents in their individual communities recognized deforestation as the primary contributor to climate variability, with the highest response (83% or 292) shown for both Bortianor and Adina (Figure 3g). Bush burning, urbanization, and vehicular fumes or carbon monoxide were perceived by the respondents in most of the communities as the lowest (0% or 0) contributors (Figure 3g).
3.3. Perceived Climate-Related and Oceanic Impacts
Figure 4a–i and Table 3 depict the respondents’ views of climate-related and oceanic impacts across the entire zone and the individual study communities, respectively. Respondents across the zone perceived rising temperatures as the most common (34% or 1759) impact of climate variability over the last two decades, followed by sea level rise (32% or 1700), and storms and waves as the least common (0% or 3) (Figure 4a). Increased carbon dioxide (CO2) concentrations in the atmosphere and sand mining were identified as the most (53% or 2774) and least (0% or 3) significant factors, respectively, contributing to the most common impacts of climate variability over the last two decades (Figure 4b). Again, a considerable majority (96% or 5040) of respondents acknowledged the impact of climate variability on fish populations (Figure 4c), whereas a minority (4% or 210) did not.
Similarly, a large portion (81% or 4273) of respondents across the zone accepted that changes in SST impact fish and fish stocks, with only a small minority (19% or 977) opposing it (Figure 4d). Figure 4e shows that the vast majority (100% or 5248) of respondents were unaware of the impact that changes in SSS have on fish and fish stocks. Furthermore, a significant proportion (100% or 5250) indicated that the total number of fish caught in the zone has decreased significantly over the last two decades (Figure 4f), with the majority (100% or 5247) attributing the decreased fish catch to other factors in addition to climate variability (Figure 4g). According to Figure 4h, the majority (48% or 2523) of respondents believe that the low fish catch in the zone is due to many people fishing across Ghana’s sea, followed by the use of light in fishing (23% or 1196), and the lowest being the catching of fingerlings (0% or 22). High premix fuel prices or shortages were also indicated by the majority (60% or 3134) of respondents as the main obstacle limiting fishing activities, followed by saiko activities (25% or 1293), and the lowest (0% or 3) being poor fishing equipment (Figure 4i). The term “premix fuel” refers to a particular blend of oil and gasoline used by responders to power their canoes or boats, which is heavily subsidized by the Ghanaian government. The term “saiko” refers to the unlawful trade in fish at sea by foreign industrial trawlers to Ghanaian canoes or small-scale fishermen.
Respondents’ views differ substantially among the study communities. For example, Nyanyano had the highest (59% or 206) response on the most common impact of climate variability over the past two decades on rising temperatures, while Dzita had the second highest (58% or 204) response on sea level rise, and most communities had the lowest (0% or 0) response on storms and waves (Table 3). According to Table 3, increased concentrations of CO2 in the atmosphere were identified as the major factor leading to the most common impact of climate variability over the last two decades, with Nyanyano receiving the greatest number of responses (92% or 323). Again, most respondents in the communities recognized the impact of climate variability on fish populations, with Teshie and Adina having the greatest proportion (100% or 350) of responses (Table 3).
Likewise, most of the respondents in the individual communities were able to identify changes in SST and their impact on fish and fish stocks, with Bortianor having the highest (94% or 328) and lowest (6% or 22) number of responses. According to Table 3, the majority (100% or 350) of respondents in the study communities perceive that changes in SSS have no impact on fish and fish stocks. Furthermore, in the study communities, all respondents (100% or 350) indicated a substantial decrease in the total number of fish caught over the last two decades. Table 3 shows that the other factors contributing to limited fish capture vary considerably among study communities. Nonetheless, the highest factor (81% or 284) was the use of light in fishing, which occurred in Teshie.
When asked about their experience with the above issues, particularly the number of fish caught in the zone and the factors that contribute to it, during the interview, most of the fishing group’s leaders characterized the fish catch as “decreased” and conveyed concerns regarding the diverse factors that contribute to the decrease in fish catch. For instance, a fishing group leader sharing their observation about the decrease in fish catch and citing various factors that have contributed to the decrease expressed the following.
The annual catch of fish has decreased due to factors such as increased sea surface temperature, a lack of trawlers, and increased fishing activity in many parts of the country, which makes it difficult to catch fish deep down.(FL1: Elmina)
Additionally, a fishing group leader reported that:
Fish abundance fluctuates annually, and if more fish are caught this year, it will not be enough for the next two years until the third year.(FL2: Cape Coast)
A fishing group leader further indicated that:
Fish catch has decreased due to factors such as sea temperature, which affects the fish’s behavior and the total catch. The practice of light fishing, which can kill fish, is also causing a divide among fishermen. Some communities, like Saltpond, Gomoa Fete, Winneba, and Nyanyano, oppose light use, while others, like Elmina, Apam, and the Western part of the country, support it.(FL3: Moree)
Another fishing group leader again revealed that:
The total catch has decreased. The fishery closure season by the government should be in April or May, when the sea surface temperature increases, rather than June or July, when fish come to the surface for more catch.(FL4: Biriwa)
Likewise, a fishing group leader established that:
The number of fish caught has substantially decreased due to global change. In addition, some fishermen use harmful chemicals in fishing, and what do you expect? We use light in fishing, which is not harmful. The light attracts more fish, increasing the catch and ensuring survival and repayment of borrowed money from fish sellers.(FL5: Apam)
Similarly, the leader of a fishing group stated that:
The number of fish caught has decreased drastically. We no longer catch the same number of fish as we did when I was younger. In the past, people did not use lights to fish, and there were few fishing nets, but this is no longer the case.(FL6: Gomoa Fetteh)
Moreover, a fishing group leader indicated that:
Fishermen in this area oppose the practice of light fishing. The light draws in both fingerlings and mature fish, leading to their capture. Saiko activities, involving foreigners, also contribute to this issue.(FL7: Nyanyano)
In addition, a fishing group leader revealed that:
We do not get fish these days. In the past, you took your canoe and returned with many fish. There are many regulations now, like the fishery closed season, where we cannot go to the sea for months. While we do not object to the closed season, its implementation is flawed. The date for closure should not be in July; it should be before the sea temperature increases..(FL8: Bortianor)
A fishing group leader also expressed that:
The annual fish catch has decreased due to climate change and the bad attitude of some fishermen, who fish with light, attracting both fingerlings and mature fish.(FL9: James Town)
A fishing group leader indicated that:
We used to get more fish, including salmon and herring. We do not get them anymore because those who fish with light have caught them all.(FL10: Teshie)
Regarding the same issue, a fishing group leader conveyed:
In the past, we used to catch bigger fish, but now we only catch small ones. There are more canoes nowadays, and many people are fishing. On the high seas, people catch fish, select the mature ones, and throw the dead fingerlings back into the sea, driving other fish away. Light fishing is now prevalent and beneficial, although some fishermen argue it is illegal.(FL11: Azizanya)
A fishing group leader noted:
The total catch has decreased, and some species have gone extinct. Factors responsible for this include low-quality fishing equipment, overfishing, illegal fishing activities, and climate change.(FL12: Dzita)
Moreover, a fishing group leader lamented that:
The annual catch of fish has decreased due to sea pollution, making it difficult to catch them, especially with the low-quality fishing equipment that we use.(FL13: Vodza)
One fishing group leader shared his observation as follows:
The catch amount has decreased. I do not think there will be any fishermen who will not accept this as a fact. This, I believe, is not only the result of climate change but also of our harmful activities.(FL14: Agavedzi)
A fishing group leader also commented, saying that:
I get less fish these days compared to the past. The number of fishermen and canoes has increased. The climate change incident has also caused some fish to migrate. Many fishermen are unaware of the potential for fish migration, despite the harmful activities of some, particularly those that use chemicals.(FL15: Adina)
In addition, while many problems limit respondents’ fishing activities, it appears that those with high premix fuel prices or shortages were the most concerned, with a considerable proportion (83% or 291) of responses coming from the Nyanyano community. When asked during the interview to identify the major challenges that limit their fishing activities, most of them indicated “high prices or shortages of premix fuel” as well as the activities of “saiko”. One fishing group leader expressed concern that:
The saiko activities are the main problem, as is the premix fuel price instability. We do not have any to buy. We buy car petrol [gasoline] instead.(FL1: Elmina)
Similarly, the leader of a fishing group stated that:
The saiko activities are disturbing and need to be stopped. We do not have access to premix fuel, and we purchase small amounts at higher prices. We now use the gasoline from the car at the station.(FL2: Cape Coast)
Likewise, a fishing group leader established that:
We have serious issues with saiko activities. Last week, they seized the nets of my friends on the sea. The unstable nature and increased prices of premix fuel are also problems.(FL3: Moree)
In addition, a fishing group leader revealed that:
Outboard motors and premix fuel are expensive, with new Yamaha or Suzuki motors costing between GHS 17,000 and 225,000. We mostly get it at cheaper prices from politicians during election years as a form of campaigning to win votes.(FL4: Biriwa)
Furthermore, a fishing group leader indicated that:
The price of premix fuel is high, which limits our activities. We now use normal gasoline, which is expensive, but we have no option. We do not make any profit, but since this is what we do for a living, we cannot stop.(FL5: Apam)
Moreover, a fishing group leader indicated that:
We do not get premix fuel these days, and we cannot go far on the sea to catch more fish. Stopping the saiko’s activities is also necessary, as they are disturbing.(FL6: Gomoa Fetteh)
Moreover, a fishing group leader shared regret that:
The activities of the saiko are a big problem. They possess powerful vessels that can travel great distances on the sea, but we still use canoes and do not have access to premix fuel to power them these days. Most fishermen now use normal gasoline, but it is expensive, and not all of us can afford it.(FL7: Nyanyano)
Another fishing group leader again reported that:
The fishing business faces greater financial challenges, including costly repairs and the purchase of premix fuel, which was initially affordable but is now unaffordable.(FL8: Bortianor)
A fishing group leader noted:
We have issues with the high cost of premix fuel and the lack of purchase options. The government should store fuel near the community and stop saiko activities.(FL9: James Town)
A fishing group leader also stated that:
The premix fuel is not coming these days, and this is our biggest challenge. The saiko is yet another challenge, but their activities have been reduced by the government. The price of outboard motors is too high.(FL10: Teshie)
A fishing group leader expressed:
The price of the premix is too high. We are unable to purchase any premix these days. Therefore, we rely on regular gasoline, which is also quite costly. The fishing net is also expensive. The saiko’s activities have significantly decreased, and people are no longer able to purchase their fish.(FL11: Azizanya)
On the same issue, the leader of a fishing group reported that:
The government should reduce the high price of premix fuel. It should be available as well, because sometimes it becomes difficult to find some to buy.(FL12: Dzita)
A fishing group leader lamented that:
The premix fuel price is a big concern for us. So, can there be a stable price for it? The price keeps increasing, which is not good for our work. Stopping the middlemen involved in the sale is crucial. The government should help us because, for some of us, fishing is our only means of survival.(FL13: Vodza)
A fishing group leader, sharing his concern, stated that:
We face numerous challenges, but the most significant is premix fuel, which is secretly sold to non-fishermen and later sold at higher prices to us.(FL14: Agavedzi)
A fishing group leader also made a comment that:
The main challenge is finance, as the business requires a strong capital base for equipment purchases, repairs, and fuel costs. The rising premix prices consume income, but with the right equipment, the business can become profitable.(FL15: Adina)
3.4. Livelihood Opportunities of Respondents
Figure 5a–j and Table 4 depict the respondents’ livelihood opportunities across the entire zone and the individual communities, respectively. According to Figure 5a, the majority (77% or 4040) of the respondents across the zone do not own the houses in which they live. Again, a greater proportion (84% or 4410) do not own the canoe or boat used for fishing (Figure 5b), and a large proportion (92% or 4840) indicate that their household’s income is insufficient to cover their living expenses (Figure 5c). In support of this, it appears that the majority (79% or 3813) of respondents supplement their household’s living expenses by borrowing money from fish sellers, followed by relatives (20% or 986), and the least (1% or 45) from friends (Figure 5d). A large number (87% or 4585) of respondents reported that it is difficult to obtain loans from banks (both public and private), while few (13% or 665) respondents stated the contrary (Figure 5e).
Furthermore, the majority (78% or 4082) of respondents acknowledged that climate variability has an impact on their health, compared to the few (22% or 1168) who opposed it (Figure 5f). According to Figure 5g, the majority (51% or 2089) of respondents across the zone had a fever, followed by headache (37% or 1497), and the fewest (2% or 77) had skin rashes or heat stress. A significant proportion (73% or 3841) of respondents across the zone do not fish all year (Figure 5h). When asked what they did when they were not fishing, it appears that a large proportion (70% or 2705) of respondents had no alternative livelihood opportunities because they only repair their fishing nets, followed by those who work in construction or masonry (13% or 489), and the fewest (1% or 45) as carpenters (Figure 5i). With no relevant alternative livelihood opportunities, most respondents (74% or 2861) did not react when asked whether the activities they engage in help enhance their livelihoods, with just a few (26% or 998) able to respond (Figure 5j).
The Table 4 responses show a greater level of variation. A significant number of respondents do not own houses in the study communities, with James Town having the highest (97% or 339) answer rate. Again, most of them do not own fishing canoes or boats, with Nyanyano having the largest (95% or 332) number. The respondents’ income-insufficient situations differ throughout the study communities. However, in the communities of Azizanya, Dzita, Vodza, and Agavedzi, all (100% or 350) respondents stated that their incomes are insufficient to cover their household’s living expenses. While a greater number of respondents in the study communities borrow from fish sellers to supplement their household budgets, the network is stronger in Azizanya, which had the highest (93% or 324) compared to the other communities. Furthermore, most respondents in the communities do not find it easy to obtain bank loans, with Nyanyano having the highest (99% or 346) response.
When asked to share their livelihood conditions during the interview, most of the fishing groups’ leaders mentioned varied issues, including “income insufficiency”, “financial support from fish sellers”, and “difficulties in securing bank loans”, among others. In sharing their worries on the issue, one fishing group leader reported as follows:
It is not easy. I borrow from a savings and loan [microfinance] company and not from the bigger banks. There is less pressure from them. I also borrow from my customers, those that I sell fish to. This helps me keep up with my household and business expenses.(FL1: Elmina)
Another leader of a fishing group stated that:
The fish business does not generate sufficient income. The fishing business relies heavily on trial and error. When we are in a serious financial situation, we cry for help from the fish sellers, not the banks. The banks should have been the best place, but it is not easy to get a loan. The bureaucracy is too much.(FL2: Cape Coast)
In addition, a fishing group leader reported that:
I do not deal with the banks. My wife and I have joined a susu [savings] group, and we contribute some amount every month. I borrow from there to support my activities and repay with a low interest rate, unlike the traditional bank. There is no penalty for late payment of the debt.(FL3: Moree)
A fishing group leader further stated that:
We can borrow from fish sellers but remember that they also face challenges as they do not get enough fish from us to sell. It is not easy to get money from the bank as a man. The banks primarily provide loans to women, and we, as men, borrow from them. I think the banks trust women more than men.(FL4: Biriwa)
A fishing group leader sharing his experience with bank loans indicated that:
Yes, you can get a loan from the banks, but the process is not that simple. I tried one, and I was able to secure it, but the interest I paid was too much, so I advised myself. I now borrow from the fish sellers with no interest rate.(FL5: Apam)
Furthermore, a fishing group leader expressed that:
The government does not support us, so we borrow from fish sellers and repay them with fish. Some people get loans from the bank, while others do not due to their inability to repay the loans in a timely manner.(FL6: Gomoa Fetteh)
Moreover, a fishing group leader expressed that:
The income used to be sufficient, but not at the present time. There are many banks that are willing to give loans, but their processes are so complex that most fishermen cannot afford them. Most of us prefer to borrow from fish sellers. Generally, women [fish sellers] do not struggle to get loans. I have some friends whose wives take the loan for them.(FL7: Nyanyano)
A fishing group leader also lamented that:
We have financial challenges. The banks can help, but it is not that simple. Most of my colleagues and I personally borrow from the fish sellers. They serve as the primary source of borrowing, even before one considers going to the bank.(FL8: Bortianor)
Similarly, a fishing group leader sharing difficulties in securing bank loans indicated that:
It is not easy to secure a loan from the bank. I will not lie to you. They demand that you present the details of your business. Most fishermen cannot afford the extensive detail work required. If you can go through it all, they will give you the loan.(FL9: James Town)
A fishing group leader noted:
The banks do not give loans to us; they would rather give money to our wives, and we borrow from them. I do not understand why, but that is what they do. The fish sellers are our only hope. They are the ones that give us money, but now the business is not good, so they also suffer.(FL10: Teshie)
A fishing group leader established that:
The fish business is seasonal, with fluctuations in profits, but generally, earnings are not enough to support household and fishing activities. Most of us here do not borrow from the bank because of the bureaucracy. We either borrow from the susu [savings] group or from the fish sellers.(FL11: Azizanya)
A fishing group leader shared his current livelihood conditions and the financial assistance he receives from fish sellers, indicating that:
There is a low catch. So, how is the income going to be sufficient? The premix fuel alone costs all the money, but I have family to care for. I rely on the fish sellers for help. I do not have any other preferred source of borrowing.(FL12: Dzita)
Equally, a fishing group leader expressed that:
These days, my income is insufficient, and I spend it on premix fuel. I always must speak with the fish sellers for additional money, and I always have debt in front of me.(FL13: Vodza)
Regarding the same issue, a fishing group leader reported that:
…It is not sufficient at all. No, I do not borrow from the bank. My son in Accra is a government employee [public sector worker], and it is easy for him to get a loan. So, I borrow from him to support my activities. I also borrow from the fish sellers for family upkeep.(FL14: Agavedzi)
A fishing group leader also commented, stating that:
The income I earn is insufficient due to high expenses and insufficient fish. Yes, the banks are there, but it is not that easy to get a loan. The process is tedious. The best thing is to have a good relationship with the fish sellers, and you can rely on them for support.(FL15: Adina)
Most of the respondents in the communities recognized the health impacts of climate variability, with Elmina having the highest proportion (98% or 342). Furthermore, while respondents acknowledged many sicknesses caused by climate variability, fever is prevalent, especially in Bortianor, which had the highest (84% or 271) responses. A considerable proportion (100% or 350) of respondents, particularly in Gomoa Fetteh, Nyanyano, Bortianor, Dzita, and Vodza, do not fish all year, while the remaining communities have few respondents who do (Table 4). Moreover, most respondents in the communities do not have alternative livelihood opportunities and only repair their nets when not fishing, particularly in Nyanyano, which had the greatest (95% or 334) number. However, a few of them engage in construction, carpentry, or as laborers, particularly in the communities of Elmina, Cape Coast, Moree, and Biriwa (Table 4). Most respondents, particularly those in Gomoa Fetteh, Vodza, and Adina, did not respond to whether the activities they engage in when not fishing help enhance their livelihoods. However, a high proportion of respondents in Elmina, Cape Coast, Moree, Biriwa, Apam, James Town, and Teshie were satisfied with their alternative livelihood activities other than fishing (Table 4).
3.4.1. Association between Independent Variables and the Livelihood Opportunities of Respondents
In the chi-square test of the association between the independent variables and the fishermen’s livelihood opportunities (see Supplementary Materials Table S1), there is a significant (p < 0.05) association between all the independent variables considered in this study and the livelihood opportunities of the fishermen in the zone (see Supplementary Materials Table S1). Nevertheless, the strength of the associations shown by the Cramer’s V statistic differed between variables. Except for age and house ownership, level of education and perceived health impact of climate variability, and household size and income sufficiency, which had a moderate strength of association (Cramer’s V = 0.2), the remaining variables had a weak strength of association (Cramer’s V = 0.0 or 0.1), despite being significant (see Supplementary Materials Table S1).
Most of the independent variables examined revealed significant relationships among the individual communities. Except for variables like level of education and perceived impact of climate variability on health in Elmina, marital status and income sufficiency in Bortianor, James Town, and Teshie, years of fishing and income sufficiency in James Town again, marital status and house ownership in Azizanya, Vodza, and Adina, and years of fishing and canoe ownership in Azizanya and house ownership in Vodza, the remaining independent variables were significantly associated (p < 0.05). The Cramer’s V statistics for the variables among the communities ranged from 0.1 (weak association) between the variables such as marital status and house ownership and income sufficiency and years of fishing and canoe ownership in Elmina, household size and income sufficiency and years of fishing and canoe ownership in James Town, marital status and house ownership in Teshie, and years of fishing and house ownership in Adina, to a high of 0.9 (strong association) between age and house ownership in Apam (see Supplementary Materials Table S1). It is important to note that certain statistical calculations were unable to be performed due to the presence of one or more cells with an expected count below 5, or due to the variable exhibiting constancy, particularly within the Dzita and Agavedzi communities (see Supplementary Materials Table S1).
3.4.2. Relationship between Independent Variables and the Livelihood Opportunities of Respondents
The binary logistic regression analysis shows the effect of the independent variables on fishermen’s livelihood opportunities across zones and in individual communities (see Supplementary Materials Table S2). The omnibus test of the model coefficient demonstrated a better fit across the zone (X2 = 991.787, df = 9, p < 0.05) than the null model. The independent variables in the model are significant predictors of the fishermen’s livelihood opportunities (see Supplementary Materials Table S2). The Nagelkerke R2 is 0.408, indicating that the model accounts for only 40.8% of the variations in the dependent variable (income sufficiency). It is worth emphasizing that, while the model is a significant predictor of the dependent variable, other significant predictors may exist.
Except for the married status and household sizes of 4 and >5, the Wald ratio and corresponding p-values of the independent variables differ significantly from those in the null model. Aside from the variables listed above, the remaining independent variables were significant predictors of the dependent variables across the zone (see Supplementary Materials Table S2). For instance, across the zone, the odds of the fishermen’s income being insufficient reduce by 0.372 (with a 95% confidence interval of 0.290 to 0.477) the more they fish all year, by 0.343 (0.265 to 0.445) the more they own their houses, by 0.090 (0.068 to 0.119) the more they own a canoe, and by 0.064 (0.008 to 0.498), 0.122 (0.016 to 0.955), and 0.031 (0.004 to 0.252) the more they are aged 30–40, 41–50, and >50, respectively (see Supplementary Materials Table S2). According to the classification table, the total accuracy rate for the test was 92.7%. The model had a high sensitivity of 98.1% but a low specificity of 29.0%. The sensitivity was higher since the model accurately predicted that 98.1% of fishermen would report income insufficiency over sufficiency (see Supplementary Materials Table S2). In this case, the model’s sensitivity reveals the fisherman whose income was insufficient as predicted by the model, while specificity indicates the opposite.
The analysis for each community differs considerably. In Elmina, Moree, Biriwa, Nyanyano, Bortianor, and Adina, no significant relationships were observed between the independent variables and the dependent variables, despite the model accounting for 92.6%, 84.4%, 82.6%, 75.8%, 79.5%, and 23.3% of the variations in the dependent variable, respectively. However, significant relationships were found in Cape Coast, Apam, Gomoa Fetteh, James Town, and Teshie. For example, the omnibus test of the model coefficient showed a better fit among the communities (X2 = 61.490, df = 8, p < 0.05) than the null model with a Nagelkerke R2 of 0.260 (26.0%) in Cape Coast; X2 = 351.838, df = 9, p < 0.05, and an R2 of 0.901 (90.1%) in Apam; X2 = 105.458, df = 8, p < 0.05, and an R2 of 0.756 (75.6%) in Gomoa Fetteh; X2 = 74.091, df = 9, p < 0.05, and an R2 of 0.389 (38.9%) in James Town; and X2 = 126.512, df = 9, p < 0.05, and R2 of 0.685 (68.5%) in Teshie.
Except for marital status and age, the independent variables in Cape Coast were significant predictors of the dependent variables. Notably, the odds of a fishermen’s income being insufficient reduce by 6.191 (with a 95% confidence interval of 2.304 to 16.630) if they fish all year, by 0.460 (0.217 to 0.997) if they own their houses, by 0.314 (0.151 to 0.652) if they own a canoe, and by 4.045 (1.210 to 13.518) if they have a household size of 4. When the fishermen in Apam fish all year, their odds of having insufficient income drop by 0.065 (0.013 to 0.331), or when they own a canoe, they reduce by 0.026 (0.004 to 0.147). Again, in Gomoa Fetteh, it reduces by 0.156 (0.031 to 0.758) when they own a canoe; in James Town, it reduces by 0.242 (0.051 to 1.145) when they fish all year, by 0.179 (0.034 to 0.935) when they own a house, or by 0.253 (0.105 to 0.606) when they own a canoe; and in Teshie, their income insufficiency reduces by 0.185 (0.048 to 0.708) when they own a house (see Supplementary Materials Table S2).
The test’s total accuracy rate was 84.0% in Cape Coast, 95.7% in Apam, 97.7% in Gomoa Fetteh, 92.6% in James Town, and 95.1% in Teshie. Cape Coast has better (97.5%) and poorer (25.8%) sensitivity and specificity, respectively. In James Town, the situation is similar, with 99.4% sensitivity and 35.1% specificity. Apam has a high sensitivity and specificity of 97.6% and 91.3%, respectively. Gomoa Fetteh had good sensitivity and specificity, with 98.8% and 78.9%, respectively, and Teshie had 98.1% and 63.35, in that order. Due to the constant nature of the dependent variables, no statistics were generated for the communities of Azizanya, Dzita, Vodza, and Agavedzi (see Supplementary Materials Table S2).
3.5. Influence of SST and SSS on Total Annual Fish Catch
The variations in SST, SSS, and total annual fish capture in the oceanic portion of the zone were examined, as shown in Figure 6a,b, in response to the respondents’ diverse viewpoints on oceanic parameters. Here, we computed the mean monthly and annual SST in °C and SSS in ‰ from the three coastal stations (i.e., Winneba, Tema, and Keta) as well as the total annual fish capture (in metric tons) from 2000 to 2020 for the Coastal Savannah zone.
Figure 6a shows the mean monthly SST, which reveals substantial variations. The maximum mean monthly SST of 28.1 °C occurred in May, and the lowest of 22.3 °C was observed in August (Figure 6a). The mean monthly SSS demonstrates minimal variation (Figure 6a). The highest salinity levels, measured at 35.3‰, occurred in August, while the lowest levels, recorded at 34.4‰, were observed in November (Figure 6a).
According to Figure 6b, the mean annual SST does not vary greatly. Nonetheless, the maximum (27.1 °C) SST recorded in the last two decades was in 2010, and the lowest (25.8 °C) in 2013. The SSS shows a similar pattern (Figure 6b). The highest salinity levels of 35.7‰ occurred in 2008, and the lowest levels of 31.8‰ were observed in 2000 (Figure 6b). Between 2000 and 2020, the mean annual SST and SSS increased by 0.5 °C and 3.5‰, respectively. There has been a higher annual variation in total fish catch over the last two decades in the zone. The highest total annual fish catch (230,127.8 metric tons) happened in 2000, while the lowest (84,266.0 metric tons) occurred in 2019. A clear decreasing trend is observed in the total annual fish catch over the last two decades in the zone, supporting respondents’ position on a substantial decrease in the total annual fish catch in the zone.
The multiple linear regression method was used to determine if changes in SST and SSS predicted the decreased total annual fish catch in the zone. Total annual fish catch = 1,248,666.687 − 7324.753 × (SST) − 26,241.781 × (SSS) was the fitted regression model. Overall, the regression analysis revealed a significant result (R2 = 0.390, F (2, 18) = 5.763, p = 0.012). The analysis revealed that changes in SST did not predict the zone’s decrease in total annual fish catch (β = −7324.753, p = 0.729). Changes in SSS, on the other hand, significantly predicted the decreased total annual fish catch (β = −26,241.781, p = 0.005).
4. Discussion
This study analyzed climate variability, coastal livelihoods, and the influence of ocean change on the total annual fish catch in Ghana’s Coastal Savannah zone. Considering the ongoing global warming and its adverse impacts on different sectors, including coastal zones, it is critical to consistently assess social perceptions towards this phenomenon and its impact on people’s livelihoods. This evaluation should encompass not only physical climate and oceanic variables but also the alignment or contrast of these factors with social perspectives.
It was established that a significant proportion of the fishermen in the zone are aware of the global climate variability crises and related impacts, with the mass media sector, particularly the broadcasting media (television and radio), playing a substantial role in that regard. This finding supports the broader consensus of the substantial contribution of the mass media space to the propagation of information regarding the global climate crises as well as the reduction in negative anthropogenic actions [80,81]. For instance, Sampei and Aoyagi-Usui [80] found a positive correlation between an increase in newspaper coverage of global warming and improved public concerns on the issue in Japan. Similarly, Junsheng et al. [81] found that mass media influences awareness, attitude, and knowledge of climate change among the people in the state of Selangor, Malaysia. While the newspaper is doing well in some regions, particularly Japan, its utilization is low, particularly by the fishermen in the Coastal Savannah zone of Ghana. They prefer television and the radio to the newspaper (see Figure 3b). The low utilization of the newspaper could be due to language constraints, as it is written in English. Most of the fishermen in the zone have either primary education or no formal education. Most broadcast media, on the other hand, communicate in the local dialect. Again, the fishermen across the zone are familiar with the causes of climate variability, with the majority attributing it to negative human actions, a response that conforms to the general scientific literature [82]. The fishermen mentioned deforestation as the major factor causing climate variability. This finding supports earlier research studies, including those in Ghana [83] and elsewhere [84]. The fishermen in the zone require more information on the contributions of urbanization and vehicular emissions, as they failed to recognize them as one of the factors responsible for climate variability impacts. Urbanization, for instance, is considered an important driver of climate variability [85].
It has been revealed again that increasing temperatures and sea level rise were the two most common impacts of climate variability across the zone and individual communities, with rising CO2 concentrations in the atmosphere being the most significant contributor. This finding agrees with Ankrah’s [23] earlier study, which showed rising temperatures as the most evident impact of climate change in coastal Winneba, Ghana. The impacts resulting from combined climate variability, evidenced through rising temperatures, sea level rise, and related extreme events, have been highlighted in the scientific literature. For example, Nicholls et al. [8] and Wong et al. [9] warned that the combined effects of warming temperatures and sea level rise could endanger both the biophysical and socioeconomic systems of coastal areas. Church et al. [10] and Nicholls et al. [11] went on to state that the mean sea level could rise by a meter or more by 2100 and between 0.38 and 0.77 for the same period [12], which would be disastrous for coastal zones and their surroundings. The occurrence might inflict significant damage to the world’s coastal regions, particularly those with minimal adaptation capacities in Ghana’s Coastal Savannah zone. Furthermore, the fishermen recognized and took clear positions on the impact of climate variability, as well as changes in SST, on fish and fish stocks. Their position on this is consistent with greater scientific understanding. Several research studies, including those by Ankrah [23], Belhabib et al. [24], Brander [25], Lam et al. [26], and Pankhurst and Munday [27], have found that climate variability has a negative influence on fish and fisheries. SST changes are considered to have significant effects on fish habitats [29].
While fishermen acknowledged the impacts of SST changes on fish and fish stocks, they did not recognize the impacts of SSS changes. However, increases in SSS had a bigger influence than changes in SST on the decreased total annual fish catch in the zone (see Section 3.5). SSS changes are a major oceanographic component for fish growth [86]. In most fish species, SSS changes determine egg fertilization, incubation, yolk sac resorption, early embryogenesis, and larval growth, according to Bœuf and Payan [86]. Nian et al. [87] found that increasing SSS and warming SST directly led to a decline in Atlantic cod abundance from 1919 to 2016. As a result, the fishermen in the zone demand greater information and explanation about SSS changes and their implications. Furthermore, the study’s findings revealed that the total annual fish catch has decreased substantially over the last two decades. The multiple regression model accounted for 39% of the variability in the zone’s decrease in total annual fish catch. However, the other factors causing low fish catch, as stated by respondents (see Figure 4h), also play a substantial role. The fishermen were therefore accurate in this case, as physical fish catch data corroborated their claims. The finding is consistent with previous research studies conducted in various places, including the tropical regions [32], the Gulf of Guinea in West Africa [33], and the Canary Current large marine ecosystem [34]. Aside from climate variability, the fishermen identified other negative factors responsible for the decreased fish catch in the zone, with the involvement of many people in fishing and light fishing scoring highest. This finding supports previous studies conducted elsewhere by Sumaila et al. [31] and in various parts of Ghana by Atta-Mills et al. [38] and Owusu and Adjei [55]. It was also shown that high premix fuel prices or shortages, as well as saiko activities, were the main obstacles that hindered the fishermen’s activities, which is comparable with previous research studies conducted by Alder and Sumaila [37], Atta-Mills et al. [38], and Owusu and Adjei [55]. For example, Alder and Sumaila [37] and Atta-Mills et al. [38] informed us about the increasing pressure on West African marine ecosystems from foreign vessels.
It was further shown that most of the fishermen in the zone do not have satisfactory livelihood opportunities. For instance, most of them do not own houses, and the same was true for canoes. Once again, their fishing income was insufficient to cover their household’s living needs. Previous research studies, such as those of Ankrah [23], Apine et al. [40], and Tikadar et al. [70], have reported on fishermen’s limited livelihood options. Even though Ghana has numerous financial institutions, it was discovered that loans for fishermen are difficult to obtain. They, on the other hand, choose to borrow from fish sellers or family. This could be due to high interest rates, increased bureaucracy, and the fear of missing payment deadlines, which could result in incarceration. According to Owusu and Adjei [55], in the Western region of Ghana, fishermen find it difficult to access loans; yet those who can obtain loans from banks face pressure to fulfil payment deadlines and interest rates, leading to illegal fishing. Furthermore, it emerged that most fishermen have no viable alternative sources of livelihood other than fishing. This could play a larger role in the fishermen’s income shortfall, especially since they do not fish all year. They would profit greatly by engaging in alternative sources of livelihood, particularly during the closed fishing season, when they are not permitted to fish. According to the findings, most of them simply repair their nets, with a few, particularly in metropolitan areas, participating in occupations such as construction, masonry, and carpentry. The development of improved alternative livelihood possibilities in coastal areas is said to have benefited fishermen’s and small-scale fisheries’ livelihoods. For example, Matera [88] reports on the Colombian islands of Providencia and Santa Catalina, and Katikiro reports on Tanzania as well [89]. It was additionally found that the socio-demographic factors, which were employed as independent variables in this study, had a strong relationship with the livelihood of fishermen. Regardless, the binary logistic regression test demonstrated that the income insufficiency status of fishermen across the zone could be substantially reduced when they have their own houses, canoes, fish all year, or as they age. As a result, government or relevant stakeholder support could be beneficial to the fishermen. At least the development of more improved livelihood activities in addition to fishing across the zone can help fishermen earn income to build their own houses or buy canoes to sustain their fishing activities.
In addition, most of the fishermen reported poor health effects owing to climate variability, with fever and headache being the two most common ailments. Most fishermen at their place of work (shore) repair their nets in the scorching sun as there are no proper shade structures where they can rest. This is congruent with the findings of Tikadar et al. [70], who found an incidence of illnesses among fishermen in Bangladesh’s northeastern floodplains. According to Cissé et al. [90], climate variability, as well as related extreme events, have increased illnesses, which have a negative impact on the well-being and health of people.
5. Conclusions
This study examined climate variability, coastal livelihoods, and the influence of ocean change on the total annual fish catch in Ghana’s Coastal Savannah zone. The main findings from this study are that over the years, climate variability awareness has increased substantially among fishermen across Ghana’s Coastal Savannah zone, with a significant contribution in this regard coming from the broadcast media. Their positions on the major cause of climate variability are in line with the general scientific consensus on a warming world highly attributed to negative anthropogenic activities [82].
Fishermen across the zone have a strong position on rising temperatures and sea level rise as the most prevalent impacts of climate variability over the past two decades. They have a greater understanding of the impact of climate variability, as well as changes in SST, on fish and fish stocks, which agrees with the existing scientific information. Additionally, the fishermen reported a significant decline in the zone’s annual total fish catch over the previous 20 years, which the physical fish catch data accurately supported and was consistent with the scientific literature (e.g., [32,33,34]). The involvement of many people and the use of light in fishing emerged as the other factors causing a decreasing fish catch in the zone. Moreover, high premix fuel prices or shortages and saiko activities were the main obstacles that hindered the fishermen’s activities.
In addition, fishermen across the zone do not have satisfactory livelihood opportunities; the majority do not own houses or canoes and have insufficient income to meet their families’ basic needs. Due to the difficulty and bureaucracy involved in obtaining loans from banks, fish sellers and relatives are the main means through which fishermen borrow money. Apart from fishing, they have no sustainable alternative sources of livelihood, which may explain their income insufficiency. Policymakers and other important stakeholders need to assist the fishermen in this regard. Banks need to lower interest rates and provide more flexible payment options to fishermen to boost their confidence in borrowing to support their activities. For them to be able to fish all year, government-subsidized premix fuel prices should be more stable and reliable.
Supplementary Materials
The following supporting information can be downloaded at: https://www.mdpi.com/article/10.3390/w16091201/s1, Table S1: Chi-square test of association between independent variables and livelihood opportunities of fishermen; Table S2: Binary logistic regression showing the relationship between independent variables and livelihood opportunities.
Author Contributions
Conceptualization, J.A.; methodology, J.A.; formal analysis, J.A.; investigation, J.A.; data curation, J.A.; writing—original draft preparation, J.A.; writing—review and editing, J.A., A.M. and H.M.; visualization, J.A., A.M. and H.M.; supervision, A.M. and H.M. All authors have read and agreed to the published version of the manuscript.
Funding
This research received no external funding.
Institutional Review Board Statement
The study was conducted in accordance with the Declaration of Helsinki, and approved by the Ethics Committee of FACULTY OF ARTS AND HUMANITIES, UNIVERSITY OF PORTO (resolution No. 31 /CEFLUP/. 8 January 2023).
Informed Consent Statement
The research ethics commission of the Faculty of Arts and Humanities at the University of Porto reviewed and provided approval for the data collection instruments used in the study. Prior to the start of the interview, the participant was provided with a consent form that outlined their rights as a participant, such as the voluntary nature of the interview and their prerogative to withdraw from the study or request the removal or deletion of their previously recorded responses. Informed consent was obtained from all subjects involved in the study.
Data Availability Statement
The data presented in this study are available on request from the corresponding author.
Acknowledgments
This study is part of the Ph.D. research project “Assessing climate change and climate variability impacts in the coastal savannah agroecological zone of Ghana” and Johnson Ankrah acknowledges the support of the Portuguese Foundation for Science and Technology (Fundação para a Ciência e Tecnologia)-FCT under the PhD research grant (https://doi.org/10.54499/2021.05220.BD). The authors thank the Ghana Fisheries Commission for the data on SST, SSS, and fish catch.
Conflicts of Interest
The authors declare no conflicts of interest.
References
- Spalding, M.D.; Ruffo, S.; Lacambra, C.; Meliane, I.; Hale, L.Z.; Shepard, C.C.; Beck, M.W. The role of ecosystems in coastal protection: Adapting to climate change and coastal hazards. Ocean Coast. Manag. 2014, 90, 50–57. [Google Scholar] [CrossRef]
- Barragán, J.M.; de Andrés, M. Analysis and trends of the world’s coastal cities and agglomerations. Ocean Coast. Manag. 2015, 114, 11–20. [Google Scholar] [CrossRef]
- Daigle, R.M.; Haider, W.; Fernández-Lozada, S.; Irwin, K.; Archambault, P.; Côté, I.M. From coast to coast: Public perception of ocean-derived benefits in Canada. Mar. Policy 2016, 74, 77–84. [Google Scholar] [CrossRef]
- Neumann, B.; Vafeidis, A.T.; Zimmermann, J.; Nicholls, R.J. Future coastal population growth and exposure to sea-level rise and coastal flooding—A global assessment. PLoS ONE 2015, 10, e0131375. [Google Scholar] [CrossRef] [PubMed]
- Small, C.; Nicholls, R.J. A Global analysis of human settlement in coastal zones. J. Coast. Res. 2003, 19, 584–599. [Google Scholar]
- Hoang, H.D.; Momtaz, S.; Schreider, M. Assessing the vulnerability of small-scale fishery communities in the estuarine areas of Central Vietnam in the context of increasing climate risks. Ocean Coast. Manag. 2020, 196, 105302. [Google Scholar] [CrossRef]
- Ahmed, N. Linking prawn and shrimp farming towards a green economy in Bangladesh: Confronting climate change. Ocean Coast. Manag. 2013, 75, 33–42. [Google Scholar] [CrossRef]
- Nicholls, R.J.; Wong, P.P.; Burkett, V.; Codignotto, J.; Hay, J.; McLean, R.; Ragoonaden, S.; Woodroffe, C.D.; Aboudha, P.A.O.; Arblaster, J.; et al. Coastal systems and low-lying areas. In Climate Change2007: Impacts, Adaptation and Vulnerability; Parry, M.L., Canziani, O.F., Palutikof, J.P., van der Linden, P.J., Hanson, C.E., Eds.; Contribution of Working Group II to the Fourth Assessment Report of the Intergovernmental Panel on Climate Change; Cambridge University Press: Cambridge, UK, 2007; pp. 315–356. [Google Scholar]
- Wong, P.P.; Losada, I.J.; Gattuso, J.-P.; Hinkel, J.; Khattabi, A.; McInnes, K.L.; Saito, Y.; Sallenger, A. Coastal systems and low-lying areas. In Climate Change 2014: Impacts, Adaptation, and Vulnerability. Part A: Global and Sectoral Aspects. Contribution of Working Group II to the Fifth Assessment Report of the Intergovernmental Panel on Climate Change; Field, C.B., Barros, V.R., Dokken, D.J., Mach, K.J., Mastrandrea, M.D., Bilir, T.E., Chatterjee, M., Ebi, K.L., Estrada, Y.O., Genova, R.C., et al., Eds.; Cambridge University Press: Cambridge, UK; New York, NY, USA, 2014; pp. 361–409. [Google Scholar]
- Church, J.A.; Clark, P.U.; Cazenave, A.; Gregory, J.M.; Jevrejeva, S.; Levermann, A.; Merrifield, M.A.; Milne, G.A.; Nerem, R.S.; Nunn, P.D.; et al. Sea Level Change. In Climate Change 2013: The Physical Science Basis. Contribution of Working Group I to the Fifth Assessment Report of the Intergovernmental Panel on Climate Change; Stocker, T.F., Qin, D., Plattner, G.-K., Tignor, M., Allen, S.K., Boschung, J., Nauels, A., Xia, Y., Bex, V., Midgley, P.M., Eds.; Cambridge University Press: Cambridge, UK; New York, NY, USA, 2013; p. 80. [Google Scholar]
- Nicholls, R.J.; Hanson, S.E.; Lowe, J.A.; Warrick, R.A.; Lu, X.; Long, A.J. Sea-level scenarios for evaluating coastal impacts. Wiley Interdiscip. Rev. Clim. Change 2014, 5, 129–150. [Google Scholar] [CrossRef]
- IPCC. Climate Change 2021: The Physical Science Basis; Masson-Delmotte, V.P., Zhai, A., Pirani, S.L., Connors, C., Péan, S., Berger, N., Caud, Y., Chen, L., Goldfarb, M.I., Gomis, M., et al., Eds.; Contribution of Working Group I to the Sixth Assessment Report of the Intergovernmental Panel on Climate Change; Cambridge University Press: Cambridge, UK; New York, NY, USA, 2021; p. 2391. [Google Scholar] [CrossRef]
- Hallegatte, S.; Green, C.; Nicholls, R.J.; Corfee-Morlot, J. Future flood losses in major coastal cities. Nat. Clim Change 2013, 3, 802–806. [Google Scholar] [CrossRef]
- Gutiérrez, N.L.; Hilborn, R.; Defeo, O. Leadership, social capital and incentives promote successful fisheries. Nature 2011, 470, 386–389. [Google Scholar] [CrossRef]
- Lauria, V.; Das, I.; Hazra, S.; Cazcarro, I.; Arto, I.; Kay, S.; Ofori-Danson, P.; Ahmed, M.; Hossain, M.A.R.; Barange, M.; et al. Importance of fisheries for food security across three climate change vulnerable deltas. Sci. Total Environ. 2018, 640–641, 1566–1577. [Google Scholar] [CrossRef] [PubMed]
- FAO. FAO Yearbook. Fishery and Aquaculture Statistics 2019; FAO: Rome, Italy, 2021; pp. 1–42. Available online: https://www.fao.org/fishery/static/Yearbook/YB2019_USBcard/navigation/index_intro_e.htm (accessed on 4 April 2023).
- Seidu, I.; Brobbey, L.K.; Danquah, E.; Oppong, S.K.; van Beuningen, D.; Seidu, M.; Dulvy, N.K. Fishing for survival: Importance of shark fisheries for the livelihoods of coastal communities in Western Ghana. Fish. Res. 2022, 246, 106157. [Google Scholar] [CrossRef]
- Stacey, N.; Gibson, E.; Loneragan, N.R.; Warren, C.; Wiryawan, B.; Adhuri, D.S.; Steenbergen, D.J.; Fitriana, R. Developing sustainable small-scale fisheries livelihoods in Indonesia: Trends, enabling and constraining factors, and future opportunities. Mar. Policy 2021, 132, 104654. [Google Scholar] [CrossRef]
- FAO. The State of World Fisheries and Aquaculture: Opportunities and Challenges; FAO: Rome, Italy, 2014; pp. 1–243. Available online: https://www.fao.org/responsible-fishing/resources/detail/en/c/1315967/ (accessed on 4 April 2023).
- Belhabib, D.; Sumaila, U.R.; Pauly, D. Feeding the poor: Contribution of West African fisheries to employment and food security. Ocean Coast. Manag. 2015, 111, 72–81. [Google Scholar] [CrossRef]
- Nunoo, F.K.E.; Asiedu, B.; Olauson, J.; Intsiful, G. Achieving sustainable fisheries management: A critical look at traditional fisheries management in the marine artisanal fisheries of Ghana, West Africa. J. Energy Nat. Resour. Manag. 2015, 2, 15–23. [Google Scholar] [CrossRef]
- Dovlo, E.; Amador, K.; Nkrumah, B. Report on the 2016 Ghana Marine Canoe Frame Survey. Ministry of Fisheries and Aquaculture Development, Fisheries Scientific Survey Division, Information Report No 36. 2016. Available online: https://www.crc.uri.edu/download/Final-2016-Canoe-Frame-Survey-Report.pdf (accessed on 4 April 2023).
- Ankrah, J. Climate change impacts and coastal livelihoods; an analysis of fishers of coastal Winneba, Ghana. Ocean Coast. Manag. 2018, 161, 141–146. [Google Scholar] [CrossRef]
- Belhabib, D.; Lam, V.W.Y.; Cheung, W.W.L. Overview of West African fisheries under climate change: Impacts, vulnerabilities and adaptive responses of the artisanal and industrial sectors. Mar. Policy 2016, 71, 15–28. [Google Scholar] [CrossRef]
- Brander, K. Impacts of climate change on fisheries. J. Mar. Syst. 2010, 9, 389–402. [Google Scholar] [CrossRef]
- Lam, V.W.Y.; Cheung, W.W.L.; Sumaila, U.R. Marine capture fisheries in the Arctic: Winners or losers under climate change and ocean acidification? Fish Fish. 2016, 17, 335–357. [Google Scholar] [CrossRef]
- Pankhurst, N.W.; Munday, P.L. Effects of climate change on fish reproduction and early life history stages. Mar. Freshw. Res. 2011, 62, 1015–1026. [Google Scholar] [CrossRef]
- Doney, S.C.; Ruckelshaus, M.; Emmett Duffy, J.; Barry, J.P.; Chan, F.; English, C.A.; Galindo, H.M.; Grebmeier, J.M.; Hollowed, A.B.; Knowlton, N.; et al. Climate change impacts on marine ecosystems. Annu. Rev. Mar. Sci. 2012, 4, 11–37. [Google Scholar] [CrossRef] [PubMed]
- Tseng, C.-T.; Sun, C.I.; Belkin, I.M.; Yeh, S.Z.; Kuo, C.L.; Liu, D.C. Sea surface temperature fronts affect distribution of Pacific saury (Cololabis saira) in the Northwestern Pacific Ocean. Deep-Sea Res. Part II Top. Stud. Oceanogr. 2014, 107, 15–21. [Google Scholar] [CrossRef]
- Belkin, I.M. Rapid warming of large marine ecosystems. Prog. Oceanogr. 2009, 81, 207–213. [Google Scholar] [CrossRef]
- Sumaila, U.; Cheung, W.; Lam, V.; Pauly, D.; Herrick, S. Climate change impacts on the biophysics and economics of world fisheries. Nat. Clim Change 2011, 1, 449–456. [Google Scholar] [CrossRef]
- Cheung, W.W.L.; Jones, M.C.; Reygondeau, G.; Stock, C.A.; Lam, V.W.Y.; Frölicher, T.L. Structural uncertainty in projecting global fisheries catches under climate change. Ecol. Model. 2016, 325, 57–66. [Google Scholar] [CrossRef]
- Lam, V.W.Y.; Cheung, W.W.L.; Swartz, W.; Sumaila, U.R. Climate change impacts on fisheries in West Africa: Implications for economic, food and nutritional security. Afr. J. Mar. Sci. 2012, 34, 103–117. [Google Scholar] [CrossRef]
- Barange, M.; Merino, G.; Blanchard, J.L.; Scholtens, J.; Harle, J.; Allison, E.H.; Allen, J.I.; Holt, J.; Jennings, S. Impacts of climate change on marine ecosystem production in societies dependent on fisheries. Nat. Clim. Change 2014, 4, 211–216. [Google Scholar] [CrossRef]
- Seto, K.L.; Miller, N.A.; Kroodsma, D.; Hanich, Q.; Miyahara, M.; Saito, R.; Boerder, K.; Tsuda, M.; Oozeki, Y.; Urrutia, S.Q. Fishing through the cracks: The unregulated nature of global squid fisheries. Sci. Adv. 2023, 9, eadd8125. [Google Scholar] [CrossRef] [PubMed]
- Seto, K.; Miller, N.; Young, M.; Hanich, Q. Toward transparent governance of transboundary fisheries: The case of Pacific tuna transshipment. Mar. Policy 2022, 136, 104200. [Google Scholar] [CrossRef]
- Alder, J.; Sumaila, U.R. Western Africa: A fish basket of Europe past and present. J. Environ. Dev. 2004, 13, 156–178. [Google Scholar] [CrossRef]
- Atta-Mills, J.; Alder, J.; Sumaila, U.R. The decline of a regional fishing nation: The case of Ghana and West Africa. Nat. Resour. Forum 2004, 28, 13–21. [Google Scholar] [CrossRef]
- Andrews, E.J.; Wolfe, S.; Nayak, P.K.; Armitage, D. Coastal fishers livelihood behaviors and their psychosocial explanations: Implications for fisheries governance in a changing world. Front. Mar. Sci. 2021, 8, 634484. [Google Scholar] [CrossRef]
- Apine, E.; Turner, L.M.; Rodwell, L.D.; Bhatta, R. The application of the sustainable livelihood approach to small scale-fisheries: The case of mud crab Scylla serrata in South west India. Ocean Coast. Manag. 2019, 170, 17–28. [Google Scholar] [CrossRef]
- Avila-Forcada, S.; Martinez-Cruz, A.L.; Rodriguez-Ramirez, R.; Sanjurjo-Rivera, E. Transitioning to alternative livelihoods: The case of PACE-Vaquita. Ocean Coast. Manag. 2020, 183, 104984. [Google Scholar] [CrossRef]
- de la Puente, S.; de la Lama, R.L.; Llerena-Cayo, C.; Martínez, B.R.; Rey-Cama, G.; Christensen, V.; Rivera-Ch, M.; Valdés-Velasquez, A. Adoption of sustainable low-impact fishing practices is not enough to secure sustainable livelihoods and social wellbeing in small-scale fishing communities. Mar. Policy 2022, 146, 105321. [Google Scholar] [CrossRef]
- Finkbeiner, E.M. The role of diversification in dynamic small-scale fisheries: Lessons from Baja California Sur, Mexico. Glob. Environ. Change 2015, 32, 139–152. [Google Scholar] [CrossRef]
- March, A.; Failler, P. Small-scale fisheries development in Africa: Lessons learned and best practices for enhancing food security and livelihoods. Mar. Policy 2020, 136, 104925. [Google Scholar] [CrossRef]
- Martins, I.M.; Gasalla, M.A. Perceptions of climate and ocean change impacting the resources and livelihood of small-scale fishers in the South Brazil Bight. Clim. Change 2018, 147, 441–456. [Google Scholar] [CrossRef]
- Nyiawung, R.A.; Ayilu, R.K.; Suh, N.N.; Ngwang, N.N.; Varnie, F.; Loring, P.A. COVID-19 and small-scale fisheries in Africa: Impacts on livelihoods and the fish value chain in Cameroon and Liberia. Mar. Policy 2022, 141, 105104. [Google Scholar] [CrossRef]
- Warren, C.; Steenbergen, D.J. Fisheries decline, local livelihoods and conflicted governance: An Indonesian case. Ocean Coast. Manag. 2021, 202, 105498. [Google Scholar] [CrossRef]
- Wu, H.; Li, Q.; Wang, C.; Wu, Q.; Peng, C.; Jefferson, T.A.; Long, Z.; Luo, F.; Xu, Y.; Huang, S.-I. Bycatch mitigation requires livelihood solutions, not just fishing bans: A case study of the trammel-net fishery in the northern Beibu Gulf, China. Mar. Policy 2022, 139, 105018. [Google Scholar] [CrossRef]
- Adjei, M.; Overå, R. Opposing discourses on the offshore coexistence of the petroleum industry and small-scale fisheries in Ghana. Extr. Ind. Soc. 2019, 6, 190–197. [Google Scholar] [CrossRef]
- Koomson, D.; Davies-Vollum, K.S.; Raha, D. Characterising the vulnerability of fishing households to climate and environmental change: Insights from Ghana. Mar. Policy 2020, 120, 104142. [Google Scholar] [CrossRef]
- Ayilu, R.K.; Fabinyi, M.; Barclay, K.; Bawa, M.A. Blue economy: Industrialisation and coastal fishing livelihoods in Ghana. Rev. Fish Biol. Fish. 2023, 33, 801–818. [Google Scholar] [CrossRef]
- Okyere, I.; Chuku, E.O.; Dzantor, S.A.; Ahenkorah, V.; Adade, R. Capacity deficit and marginalisation of artisanal fishers hamper effective fisheries governance in Ghana: Insights and propositions for promoting sustainable small-scale fisheries. Mar. Policy 2023, 153, 105640. [Google Scholar] [CrossRef]
- Freduah, G.; Fidelman, P.; Smith, T.F. The impacts of environmental and socio-economic stressors on small scale fisheries and livelihoods of fishers in Ghana. Appl. Geogr. 2017, 89, 1–11. [Google Scholar] [CrossRef]
- Amadu, I.; Armah, F.A.; Aheto, D.W. Assessing livelihood resilience of artisanal fisherfolk to the decline in small-scale fisheries in Ghana. Sustainability 2021, 13, 10404. [Google Scholar] [CrossRef]
- Owusu, V.; Adjei, M. Politics, power and unequal access to fisheries subsidies among small-scale coastal fisherfolk in Ghana. Ocean Coast. Manag. 2021, 214, 105920. [Google Scholar] [CrossRef]
- Freduah, G.; Fidelman, P.; Smith, T.F. Adaptive capacity of small-scale coastal fishers to climate and non-climate stressors in the Western region of Ghana. Geogr. J. 2019, 185, 96–110. [Google Scholar] [CrossRef]
- Ankrah, J.; Monteiro, A.; Madureira, H. Spatiotemporal characteristics of meteorological drought and wetness events across the coastal Savannah agroecological zone of Ghana. Water 2023, 15, 211. [Google Scholar] [CrossRef]
- Bessah, E.; Amponsah, W.; Ansah, S.O.; Afrifa, A.; Yahaya, B.; Wemegah, C.S.; Tanu, M.; Amekudzi, L.K.; Agyare, W.A. Climatic zoning of Ghana using selected meteorological variables for the period 1976–2018. Meteorol. Appl. 2022, 29, e2049. [Google Scholar] [CrossRef]
- Baidu, M.; Amekudzi, L.K.; Aryee, J.N.A.; Annor, T. Assessment of long-term spatio-temporal rainfall variability over Ghana using wavelet analysis. Climate 2017, 5, 30. [Google Scholar] [CrossRef]
- Crowe, S.; Cresswell, K.; Robertson, A.; Huby, G.; Avery, A.; Sheikh, A. The case study approach. BMC Med. Res. Methodol. 2011, 11, 100. [Google Scholar] [CrossRef]
- Yin, R.K. Case Study Research: Design and Methods, 5th ed.; Sage Publications, Inc.: Thousand Oaks, CA, USA, 2014; p. 282. [Google Scholar]
- Creswell, J.W. Research Design: Qualitative, Quantitative and Mixed Methods Approaches, 4th ed.; Sage Publications Ltd.: Thousand Oaks, CA, USA, 2014; p. 273. [Google Scholar]
- IPCC. Summary for policymakers. In Climate Change 2014: Impacts, Adaptation, and Vulnerability. Part A: Global and Sectoral Aspects; Field, C.B., Barros, V.R., Dokken, D.J., Mach, K.J., Mastrandrea, M.D., Bilir, T.E., Chatterjee, M., Ebi, K.L., Estrada, Y.O., Genova, R.C., et al., Eds.; Contribution of Working Group II to the Fifth Assessment Report of the Intergovernmental Panel on Climate Change; Cambridge University Press: Cambridge, UK; New York, NY, USA, 2014; pp. 1–32. [Google Scholar]
- Chambers, R.; Conway, G. Sustainable Rural Livelihoods: Practical Concepts for 21st Century; Discussion Papers, 296; Institute of Development Studies: Brighton, UK, 1992. [Google Scholar]
- Yamane, T. Statistics: An Introductory Analysis, 2nd ed.; Harper and Row: New York, NY, USA, 1967; p. 919. [Google Scholar]
- Desrita; Rambey, R.; Aritonang, B.D.; Leidonald, R.; Harahap, Z.A. Factors affecting revenue of fisherman in Asamjawa Raya Village, South Labuhanbatu Regency, North Sumatra. IOP Conf. Ser. Earth Environ. Sci. 2021, 912, 012040. [Google Scholar] [CrossRef]
- Kapembwa, S.; Gardiner, A.; Pétursson, J.G. Small-scale fishing: Income, vulnerability and livelihood strategies at Lake Itezhi-Tezhi, Zambia. Dev. S. Afr. 2021, 38, 331–352. [Google Scholar] [CrossRef]
- Mudzakir, A.K.; Boesono, H.; Harahap, H.Y. Analysis of factors affecting artisanal fishers income in Tegal city. Mar. Fish. J. Teknol. Manaj. Perikan. Laut 2023, 14, 39–51. [Google Scholar] [CrossRef]
- Teh, L.C.L.; Ota, Y.; Cisneros-Montemayor, A.M.; Harrington, L.; Swartz, W. Are fishers poor? Getting to the muddy bottom of marine fisheries income statistics. Fish Fish. 2020, 21, 471–482. [Google Scholar] [CrossRef]
- Tikadar, K.K.; Islam, M.J.; Saha, S.M.; Alam, M.M.; Barman, S.K.; Rahman, M.A. Livelihood status of small-scale fishermen and determinants of their income: Insights from north-eastern floodplains of Bangladesh. Geogr. Sustain. 2022, 3, 204–213. [Google Scholar] [CrossRef]
- Purcell, S.W.; Lalavanua, W.; Cullis, B.R.; Cocks, N. Small-scale fishing income and fuel consumption: Fiji’s artisanal sea cucumber fishery. ICES J. Mar. Sci. 2018, 75, 1758–1767. [Google Scholar] [CrossRef]
- Macusi, E.D.; Liguez, C.G.O.; Macusi, E.S.; Liguez, A.K.O.; Digal, L.N. Factors that influence small-scale Fishers’ readiness to exit a declining fishery in Davao Gulf, Philippines. Ocean Coast. Manag. 2022, 230, 106378. [Google Scholar] [CrossRef]
- Malakar, K.; Mishra, T.; Patwardhan, A. Perceptions of multi-stresses impacting livelihoods of marine fishermen. Mar. Policy 2018, 97, 18–26. [Google Scholar] [CrossRef]
- Muallil, R.N.; Geronimo, R.C.; Cleland, D.; Cabral, R.B.; Doctor, M.V.; Cruz-Trinidad, A.; Aliño, P.M. Willingness to exit the artisanal fishery as a response to scenarios of declining catch or increasing monetary incentives. Fish. Res. 2011, 111, 74–81. [Google Scholar] [CrossRef]
- Holmes, A.G.D. Researcher positionality--A consideration of its influence and place in qualitative research—A new researcher guide. Shanlax Int. J. Educ. 2020, 8, 1–10. [Google Scholar] [CrossRef]
- Nagar, R.; Geiger, S. Reflexivity, positionality and identity in feminist fieldwork revisited. In Politics and Practice in Economic Geography; Tickell, A., Sheppard, E., Peck, J., Barnes, T., Eds.; Sage: London, UK, 2007; pp. 267–278. [Google Scholar]
- Arku, G.; Luginaah, I.; Mkandawire, P. “You either pay more advance rent or you move out”: Landlords/ladies’ and tenants’ dilemmas in the low-income housing market in Accra, Ghana. Urban Stud. 2012, 49, 3177–3193. [Google Scholar] [CrossRef]
- Strauss, A.; Corbin, J. Basics of Qualitative Research: Grounded Theory Procedures and Techniques; Sage: Newbury Park, CA, USA, 1990. [Google Scholar]
- Krefting, L. Rigor in qualitative research: The assessment of trustworthiness. Am. J. Occup. Ther. 1991, 45, 214–222. [Google Scholar] [CrossRef]
- Sampei, Y.; Aoyagi-Usui, M. Mass-media coverage, its influence on public awareness of climate-change issues, and implications for Japan’s national campaign to reduce greenhouse gas emissions. Glob. Environ. Change 2009, 19, 203–212. [Google Scholar] [CrossRef]
- Junsheng, H.; Akhtar, R.; Masud, M.M.; Rana, M.S.; Banna, H. The role of mass media in communicating climate science: An empirical evidence. J. Clean. Prod. 2019, 238, 117934. [Google Scholar] [CrossRef]
- IPCC. Climate Change 2014: Synthesis Report; Core Writing Team, Pachauri, R.K., Meyer, L.A., Eds.; Contribution of Working Groups I, II and III to the Fifth Assessment Report of the Intergovernmental Panel on Climate Change; IPCC: Geneva, Switzerland, 2014; p. 151. [Google Scholar]
- Codjoe, S.N.A.; Owusu, G.; Burkett, V. Perception, experience, and indigenous knowledge of climate change and variability: The case of Accra, a sub-Saharan African city. Reg. Environ. Change 2014, 14, 369–383. [Google Scholar] [CrossRef]
- Gatti, L.V.; Basso, L.S.; Miller, J.B.; Gloor, M.; Gatti Domingues, L.; Cassol, H.L.G.; Tejada, G.; Aragão, L.E.O.C.; Nobre, C.; Peters, W.; et al. Amazonia as a carbon source linked to deforestation and climate change. Nature 2021, 595, 388–393. [Google Scholar] [CrossRef]
- Xu, D.; Gao, J.; Lin, W.; Zhou, W. Differences in the ecological impact of climate change and urbanization. Urban Clim. 2021, 38, 100891. [Google Scholar] [CrossRef]
- Bœuf, G.; Payan, P. How should salinity influence fish growth? Comp. Biochem. Physiol. Part C Toxicol. Pharmacol. 2001, 130, 411–423. [Google Scholar] [CrossRef] [PubMed]
- Nian, R.; Yuan, Q.; He, H.; Geng, X.; Su, C.-W.; He, B.; Lendasse, A. The identification and prediction in abundance variation of Atlantic cod via long short-term memory with periodicity, time–frequency co-movement, and lead-lag effect across sea surface temperature, sea surface salinity, catches, and prey biomass from 1919 to 2016. Front. Mar. Sci. 2021, 8, 665716. [Google Scholar] [CrossRef]
- Matera, J. Livelihood diversification and institutional (dis-)trust: Artisanal fishing communities under resource management programs in Providencia and Santa Catalina, Colombia. Mar. Policy 2016, 67, 22–29. [Google Scholar] [CrossRef]
- Katikiro, R.E. Improving alternative livelihood interventions in marine protected areas: A case study in Tanzania. Mar. Policy 2016, 70, 22–29. [Google Scholar] [CrossRef]
- Cissé, G.; McLeman, R.; Adams, H.; Aldunce, P.; Bowen, K.; Campbell-Lendrum, D.; Clayton, S.; Ebi, K.L.; Hess, J.; Huang, C.; et al. Health, wellbeing, and the changing structure of communities. In Climate Change 2022: Impacts, Adaptation and Vulnerability; Pörtner, H.-O., Roberts, D.C., Tignor, M., Poloczanska, E.S., Mintenbeck, K., Alegría, A., Craig, M., Langsdorf, S., Löschke, S., Möller, V., et al., Eds.; Contribution of Working Group II to the Sixth Assessment Report of the Intergovernmental Panel on Climate Change; Cambridge University Press: Cambridge, UK; New York, NY, USA, 2022; pp. 1041–1170. [Google Scholar] [CrossRef]
Figure 1.
Map showing the study communities in the Central, Greater Accra, and Volta regions of Ghana. Note: the statistics relating to landing beaches, fishing communities, and the number of fishermen were sourced from Dovlo et al. [22].
Figure 1.
Map showing the study communities in the Central, Greater Accra, and Volta regions of Ghana. Note: the statistics relating to landing beaches, fishing communities, and the number of fishermen were sourced from Dovlo et al. [22].

Figure 2.
Socio-demographic characteristics of respondents across the zone: (a) age, (b) marital status, (c) level of education, (d) household size, (e) length of stay in community, and (f) years of fishing.
Figure 2.
Socio-demographic characteristics of respondents across the zone: (a) age, (b) marital status, (c) level of education, (d) household size, (e) length of stay in community, and (f) years of fishing.

Figure 3.
Respondents’ perceived knowledge about climate variability: (a) awareness about climate change; (b) sources of climate change information; (c) causes of climate change; (d) factors contributing to climate change across the zone; and (e) sources of climate change information; (f) causes of climate change; and (g) factors contributing to climate change among the study communities.


Figure 4.
Respondents’ perceived climate-related impacts across the zone: (a) most common impact of climate change over the last two decades; (b) factors contributing to the most common impact; (c) impact of climate change on fish population; (d) impact of SST on fish and fish stocks; (e) SSS on fish and fish stocks; (f) total number of fish caught over the last two decades; (g) climate change as the only cause of decreased fish catch; (h) other factors causing low fish catch; and (i) major problems that limit fishing activities.


Figure 5.
Livelihood opportunities of respondents: (a) house ownership; (b) canoe or boat ownership; (c) income sufficiency to cater for a household’s living expenses; (d) where to find income to supplement a household’s living expenses; (e) ease of securing loans from banks for fishing activities; (f) impact of climate change on health; (g) sickness resulting from climate change; (h) all-year fishing; (i) activities engaged in when not fishing; and (j) activities engaged in help improve livelihoods across the zone.


Figure 6.
Variations in mean monthly (a) and annual (b) SST, SSS, and total annual fish catch from 2000 to 2020.
Figure 6.
Variations in mean monthly (a) and annual (b) SST, SSS, and total annual fish catch from 2000 to 2020.


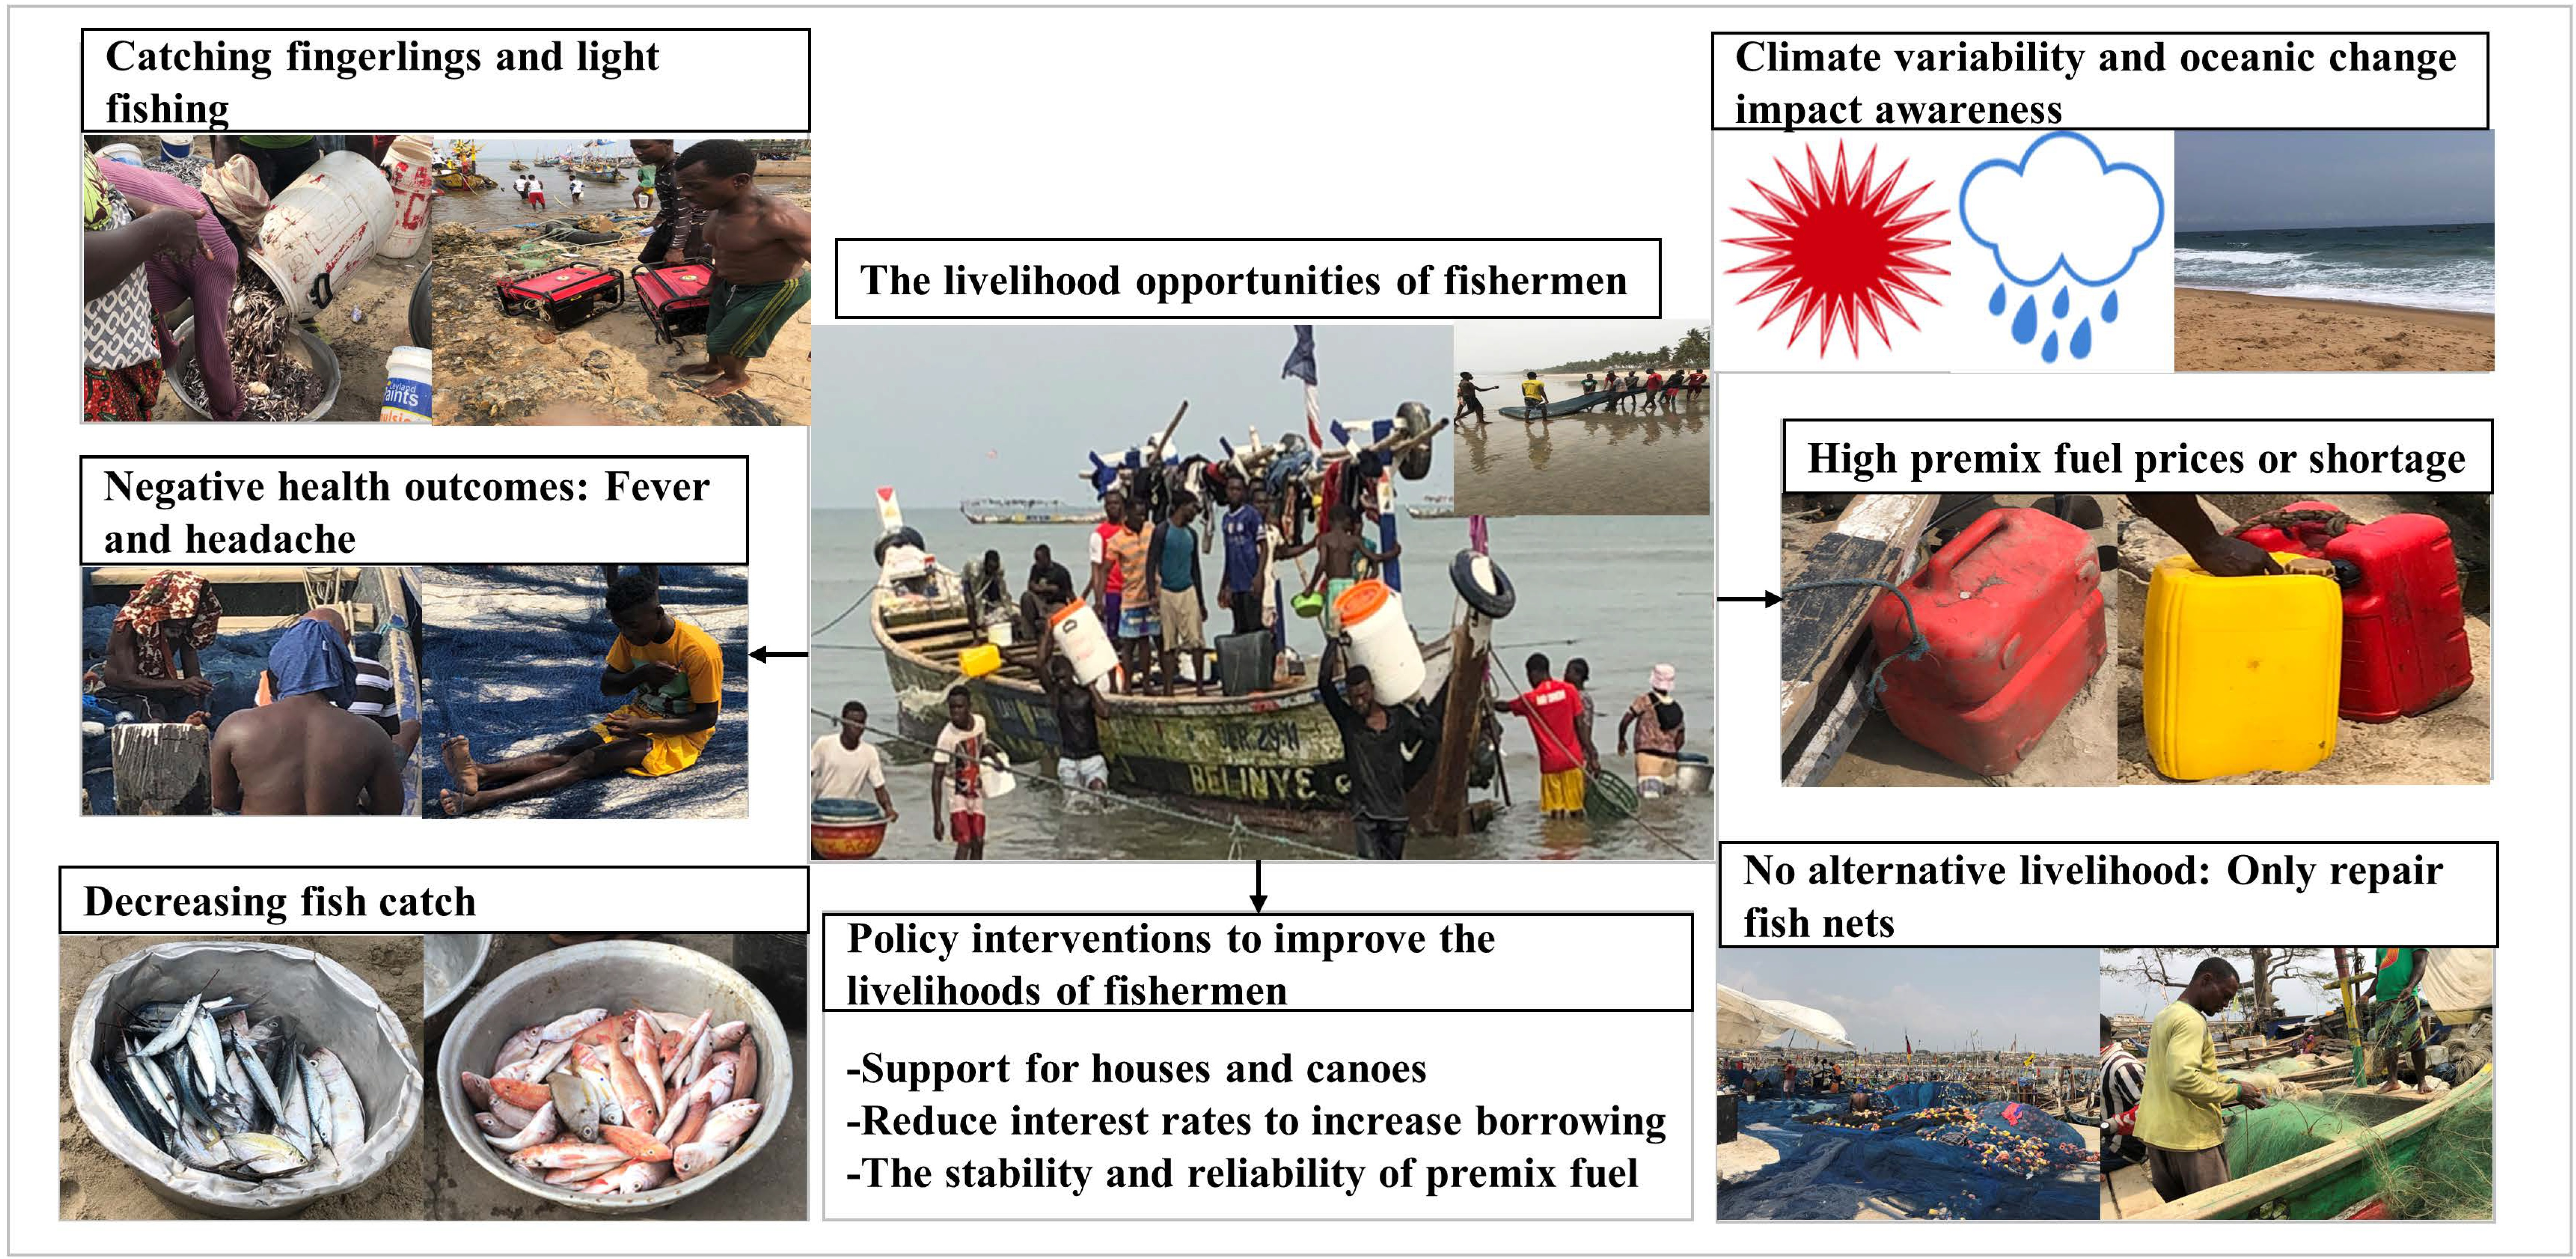
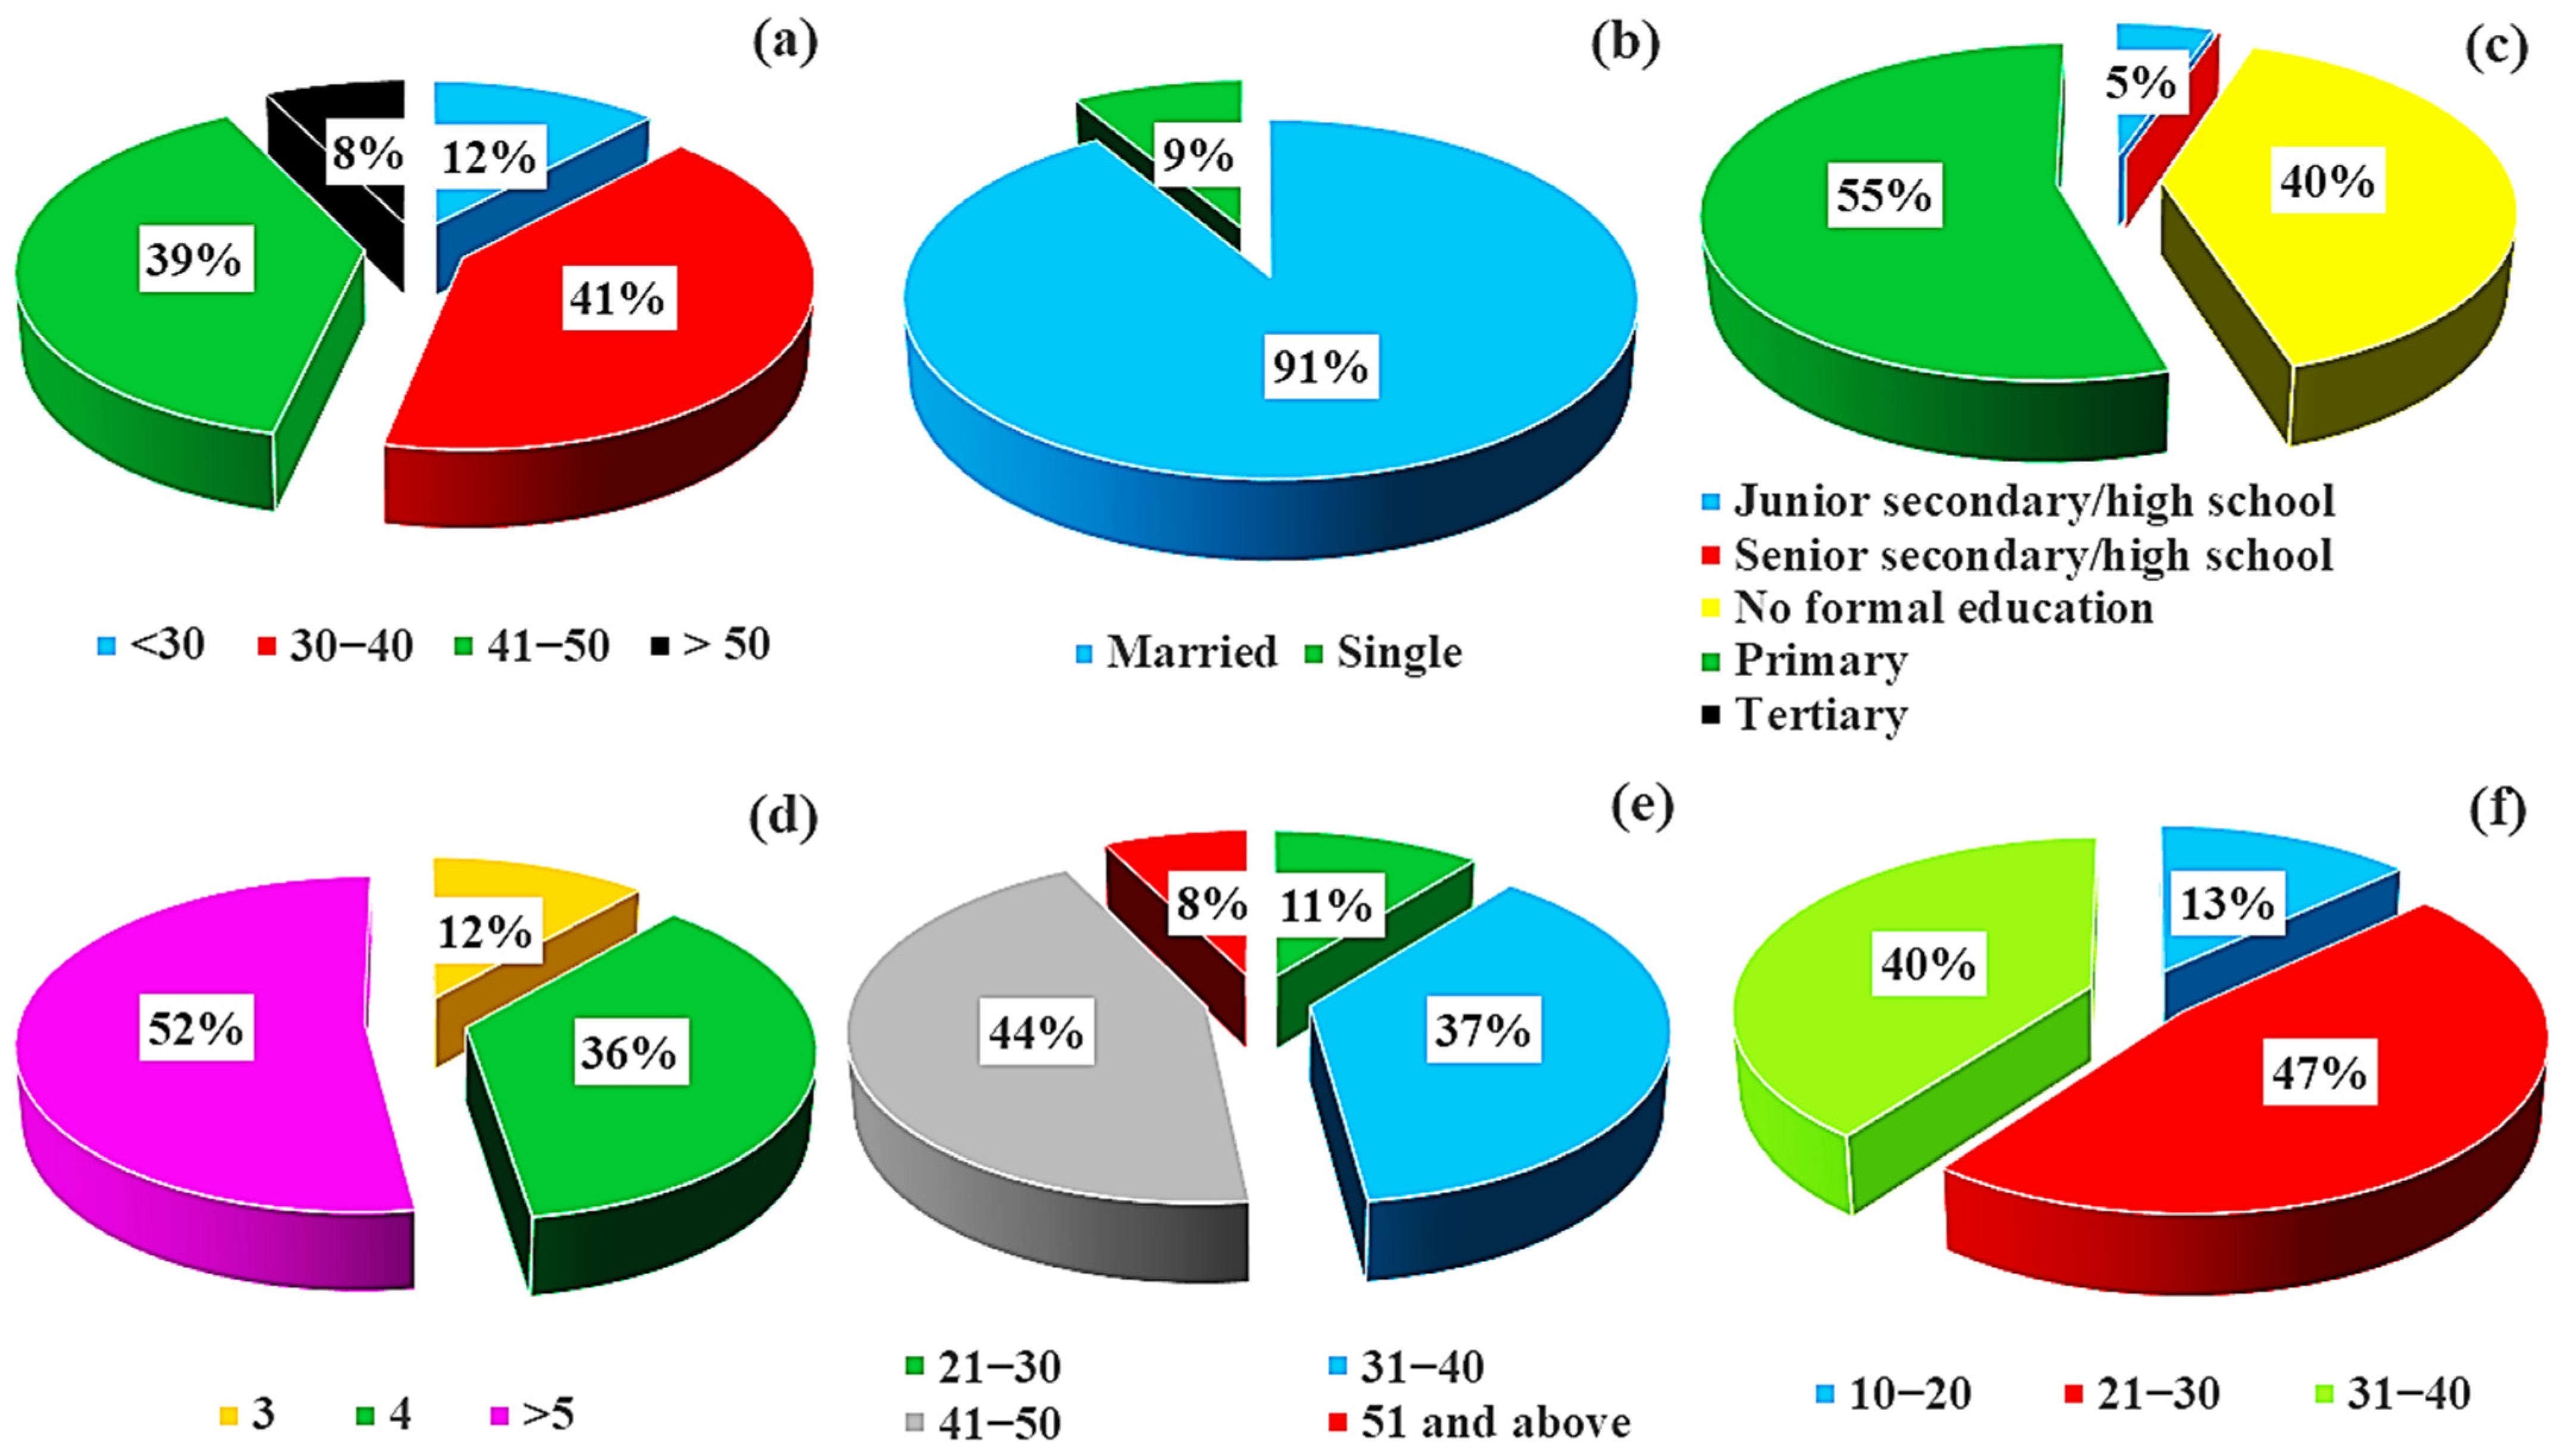
Table 1.
Characteristics of the selected fishing communities used in the study. Source: Dovlo et al. [22].
Table 1.
Characteristics of the selected fishing communities used in the study. Source: Dovlo et al. [22].
| S/N | Community | MMDAs | Region | Number of Fishermen | Landing Beach(es) |
|---|---|---|---|---|---|
| 1 | Elmina | Komenda-Edina-Eguafo-Abrem District | Central | 1512 | Elimina Main |
| 2 | Cape Coast | Cape Coast Metropolitan Assembly | Central | 556 | Abrofo Mpoano and Duakor |
| 3 | Moree | Abura-Asebu-Kwamankese District | Central | 997 | Etuei |
| 4 | Biriwa | Mfantsiman Municipal Assembly | Central | 836 | Abaka Ekyir |
| 5 | Apam | Gomoa West District | Central | 741 | Apam Main |
| 6 | Gomoa Fetteh | Gomoa West District | Central | 643 | Mbanyin and Mbaa Mpoano |
| 7 | Nyanyano | Gomoa East District | Central | 1920 | Nyanyano |
| 8 | Bortianor | Ga South Municipal Assembly | G/Accra | 1240 | Bortianor |
| 9 | James Town | Ashidu Keteke Sub-Metropolitan Area | G/Accra | 1515 | Ga Mashie |
| 10 | Teshie | Ledzokuku-Krowor Municipal Assembly | G/Accra | 1044 | Sangonaa |
| 11 | Azizanya | Ada East District | G/Accra | 800 | Mataheko |
| 12 | Dzita | Keta Municipal Assembly | Volta | 756 | Agledome |
| 13 | Vodza | Keta Municipal Assembly | Volta | 800 | Vodza |
| 14 | Agavedzi | Ketu South Municipal Assembly | Volta | 744 | Agavedzi |
| 15 | Adina | Ketu South Municipal Assembly | Volta | 1493 | Adina |
Table 2.
Respondents’ socio-demographic characteristics for the individual communities.
| Variables | Elmina | Cape Coast | Moree | Biriwa | Apam | Gomoa Fetteh | Nyanyano | Bortianor | James Town | Teshie | Azizanya | Dzita | Vodza | Agavedzi | Adina |
|---|---|---|---|---|---|---|---|---|---|---|---|---|---|---|---|
| Age | |||||||||||||||
| <30 | 61 | 8 | 26 | 34 | 80 | 45 | 50 | 38 | 88 | 36 | 12 | 14 | 61 | 24 | 60 |
| 30–40 | 122 | 163 | 148 | 172 | 124 | 199 | 172 | 142 | 129 | 104 | 204 | 104 | 110 | 146 | 131 |
| 41–50 | 136 | 159 | 146 | 124 | 109 | 80 | 106 | 151 | 109 | 163 | 118 | 208 | 131 | 169 | 141 |
| >50 | 31 | 20 | 30 | 20 | 37 | 26 | 22 | 19 | 24 | 47 | 16 | 24 | 48 | 11 | 18 |
| Marital Status | |||||||||||||||
| Married | 322 | 344 | 334 | 332 | 292 | 324 | 318 | 328 | 276 | 324 | 346 | 336 | 289 | 330 | 296 |
| Single | 28 | 6 | 16 | 18 | 58 | 26 | 32 | 22 | 74 | 26 | 4 | 14 | 61 | 20 | 54 |
| Level of education | |||||||||||||||
| JSS | 0 | 44 | 24 | 17 | 25 | 17 | 29 | 27 | 9 | 18 | 0 | 23 | 8 | 25 | 12 |
| SSS | 0 | 0 | 0 | 0 | 0 | 0 | 0 | 0 | 0 | 0 | 0 | 0 | 0 | 0 | 0 |
| No formal | 173 | 120 | 152 | 131 | 150 | 184 | 152 | 139 | 178 | 148 | 166 | 113 | 86 | 120 | 85 |
| Primary | 177 | 186 | 174 | 202 | 175 | 149 | 169 | 184 | 163 | 184 | 184 | 214 | 256 | 205 | 253 |
| Tertiary | 0 | 0 | 0 | 0 | 0 | 0 | 0 | 0 | 0 | 0 | 0 | 0 | 0 | 0 | 0 |
| Household size | |||||||||||||||
| 3 | 58 | 8 | 22 | 28 | 62 | 39 | 48 | 30 | 91 | 44 | 21 | 14 | 61 | 24 | 60 |
| 4 | 110 | 122 | 167 | 153 | 130 | 171 | 140 | 119 | 123 | 95 | 135 | 120 | 82 | 123 | 106 |
| >5 | 182 | 220 | 161 | 169 | 158 | 140 | 162 | 201 | 136 | 211 | 194 | 216 | 207 | 203 | 184 |
| Length of stay in community (in years) | |||||||||||||||
| 21–30 | 42 | 6 | 18 | 16 | 80 | 45 | 50 | 37 | 74 | 29 | 10 | 14 | 63 | 24 | 60 |
| 31–40 | 126 | 139 | 141 | 157 | 126 | 186 | 160 | 130 | 120 | 96 | 188 | 82 | 80 | 117 | 106 |
| 41–50 | 151 | 185 | 161 | 157 | 107 | 93 | 118 | 164 | 132 | 178 | 136 | 230 | 159 | 198 | 166 |
| >51 | 31 | 20 | 30 | 20 | 37 | 26 | 22 | 19 | 24 | 47 | 16 | 24 | 48 | 11 | 18 |
| Years of fishing | |||||||||||||||
| 10–20 | 56 | 21 | 18 | 16 | 137 | 45 | 50 | 37 | 74 | 29 | 52 | 14 | 61 | 24 | 60 |
| 21–30 | 145 | 174 | 172 | 200 | 146 | 220 | 210 | 168 | 150 | 122 | 182 | 132 | 128 | 174 | 149 |
| 31–40 | 149 | 155 | 160 | 134 | 67 | 85 | 90 | 145 | 126 | 199 | 116 | 204 | 161 | 152 | 141 |
Note: JSS represents junior secondary or high school, and SSS is senior secondary or high school.
Table 3.
Perceived climate-related and oceanic impacts.
| Variables | Elmina | Cape Coast | Moree | Biriwa | Apam | Gomoa Fetteh | Nyanyano | Bortianor | James Town | Teshie | Azizanya | Dzita | Vodza | Agavedzi | Adina |
|---|---|---|---|---|---|---|---|---|---|---|---|---|---|---|---|
| Most common impact of climate change over the last two decades | |||||||||||||||
| Coastal erosion | |||||||||||||||
| 22 | 36 | 32 | 96 | 70 | 18 | 4 | 14 | 41 | 37 | 158 | 105 | 82 | 87 | 50 | |
| Rising temperatures | |||||||||||||||
| 97 | 103 | 160 | 81 | 143 | 198 | 206 | 173 | 151 | 99 | 54 | 27 | 93 | 54 | 120 | |
| Sea level rise | |||||||||||||||
| 187 | 165 | 82 | 124 | 75 | 35 | 23 | 16 | 85 | 158 | 110 | 204 | 138 | 187 | 111 | |
| Storms and waves | |||||||||||||||
| 0 | 0 | 0 | 0 | 3 | 0 | 0 | 0 | 0 | 0 | 0 | 0 | 0 | 0 | 0 | |
| Unpredictable rainfall | |||||||||||||||
| 44 | 46 | 76 | 49 | 59 | 99 | 117 | 147 | 73 | 56 | 28 | 14 | 37 | 22 | 69 | |
| Factors contributing to the most common impacts | |||||||||||||||
| High wave energy | |||||||||||||||
| 0 | 0 | 0 | 0 | 6 | 0 | 0 | 0 | 0 | 0 | 0 | 0 | 0 | 0 | 0 | |
| Increased CO2 concentration in the atmosphere | |||||||||||||||
| 143 | 153 | 248 | 145 | 210 | 301 | 323 | 320 | 238 | 167 | 84 | 44 | 130 | 79 | 189 | |
| Sand mining | |||||||||||||||
| 0 | 0 | 0 | 0 | 3 | 0 | 0 | 0 | 0 | 0 | 0 | 0 | 0 | 0 | 0 | |
| Shoreline change | |||||||||||||||
| 22 | 36 | 32 | 96 | 67 | 18 | 4 | 14 | 41 | 37 | 158 | 105 | 82 | 87 | 50 | |
| Warming of the seas | |||||||||||||||
| 185 | 161 | 70 | 109 | 64 | 31 | 23 | 16 | 71 | 146 | 108 | 201 | 138 | 184 | 111 | |
| Impact of climate change on fish population | |||||||||||||||
| Yes | 340 | 344 | 337 | 320 | 347 | 335 | 334 | 5 | 342 | 350 | 320 | 322 | 330 | 324 | 350 |
| No | 10 | 6 | 13 | 30 | 3 | 15 | 16 | 345 | 8 | 0 | 30 | 28 | 20 | 26 | 0 |
| Impact of SST on fish and fish stocks | |||||||||||||||
| Yes | 282 | 298 | 311 | 279 | 265 | 304 | 300 | 328 | 315 | 284 | 168 | 271 | 317 | 282 | 269 |
| No | 68 | 52 | 39 | 71 | 85 | 46 | 50 | 22 | 35 | 66 | 182 | 79 | 33 | 68 | 81 |
| Impact of SSS on fish and fish stocks | |||||||||||||||
| Yes | 0 | 0 | 0 | 0 | 2 | 0 | 0 | 0 | 0 | 0 | 0 | 0 | 0 | 0 | 0 |
| No | 350 | 350 | 350 | 350 | 348 | 350 | 350 | 350 | 350 | 350 | 350 | 350 | 350 | 350 | 350 |
| Total number of fish caught over the last two decades | |||||||||||||||
| Decreased | |||||||||||||||
| 350 | 350 | 350 | 350 | 350 | 350 | 350 | 350 | 350 | 350 | 350 | 350 | 350 | 350 | 350 | |
| Increased | |||||||||||||||
| 0 | 0 | 0 | 0 | 0 | 0 | 0 | 0 | 0 | 0 | 0 | 0 | 0 | 0 | 0 | |
| Climate change as the only cause of decreased fish catch | |||||||||||||||
| Yes | 0 | 0 | 0 | 0 | 3 | 0 | 0 | 0 | 0 | 0 | 0 | 0 | 0 | 0 | 0 |
| No | 350 | 350 | 350 | 350 | 347 | 350 | 350 | 350 | 350 | 350 | 350 | 350 | 350 | 350 | 350 |
| Other factors causing low fish catch | |||||||||||||||
| Catching of fingerlings | |||||||||||||||
| 0 | 0 | 0 | 0 | 22 | 0 | 0 | 0 | 0 | 0 | 0 | 0 | 0 | 0 | 0 | |
| Poor fishing equipment | |||||||||||||||
| 39 | 0 | 46 | 56 | 78 | 29 | 16 | 49 | 31 | 0 | 10 | 0 | 0 | 0 | 50 | |
| Many people are fishing | |||||||||||||||
| 223 | 233 | 169 | 241 | 139 | 165 | 123 | 149 | 84 | 66 | 213 | 182 | 164 | 210 | 162 | |
| Illegal fishing activities | |||||||||||||||
| 0 | 0 | 0 | 23 | 85 | 0 | 0 | 0 | 0 | 0 | 0 | 45 | 74 | 0 | 18 | |
| More canoes/nets on the sea | |||||||||||||||
| 82 | 75 | 3 | 0 | 8 | 2 | 0 | 0 | 0 | 0 | 127 | 123 | 90 | 140 | 120 | |
| Use of light in fishing | |||||||||||||||
| 0 | 0 | 132 | 28 | 0 | 154 | 211 | 152 | 235 | 284 | 0 | 0 | 0 | 0 | 0 | |
| Use of wrong materials/chemicals | |||||||||||||||
| 6 | 42 | 0 | 2 | 15 | 0 | 0 | 0 | 0 | 0 | 0 | 0 | 22 | 0 | 0 | |
| Major problems that limit fishing activities | |||||||||||||||
| High prices/shortage of premix fuel | |||||||||||||||
| 180 | 170 | 221 | 182 | 220 | 242 | 291 | 250 | 228 | 177 | 206 | 177 | 237 | 157 | 196 | |
| High prices of outboard motors | |||||||||||||||
| 0 | 0 | 14 | 0 | 0 | 0 | 0 | 0 | 0 | 0 | 0 | 0 | 0 | 0 | 0 | |
| Financial challenges | |||||||||||||||
| 10 | 13 | 65 | 115 | 42 | 49 | 26 | 33 | 63 | 139 | 10 | 52 | 51 | 43 | 62 | |
| Inadequate government support | |||||||||||||||
| 0 | 0 | 0 | 0 | 33 | 0 | 0 | 0 | 0 | 0 | 0 | 0 | 0 | 0 | 0 | |
| Poor fishing equipment | |||||||||||||||
| 0 | 0 | 0 | 0 | 3 | 0 | 0 | 0 | 0 | 0 | 0 | 0 | 0 | 0 | 0 | |
| The activities of saiko | |||||||||||||||
| 160 | 167 | 50 | 53 | 52 | 59 | 33 | 67 | 59 | 34 | 134 | 121 | 62 | 150 | 92 | |
Table 4.
Livelihood opportunities of fishermen.
| Variables | Elmina | Cape Coast | Moree | Biriwa | Apam | Gomoa Fetteh | Nyanyano | Bortianor | James Town | Teshie | Azizanya | Dzita | Vodza | Agavedzi | Adina |
|---|---|---|---|---|---|---|---|---|---|---|---|---|---|---|---|
| Ownership of a dwelling place | |||||||||||||||
| Yes | 53 | 83 | 95 | 65 | 139 | 111 | 101 | 122 | 11 | 96 | 70 | 93 | 42 | 64 | 65 |
| No | 297 | 267 | 255 | 285 | 211 | 239 | 249 | 228 | 339 | 254 | 280 | 257 | 308 | 286 | 285 |
| Ownership of canoe/boat used for fishing | |||||||||||||||
| Yes | 57 | 95 | 29 | 82 | 60 | 29 | 18 | 44 | 54 | 97 | 41 | 44 | 47 | 53 | 90 |
| No | 293 | 255 | 321 | 268 | 290 | 321 | 332 | 306 | 296 | 253 | 309 | 306 | 303 | 297 | 260 |
| Sufficiency of income from fishing to cater for household’s living expenses | |||||||||||||||
| Yes | 50 | 66 | 14 | 52 | 104 | 19 | 4 | 20 | 37 | 30 | 0 | 0 | 0 | 0 | 14 |
| No | 300 | 284 | 336 | 298 | 246 | 331 | 346 | 330 | 313 | 320 | 350 | 350 | 350 | 350 | 336 |
| Where to find income to supplement a household’s living expenses | |||||||||||||||
| Borrow from fish sellers | |||||||||||||||
| 265 | 261 | 234 | 244 | 212 | 231 | 275 | 266 | 220 | 227 | 324 | 264 | 273 | 220 | 297 | |
| Borrow from relatives | |||||||||||||||
| 35 | 23 | 102 | 52 | 4 | 100 | 75 | 64 | 88 | 93 | 26 | 86 | 77 | 130 | 31 | |
| Others (friends) | |||||||||||||||
| 0 | 0 | 0 | 2 | 30 | 0 | 0 | 0 | 5 | 0 | 0 | 0 | 0 | 0 | 8 | |
| Ease of securing loans from banks for fishing activities | |||||||||||||||
| Yes | 62 | 49 | 33 | 67 | 54 | 62 | 4 | 17 | 101 | 71 | 32 | 7 | 26 | 19 | 61 |
| No | 288 | 301 | 317 | 283 | 296 | 288 | 346 | 333 | 249 | 279 | 318 | 343 | 324 | 331 | 289 |
| Impact of climate change on health | |||||||||||||||
| Yes | 342 | 312 | 181 | 148 | 200 | 229 | 291 | 324 | 224 | 237 | 302 | 330 | 307 | 322 | 333 |
| No | 8 | 38 | 169 | 202 | 150 | 121 | 59 | 26 | 126 | 113 | 48 | 20 | 43 | 28 | 17 |
| Sickness resulting from climate change | |||||||||||||||
| Dizziness | |||||||||||||||
| 0 | 14 | 116 | 67 | 38 | 58 | 3 | 2 | 31 | 3 | 39 | 0 | 31 | 0 | 35 | |
| Fever | |||||||||||||||
| 261 | 143 | 0 | 71 | 7 | 82 | 242 | 271 | 113 | 194 | 148 | 158 | 118 | 152 | 129 | |
| Headache | |||||||||||||||
| 30 | 155 | 0 | 0 | 17 | 29 | 46 | 51 | 45 | 32 | 115 | 172 | 135 | 170 | 147 | |
| Malaria | |||||||||||||||
| 51 | 0 | 52 | 10 | 87 | 50 | 0 | 0 | 27 | 8 | 0 | 0 | 23 | 0 | 22 | |
| Skin rashes/heat stress | |||||||||||||||
| 0 | 0 | 13 | 0 | 51 | 10 | 0 | 0 | 8 | 0 | 0 | 0 | 0 | 0 | 0 | |
| Fishing throughout the year | |||||||||||||||
| Yes | 59 | 77 | 246 | 284 | 174 | 0 | 0 | 0 | 276 | 223 | 63 | 0 | 0 | 3 | 4 |
| No | 291 | 273 | 104 | 66 | 176 | 350 | 350 | 350 | 74 | 127 | 287 | 350 | 350 | 347 | 346 |
| Activities engaged in when not fishing | |||||||||||||||
| Carpentry | |||||||||||||||
| 18 | 0 | 2 | 1 | 18 | 0 | 0 | 6 | 0 | 0 | 0 | 0 | 0 | 0 | 0 | |
| Construction/mason | |||||||||||||||
| 89 | 131 | 33 | 47 | 92 | 0 | 16 | 53 | 24 | 4 | 0 | 0 | 0 | 0 | 0 | |
| Laborer | |||||||||||||||
| 0 | 66 | 0 | 0 | 0 | 0 | 0 | 6 | 0 | 0 | 0 | 0 | 0 | 0 | 0 | |
| Maintain canoe/boat | |||||||||||||||
| 0 | 0 | 0 | 0 | 0 | 0 | 0 | 0 | 44 | 123 | 0 | 0 | 0 | 0 | 27 | |
| Nothing | |||||||||||||||
| 5 | 0 | 0 | 0 | 44 | 71 | 0 | 0 | 6 | 0 | 0 | 18 | 61 | 66 | 69 | |
| Repair fishing net | |||||||||||||||
| 179 | 76 | 69 | 18 | 22 | 279 | 334 | 285 | 0 | 0 | 287 | 332 | 289 | 281 | 254 | |
| Activities engaged in help improve livelihoods | |||||||||||||||
| Yes | |||||||||||||||
| 155 | 243 | 72 | 66 | 120 | 0 | 16 | 65 | 56 | 121 | 0 | 44 | 0 | 40 | 0 | |
| No response | |||||||||||||||
| 136 | 30 | 32 | 0 | 56 | 350 | 334 | 285 | 18 | 6 | 287 | 306 | 350 | 307 | 350 | |
Disclaimer/Publisher’s Note: The statements, opinions and data contained in all publications are solely those of the individual author(s) and contributor(s) and not of MDPI and/or the editor(s). MDPI and/or the editor(s) disclaim responsibility for any injury to people or property resulting from any ideas, methods, instructions or products referred to in the content. |
© 2024 by the authors. Licensee MDPI, Basel, Switzerland. This article is an open access article distributed under the terms and conditions of the Creative Commons Attribution (CC BY) license (https://creativecommons.org/licenses/by/4.0/).
Share and Cite
MDPI and ACS Style
Ankrah, J.; Monteiro, A.; Madureira, H. Climate Variability, Coastal Livelihoods, and the Influence of Ocean Change on Fish Catch in the Coastal Savannah Zone of Ghana. Water 2024, 16, 1201. https://doi.org/10.3390/w16091201
AMA Style
Ankrah J, Monteiro A, Madureira H. Climate Variability, Coastal Livelihoods, and the Influence of Ocean Change on Fish Catch in the Coastal Savannah Zone of Ghana. Water. 2024; 16(9):1201. https://doi.org/10.3390/w16091201
Chicago/Turabian StyleAnkrah, Johnson, Ana Monteiro, and Helena Madureira. 2024. "Climate Variability, Coastal Livelihoods, and the Influence of Ocean Change on Fish Catch in the Coastal Savannah Zone of Ghana" Water 16, no. 9: 1201. https://doi.org/10.3390/w16091201
Note that from the first issue of 2016, this journal uses article numbers instead of page numbers. See further details here.