Article

Spatio-Temporal Prediction of Three-Dimensional Stability of Highway Shallow Landslide in Southeast Tibet Based on TRIGRS and Scoops3D Coupling Model

1
Institute of Geomechanics, Chinese Academy of Geological Sciences, Beijing 100081, China
2
Observation and Research Station of Crustal Stress and Strain in Beijing, Ministry of Natural Resources, Beijing 100081, China
3
Key Laboratory of Active Tectonics and Geological Safety, Ministry of Natural Resources, Beijing 100081, China
4
School of Civil and Resources Engineering, University of Science and Technology Beijing, Beijing 100083, China
5
Institute of Earthquake Forecasting, China Earthquake Administration, Beijing 100036, China
6
Hydrogeology and Engineering Geology Institute of Hubei Geological Bureau, Jingzhou 434000, China
*
Author to whom correspondence should be addressed.
Water 2024, 16(9), 1207; https://doi.org/10.3390/w16091207
Submission received: 10 March 2024 / Revised: 15 April 2024 / Accepted: 16 April 2024 / Published: 24 April 2024
(This article belongs to the Special Issue Assessment of the Rainfall-Induced Landslide Distribution)

Abstract

:
National Highway G559 is the first highway in Southeast Tibet into Motuo County, which has not only greatly improved the difficult situation of local roads, but also promoted the economic development of Tibet. However, rainfall-induced shallow landslides occur frequently along the Bomi–Motuo section, which seriously affects the safe operation and construction work of the highway. Therefore, it is urgent to carry out geological disaster assessment and zoning along the highway. Based on remote-sensing interpretation and field investigation, the distribution characteristics and sliding-prone rock mass of shallow landslides along the Bomi–Motuo Highway were identified. Three-dimensional stability analysis of regional landslides along the Bomi-Motuo Highway under different rainfall scenarios was carried out based on the TRIGRS and Scoops3D coupled model (T-S model). The temporal and spatial distribution of potential rainfall landslides in this area is effectively predicted, and the reliability of the predicted results is also evaluated. The results show that: (1) The slope structure along the highway is mainly composed of loose gravel soil on the upper part and a strong weathering layer of bedrock on the lower part. The sliding surface is mostly a circular and plane type, and the main failure types are creep–tensile failure and flexural–tensile failure. (2) Based on the T-S coupling model, it is predicted that the potential landslide along the Bomi–Motuo Highway in the natural state is scattered. The distribution area of extremely unstable and unstable areas accounts for 4.92% of the total area. In the case of extreme rainfall once in a hundred years, the proportion of instability area (Fs < 1) predicted by the T-S coupling model 1 h after rainfall is 7.74%, which is 1.57 times that of the natural instability area. The instability area (Fs < 1) accounted for 43.40% of the total area after 12 h of rainfall. The potential landslides were mainly distributed in the Bangxin–Zhamu section and the East Gedang section. (3) The TRIGRS and T-S coupling model is both suitable for predicting the temporal–spatial distribution of rainfall-induced shallow landslides, but the TRIGRS model has the problem of over-prediction. The instability area predicted by the T-S coupling model accounted for 43.30%, and 74% of the historical landslide disaster points in the area were correctly predicted. (4) In terms of rainfall response, the T-S coupling model shows higher sensitivity. The %LRclass (Fs < 1) index of the T-S coupling model is above 50% in different time periods, and its landslide-prediction effect (%LRclass = 78.80%) was significantly better than that of the one-dimensional TRIGRS model (%LRclass = 45.50%) under a 12 h rainfall scenario. The research results have important reference significance for risk identification and disaster reduction along the G559 Bomi–Motuo Highway.

1. Introduction

Due to the special topographic conditions, geological structure, and climate environment of Southeast Tibet, the natural geographical conditions here have the saying of the “six most”: the highest earthquake intensity, the most complex geological conditions, the largest natural slope, the largest topographic relief, the largest rainfall, and the most geological disasters [1]. According to remote-sensing interpretation and field investigation, a large number of rainfall-induced shallow landslides developed along the G559 Bomi–Motuo Highway. The thickness of the slide mass is generally less than 10 m, the scale of the landslide is mainly small to medium, and the sensitivity of the landslide to various induced factors is strong. The occurrence and resurrection of landslides in this area are very high, and the road is often silted, resulting in the highway patency rate of only 6.5%, which seriously affects the traffic conditions. Therefore, the spatio-temporal prediction of the three-dimensional stability of a shallow landslide on the G559 Bomi–Motuo Highway is of great guiding significance for highway disaster prevention, mitigation, and quantitative risk assessment in Southeast Tibet.
The dynamic stability evaluation and the spatio-temporal probability prediction of regional rainfall-induced landslides are one of the hot issues in the field of landslide-risk research [2]. The prediction models mainly include a data-driven statistical model and a physics-based deterministic model [3], among which the physics-based deterministic model is the main research direction at present. This method is based on the mechanical principle of rainfall-induced slope failure, combined with the limit equilibrium theory to establish the mechanical model to evaluate and predict the stability of landslides under specific rainfall conditions. At present, deterministic models are gradually developing from one-dimensional and two-dimensional models to three-dimensional models. One-dimensional and two-dimensional models include the SHALSTAB model [4], the dSLAM model [5], the SINMAP model [6], the Iverson model [7], the TRIGRS model [8], HIRES model [9], and the Green–Ampt model [10]. These models comprehensively consider the response characteristics of groundwater level and pore water pressure of the slope under rainfall, so they have achieved good results in evaluating slope stability and landslide spatial prediction. However, these models ignore the sliding direction and three-dimensional geometric characteristics of landslides and oversimplify the slope failure mechanism, which difficult to reflect the mechanical mechanism of landslides and usually leads to conservative calculation results [11]. Therefore, since the 21st century, foreign scholars have been committed to the regional scale three-dimensional slope-stability analysis and spatial prediction based on the limit equilibrium method and Moore–Coulomb strength criterion. Reid et al. proposed a three-dimensional slope-stability calculation model (Scoops3D), which has been widely recognized because it can effectively avoid the disadvantage of conservative results in one-dimensional and two-dimensional calculations [12].
The Scoops3D model not only takes into account the interaction between grids when searching the slip surface but also has the advantage of setting the parameters of rock and soil mass in spatial longitudinal layers, etc. At present, the Scoops3D model has been successfully applied in landslide stability analysis and prediction [13]. Xin et al. used Scoops3D to evaluate and predict the stability of shallow loess in typical gully landforms in the Loess Plateau [14]. Zhang et al. used the Scoops3D model to predict the mass landslides in volcanic ash areas induced by the 2018 Hokkaido earthquake, with an accuracy of more than 80%. Because Scoops3D lacks an independent seepage calculation model, its application in rainfall-induced landslides is rarely studied [15]. However, a third-party rainfall seepage model can be introduced into Scoops3D to realize the stability analysis and evaluation of the seepage–stress coupling of three-dimensional slopes. Therefore, the establishment of the TRIGRS and Scoops3D coupling model (T-S model) is an effective means of solving the three-dimensional stability evaluation of rain-induced landslides [2,16,17,18,19]. The coupling of these models can not only give full play to the advantages of each single model but also effectively improve the reliability of a three-dimensional landslide stability evaluation. By using the Scoops3D and TRIGRS models, Tran et al. predicted the rainfall landslide that occurred in Umyeon, South Korea in July 2011 and achieved good results, which also proved the feasibility of this method in the stability prediction and evaluation of a rainfall landslide [20].
In this paper, the T-S coupling model is used to simulate the spatial–temporal distribution and dynamic changes of the slope three-dimensional stability under different rainfall scenarios. The prediction results of the one-dimensional TRIGRS model and the three-dimensional T-S coupling model were compared and analyzed, and the applicability and accuracy of the two methods were discussed. The research results have reference significance for risk identification and disaster reduction along the G559 Bomi–Motuo Highway.

2. Study Area and Data

Motuo County is located in the middle and lower reaches of the Yarlung Zangbo River in the southeast corner of the Qinghai–Tibet Plateau and is a part of the Eastern Himalayan structural junction (Figure 1a,b). This area is characterized by active tectonic movement and complex geological conditions. Under the action of strong tectonic uplift and rapid valley downcutting, the alpine canyon landform is well developed [21]. The surface rock and soil mass are obviously metamorphic and broken under the action of strong weathering, and a large number of loose deposits are formed after denudation. This fragile geological environment has a weak carrying capacity for continuous rainfall events, which provides favorable internal conditions for slope failure [22]. The study area is mainly located on the southern slope of the eastern end of the Himalayas and at the entrance of the water vapor channel of the Yarlung Tsangpo River Grand Canyon in Southeast Tibet. It is a subtropical humid climate area with the highest average annual precipitation on the Qinghai–Tibet Plateau [23], with an annual precipitation of about 2260 mm. Affected by the Indian Ocean monsoon, the rainfall in this area increases significantly from June to September [24], providing external dynamic conditions for slope failure.
Motuo is the last county in China to be connected by road. At present, the traffic network in Motuo County has been basically formed. The cutting slope is very common, and the height of the cutting slope ranges from 2 to 30 m. The quaternary loose deposits accumulate along the slope, which is more conducive to the formation of a sliding shear zone. The G559 Bomi–Motuo Highway and five important highways along the road developed a large number of rainfall-induced shallow landslides (Figure 1c and Figure 2a–c). The slope surface is widely distributed with quaternary slope deposits and alluvial deposits, and the underlying rock mass is strongly weathered to moderately weathered metamorphic rock mass, whose joints and cracks are relatively developed.

2.1. Geotechnical Parameters

The DEM data used in this study is High Mountain Asia 8-m DEM (National Snow and Ice Data Center (nsidc.org)). The resolution and accuracy of this DEM are the highest among the open-source DEM data at present, so it provides a data-accuracy guarantee for the 3D stability analysis of regional landslides [25,26,27]. In view of the existing regional landslide three-dimensional stability evaluation methods that do not consider the difference between longitudinal rock and soil mass conditions, combined with the characteristics and distribution of rock and soil mass in this study area, a preliminary attempt is made to divide the rock and soil mass into two layers, the soil layer and the bedrock weathering layer. Since the landslides in the study area belong to shallow landslides and the soil layer’s properties are uniform, the homogeneous option is selected, and then the cohesive force, internal friction force, and soil bulk density of the soil layer are input.
The applicability of different parameters in the study area was analyzed by means of literature research and engineering geological analogy [28,29,30,31]. Finally, the parameters of rock and soil mass in the study area were determined (Table 1). With reference to the previous research results in this area, the comprehensive permeability coefficient of the rock and soil mass is determined as ks = 5.86 × 10⁻⁵. According to the empirical relationship [32,33,34,35], the hydraulic diffusion coefficient is D0 = 200ks = 1.172 × 10⁻², and the infiltration rate is Iz = 0.01ks = 5.86 × 10⁻⁷.

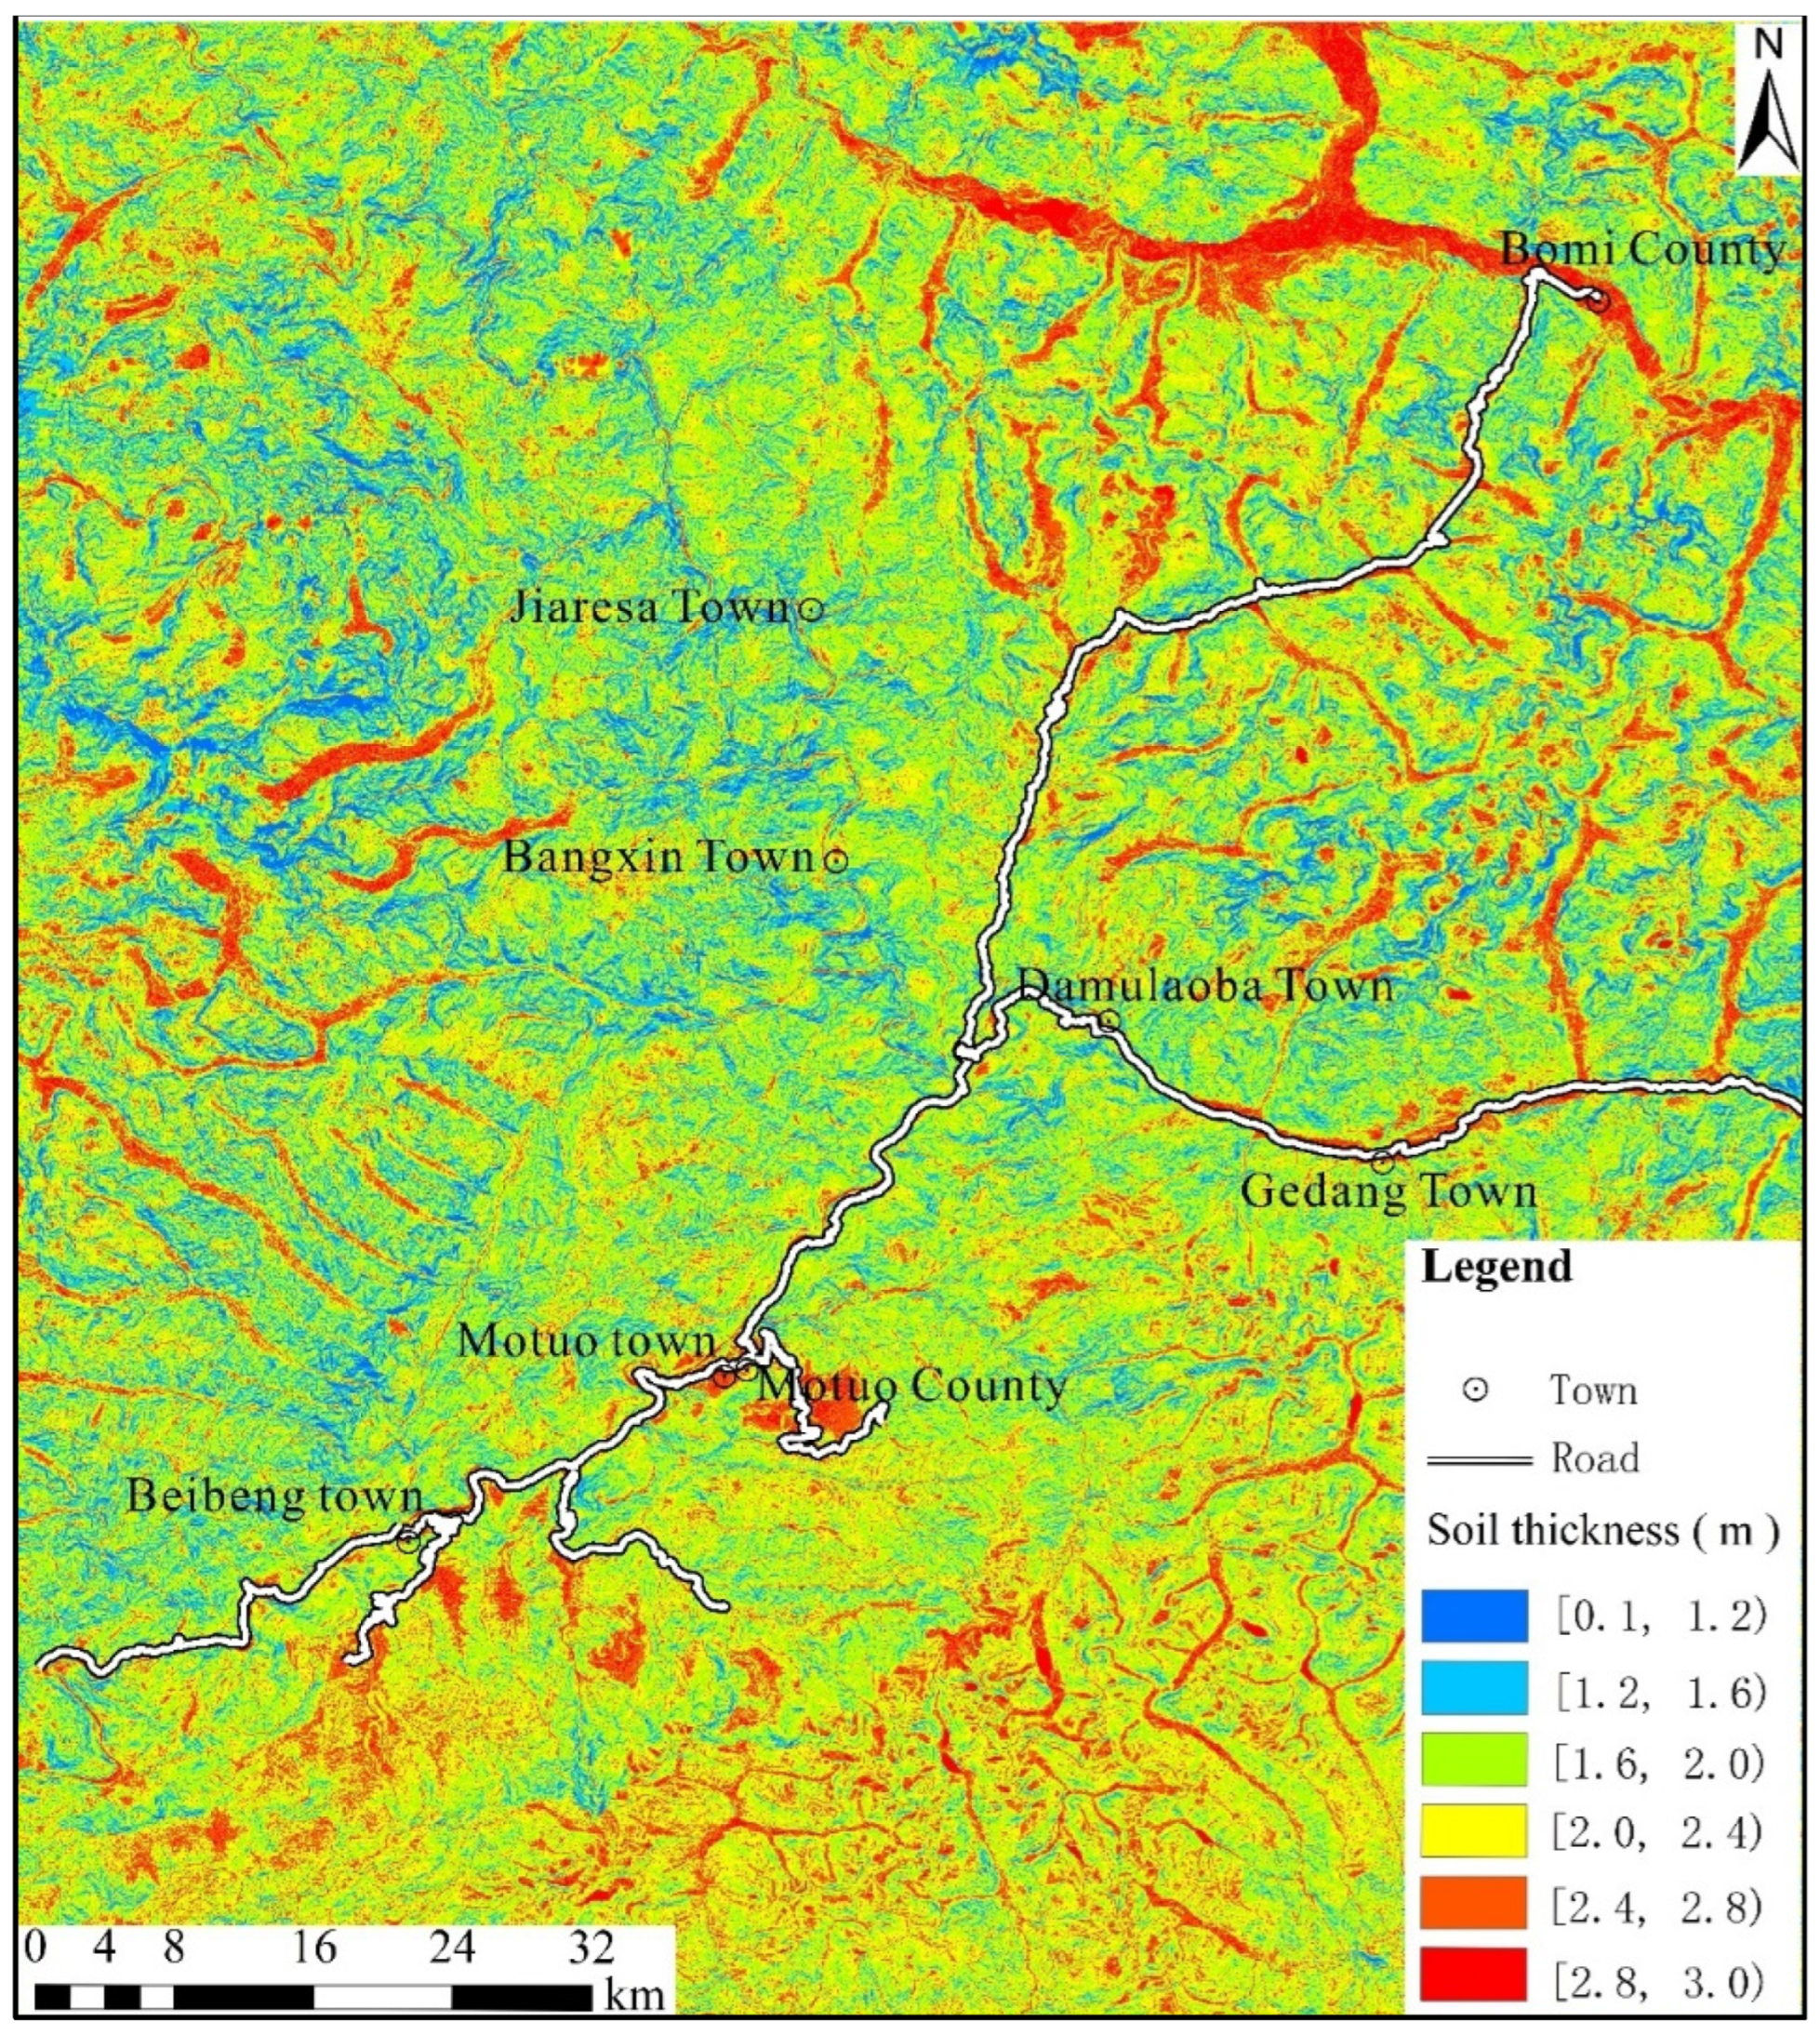
2.2. Spatial Distribution of Soil Thickness

Soil-layer thickness is not only affected by climate, biology, topography, and chemical and physical processes but also changes due to lithology, slope, curvature, and vegetation cover [36]. At present, a variety of calculation models have been proposed to estimate the spatial distribution of soil-layer thickness, such as the uniform model, hierarchical model, and linear model [37,38,39]. Combined with relevant research results, the calculation results of landslide stability and vulnerability predicted by various common models were compared. Finally, the linear soil-thickness estimation model was adopted in this study [40]. The model assumes a linear distribution relationship between soil thickness and slope [41,42,43,44]. Through field investigation, it is determined that the maximum slope corresponds to the minimum soil thickness (0.1 m), and the minimum slope corresponds to the maximum soil thickness (3 m). The slope of the study area ranges from 0 to 85.41°. So, the functional relationship between the thickness (y) of the upper layer and the slope (x) is determined as y = −0.034x + 3, and the lower layer is the infinite extension of the bedrock weathering layer (Figure 3).

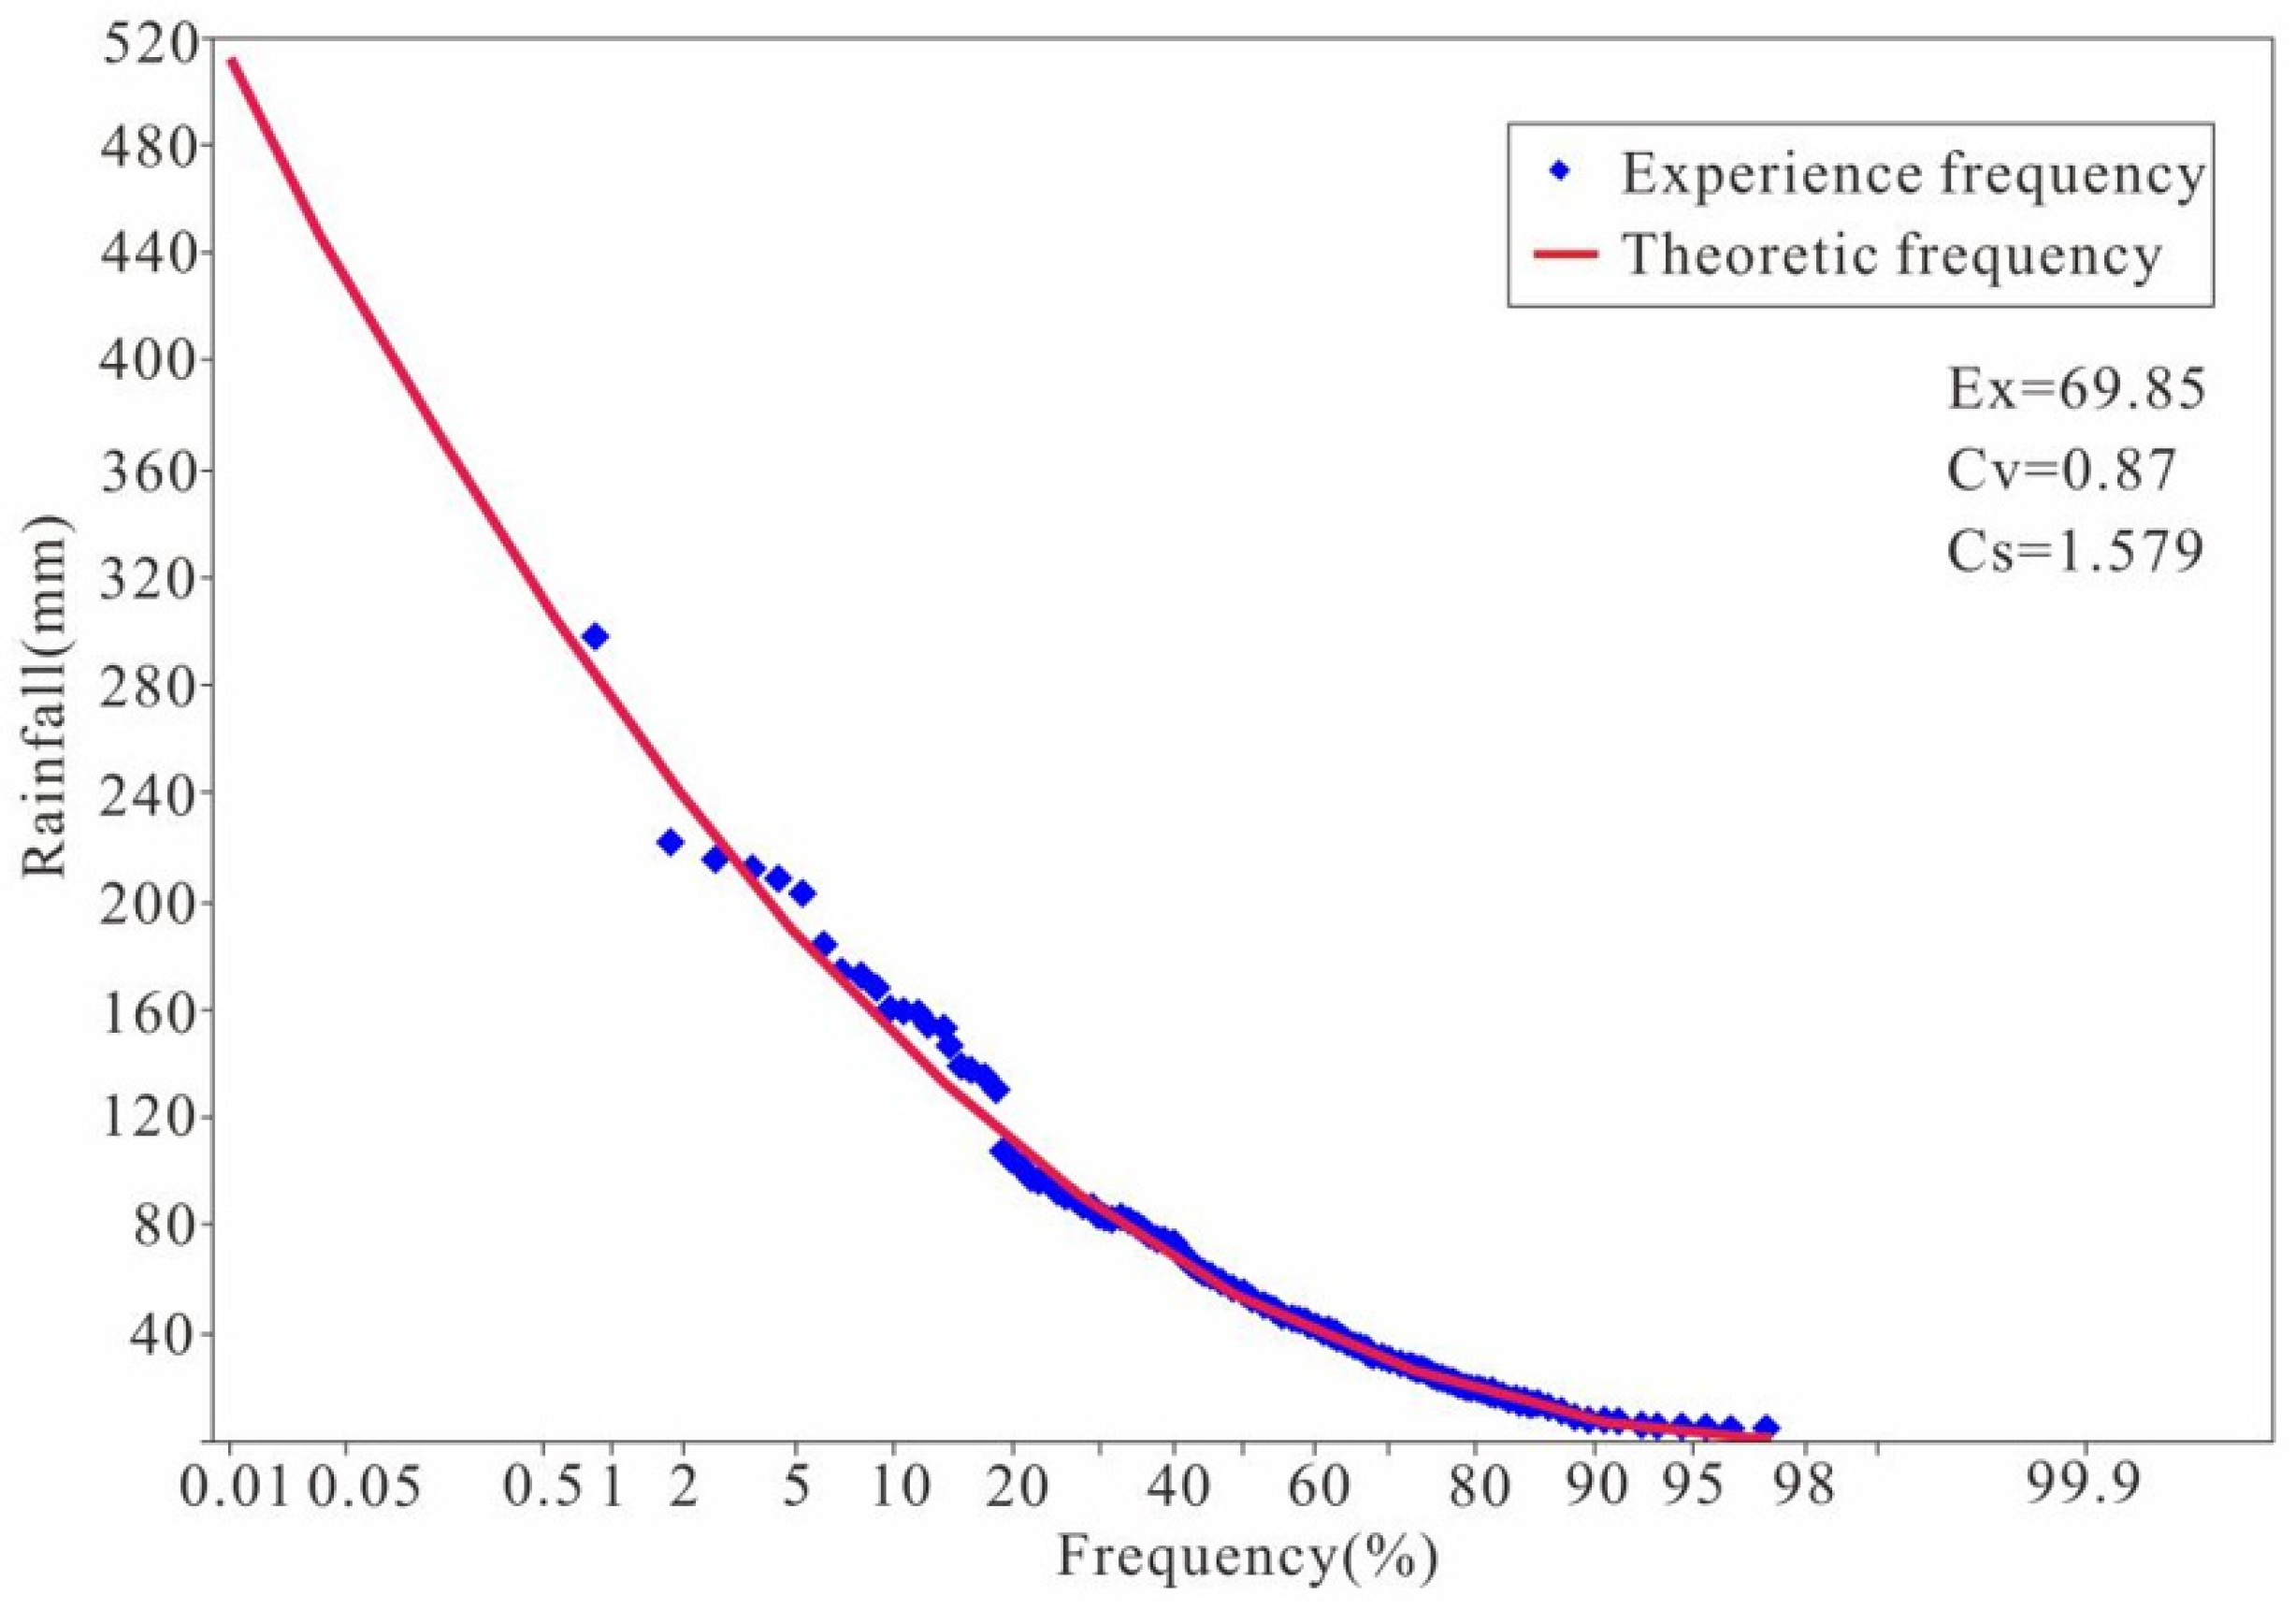
2.3. Rainfall Information

As of 2023, there are two precipitation stations in Motuo County. The Motuo Station was set up in 2012, and the Beibeng Station was set up at the end of 2017. According to the historical rainfall records, the average rainfall and the historical maximum rainfall of Motuo Station from January 2018 to December 2023, the rainfall intensity, early rainfall amount, and critical rainfall amount of geological disasters have been verified. The maximum daily rainfall data were calculated using the “Pearson Type III frequency curve” [45], and the results are shown in Figure 4. It can be concluded that, when the recurrence period is 100 years, the maximum daily rainfall in this area is 275 mm/d, and the rainfall intensity is 3.18 × 10⁻⁶ m/s.
Combined with the actual field investigation, it is determined that the study area is a mostly shallow landslide. The upper layer is a relatively loose soil layer, and the lower layer is a slightly hard bedrock weathering layer. Under the condition of short-time heavy rainfall, the groundwater level of the shallow soil will change rapidly with the rainfall infiltration and reach saturation. The saturation infiltration method was used to simulate the transient rainfall infiltration scenario in the TRIGRS model, and the water-pressure distribution files of the slope at different periods were output and coupled with the Scoops3D model. The Scoops3D hydrological model adopted the hydrological model of the three-dimensional spatial distribution of changing saturated water pressure. Strengthening the acquisition of geotechnical parameters and slope-structure data can effectively improve the prediction accuracy of the model [46,47,48], but the model is suitable for the prediction of shallow landslide results in a large range and can provide an effective reference for geological disaster risk warning [14].

3. Methods

3.1. Transient Rainfall Infiltration and Grid-Based Regional Slope-Stability Model

TRIGRS (version 2.1) is a rainfall-induced slope-hazard assessment model based on the infinite slope theory. The model mainly consists of three modules, namely a rainfall infiltration module, a hydrological module, and a stability analysis module, which fully considers the transient pore water-pressure changes of the slope caused by rainfall infiltration. In addition, it can also analyze the dynamic changes of pore water pressure, volume water content, and slope stability at different times.
Based on Richards’ linear solution proposed by Iverson, the rainfall infiltration module can objectively reflect the changes in the seepage field of the slope under the condition of rainfall infiltration [7]. In this study, it is assumed that the deep layer is bedrock regolith (corresponding to the Scoops3D model), and the permeability coefficient is very small. So, the pressure head is calculated using the lower boundary finite depth condition (Equation (1)).
Ψ Z , t = Z d β + 2 n = 1 N I n Z K S H t t n D 1 t t n 1 2 × m = 1 i e r f c 2 m 1 d L Z d L Z Z 2 D 1 t t n 1 2 + i e r f c 2 m 1 d L Z + d L Z Z 2 D 1 t t n 1 2
2 n = 1 N I n Z K s H ( t t n + 1 ) [ [ D 1 t t n + 1 ] 1 2 ] × m = 1 i e r f c 2 m 1 d L Z ( d L Z Z ) 2 [ D 1 t t n + 1 ] 1 2 + i e r f c 2 m 1 d L Z + ( d L Z Z ) 2 [ D 1 t t n + 1 ] 1 2
where ψ(Z,t) is the groundwater pressure head, which is related to soil thickness and time; Z is the thickness of the soil layer in the vertical direction and is positive in the vertical direction. t is rainfall infiltration time; d is the initial groundwater level depth of rock and soil mass. N is the time series; lnZ is the infiltration rate in the NTH time period. KS is the vertical saturation permeability coefficient. m is a convergent series; H(t − tn) is the heavy side step function, which is related to the rain intensity corresponding to the NTH moment. tn is the time when the NTH rain intensity appears; dLZ is the depth of the base. ierfc(η) is the one-time integral of the Gaussian complement function over the variable η, and the expression converges rapidly in an infinite series. Among them, β and D1 are shown in Equations (2) and (3):
β = c o s 2 δ I Z L T K s
D 1 = D 0 cos 2 δ
where δ is the slope; IZLT is the initial surface flux; and D0 is the saturated hydraulic diffusion coefficient.
The hydrologic module assumes that the grid is conserved in each calculation time step. Therefore, the rainfall that cannot penetrate in the current period will flow to the downstream grid as surface runoff and will not disappear.
The stability analysis module is based on the limit equilibrium theory and combined with the infinite slope model to calculate the safety factor of the slope (Equation (4)):
F s Z , s = t a n φ t a n δ + c ψ ( Z , s ) γ W t a n φ γ s a t Z s i n δ c o s δ
where Fs(Z,s) is the safety factor; φ is the friction angle of the soil layer; c is the soil layer’s cohesion; γw is the bulk density of groundwater; δ is the slope; and ψ(Z,s) is the pressure head, which is a function of depth and time. In general, the smaller the values of c and φ, the higher the groundwater level. The smaller the safety factor, the more unstable the slope.

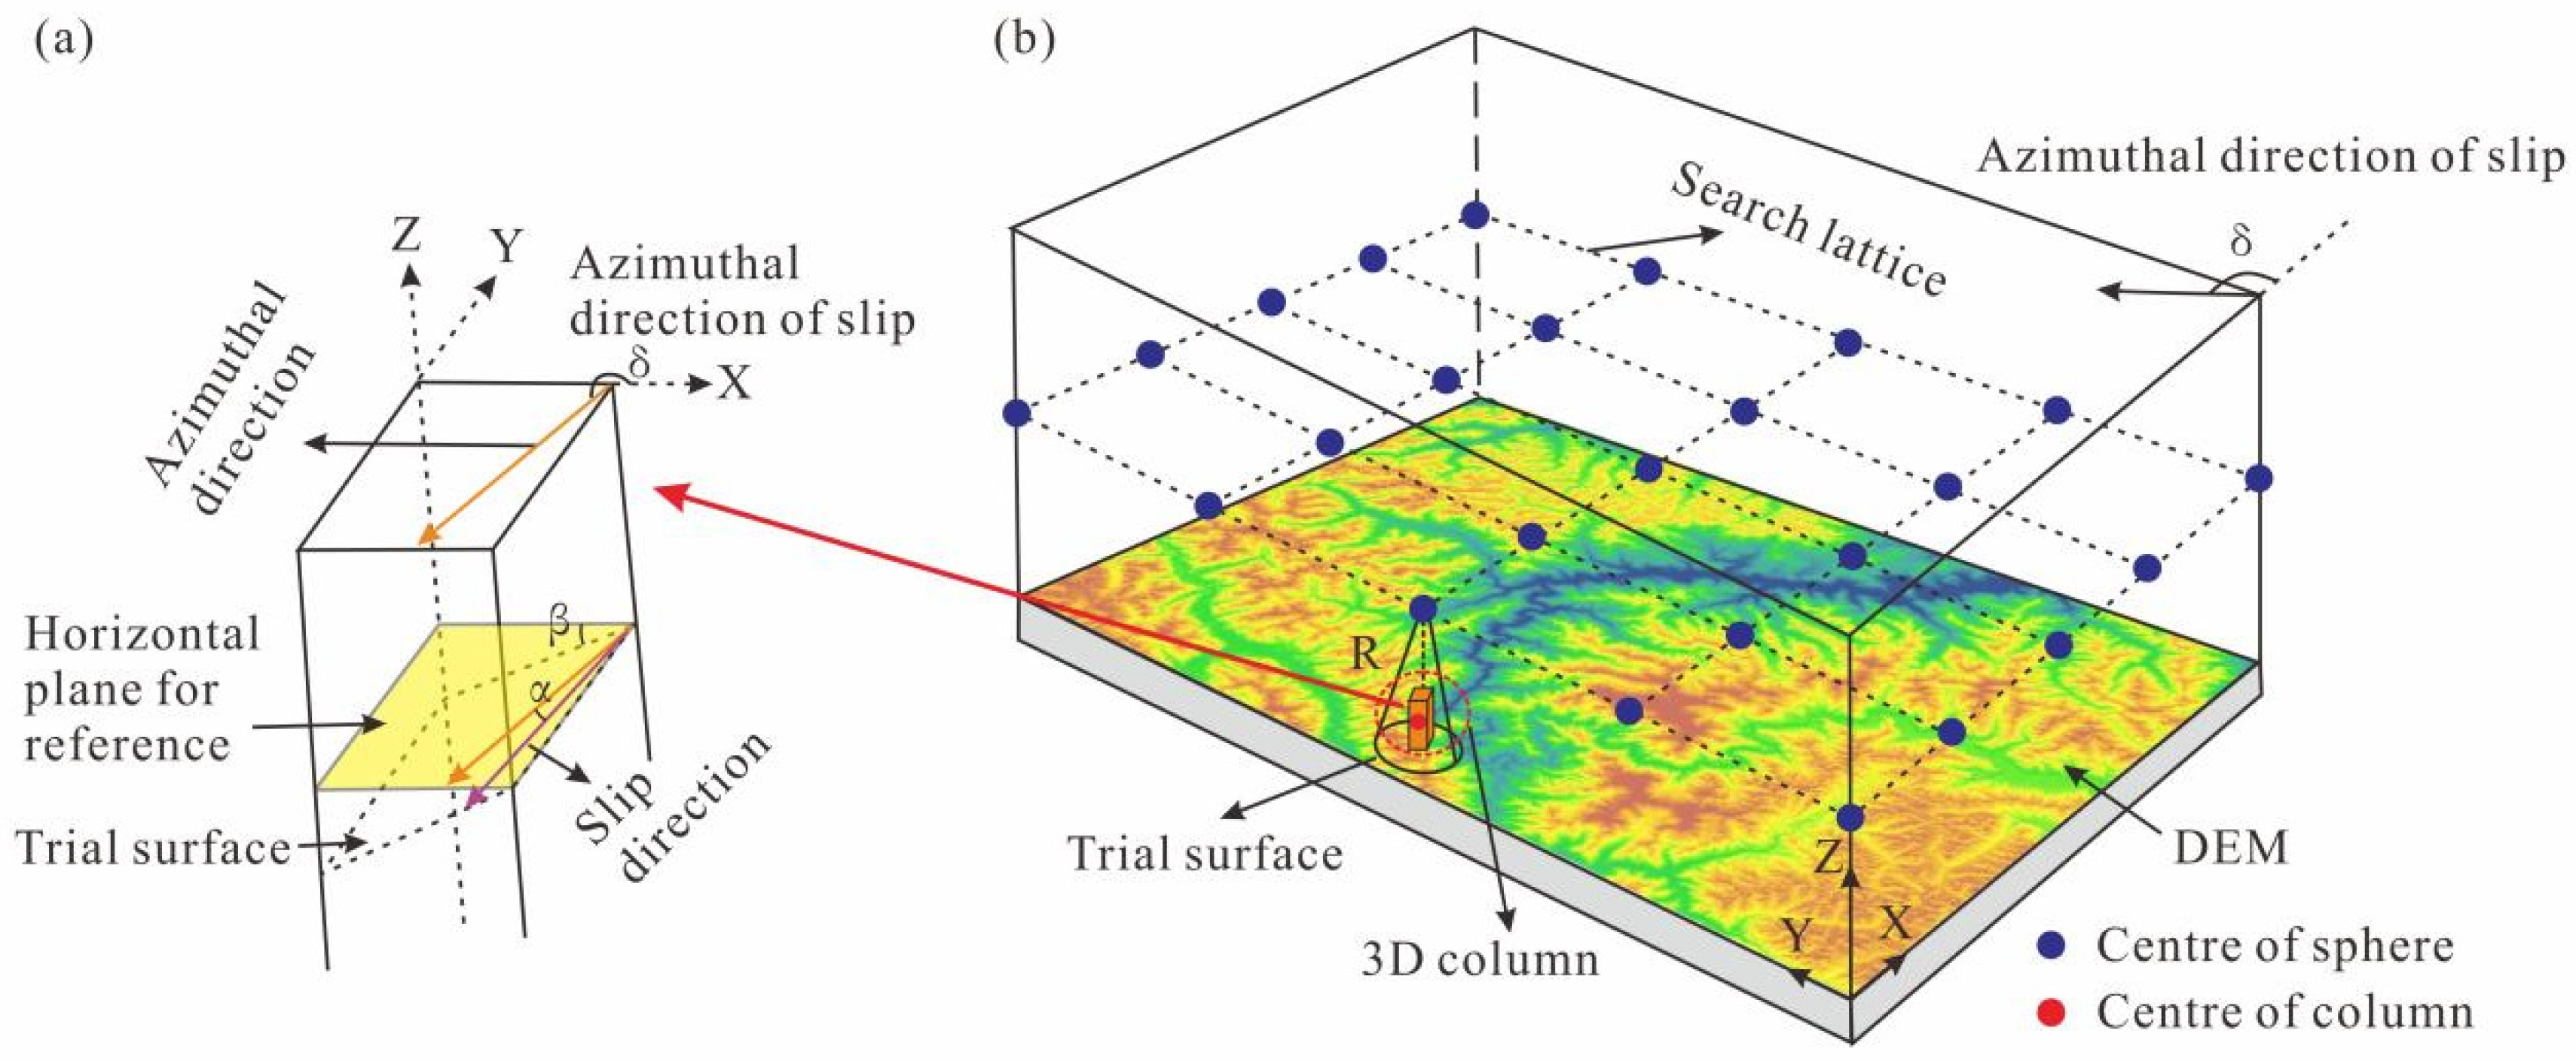
3.2. Three-Dimensional Slope-Stability Model

The Scoops3D model (version 1.3.01) can systematically and comprehensively conduct a three-dimensional search and identification of a potential sliding surface. After coupling the TRIGRS model, the influence of complex terrain, groundwater, and other conditions on the stability of potential landslides can be fully considered, which has the advantages of a wide calculation range and high identification efficiency [49].
The Scoops3D model divides the grid into three-dimensional columns based on DEM grid cells and generates several search spherical centers at a certain distance in the overall spatial range above the model. The radius is generated by using the spherical centers as the origin reference increment, and then, different spherical surfaces are generated to cut the slope body. Then, the safety factor of the slope body is calculated by the stability calculation formula. The surface marked as the intersection of a spherical surface and a three-dimensional cylinder is a potential sliding surface, and the three-dimensional cylinder included in the cutting of a spherical surface is a potential landslide (Figure 5). A landslide search will set the volume or area threshold. When the Scoops3D model reaches the maximum threshold in the search process, it will stop increasing the search radius, and use the limit equilibrium theory to calculate all three-dimensional cylinders intersecting with the spherical surface to judge their stability. Finally, the minimum safety factor recorded corresponds to the potential sliding surface with the worst stability [12]. In this study, the Bishop limit equilibrium theory was used to calculate the stability of the slope body (Equation (5)).
F s = R i , j c i . j A i . j + ( W i . j n i . j A i . j ) tan φ i . j W i . j R i . j sin α i . j + k i . j e i . j F s × ( cos β i . j F s + sin α i . j tan φ i . j )
where Ri,j is the radius of Scoops3D when searching; i and j are row i and column j of the three-dimensional cylinder, respectively; ei,j is the distance from the center of the search sphere to the center of mass of the three-dimensional cylinder; cij is the cohesiveness of the potential landslide; Ai,j is the area of potential landslide surface; φi,j are the internal friction angles of the potential slope body; ki,j is horizontal vibration loads; Wi,j is the gravity of the potential slope; ui,j represents the pore water pressure inside the three-dimensional housing; αi,j represents the apparent inclination angle of the potential slope; and βi,j is the true inclination of the potential slope.

3.3. Coupling Model of TRIGRS and Scoops3D Model

The Scoops3D model cannot simulate the seepage field of slopes, while the TRIGRS model has a mature theory and wide application in rainfall infiltration and slope seepage calculation. Therefore, a spatio-temporal prediction method for the three-dimensional stability of slopes coupled with the TRIGRS and Scoops3D models is proposed (Figure 6).
According to the field investigation, the upper layer of the slope in the study area is a relatively loose soil layer, and the lower layer is a relatively hard bedrock weathering layer. The longitudinal spatial stratification of the rock and soil mass is carried out in order to search and identify the potential sliding surface more realistically. In the coupling process, the seepage module of the TRIGRS one-dimensional slope-stability analysis model was used to simulate slope rainfall seepage, and two-dimensional pore water pressure were calculated and obtained at different rainfall durations. Then, the pore water pressure and the DEM of the study area were modeled using Scoops3D. Combined with the distribution of rock and soil mass, the regional three-dimensional pore water-pressure field distribution under different rainfall duration conditions was obtained by linear interpolation, and the potential sliding surface in the study area was searched and identified in three dimensions. The calculation results of potential rainfall landslide distribution of the Bomi–Motuo National Highway G559 under a natural state and in a once-in-a-century rainfall scenario were obtained.

4. Results and Discussion

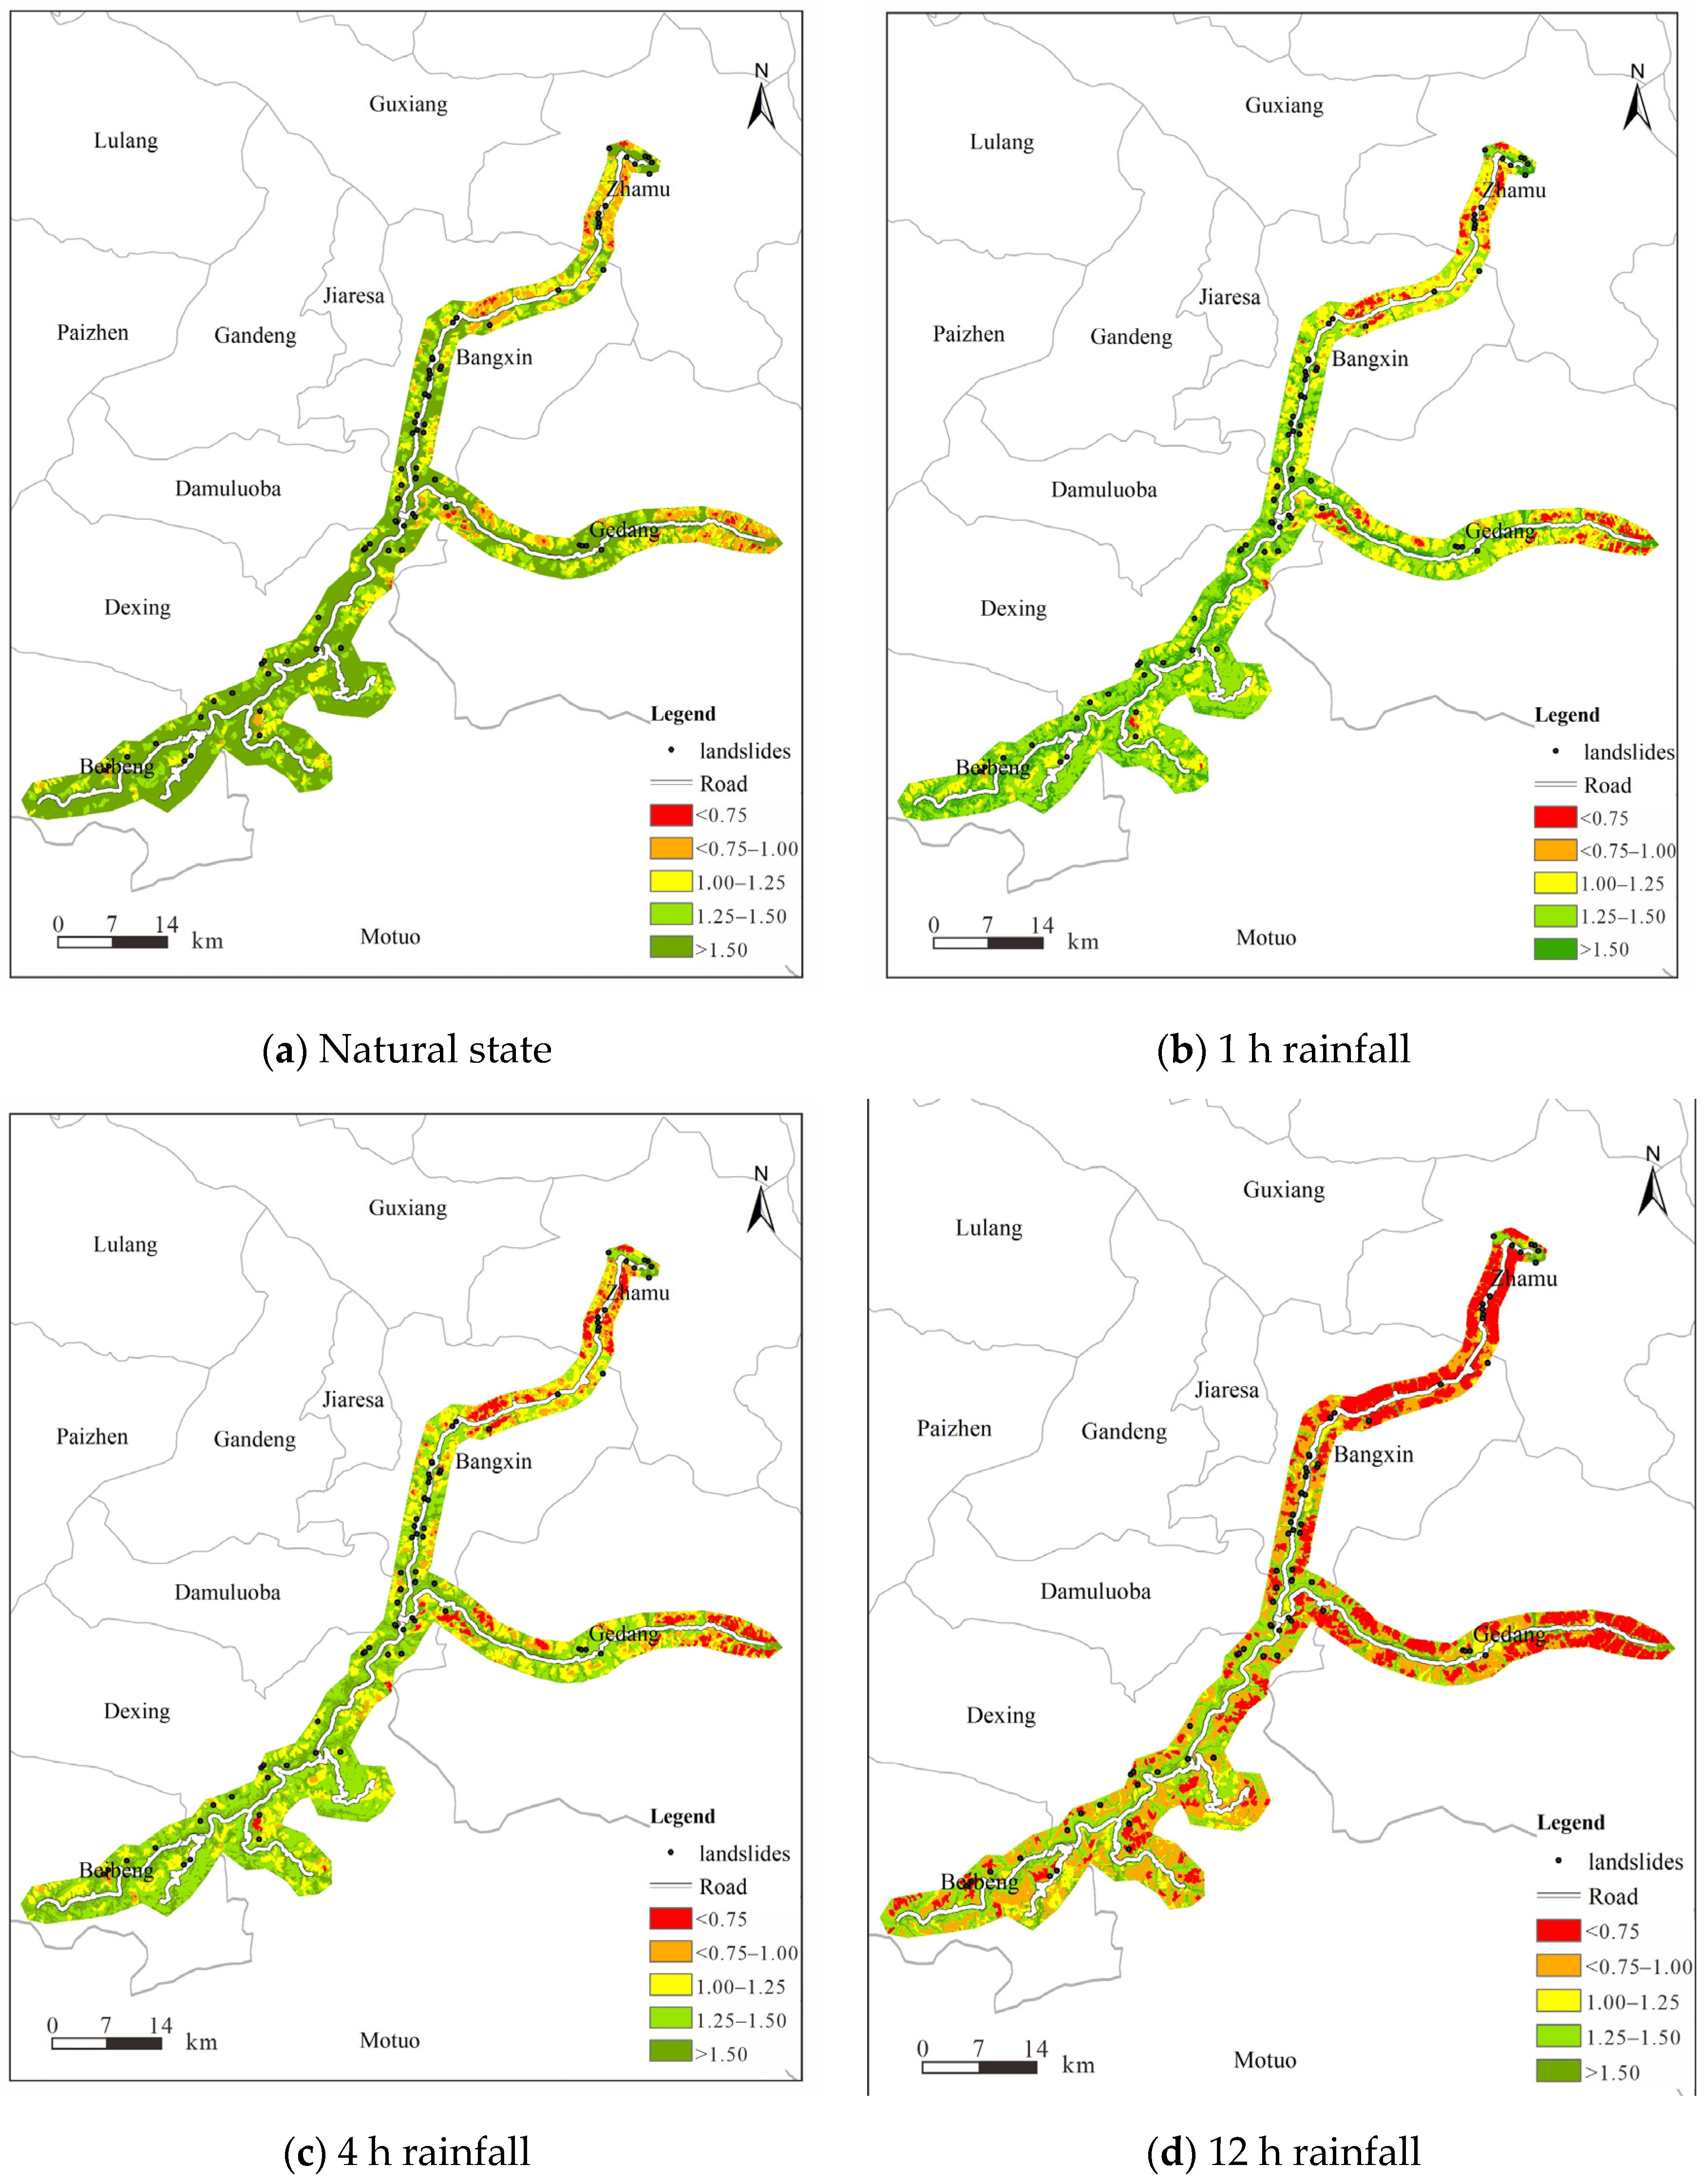
4.1. Spatiotemporal Assessment of Shallow Landslides

First, based on the vertical spatial stratification model of rock and soil mass, the spatio-temporal distribution of the three-dimensional stability of slopes in the study area under natural conditions (without rainfall) is calculated by using the Scoops3D model. Then, based on the T-S coupling model, the spatial–temporal distribution of slope three-dimensional stability under different rainfall durations of once-in-a-century extreme rainfall is simulated and predicted. In order to facilitate the classification of risk levels and statistical analysis of prediction results, this paper referred to the regional scale landslide stability classification standard (Table 2) proposed by Manuel Teixeira and divided potential landslides in the study area into different stability levels according to safety factors [50] (Figure 7 and Table 3).
According to Figure 7a, the distribution areas of extremely unstable areas, unstable areas, basically stable areas, stable areas, and extremely stable areas in the natural state accounted for 0.84%, 3.08%, 13.82%, 14.86%, and 49.32% of the total study area, respectively. The number of landslides in extremely unstable areas and unstable areas accounted for 10.96% of the total number of landslides in the study area and was mainly distributed in the north of Bangxin town, Zamu town, and the east of Gedang town.
In an extremely heavy rainfall scenario with a 100-year recurrence cycle, the extremely unstable and unstable areas of landslide increase significantly compared with the natural state and are mainly distributed in the areas with large topographic height differences, such as both sides of the Bangxin–Zhamu section highway and the Gedang section. The Beibeng–Lhoba ethnic town section is relatively stable, with only sporadic potential landslides. According to Figure 7b–d, compared with the results of slope stability under natural conditions, the calculation results of the T-S model show that the unstable area increases significantly with the increase of rainfall time. According to the statistical results in Table 3, with the continuation of rainfall, the distribution range of unstable and extremely unstable areas increases significantly, and the proportion of landslide points gradually increases. After 1 h of rainfall, the predicted extremely unstable and unstable areas accounted for 7.54% of the total study area. After 4 h of rainfall, the predicted extremely unstable and unstable areas accounted for 13.97% of the total area, and there were 11 landslide points in the area, accounting for 15.07%. After 12 h of rainfall, landslide response to rainfall was obvious. The predicted extremely unstable and unstable areas accounted for 43.40% of the total study area, and 49 landslide points accounted for 67.13%. It is mainly distributed on both sides of the Bangxin–Zamu section of the highway and the Gedang section. The section of Beibeng town and Lhoba ethnic town is relatively stable, with only scattered potential landslide areas.

4.2. Evaluation of Model Accuracy

In existing studies, the percentage of the number of historical landslide points in the total area of each stability grade is often used to evaluate the model performance [19], but the evaluation index is generally general and simple. In this study, the composite index %LRclass was introduced to evaluate the performance of landslide stability prediction results [20], and the formula for calculating the %LRclass index was as follows:
L R c l a s s = S A
% L R c l a s s = L R c l a s s i i = 1 n L R c l a s s i
where S is the percentage of the number of landslide points in the total number of landslides in each type of Fs and A is the percentage of the predicted area corresponding to each type of Fs to the total area. The evaluation of the %LRclass index is based on the Fs < 1 and Fs ≥ 1 scales. The method takes into account the landslides predicted by the model in both the Fs < 1 and Fs ≥ 1 scales. When the safety factor is less than one, the larger the index value, the better the prediction result of the model.
It can be seen from Table 3 that, in the natural state, the value of %LRclass in the unstable areas (Fs < 1) is 55.66%. In the case of extreme rainfall once in a hundred years, after 1 h, 4 h, and 12 h of rainfall, the %LRclass index in the unstable areas is above 50%, which is 56.70%, 52.17%, and 73.11%, respectively, indicating that the calculation results of landslide instability and the instability region based on the physical mechanism are basically corresponding to the distribution of historical shallow landslides, indicating that the coupling model and parameter values adopted in this study are relatively reasonable.

5. Discussion

In order to further evaluate the accuracy of the TRIGRS and T-S three-dimensional coupling model in predicting the stability of a rainfall-induced landslide, the results of the T-S model and the TRIGRS model were analyzed and compared. In the scenario of once-in-a-century heavy rainfall, the spatial distribution of landslide stability predicted by the two models, the proportion of historical landslides in each stability area, the proportion of area, and the %LRclass index are shown in Figure 8 and Table 4.
Figure 8c,f show that 12 h after rainfall in the 100-year rainfall recurrence cycle, the proportion of extremely unstable areas calculated by the TRIGRS model and the T-S coupling model is 28.01% and 22.09%, respectively, which significantly increases compared with natural conditions, indicating that rainfall is a significant inducible factor affecting the temporal and spatial distribution of shallow landslides in this region. Figure 8a,d shows that the potential landslide instability areas predicted by the TRIGRS model are more widely distributed, and the extremely unstable areas and unstable areas are distributed around the five highways, while the T-S coupling model is concentrated only in the Bangxin–Zamu section and in Gedang Township. According to the historical landslide distribution shown in Figure 1c, it can be seen that almost no landslide occurs in Dexing town and Lhoba ethnic town. Thus, the prediction accuracy based on the T-S coupling model is higher. As shown in Figure 8b,e, the number of landslides in unstable areas predicted by the TRIGRS model and the T-S coupling model accounted for 46% and 74% respectively, and the prediction results of the T-S coupling model were significantly better than those of the TRIGRS model. Compared with the natural condition, these values increased by 42.08% and 70.08%, respectively, indicating that the T-S coupled model is more sensitive to rainfall response. Figure 8c,f show that the TRIGRS model and the T-S coupling model account for 50.57% and 43.40% of the landslide instability area, respectively, indicating that the TRIGRS model is more insecure in predicting landslide stability. This is also consistent with the existing research results [2,51,52]. In addition, Table 4 shows that the %LRclass indexes of the TRIGRS model and the T-S three-dimensional coupling model are 45.50% and 78.80%, respectively, which also indicates that the T-S coupling model is significantly superior to the TRIGRS model.
By comparing the simulation results of the two models, it is found that the TRIGRS model has a simpler calculation process and more conservative prediction results for the spatial distribution of landslide stability, and the prediction accuracy is significantly lower than that of the T-S coupling model.
Figure 7 and Figure 8 show that the potential instability region predicted by the T-S coupling model presents a patchy distribution with smoother grade boundaries, while that predicted by the TRIGRS model presents a thin-strip scattered distribution. The main reason is that the T-S coupling model uses a spherical surface to cut the slope into a number of three-dimensional columns and considers the interaction between the columns, so the simulation instability area is more concentrated. However, in the TRIGRS model, each grid was calculated separately, and the safety factor of each grid was an independent value [13]. Therefore, the integrity of the calculation instability area was poor, and the overall distribution was thin and scattered. In general, both models have certain applicability in shallow rainfall-induced landslide prediction, and the simulated spatial distribution map of landslide stability under saturated conditions can be used as an effective support for geological disaster prevention and reduction. However, the over-simplification of the TRIGRS model makes it difficult to consider the three-dimensional spatial distribution of the actual slope structure, load, and sliding surface. Based on the longitudinal spatial stratification method of rock and soil mass, the T-S 3D coupling model and the volume search of sliding are more suitable for dealing with the landslide of complex terrain and can obtain more reasonable prediction results.
From the simulation results, it can be found that there is no historical landslide in a few extremely unstable and unstable areas. This is mainly because, on the one hand, since Scoops3D is a three-dimensional slope-stability analysis based on DEM, the resolution of DEM is an important parameter affecting the model results. According to previous studies, the higher the DEM resolution, the better the simulation effect. But, there will also be over-recognition [14,53,54,55]. The DEM selected in this study is the highest resolution among the current open-source DEM, so the above situation will occur. However, from the overall results of the simulation, most of the landslides in the study area are in the dangerous area predicted by the model, indicating that the coupling model and parameter values adopted in this study are relatively reasonable. On the other hand, a few areas predicted by the model to be unstable did not exhibit evidence of landslides during observation, potentially due to previous occurrences of shallow and small-scale landslides in these locations. However, as these landslides were situated along the highway, they were promptly cleared and treated. On-site observations can only determine recent landslide developments. Hence, no traces of landslides were detected. Similar phenomena have been documented in earlier studies [14,56,57] which requires further validation of the study area on both spatial and temporal scales at a later stage.

6. Conclusions

Based on remote-sensing interpretation and field investigation, the distribution characteristics and sliding-prone rock mass of shallow landslides along the Bomi–Motuo Highway were identified. A three-dimensional stability analysis of regional landslides along the Bomi–Motuo Highway under different rainfall scenarios was carried out based on the TRIGRS and Scoops3D coupled model (T-S model). The temporal and spatial distribution of potential rainfall landslides in this area is effectively predicted, and the reliability of the predicted results is also evaluated. The research results have important reference significance for risk identification and disaster reduction along the G559 Bomi–Motuo Highway.
(1) Seventy-three shallow landslides along the Bomi–Motuo Highway were investigated and cataloged. The slope structure along the highway is mainly composed of loose gravel soil on the upper part and a strong weathering layer of bedrock on the lower part. The sliding surface is mostly of a circular and plane type, and the main failure types are creep–tensile failure and flexural–tensile failure;
(2) Based on the T-S coupling model, it is predicted that the potential landslide (Fs < 1) along the Bomi–Motuo Highway in the natural state is scattered. The distribution area of extremely unstable and unstable areas accounts for 4.92% of the total area. In the case of extreme rainfall once in a hundred years, the proportion of instability area (Fs < 1) predicted by the T-S coupling model 1 h after rainfall is 7.74%, which is 1.57 times that of the natural instability area. The instability area (Fs < 1) accounted for 43.40% of the total area after 12 h of rainfall. The potential landslides were mainly distributed in the Bangxin–Zhamu section and the East Gedang section, and the predicted results are in good agreement with the actual landslide distribution;
(3) The TRIGRS model and the T-S coupling model are both suitable for predicting the temporal–spatial distribution of rainfall-induced shallow landslides, but the TRIGRS model has the problem of over-prediction. The instability area predicted by the T-S coupling model accounted for 43.30%, and 74% of historical landslide disaster points in the area were correctly predicted, which is more in line with the distribution characteristics of historical landslide disasters;
(4) In terms of rainfall response, the T-S coupling model shows higher sensitivity. The %LRclass (Fs < 1) index of the T-S coupling model is above 50% in different time periods, and its landslide prediction effect (%LRclass = 78.80%) is significantly better than that of the one-dimensional TRIGRS model (%LRclass = 45.50%) under a 12 h rainfall scenario.

Author Contributions

Methodology, J.M. and H.W.; Software, J.M. and H.W.; Investigation, J.M., X.M., L.J., Y.S., B.Z. and W.Z.; Writing—original draft, J.M. and X.M. All authors have read and agreed to the published version of the manuscript.

Funding

This work was supported by the project of In-Situ Stress Survey of Key Himalayan Tectonic Belt of China Geological Survey (DD20242395), Basic Research Funds of Chinese Academy of Geological Sciences (DZLXJK202106), and National Natural Science Foundation of China (42307266).

Data Availability Statement

Data available on request due to restrictions eg privacy or ethical. The data presented in this study are available on request from the corresponding author. The data are not publicly available due to the requirements of the project.

Acknowledgments

Thanks to the project team of Ground Stress Monitoring in the Milin—Chayu area of Southwest Tibet Border (DD20221644-4) for their work in geological disaster investigation and for providing basic data.

Conflicts of Interest

The authors declare that they have no known competing financial interests or personal relationships that could have appeared to influence the work reported in this paper.

References

  1. Li, Z. Analysis and Countermeasures of Tibet Trunk Highway’s Geological Disasters. Master’s Thesis, Chongqing Jiaotong University, Chongqing, China, 2011. [Google Scholar]
  2. He, J.; Qiu, H.; Qu, F.; Hu, S.; Yang, D.; Shen, Y.; Zhang, Y.; Sun, H.; Cao, M. Prediction of spatiotemporal stability and rainfall threshold of shallow landslides using the TRIGRS and Scoops3D models. Catena 2021, 197, 104999. [Google Scholar] [CrossRef]
  3. Ma, C.; Liu, Z. Horizontal displacements and stability analysis of infinite slopes under rainfall infiltration. Rock Soil Mech. 2007, 28 (Suppl. S1), 563–568. [Google Scholar]
  4. Montgomery, D.R.; Dietrich, W.E. A physically based mode far the topographic control on shallow landslides. Water Resour. Res. 1994, 30, 1153–1171. [Google Scholar] [CrossRef]
  5. Wu, W.M.; Sidle, R.C. A distributed slope stability model for sheep forested basins. Water Resour. Res. 1995, 31, 2097–2110. [Google Scholar] [CrossRef]
  6. Pack, R.T.; Tarboton, D.G.; Goodwin, C.N. The SINMAP approach to terrain stability mapping. In Proceedings of the 8th Congress of the International Association of Engineering Geology, Vancouver, BC, Canada, 21–25 September 1998; pp. 21–25. [Google Scholar]
  7. Iverson, R.M. Landslide triggering by rain infiltration. Water Resour. Res. 2000, 36, 1897–1910. [Google Scholar] [CrossRef]
  8. Baum, R.L.; Savage, W.Z.; Gout, J.W. TRIGRS-A Form Program Far Transient Rainfall Infiltration and Grid-Based Regional Slope-Stability Analysis, Version 2.0; Open-File Report; USGS: Lakewood, CO, USA, 2008. [Google Scholar]
  9. Rossi, G.; Catani, F.; Leoni, L.; Segoni, S.; Tofani, V. HIRESSS: A physically based slope stability simulator for HPC applications. Nat. Hazards Earth Syst. Sci. 2013, 13, 151–166. [Google Scholar] [CrossRef]
  10. Cho, S.E. Prediction of shallow landslide by surficial stability analysis considering rainfall infiltration. Eng. Geol. 2017, 231, 126–138. [Google Scholar] [CrossRef]
  11. Zheng, L.; Li, X.; Yao, J.; Yu, W. Dynamic prediction of spatiotemporal stability of potential landslides based on the TRIGRS and Scoops3D coupling model. J. Nat. Disasters 2023, 32, 199–210. [Google Scholar]
  12. Reid, M.E.; Christian, S.B.; Brien, D.L.; Henderson, S.T. Scoops3D Software to Analyze 3D Slope Stability throughout a Digital Landscape; USGS: Reston, VA, USA, 2015; pp. 1–218. [Google Scholar]
  13. Brien, D.L.; Reid, M.E. Modeling 3D Slope Stability of Coastal Bluffs Using 3D Ground-Water Flow, South-Western Seattle, Washington; U.S. Geological Survey: Reston, VA, USA, 2007; pp. 1–54. [Google Scholar]
  14. Xin, X.; Zhang, F. The application of three-dimensional deterministic models in predicting the stability of shallow loess landslides. J. Eng. Sci. 2018, 40, 397–406. [Google Scholar]
  15. Zhang, S.; Wang, F. Three-dimensional seismic slope stability assessment with the application of Scoops3D and GIS: A case study in Atsuma, Hokkaido. Geoenvironmental. Disasters 2019, 6, 9. [Google Scholar] [CrossRef]
  16. Zhuang, J.; Peng, J.; Wang, G.; Iqbal, J.; Wang, Y.; Li, W.; Xu, Q.; Zhu, X. Prediction of rainfall-induced shallow landslides in the Loess Plateau, Yan’an, China, using the TRIGRS model. Earth Surf. Proc. Land. 2017, 42, 915–927. [Google Scholar] [CrossRef]
  17. Weidner, L.; DePrekel, K.; Oommen, T.; Vitton, S. Investigating large landslides along a river valley using combined physical, statistical, and hydrologic modeling. Eng. Geol. 2019, 259, 105169. [Google Scholar] [CrossRef]
  18. Alvioli, M.; Lee, G.; An, H.U. Three-dimensional, time-dependent modeling of rainfall-induced landslides over a digital landscape: A case study. Landslides 2018, 15, 1071–1084. [Google Scholar]
  19. Yao, J.; Li, X.; Xu, R. Dynamic Identification of Three-dimensional Stability of Potential Landslides in a Typical Section of the Proposed Sichuan-Tibet Railway under Rainfall Conditions. J. Disaster Prev. Mitig. Eng. 2021, 41, 422–431. [Google Scholar]
  20. Tran, T.V.; Alvioli, M.; Hoang, V.H. Description of a complex, rainfall-induced landslide within a multi-stage three-dimensional model. Nat. Hazards 2022, 110, 1953–1968. [Google Scholar] [CrossRef]
  21. Qi, S.; Li, Y.; Song, S.; Lan, H.; Ma, F.; Li, Z.; Chen, X.; Cui, Z.; Zhang, L.; Liu, C. Analysis of engineering geological stability zoning and distribution of engineering disturbance hazards in the Qinghai Tibet Plateau. J. Eng. Geol. 2022, 30, 599–608. [Google Scholar]
  22. Qu, S.; Zhao, J.; Ding, X.; Xie, M.; Bu, F.; Wang, J.; Liao, Y. Discrete element simulation of rainfall induced shelving bedding landslides. J. Hydrogeol. Eng. Geol. 2016, 43, 120–126. [Google Scholar]
  23. Wu, C. Evaluation of Geological Hazard Risk Based on Geological Information System in Nyingchi Section of Sichuan-Tibet Railway. Master’s Thesis, Tibet University, Lhasa, China, 2021. [Google Scholar]
  24. Li, R. Study on the Microphysical Characteristics of Precipitation Mêdog, South-Eastern Tibetan Plateau. Master’s Thesis, Chinese Academy of Meteorological Sciences, Beijing, China, 2023. [Google Scholar]
  25. Claessens, L.; Heuvelink, G.B.M.; Schoorl, J.M.; Veldkamp, A. DEM resolution effects on shallow landslide hazard and soil redistribution modeling. Earth Surface Process. Landforms 2005, 30, 461–477. [Google Scholar] [CrossRef]
  26. Bui, D.T.; Tsangaratos, P.; Nguyen, V.-T.; Van Liem, N.; Trinh, P.T. Comparing the prediction performance of a Deep Learning Neural Network model with conventional machine learning models in landslide susceptibility assessment. Catena 2020, 188, 104426. [Google Scholar] [CrossRef]
  27. Sarma, C.P.; Dey, A.; Krishna, A.M. Influence of digital elevation models on the simulation of rainfall-induced landslides in the hillslopes of Guwahati, India. Eng. Geol. 2020, 268, 105523. [Google Scholar] [CrossRef]
  28. Liu, Q. Analysis And Assessment of Rock Slope Stability in Zha Mo Road of Tibet. Master’s Thesis, Xi’an University of Science and Technology, Xi’an, China, 2008. [Google Scholar]
  29. Gu, T.; Wang, J.; Lu, X.; Meng, Y. Characteristics and stability analysis of accumulations landslide No. 3 in Tuoba of Southeast Tibet. J. Nat. Disasters 2009, 18, 32–38. [Google Scholar]
  30. Dai, X.; Zhao, J.; Lai, Q.; Wan, X.; Chen, K.; Wang, D. Movement process and formation mechanism of rock avalanche in Chada, Tibet Plateau. Earth Sci. 2022, 47, 1932–1944. [Google Scholar]
  31. Jin, J.; Zhong, Y.; Lv, G. Coupled Field Analysis of Alluvial River Bank Seepage Under Rainfall Infiltration. In Industrial Architecture Magazine: Collected Papers of the 2022 Industrial Architecture Academic Exchange Conference; Industrial Construction Magazine: Beijing, China, 2022; pp. 1066–1070. [Google Scholar]
  32. Nan, K. Research on Engineering Geological Characteristics and Engineering Effects of Deep Overburden in an Airport Field Area on the Southern Edge of the Qinghai-Tibet Plateau. Master’s Thesis, Chengdu University of Technology, Chengdu, China, 2021. [Google Scholar]
  33. Tao, W. Study on Stability and Rainfall Threshold of Typical Sandy Soil Slope in G318 Bomi-Nyingchi Section. Master’s Thesis, Tibet University, Lhasa, China, 2022. [Google Scholar]
  34. Pei, X.; Li, J. Study on soil erosion characteristics of excavated slopes with different gravel grinding roundness on PAI-Mo highway, Tibet. J. Geol. Hazards Environ. 2022, 33, 1–11. [Google Scholar]
  35. Ma, S. The Distribution Characteristics and Hazard Assessment of Landslide Under Various Earthquake and Rainfall Scenarios. Ph.D. Thesis, Institute of Geology, China Earthquake Administration, Beijing, China, 2022. [Google Scholar]
  36. Tesfa, T.K.; Tarboton, D.G.; Chandler, D.G.; McNamara, J.P. Modeling soil depth from topographic and land cover attributes. Water Resour. Res. 2009, 45, 10438. [Google Scholar] [CrossRef]
  37. Salciarini, D.; Godt, J.W.; Savage, W.Z.; Conversini, P.; Baum, R.L.; Michael, J.A. Modeling regional initiation of rainfall-induced shallow landslides in the eastern Umbria Region of central Italy. Landslides 2006, 3, 181–194. [Google Scholar] [CrossRef]
  38. Pelletier, J.D.; Rasmussen, C. Geomarphically based predictive mapping of soil thickness in upland watershedls. Water Resour. 2009, 45, 1–15. [Google Scholar]
  39. Alvioli, M.; Baum, R.L. Parallelization of the TRIGRS model for rainfall-induced landslides using the message passing interface. Environ. Model. Softw. 2016, 81, 122–135. [Google Scholar] [CrossRef]
  40. Viet, T.T.; Lee, G.; Thu, T.M.; An, H.U. Effect of digital elevation model resolution on shallow landslide modeling using TRIGRS. Nat. Hazards Rev. 2017, 18, 04016011. [Google Scholar] [CrossRef]
  41. Li, K. Research on the Stability of Road Slope Base on RBF Neural Network—Take the Shallow Slope of the K85 Section in Xia Bi Road of Tibet for Example. Master’s Thesis, Chang’an University, Chang’an, China, 2010. [Google Scholar]
  42. Zhang, X.; Zeng, C.; Zhang, F.; Yang, Z. Spatial Distribution of Soil Saturated Hydraulic Conductivity and Soil Bulk Density in a Typical Catchment in Southeast Tibet. J. Soil Water Conserv. 2012, 28, 69–73. [Google Scholar]
  43. Cen, X.; Xiao, X.; Cai, G.; Yang, S.; Zhang, J.; Wang, X.; Huang, Y. Experimental study on rainfall and discharge under the change of hydraulic gradient. Hydropower 2016, 42, 7–11. [Google Scholar]
  44. Li, K.; Zhang, M.; Xing, A. Process simulation and movement characteristics analysis of landslide debris flow in Sedongpu gully of the Yarlung Zangbo River. Chin. J. Geol. Hazard Control 2021, 32, 18–27. [Google Scholar]
  45. Deng, M.; Chen, N.; Wang, T.; Ding, H. The fluctuation of daily rainfall extremes in southeastern Tibet. J. Nat. Disasters 2017, 26, 152–159. [Google Scholar]
  46. Sun, D.; Zhang, Z.; Gao, Y.; Chen, B. Determination of basic parameters of SWCC for clayer soils. J. Shanghai Univ. 2019, 25, 957–964. [Google Scholar]
  47. Sun, D. Mechanical properties and constitutive model of unsaturated soil. Chin. J. Geotech. Eng. 2023, 45, 1–23. [Google Scholar]
  48. Peng, F.; Sun, D.A.; Yao, Y.; Tan, Y. Effect of granular structure and initial suction on shear strength of GMZ bentonite for deep geological disposal. Appl. Clay Sci. 2024, 249, 107249. [Google Scholar] [CrossRef]
  49. Wen, J. Regional rainfall landslide risk assessment based on Scoops 3D and TRIGRS Models—Taking a typical location in Wudu District, Longnan as an Example. Master’s Thesis, China University of Geosciences, Beijing, China, 2019. [Google Scholar]
  50. Teixeira, M.; Bateira, C.; Marques, F.; Vieira, B. Physically based shallow translational landslide susceptibility analysis in Tibo catchment, NW of Portugal. Landslides 2014, 12, 455. [Google Scholar] [CrossRef]
  51. Huang, C.C.; Tsai, C.C. New method for 3D and asymmetrical slope stability analysis. J. Geotech. Geoenviron. Eng. 2000, 126, 917–927. [Google Scholar] [CrossRef]
  52. Chakraborty, A.; Goswami, D. State of the Art: Three dimensional (3D) slope stability analysis. Int. J. Geotech. Eng. 2016, 10, 493–498. [Google Scholar] [CrossRef]
  53. Tarolli, P.; Tarboton, D.G. A new method for determination of most likely landslide initiation points and the evaluation of digital terrain model scale in terrain stability mapping. Hydrol. Earth Syst. Sci. 2006, 10, 663–677. [Google Scholar] [CrossRef]
  54. Mahalingam, R.; Olsen, M.J. Evaluation of the influence of source and spatial resolution of DEMs on derivative products used in landslide mapping. Geomat. Nat. Hazards Risk 2016, 7, 1835–1855. [Google Scholar] [CrossRef]
  55. He, S. Evaluation of Slope Stability in Northeastern Margin of Tibetan Plateau Based On Scoops3D Model—A Case Study of Jiajiagou. Master’s Thesis, Northwest University, Xi’an, China, 2022. [Google Scholar]
  56. Borga, M.; Fontana, G.D.; Gregoretti, C.; Marchi, L. Assessment of shallow landsliding by using a physically based model of hillslope stability. Hydrol. Process. 2002, 16, 2833. [Google Scholar] [CrossRef]
  57. Zhang, J.S.; Xu, M.; Zhang, Q.; Jihong, Q.; Wang, Y.S.; Xia, Q. Estimating groundwater runoff modulus method based on remote sensing in mountainous areas of Southeast Tibet. Earth Sci. 2022, 47, 642–651. [Google Scholar]
Figure 1. Overview of the study area and the distribution of landslides. (a) The yellow area is the location of the Tibet Autonomous Region of China. (b) The yellow area is Nyingchi City and the red area is the study area. (c) Distribution of historical landslides along the highway.
Water 16 01207 g001
Figure 2. Typical landslides in the study area. (a) The typical small-scale shallow landslides; (b) landslide group; (c) weathered rock mass and gravelly soil.
Water 16 01207 g002
Figure 3. Spatial distribution of soil-layer thickness.
Water 16 01207 g003
Figure 4. P-III frequency curve.
Water 16 01207 g004
Figure 5. Scoops 3D model principles are (a) 3D columns generated by each grid; (b) 3D topography of the study area.
Water 16 01207 g005
Figure 6. Schematic diagram of TRIGRS model and Scoops3D model coupling.
Water 16 01207 g006
Figure 7. Calculation results of slope 3D stability under different disaster scenarios.
Water 16 01207 g007
Figure 8. Comparison of prediction results between TRIGRS model and T-S model.
Water 16 01207 g008
Table 1. Parameters of rock and soil mass.
Rock and Soil MassCohesion
c/kPa
Internal Friction Angle
φ/(°)
Unit Weight of Soil
γ/(kN/m3)
Unit Weight of Soil
γw/(kN/m3)
Saturated Soil Water Content
θs/%
Residual Soil Water Content
θr/%
Soil layer1025209.872.55
Bedrock weathering layer4540229.8383
Table 2. Stability grade.
Stability ClassificationSafety Factor RangeStability Partition
1Fs < 0.75Extremely unstable area
20.75 ≤ Fs < 1Unstable area
31 ≤ Fs < 1.25Basically stable area
41.25 ≤ Fs < 1.5Stable area
51.5 ≤ Fsextremely stable area
Table 3. Statistical table of slope-stability results.
Disaster
Scenarios
Safety FactorNumber
of Landslides
% of
Landslides
% of
Predicted Area
LRclass%LRclass
Natural stateFs < 0.7511.370.84
0.75 ≤ Fs < 179.598.081.2355.66
1 ≤ Fs < 1.251723.2913.82
1.25 ≤ Fs < 1.51216.4414.86
1.5 ≤ Fs3649.3262.390.9844.34
1 h rainfallFs < 0.7534.113.62
0.75 ≤ Fs < 145.483.921.2756.70
1 ≤ Fs < 1.253142.4725.42
1.25 ≤ Fs < 1.52939.7341.88
1.5 ≤ Fs68.2225.170.9743.30
4 h rainfallFs < 0.7579.595.54
0.75 ≤ Fs < 145.488.431.0852.17
1 ≤ Fs < 1.252838.3621.73
1.25 ≤ Fs < 1.52838.3639.2
1.5 ≤ Fs68.2225.10.9947.83
12 h rainfallFs < 0.752432.8822.09
0.75 ≤ Fs < 12534.2521.311.5573.81
1 ≤ Fs < 1.251317.8116.96
1.25 ≤ Fs < 1.5912.3328.36
1.5 ≤ Fs22.7414.060.5526.19
Table 4. Results of 1D and 3D coupling models in the study area.
Safety FactorNumber
of Landslides
% of
Landslides
% of
Predicted Area
LRclass%LRclass
3D1D3D1D3D1D3D1D3D1D
Fs < 15434744643.4050.571.710.9178.8045.50
Fs ≥ 11939265456.6049.430.461.0921.2054.50
Disclaimer/Publisher’s Note: The statements, opinions and data contained in all publications are solely those of the individual author(s) and contributor(s) and not of MDPI and/or the editor(s). MDPI and/or the editor(s) disclaim responsibility for any injury to people or property resulting from any ideas, methods, instructions or products referred to in the content.

