Article

The Enhanced Adsorption Capacity of Ziziphus jujuba Stones Modified with Ortho-Phosphoric Acid for Organic Dye Removal: A Gaussian Process Regression Approach

1
Laboratoire de Génie des Procédés Chimiques, Département de Génie des Procédés, Faculté de Technologie, Université Ferhat Abbas, Sétif-1, Sétif 19000, Algeria
2
Laboratory of Biomaterials and Transport Phenomena (LBMTP), University Yahia Fares, Médéa 26000, Algeria
3
Univ Rennes, Ecole Nationale Supérieure de Chimie de Rennes, CNRS, ISCR—UMR6226, 35000 Rennes, France
4
School of Engineering, Merz Court, Newcastle University, Newcastle upon Tyne NE1 7RU, UK
5
Chemistry Department, College of Science, Imam Mohammad Ibn Saud Islamic University (IMSIU), Riyadh 11623, Saudi Arabia
6
College of Engineering, Imam Mohammad Ibn Saud Islamic University (IMSIU), Riyadh 11432, Saudi Arabia
*
Author to whom correspondence should be addressed.
Water 2024, 16(9), 1208; https://doi.org/10.3390/w16091208
Submission received: 18 March 2024 / Revised: 17 April 2024 / Accepted: 20 April 2024 / Published: 24 April 2024
(This article belongs to the Section Wastewater Treatment and Reuse)

Abstract

:
Here, the chemical modification of Ziziphus jujuba stones (ZJS) treated with ortho-phosphoric acid (ZJS-H3PO4) is investigated to enhance its adsorption properties for organic dyes. The physicochemical properties of ZJS-H3PO4 reveal increased porosity (87.29%), slightly higher bulk density (0.034 g mL−1), and enhanced acidity (31.42 m eq g g−1) compared to untreated ZJS. XRF analysis confirms the successful incorporation of orthophosphoric acid during treatment due to a significant increase in phosphorus content. The maximum adsorption capacity of methylene blue on ZJS-H3PO4 is found to be 179.83 mg g−1, demonstrating its efficacy as a potential adsorbent for organic dyes. These findings suggest that modifying ZJS with orthophosphoric acid could be a promising strategy to enhance its adsorption performance in various environmental applications. Furthermore, Gaussian process regression (GPR) is employed to model MB adsorption by ZJS-H3PO4. Optimization of the GPR model involves evaluating different kernel functions and meticulously adjusting parameters to maximize its ability to capture complex relationships in the data. The obtained GPR model demonstrates remarkable performance with high correlation coefficients (R) and low root mean square errors (RMSEs) across all study phases. Model validation is performed through residual analysis, confirming its effectiveness and accuracy in predicting MB adsorption. Finally, a user-friendly interface is developed to facilitate the usage of the GPR model in future applications, representing a significant advancement in environmental process modeling and ecosystem management.

1. Introduction

Over the past decade, biosorbents have found widespread application in various sectors. They are utilized for the removal of dyes from textile effluents [1,2], treating wastewater from the pharmaceutical industry [3,4], and eliminating toxic metal ions [5,6]. These materials are favored for their low cost, natural availability, porous structure, vast active sites, and abundance of different hetero-elements, including O, N, S, and Fe [7]. Statistics indicate that global dye production amounts to approximately 100,000 types of dyes, with an annual output ranging from 7 × 10⁵ to 1 × 10⁶ tons [8]. Alarmingly, 2% of this yearly production is directly discharged into aqueous effluents [5]. These synthetic dyes, notorious for their toxicity and poor biodegradability, not only contaminate water but also impart coloration, posing a significant environmental challenge that needs resolution. Consequently, various techniques, such as coagulation and flocculation [9,10,11,12], chemical oxidation [13,14,15], filtration [16,17,18], photodegradation [19,20,21,22,23], electrochemistry [24,25,26,27], and adsorption [28,29,30], have been employed for wastewater treatment to ensure its purification before discharging into natural ecosystems or reuse. Each method presents distinct advantages and drawbacks in terms of efficiency, cost, and environmental impact. However, due to its effectiveness, low cost, simple design, and ease of implementation, biosorption stands out as the most efficient technique meeting the rejection criteria [31].
In recent years, many researchers have focused on exploring new adsorbents derived from natural materials as alternatives to those commonly used in water treatment. These materials are more cost-effective, readily available, and the subject of extensive research. Consequently, numerous studies have investigated the removal of various pollutants using different precursors. Examples include the biosorption of Congo red on Jujuba seeds [32], the removal of cationic dyes onto raw peach shell [33], and the removal of rhodamine B (RhB), methylene blue, brilliant green, crystal violet and orange G from aqueous solutions using activated carbon derived from tea leaves [34]. Additionally, the biosorption of methylene blue using nut shells has been investigated [35].
This study aims to produce a cost-effective adsorbent from biomass by utilizing local by-products and considering economic and environmental factors. Ziziphus jujuba stones, abundant in northern Algeria, were chosen as biosorbent preparation precursors. These stones underwent chemical treatment with ortho-phosphoric acid. They were subsequently characterized using scanning electron microscopy (SEM), Fourier-transform infrared spectroscopy (FTIR), X-ray fluorescence (XRF), and thermogravimetric analysis (TGA). The performances of the prepared material (ZJS-H3PO4) were evaluated through methylene blue (MB) biosorption, serving as a model for cationic dyes [36]. Furthermore, the study examined the effects of pH, initial concentration, contact time, temperature, the presence of salts, and humic acids on biosorption efficiency.
MB was chosen to gauge the adsorption capacity of ZJS-H3PO4 due to its stability across a wide pH range, making it challenging for degradation, and its notable solubility in water (40 g/L). It finds widespread use in different industrial sectors, including textiles, medicine, and biology [37]. However, it is important to note that this type of dye can pose significant risks. Direct eye contact can result in permanent damage, while inhalation may lead to respiratory difficulties. Ingestion of MB may cause symptoms such as nausea, vomiting, and methemoglobinemia [38]. Furthermore, MB serves as a benchmark dye for evaluating and comparing the performance of adsorbents.
As is well known, many researchers have traditionally employed classical models such as Freundlich, Langmuir, Redlich–Peterson, and Temkin to model the adsorption isotherm of different systems. Unfortunately, these models offer limited interpretations and fail to provide a deeper understanding of the adsorption process [39]. In light of this limitation, experimental findings were subsequently correlated with various statistical physics models based on the grand canonical ensemble to enrich the understanding of the biosorption process and glean innovative physicochemical insights at the molecular level [40,41]. These models encompassed the monolayer model, the double layer with one energy, the double layer with two energies, and limited multilayer models. It was anticipated that these models would offer deeper insights into the fundamental mechanisms of biosorption.
The novelty of this study lies in the innovative approach of exploring the modification of Ziziphus jujuba stones using ortho-phosphoric acid to enhance their capacity for adsorbing organic dyes. This research offers a comprehensive methodology for evaluating the physicochemical properties of the modified material, ZJS-H3PO4, highlighting increased porosity, optimized bulk density, and enhanced acidity compared to untreated samples. Additionally, detailed elemental composition analysis confirms the successful incorporation of ortho-phosphoric acid during treatment. The highlight of this study is the precise determination of the maximum amount of MB adsorbed on ZJS-H3PO4, thus demonstrating its remarkable effectiveness as a potential adsorbent for organic dyes. By employing Gaussian process regression (GPR) to model methylene blue adsorption, this research brings about a significant methodological advancement, enabling accurate and reliable modeling of the modified adsorbent’s performance. Finally, a user-friendly interface for predicting MB absorption by ZJS-H3PO4 is developed, opening up new avenues for environmental research and water resource management.

2. Materials and Methods

2.1. Materials

The Ziziphus jujuba stones (ZJS) used in this study were collected from forests in the town of Setif, located in northeastern Algeria. All chemicals, including MB dye (C16H18N3SCl), sodium hydroxide (NaOH) with a purity of 98.8% (w/w), hydrochloric acid (HCl) with a concentration of 35% (w/w), sodium chloride (NaCl) with a purity of 95% (w/w), humic acid (HA) with a purity of 99.9% (w/w), and ortho-phosphoric acid (H3PO4) with a concentration of 85%, were purchased from Sigma Aldrich (Saint Louis, MO, USA).
MB is a basic cationic dye with a chemical formula of C16H18N3SCl and a molar mass of 319.85 g mol−1. Its solubility is about 40 g L−1 at 20 °C and it has a pKa of 3.8. The structure of MB shown in Figure S1 was obtained using the Avogadro software V1.1.
The MB solutions were prepared from a stock solution of 1000 mg L−1, from which dilute solutions at the desired concentrations were prepared. The pH adjustment was performed either by adding HCl or NaOH.

2.2. Adsorbent Preparation

In a novel approach to valorize local by-products, the Ziziphus jujuba stones (ZJS) were used to prepare the adsorbent material. The stones were crushed and sieved to obtain a powder, which was washed several times with tap water and then with distilled water to remove impurities, and finally dried at 50 °C for 24 h before undergoing treatment.
Acids, such as ortho-phosphoric acid, hydrochloric acid, and formic acid, are beneficial agents for preparing and modifying biosorbents [42,43,44]. The protocol used in this work is straightforward: mixing 1 g of the ZJS powder with 1 g of the solution of H3PO4 (1 M) and keeping them stirred with a magnetic stirrer for 24 h at room temperature. The mixture was dried in an oven at 50 °C for 48 h. The product obtained was crushed for the second time, sieved, and then washed with distilled water until a near-neutral pH was achieved. The product was dried at 50 °C and then crushed and sieved for the last time. The obtained particles in the 0.2 to 0.4 mm range were stored in a desiccator and then used in the biosorption tests under the abbreviation ZJS-H3PO4. This approach of preparation was inspired by the process of preparation of activated carbons, and the drying was carried out three times to induce the creation of pores.

2.3. Biosorption Study

All biosorption experiments were carried out in a batch system at a well-controlled temperature of 25 ± 2 °C, with a constant stirring speed of 250 rpm. By measuring the optical density, the initial and final concentrations were calculated using a spectrophotometer (Shimadzu Spectrophotometer UV VIS 1700, Kyoto, Japan).
The evolution of the adsorbed quantity of MB onto ZJS-H3PO4 as a function of time was studied at different initial concentrations of MB (50 to 150 mg L−1), and the adsorbed amounts of MB on ZJS-H3PO4 were calculated according to the following relationship [45]:
Q t = C 0 C t × V m
where Qt is the quantity adsorbed at time t (mg g−1), C0 is the initial concentration of the MB solution (mg L−1), Ct is the residual concentration at the instant t (mg L−1), V is the volume of the aqueous solution (L) and m is the mass of ZJS-H3PO4 (g).

2.4. Characterization

The total acidity or basicity of ZJS-H3PO4 and ZJS materials was determined using the Boehm titration method [46]. Acidic groups were neutralized by adding 50 mL of NaOH (0.5 M) to 500 mg of each material. After 24 h of stirring, the solution was filtered, and the remaining NaOH was titrated with a 0.5 M HCl solution. Similarly, basic groups were neutralized with a 0.5 M HCl solution, and the excess acid was titrated using a 0.5 M NaOH solution. To ensure precision, each experiment was repeated three times.
The porosity of the materials was evaluated using a straightforward protocol. Initially, a dry volume of 1 mL of powder was placed into a test tube, followed by adding methanol to a total volume of 4 mL. Subsequently, the sample was gently shaken until the air bubbles disappeared, ensuring all pores were filled with methanol. At this point, the volume of methanol remaining in the test tube corresponded to the volume of the non-porous parts of the powder. In contrast, the amount of methanol absorbed represented the total porosity of the powder.
Infrared analyses were conducted using an Agilent Technologies Fourier-transform infrared spectrometer (FTIR), specifically the Cary 600 series FTIR spectrometer, controlled by a microcomputer. The study covered a wavelength range of 400–4000 cm−1. FTIR spectroscopy was utilized to aid in the identification and characterization of functional groups present on the adsorbent surface, providing crucial insights into the molecular interactions between methylene blue and the adsorbent.
The XRD patterns were obtained by a powder X-ray diffractometer, PW3071/xx Bracket, using a copper anticathode with a Kα radiation and λ = 1.5405 A. This apparatus operates under a voltage of 45 kV and an intensity of 35 mA. The recordings were made throughout values of angle 2θ varying from 4 to 90 degrees, in steps of 0.02 degrees, with a counting time of 6.985 s per step. X-ray diffraction was employed to examine the effect of acid treatment on the crystalline structure of the adsorbent.
The micromorphology of ZJS-H3PO4 was examined by scanning electron microscopy images obtained from Hitachi S-3000N. Thermogravimetric analysis (TGA) of ZJS and ZJS-H3PO4 was conducted using SDT Q600 V20.9 Build 20 thermal gravimetric equipment. The analysis covered a temperature range from 30 to 890 °C. TGA was employed to meticulously examine mass evolution for ZJS and ZJS-H3PO4 under varying temperatures. Moreover, the elemental analysis X-ray fluorescence (XRF) was realized by a ZSX Primus IV-Rigaku device.
The significance of the adsorbent’s surface charge cannot be overstated in adsorption studies. This phenomenon is particularly evident due to the pH’s dual impact on the material’s surface charges and on the distribution of anions and cations. In this study, the influence of pH on the biosorption of MB onto ZJS-H3PO4 was investigated under the following conditions: 50 mL of a 100 mg L−1 MB solution was utilized, with initial pH values ranging from 2 to 12, adjusted by adding either 0.1 M HCl or 0.1 M NaOH. The experiments were conducted at 25 °C for 24 h with an agitation speed of 250 rpm, using 50 mg of ZJS-H3PO4.

2.5. Biosorption Isotherms

At the solid–fluid interface, molecules originating from the fluid phase may either bounce or settle on the solid surface during a specific time, resulting in excess on the solid surface. This corresponds to the biosorption phenomenon [47,48,49]. In this context, the biosorption isotherm is the curve linking the dye activity contained in a batch system to the amount of dye adsorbed on ZJS-H3PO4 at equilibrium.
To conduct isotherm tests, 50 mL of various concentrations of MB ranging from 50 to 500 mg L−1 were mixed with 50 mg of ZJS-H3PO4. Subsequently, these mixtures were agitated for 24 h under the specified conditions (i.e., in a batch system, maintained at a well-controlled temperature of 25 ± 2 °C, at the optimal pH, and with a constant stirring speed of 250 rpm) until reaching equilibrium. Following this, the mixtures underwent centrifugation, and the resulting supernatants were analyzed using visible UV spectroscopy at a wavelength of λ = 664 nm. The quantities of adsorbed dye were then determined using Equation (1).

2.6. Modeling the Equilibrium

To comprehend the reaction mechanism and appropriately describe the biosorption process, correlations between the adsorbed quantity and the initial concentration of MB were examined using both the Langmuir and Freundlich models (2-parameter models), as well as the Sips and Redlich–Peterson models (three-parameter models).
As is well known, in a biosorption phenomenon, if the surface of the solid can be considered homogeneous, the Langmuir model can be applied. This model is based on the assumption of the similarity of the active sites with independent energies, where biosorption occurs in a monolayer without lateral interactions or steric hindrance between the adsorbed molecules [50]. The Langmuir equation is as follows [51,52]:
Q e / Q m = K L C e / ( 1 + K L C e )
where Qe and Ce are the adsorbed quantity and the equilibrium concentration, respectively, in (mg g−1) and (mg L−1), Qm is the constant that expresses the recovery of the complete monolayer (mg g−1), and KL is the constant of equilibrium biosorption (L mg−1), which is related to the apparent energy of biosorption.
To determine whether the Langmuir modeling is favorable or not, a dimensionless separation factor with the abbreviation RL is calculated using Equation (3) proposed by Weber and Chakravorti [53]:
R L = 1 / 1 + K L C 0
In Equation (3), KL is the Langmuir equilibrium constant (L mg−1) and C0 is the initial concentration (mg L−1).
Among the most widely used models, the oldest is the Freundlich model, which describes a non-ideal and reversible biosorption process. This empirical model is based on forming a multilayer adsorbate with a non-uniform distribution, reflecting the heterogeneity of the solid surface and, hence, the affinity between the adsorbent and adsorbate [50,54]. Freundlich’s empirical Equation is defined as follows [50,51]:
Q e = K F C e 1 / n
where Qe and Ce are the adsorbed quantity and the equilibrium concentration, respectively, in (mg g−1) and (mg L−1), KF is the equilibrium constant or also the Freundlich parameter (mg L g−1), and the exponent 1/n is defined as the biosorption capacity, which indicates the heterogeneity of the surface.
In addition to two-parameter models, three-parameter models were also employed, such as the Redlich–Peterson model [55], representing a compromise between the previously mentioned models. It is described by Equation (5):
Q e = K R P C e / ( 1 + α C e β )
where KRP (L g−1) and α (L mg g−1) are model constants, and β is the exponent, reflecting the surface’s heterogeneity.
The adsorbate concentration plays a crucial role in the Redlich–Peterson model. When the concentration is high, the model tends to resemble the Freundlich model, while at low concentrations, it approaches the Langmuir model [50,56].
Our experimental results were also tested by another three-parameter model proposed by Sips [45,50]:
Q e / Q m = ( K S C e ) m s / ( 1 + K S C e m s )
where Qm, KS, and ms are the system’s biosorption capacity (mg g−1), the biosorption affinity constant (L mg−1), and the system heterogeneity index, respectively.

2.7. Modeling the Biosorption Kinetics

In the study of biosorption kinetics for MB onto ZJS-H3PO4, various nonlinear models, including the pseudo-first-order, pseudo-second-order, pseudo-nth-order, and the intra-particle diffusion models, were employed to elucidate the mechanism processes and provide additional information.
The pseudo-first-order equation proposed by Lagergren and Sven in 1898 [57] is given in the following form:
d Q t / d t = K 1 ( Q e Q t )
where Qe is the amount adsorbed at equilibrium (mg g−1), Qt is the quantity adsorbed at time t (mg g−1), and K is the rate constant (min−1).
The model in Equation (7) can be extended to the nth order according to Equation (8):
d Q t / d t = K ( Q e Q t ) n
The integration of Equation (8) under the conditions (Q = 0 to Q = Qt and t = 0 to t = t) at the boundaries leads to pseudo-first-order and pseudo-second-order models according to the relations (9) and (10), respectively:
If n = 1, then the integration leads to the pseudo-first-order model according to Equation (9):
Q t = Q e ( 1 e K 1 t )
And if n = 2, the integration leads to the pseudo-second-order model in the following form:
Q t = K 2 Q e 2 t / ( 1 + K 2 Q e t )
where t is the contact time (min), Qt and Qe are the quantities adsorbed at time t and equilibrium, respectively (mg g−1), and K2 is the pseudo-second-order biosorption rate constant (g mg−1 min−1).
To model the experimental data, Ozer [58] used the nth-order model for the determination of the rate constant and the order of the reaction of the kinetics data without setting a priori the value of n by integrating Equation (8), leading to the following formula:
Q t = Q e n 1 K n t + Q e ( 1 n ) 1 / ( 1 n )
In this case, Kn is a rate constant and n is the sorption reaction order about the actual concentration.
The intraparticle diffusion model, proposed by Weber and Morris [59] and commonly used in the literature, was also applied. In this model, the adsorbed quantity varies almost proportionally with t0.5 according to Equation (12) [32,59]:
Q t = K i d t 0.5 + C
where Qt is the quantity adsorbed at time t, C is the intersection that expresses the thicknesses of the boundary layers, and kid (mg g−1 min−0.5) is the rate constant of intraparticle scattering.

2.8. Statistical Models

In this section, four statistical models based on the grand canonical ensemble in statistical physics were employed. Various research teams have utilized and refined these models, all striving to attribute a physical significance to the constants inherent in each model. These constants include the number of MB molecules adsorbed per site (n), the density of the receptor sites (nm), the half-saturation concentration (C1/2), and the molar biosorption energy (∆Ea). The ultimate objective is to advance comprehension of the biosorption mechanism by attaining novel physico-chemical interpretations of the biosorption process at the molecular level [31,32,49,50]. In this context, the monolayer, double layer with one energy, double layer with two energies, and the limited multilayer models were considered.
The monolayer model, widely employed in the literature, incorporates the potential occurrence of lateral interactions among adsorbed molecules [60,61] and is given by Equation (13)
Q = Q 0 1 + C 1 2 C n m
In Equation (13), Q0 is the number of adsorbed molecules per site (n) multiplied by the density of the receptor site (nm), and C1/2 is the concentration at half saturation.
The second statistical model applied in this paper is the double layer with one energy [62]. In this model, it is assumed that biosorption takes place across two layers with identical energy, where the amount adsorbed varies with concentration according to the following equation:
Q = Q 0 C C 1 / 2 n m + 2 C C 1 / 2 2 n m 1 + C C 1 / 2 n m + C C 1 / 2 2 n m
where C1/2 is the concentration at half saturation.
Our experimental results were also subjected to analysis using another model known as the double layer with two energies. This model operates under the assumption that the energy of the first and second adsorbed layers are not identical and, specifically, the energy of the second layer is lower than that of the first layer [61]. The empirical equation of this model is given as follows [62]:
Q = Q 0 C C 1 n m + 2 C C 2 2 n m 1 + C C 1 n m + C C 2 2 n m
where C1 is the concentration at half saturation for the first layer and C2 is the concentration at half saturation for the second layer.
Another model employed in this paper is the limited multilayer model. This model operates under the assumption that biosorption takes place in multiple layers, with the biosorption energy of molecules in the first layer being higher than that of the second layer, and so forth [61]. The amount of adsorbed dye in this model varies according to the following equation [61,63]:
Q = Q 0 C C 1 n m + 2 C C 1 n m C C 2 n m 1 C C 2 n m N 2 1 C C 2 n m N 2 C C 1 n m C C 2 n m C C 2 n m N 2 1 C C 2 n m + C C 1 n m C C 2 2 n m 1 C C 2 n m N 2 1 C C 2 n m 2 1 + C C 1 n m + C C 1 n m C C 2 n m 1 C C 2 n m N 2 1 C C 2 n m

2.9. Gaussian Process Regression

Gaussian process regression (GPR) is a powerful non-parametric approach for modeling intricate relationships among variables [64,65]. Unlike parametric models that impose specific data structures, GPR makes no assumptions about the underlying distribution [31]. Instead, it treats data as samples from a Gaussian process, where each point is regarded as a random variable [64,65]. The relationship between these points is characterized by a covariance matrix encoding similarities among observations [31]. By fitting this covariance matrix to training data, GPR can estimate a continuous function that best captures the relationship between variables. The operation of GPR revolves around modeling the distribution of possible functions that could generate the observed data [31]. This result is achieved using Gaussian processes, where a mean and covariance define each function. By adjusting these parameters to fit the training data, the model can generalize and provide reliable predictions for new observations [31]. A significant advantage of GPR is its ability to provide probabilistic predictions [31]. Unlike many other regression models, GPR gives an estimate of the expected value for a target variable and a measure of the uncertainty associated with this prediction. This capability is crucial in many fields where decision-making relies on accurate assessment of risk and uncertainty [31].
Moreover, GPR is exceptionally flexible and can be effectively used for datasets of moderate to large sizes. It offers smooth data interpolation without requiring explicit specification of the underlying function, making it suitable for various applications in sciences, engineering, and economics. In summary, GPR is a valuable tool for modeling complex relationships, providing accurate predictions and rigorous uncertainty estimation [64,65].
In this study, GPR was harnessed to construct a robust mathematical model aimed at predicting the adsorption capacity of MB by ZJS-H3PO4. Leveraging a comprehensive dataset, previously identified parameters, including the contact time (X1), the mass of the adsorbent (X2), initial dye concentration (X3), pH (X4), and temperature (X5), were optimized, with the adsorbed quantity serving as the fixed output variable. To ensure model robustness, the dataset was meticulously partitioned into three subsets: 70% for training, 15% for testing, and 15% for validation.
To identify the most suitable model, ten kernel functions, comprising exponential, squared exponential, Matern32, Matern52, rational quadratic, ARD exponential, ARD squared exponential, ARD Matern32, ARD Matern52, and ARD rational quadratic kernels, were thoroughly explored. Moreover, extensive efforts were invested in fine-tuning the parameters of each kernel function, including the kernel scale represented by [sigmaM, sigmaF], and sigma itself.
The performance of each model was rigorously assessed using the following two key performance metrics: the correlation coefficient (R) and root mean square error (RMSE), which were computed by applying the following equations [66,67]:
R = i = 1 N y exp y ¯ exp y p r e d y ¯ p r e d i = 1 N y exp y ¯ exp 2 i = 1 N y p r e d y ¯ p r e d 2
R M S E = 1 N i = 1 N y exp y p r e d 2
In the above equations, N is the number of data samples,  y exp  and  y p r e d  are the experimental and the predicted values, respectively, and  y ¯ exp  and  y ¯ p r e d  are the average values of the experimental and the predicted values, respectively [68].

3. Results and Discussions

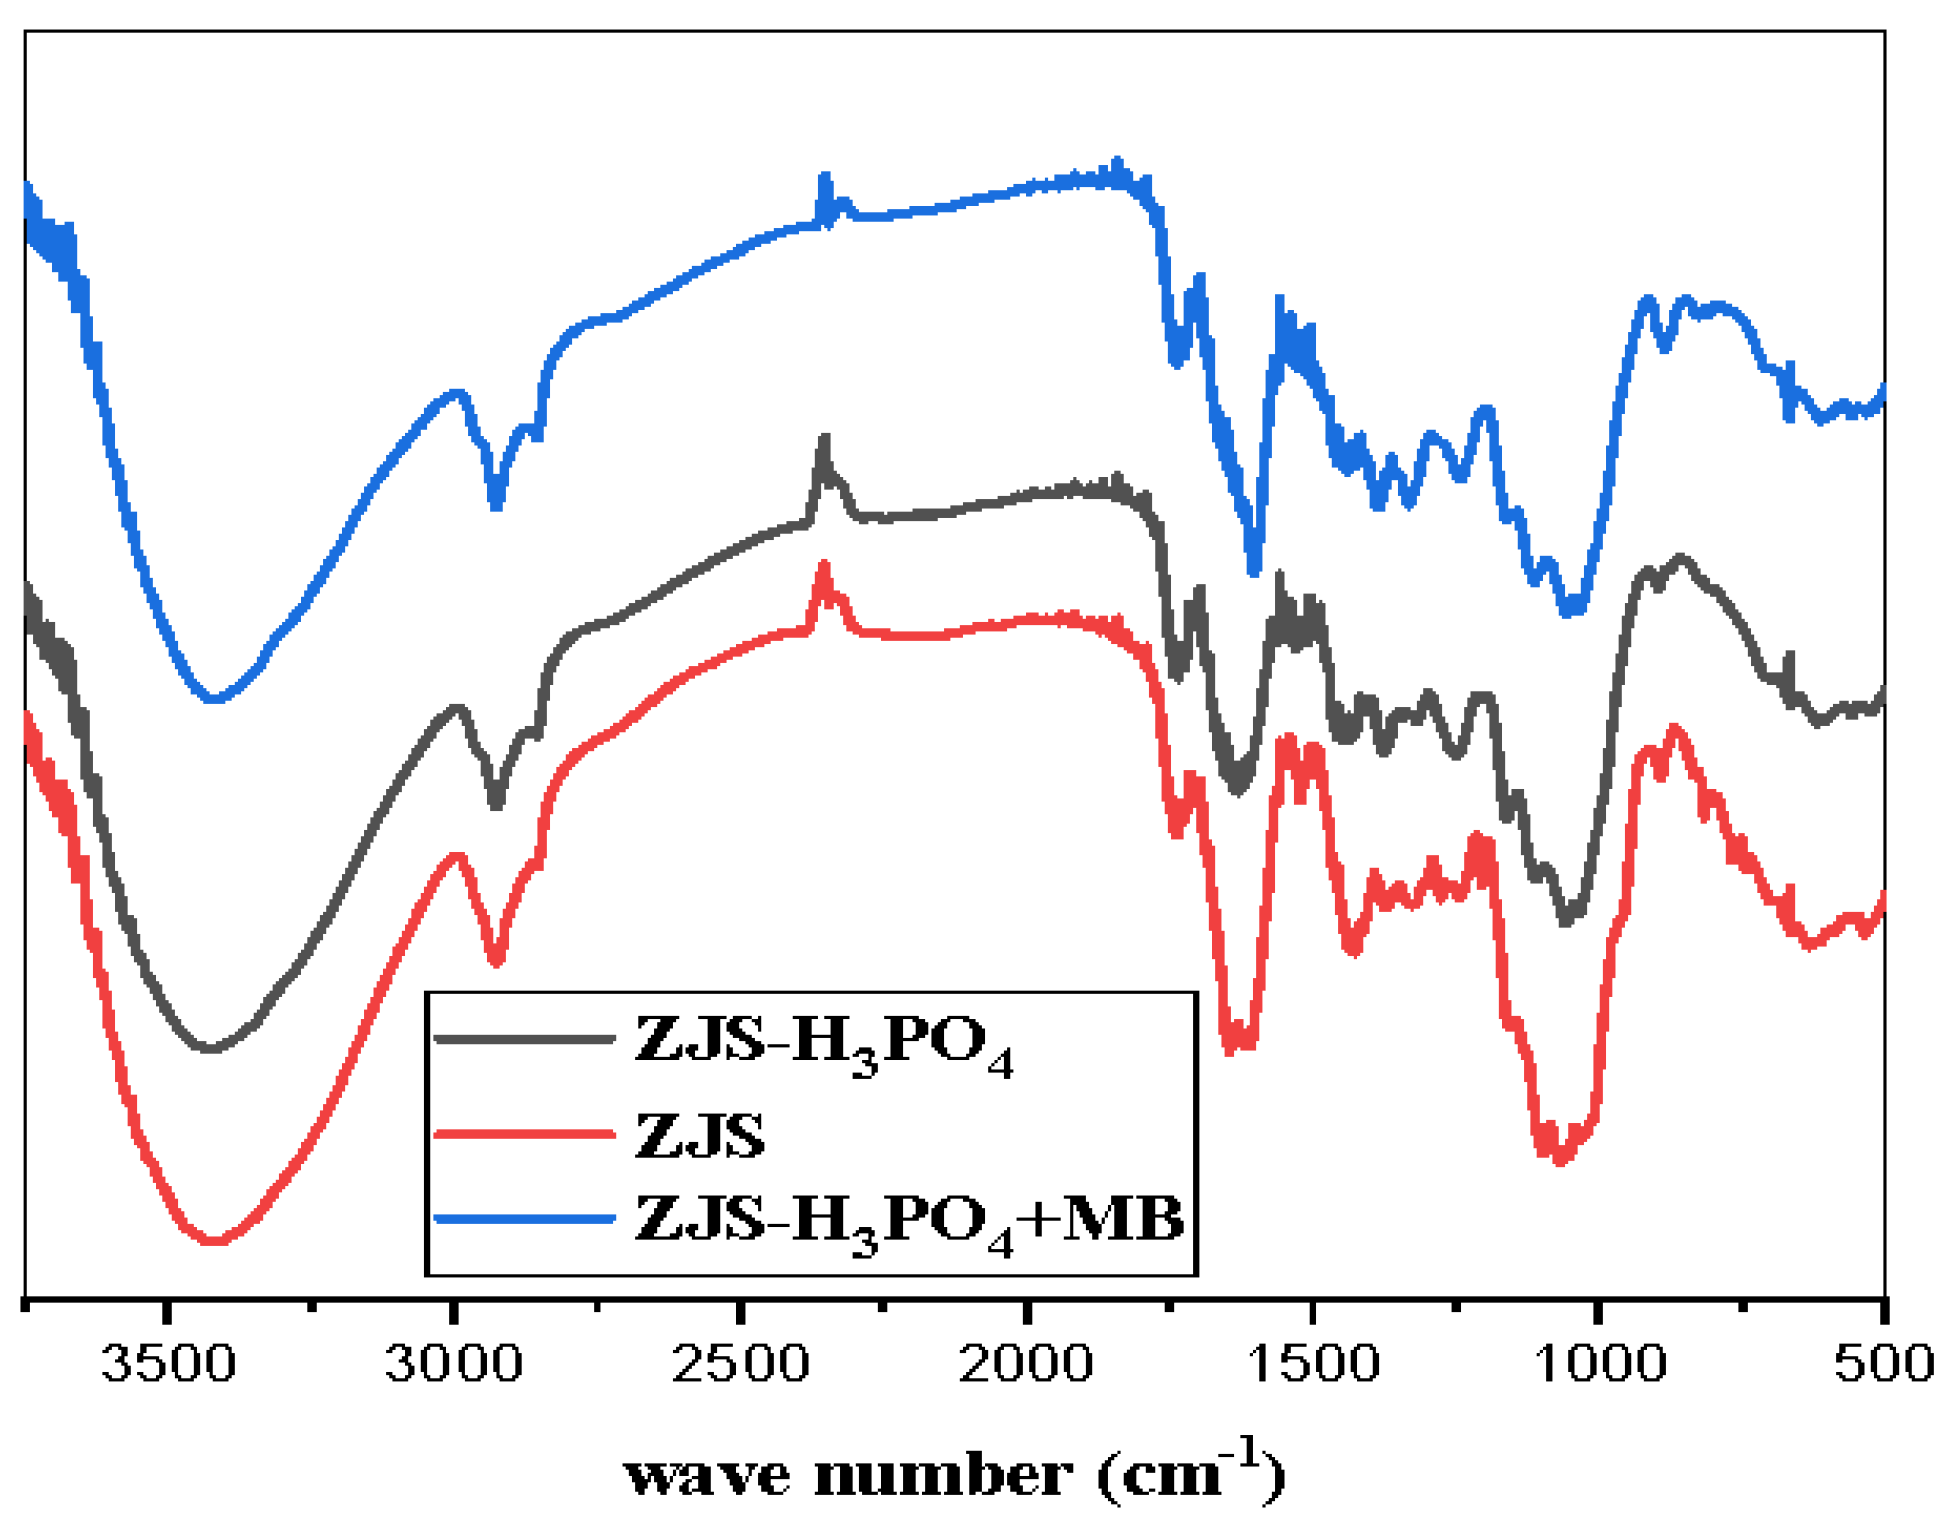
3.1. Material Characterization

Regarding the physicochemical characteristics of ZJS-H3PO4, some parameters, such as the zero-charge point (pHPZC), humidity, porosity, ash content, acidity, basicity, and bulk density, were determined. In this context, the XRF analysis was used to quantify the elemental composition of ZJS before and after treatment, and all the results obtained are summarized in Table 1.
The pHPZC is a dominant parameter for understanding the biosorption mechanism of MB onto ZJS-H3PO4. It corresponds to the point where the ZJS-H3PO4 has a zero-charge potential on its surface. It also gives an idea about the charge of the material surface based on the presence or the absence of H+ protons and OH ions.
Figure S2 shows the plot ΔpH as a function of the initial pHi, showing pHPZC values of approximately 6.8 for ZJS-H3PO4, which implies the following:
  • The material surface functional groups are protonated by excess H+ protons when the pH is below pHPZC.
  • The ZJS-H3PO4 surface functional groups are deprotonated by excess OH- ions in the solution when the pH exceeds pHPZC.
Table 1 shows that ZJS-H3PO4 had an acidic character compared to ZJS, owing to the presence of more acidic sites than alkaline sites. Table 1 also indicates that the porosity and apparent density after treatment were improved from 80.21 to 87.29% and 0.031 to 0.034 g mL−1, respectively. These improvements may be attributed to the integration of orthophosphoric acid into the material structure, where washing the final product to extract the incorporated acid led to creating extreme porosity.
The elemental composition analysis XRF indicates that carbon and oxygen were the main elements in ZJS-H3PO4. XRF also shows an increase in phosphorus due to the influence of ortho-phosphoric acid during treatment.
Fourier-transform infrared spectroscopy is a beneficial technique to determine the functional groups that are present on the surface of a material, allowing an improved understanding of the mechanism of MB biosorption onto ZJS-H3PO4, as well as the interactions between MB and ZJS-H3PO4. The FTIR spectra of ZJS, ZJS-H3PO4, and ZJS-H3PO4 after the biosorption of methylene blue (ZJS-H3PO4 + MB) are illustrated in Figure 1, showing very similar spectra for the three samples. The valence vibrations of the hydroxyl groups (carboxyl, phenol, or alcohol) and the adsorbed water are represented by the broadband located at 3421 cm−1 [69]. The two small absorption bands at 2850 and 2932 cm−1 mainly result from the aliphatic C-H elongation vibrations. Olefinic vibrations (C=C) cause the band to appear at about 1644 cm−1. The absorption band represents the carboxylic groups (C=O) at 1735 cm−1. The band at 1381 cm−1 can be attributed to the N-O elongation vibration [32]. The small absorption bands at 1517 and 1444 cm−1 are due to the elongation vibrations of the C=C bonds in aromatic rings, and the small bands between 600 and 900 cm−1 can be attributed to the mode of deformation outside the C-H plane in the aromatic rings [70]. Figure 1 shows the existence of several bands between 900 and 1200 cm−1, which may be due to the presence of phosphorus and phosphocarbon compounds in the samples [71,72]. The three bands appear at 1163, 1118 and 1045 cm−1 and are generally attributed to P-O-P elongation vibrations of polyphosphates or P+-O ionized bonds in ortho-phosphoric acid esters [72,73]. Figure 1 also shows certain variations in the intensity of some peaks and shifting of other peaks, indicating that the treatment by ortho-phosphoric acid modified the surface chemistry of ZJS, maybe by the formation of acidic oxygen-contained complexes by strong oxidation [74], and this promotes the absorption of basic compounds such as methylene blue.
The XRD results of the ZJS before and after treatment are shown in Figure 2. The diffractograms show an amorphous structure for both samples, confirming that the ortho-phosphoric acid treatment did not affect the crystalline structure. Figure 2 also shows a broad and intense peak around 2θ = 22°, attributed to cellulose [33]. The amorphous structure was confirmed by the presence of lignin and hemicellulose represented by a small peak at 2θ = 15° [3].
The micromorphology of ZJS-H3PO4 was examined and the obtained results are displayed in Figure S3. This figure shows that ZJS-H3PO4 has a non-uniform structure with a heterogeneity in the pore size [32], which is in favor of its use as an adsorbent.
Thermogravimetric analysis for ZJS and ZJS-H3PO4 was performed at a temperature range from 30 to 890 °C and the results obtained are given in Figure 3. It is evident from this figure that the two samples show similar results characterized by four stages. The first stage (from 30 to 100 °C) is defined by a 9% mass loss, which may be attributed to the elimination of the product’s humidity. The second phase is characterized by an equilibrium stage between 100 and 230 °C, with no weight loss. Then, the third stage, starting from 230 to 370 °C, shows a significant weight loss of about 77%, possibly due to gaseous compounds (CO2, CH4, CO, H2) or the degradation of the hemicelluloses [75]. Finally, in the last stage (370 °C up to the end of analysis), the mass loss reaches 83% for ZJS and 89% for ZJS-H3PO4 and these losses can be attributed to the degradation of cellulose, which is the main compound of the products, as indicated by the XRD analysis.

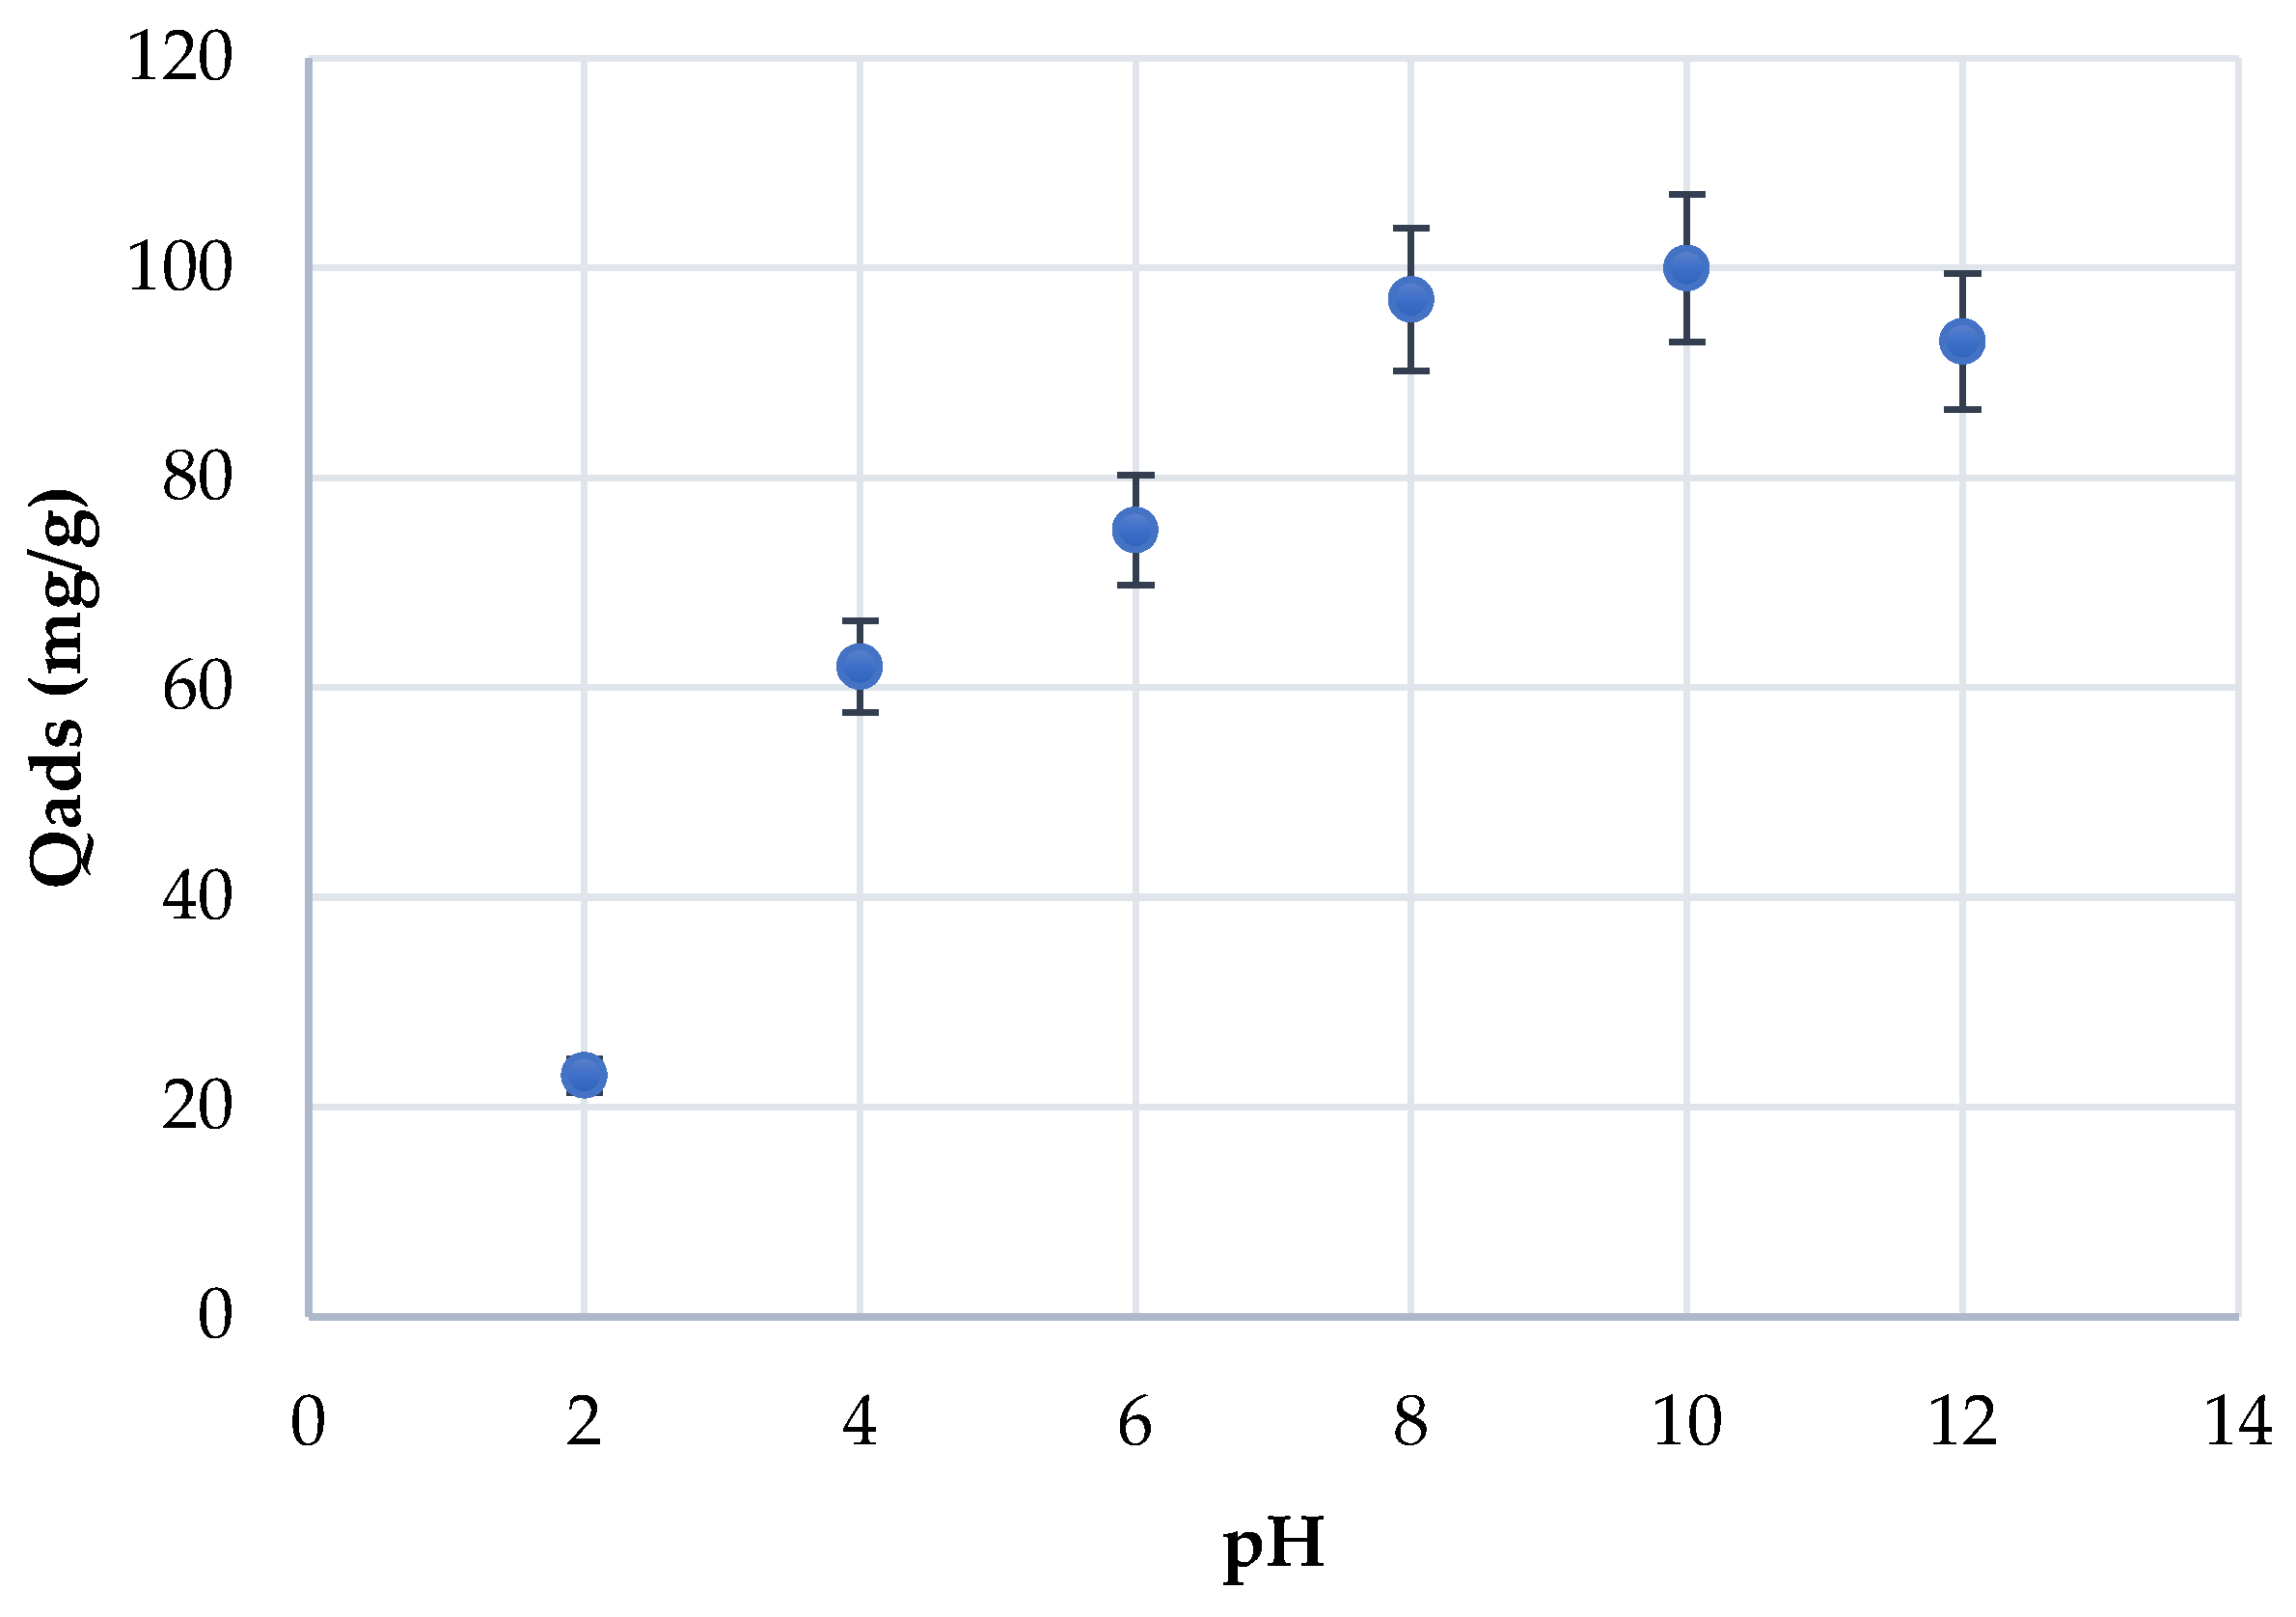
3.2. Effect of the pH

The influence of pH on MB biosorption onto ZJS-H3PO4 was examined. Figure 4 illustrates the results obtained, and it shows a noticeable increase in the adsorbed amount in the range of 2 to 8. In contrast, no significant variation in the adsorbed amount of MB is observed in the range of 8 to 12. This variation can be explained by the pHPZC of ZJS-H3PO4 at about 6.8 (see Figure S2). Indeed, since MB is a cationic dye, its biosorption is favored at pH higher than the pHPZC by electrostatic interactions between the dye that is positively charged and the ZJS-H3PO4 that is deprotonated by the surplus of (OH) ions.
Due to the substantial influence of pH on the MB adsorption process, the highest efficiency, reaching 100%, was observed at pH of 10. Consequently, pH value of 10 was chosen as the optimal one.

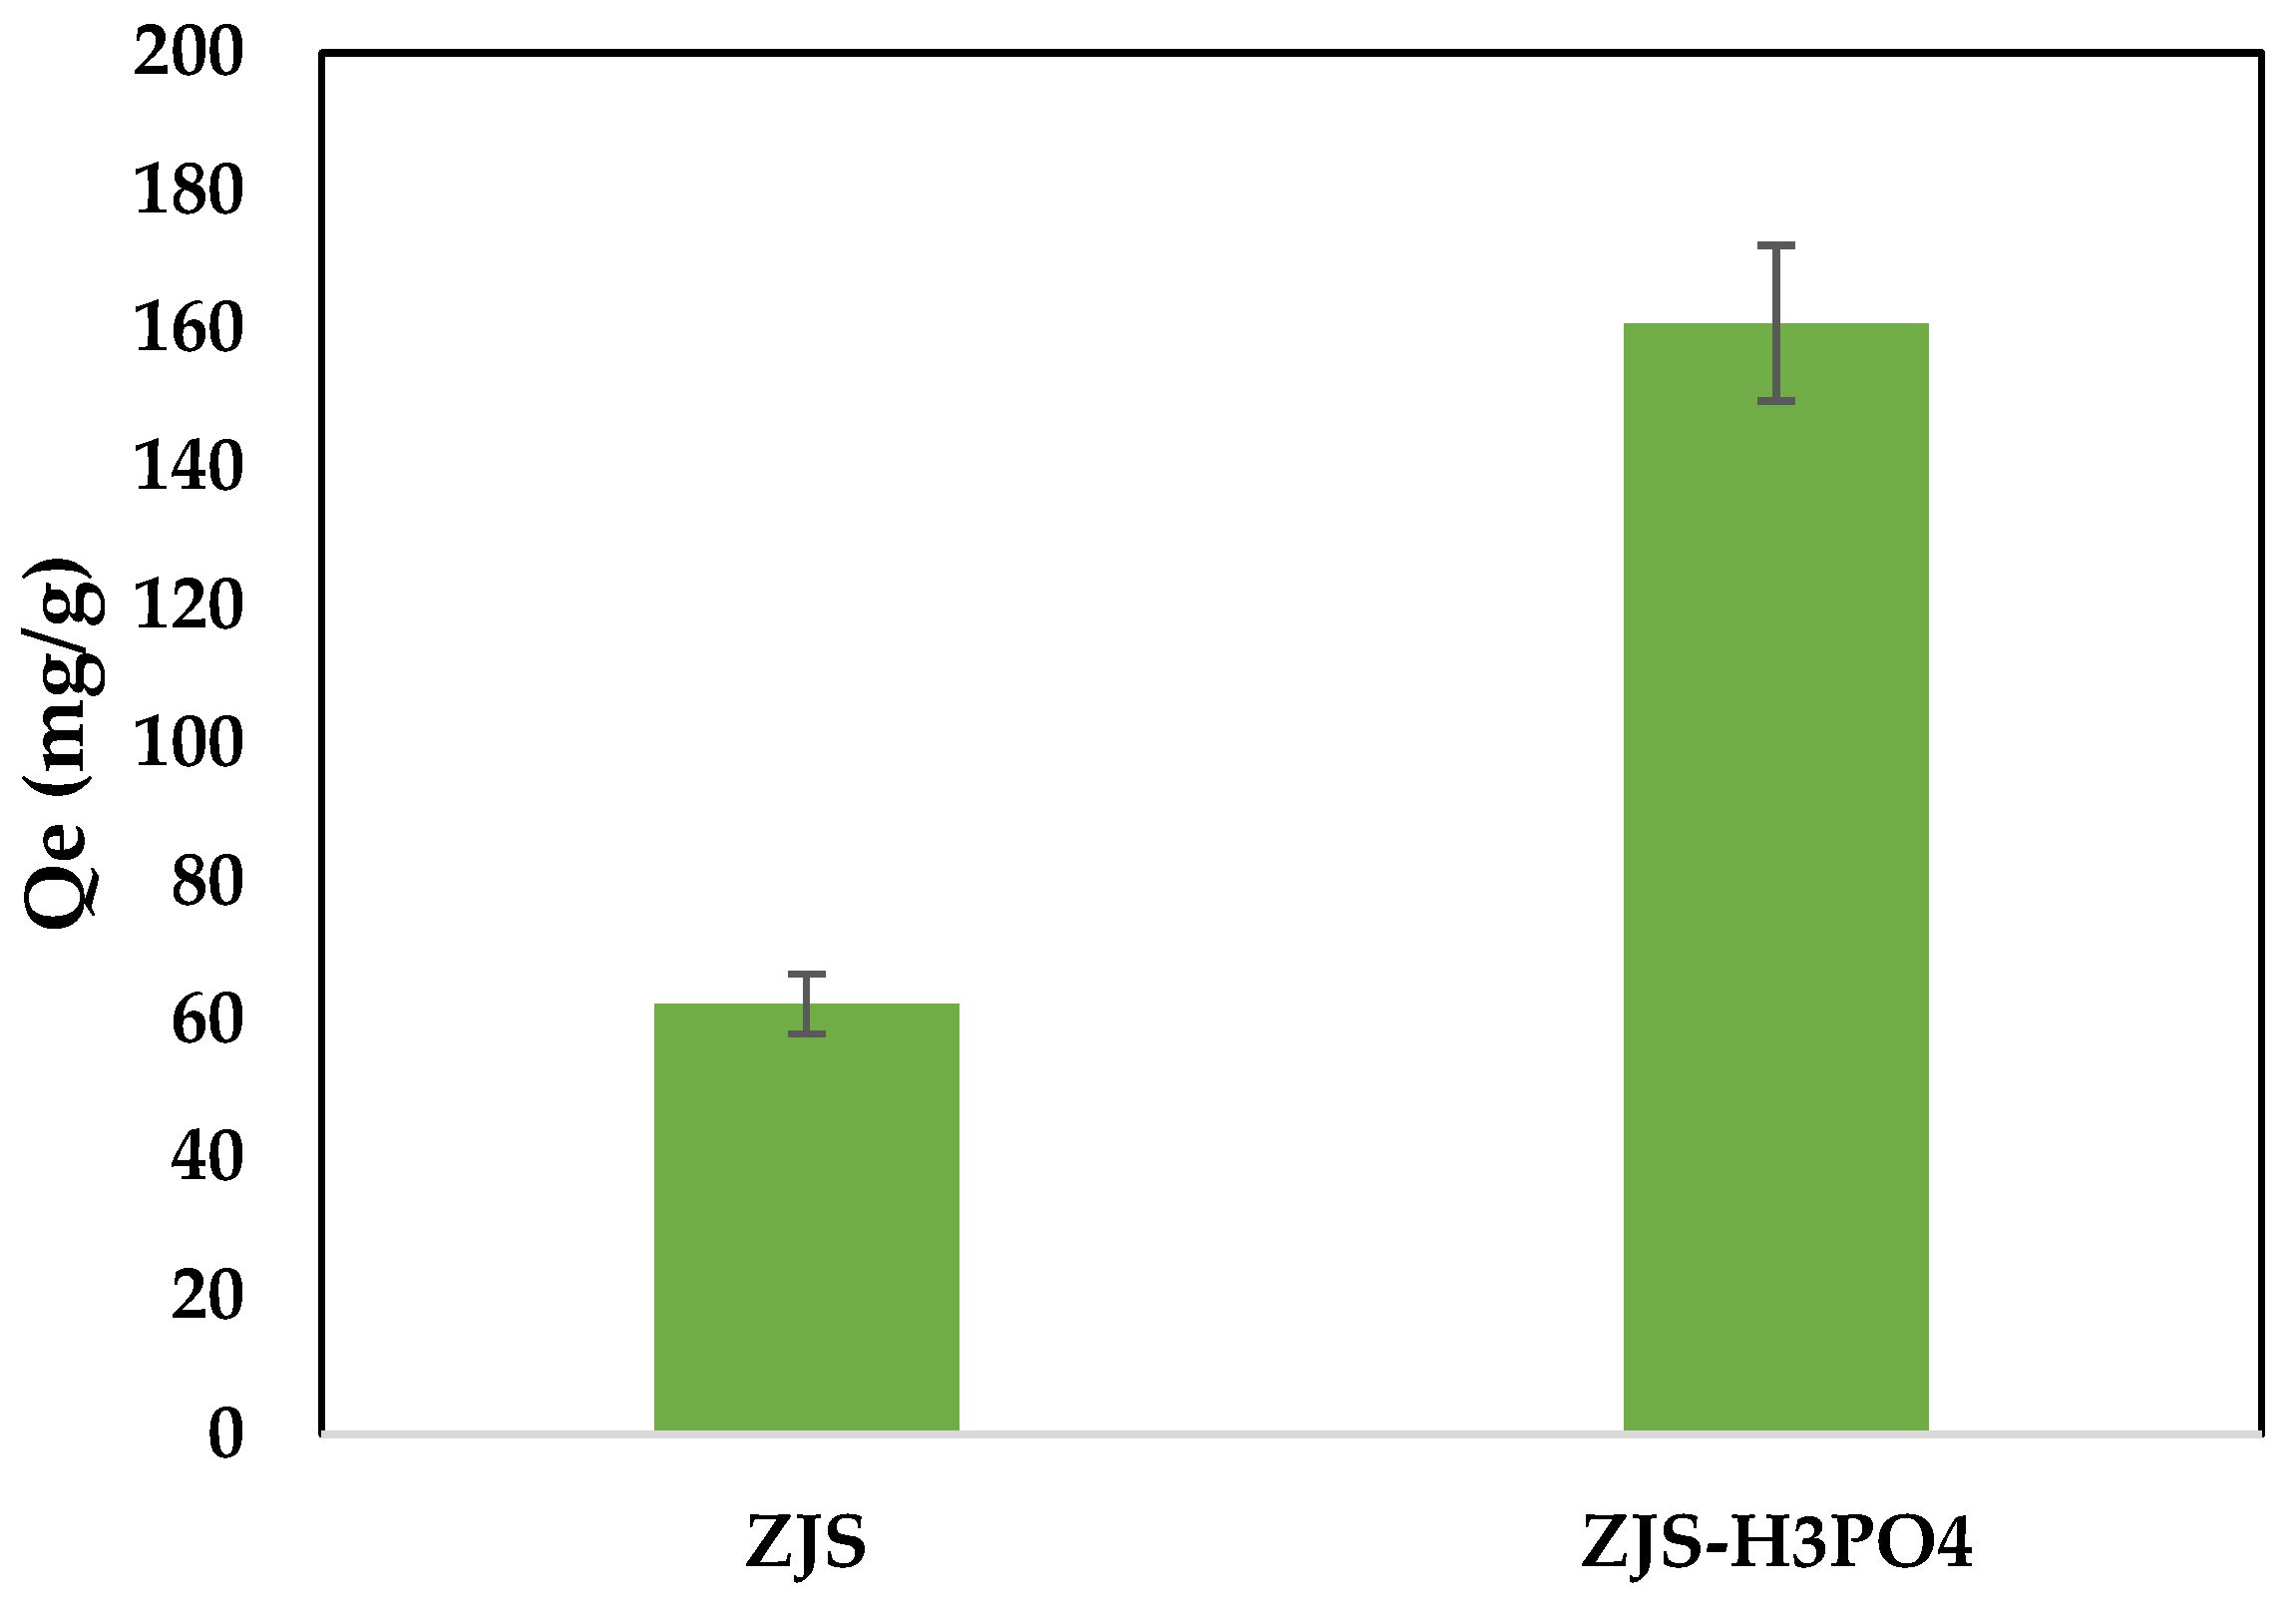
3.3. The Effect of H₃PO₄ Treatment Processes on the Modification of Ziziphus jujuba Stones for MB Adsorption Capacity

In an attempt to explore the effects of H₃PO₄ treatment on MB adsorption efficiency, the maximum adsorbed quantity of MB onto both untreated ZJS and H₃PO₄-treated ZJS, as obtained from the 25 °C adsorption isotherms, is illustrated in Figure 5. It is evident from Figure 5 that the H₃PO₄ treatment significantly and positively enhanced adsorption performance, with the adsorbed quantity increasing from 62.25 mg/g for untreated ZJS to 160.85 mg/g for H₃PO₄-treated ZJS.

3.4. Effect of the Contact Time and the Initial Concentration

The results obtained regarding the biosorption kinetics are illustrated in Figure 6, showing several steps in the biosorption kinetics of MB onto ZJS-H3PO4. The process started with a rapid biosorption step on the external surface of the solid, which may be due to the difference between the concentration of MB in the solution and on the surface of the solid [76]. The second step can be characterized by a decrease in the number of biosorption sites available, which slowed down the rate of biosorption as the MB was adsorbed. Finally, in the third step, the equilibrium time was achieved when there were no more free or accessible biosorption sites (after 20 min for the lowest concentration and 60 min for the highest concentration).
The results also show that when the initial concentration increased, the adsorbed quantity increased, and the amounts adsorbed at equilibrium were 50, 93, and 128 mg g−1 for 50, 100, and 150 mg L−1 dye concentrations, respectively.

3.5. Isotherms Modeling

The biosorption isotherm is represented by the variation in the adsorbed quantity as a function of the equilibrium concentration at a given temperature. In this work, the biosorption isotherms of MB onto ZJS-H3PO4 were carried out at different temperatures (25, 30, and 40 °C). Figure S4 shows that the obtained isotherms were of type I for the three considered temperatures, according to the classification of the IUPAC [77]. This type of isotherm is commonly encountered, and it characterizes both a biosorption monolayer and the existence of micropores.
According to Figure S4, the biosorption isotherms at 30 and 40 °C are almost identical. This phenomenon may be due to several factors, including the solubility of the MB molecules, which does not change in this temperature range, or the morphology of ZJS-H3PO4, which can be distorted when the temperature increases to 40 °C and decrease in the adsorbent performance of the ZJS-H3PO4.
Moreover, biosorption capacity deduced from biosorption isotherms clearly shows the potential of ZJS-H3PO4 to be used as an adsorbent for organic dyes. Indeed, its maximum biosorption capacity is compared to some other adsorbents tested for MB biosorption in Table 2, showing that its capacity of 179.8 mg g−1 is very close to the most efficient one, peach shells at 183.6 mg g−1.
Moreover, experimental data were fitted by the nonlinear models of Langmuir and Freundlich (three parameters), Sips and Redlich–Peterson (three parameters). The corresponding calculated data are displayed in Figure 7 and the related constants are collected in Table 3. As can be observed, the biosorption isotherms for the three temperatures are best fitted by the Langmuir model compared to other models, exhibiting coefficients of determination ranging from 0.968 to 0.981. Furthermore, the quantities of adsorbate estimated by the Langmuir model closely match the experimentally determined amounts, resulting in the lowest average percentage errors (APE%). Thus, irrespective of temperature, the Langmuir model is proven to be the most reliable.
Furthermore, the values of RL factor are between 0 and 1, confirming that the Langmuir model is favorable for the three temperatures [53].

3.6. Kinetics Modeling

The modeling results are shown in Figure 8 and the obtained model parameters, namely the rate constants K, the theoretical maximum adsorbed quantities, and the determination coefficients R2, are given in Table 4.
As observed, the calculated adsorbed quantities for both the pseudo-first- and pseudo-second-order models are close to those obtained experimentally. However, coefficients of determination, R2, for the pseudo-first-order model are low, in the range of 0.903 to 0.993, while they are in the range of 0.975 to 0.996 for the pseudo-second-order model.
It can also be seen that the rate and rate constants decreased as the concentration increased, which may be due to competition for the active sites. Regarding the pseudo-nth-order model, the coefficients of determination R2 are 0.998, 0.993, and 0.998 for 50, 100, and 150 mg L−1 dye, respectively, with the respective adsorbed quantities being 51.19, 91.21, and 135.54 mg g−1. The orders of the reactions are between 1.12 and 3.74.
In conclusion, based on the calculation results, the pseudo-nth-order model demonstrates the highest coefficients of determination (R²) and the lowest average percentage error (APE%) values. Therefore, it can be considered as the most suitable for describing the biosorption kinetics of MB onto ZJS-H3PO4. This model provides the most accurate fit to the experimental data.
Given the understanding of the nature of the interactions between MB and ZJS-H3PO4, the intraparticle diffusion model was also applied, showing two linear parts in Figure 9. The first can be attributed to the biosorption at the surface or the external diffusion, and the second represents the intraparticle diffusion [59]. The results show that the curve qt = f (t0.5) does not cross the origin, and hence, the intraparticle diffusion occurs but is not the limiting step [32].

3.7. Effect of the Temperature

The impact of the temperature on the biosorption of MB onto ZJS-H3PO4 was tested in the range of 25 to 40 °C. Contrary to the usual case, biosorption was not exothermic, according to the experimental results shown in Figure S4. Indeed, an increase in the temperature from 25 to 40 °C caused an increase in the adsorbed amount of MB, from 160.85 mg g−1 to 174.31 mg g−1. This increase can be due to the diffusion of MB in the micropores, which accelerates with the rise of the temperature [82].

3.8. Effect of the Ionic Strength and the Humic Acid on Biosorption of MB onto ZJS-H3PO4

Ionic strength plays a significant role in the biosorption of both organic and inorganic compounds. In order to simulate realistic conditions, the impact of ionic strength on the biosorption of MB onto ZJS-H3PO4 was investigated using 0.1 mol/L NaCl salt and humic acid solutions. Figure 10 illustrates that adding humic acid has no discernible effect on biosorption, as the quantity of adsorbed MB remain unchanged. Conversely, the adsorbed amount is nearly doubled upon the addition of NaCl. This increase is attributed to the rise in ionic strength, which enhances the biosorption of MB onto ZJS-H3PO4.

3.9. Statistical Physics Models

An adjustment method based on the Levenberg–Marquardt iteration algorithm that uses statistical weighting and nonlinear regression was considered to correlate the experimental data to the proposed model. Once residues between experimental and theoretical values are minimized by the models according to a defined confidence level set at 95%, the best results are achieved [83]. The coefficient of determination, R2, is used as a fitting quality indicator. The AIC (Akaike Information Criterion) is another mathematical indicator used to select the best model. From several models applied to fit experimental data, the AIC can estimate the performance of each model relative to each other. It deals with the compromise between the model’s goodness of fit and the model’s complexity. The AIC is calculated by using the following equation [83]:
A I C = x 2 + 2 p
where x2 is the chi-square and p is the number of parameters of the fitted model.
The ideal fitting is obtained when the R2 is high, close to 1, while the AIC reaches its minimum value. The results of the fitting are presented in Table 5.
Table 5 indicates the highest R2 and AIC values in the limited multilayer, while the monolayer model led to the highest R2 and lowest AIC values. In general, a biosorption process is better described when the number of physical parameters of the model increases [84]. Thus, minimizing information loss requires having a minimum AIC [83]. Therefore, the monolayer model was selected and considered to describe the experimental values of isotherms for the three temperatures.
The values of the fitting parameters of the monolayer model describing the adsorption of MB onto ZJS-H3PO4 are given in Table 6.

3.9.1. Steric Interpretation

The basis parameters for the steric interpretation are the number of molecules per site (n), the density of receptor sites (NM), and the adsorbed amount at saturation (Q0). Figure 11 illustrates the variation in the steric parameters according to temperature.
  • Parameter nm
The parameter nm plays a crucial role in elucidating the adsorption mechanism, as it offers insights into the orientation of molecules toward the adsorbent surface [85]. This parameter can vary, being either greater or less than 1. When nm exceeds 1, it indicates the presence of multiple anchored molecules at a single site, signifying multi-molecular adsorption [61,86]. In this context, it provides information on the number of molecules attached to a receptor site as an aggregate [61]. When the number “nm” is less than unity, the adsorbed molecules take a parallel position to the surface of the adsorbent material [41]. This situation could be associated with the number of sites occupied by the adsorbate, referred to as the anchorage number, defined as n’ = 1/nm [40,41,60].
Knani and co-workers [84] demonstrate that the percentage of pollutant molecules anchored by either 1 or 2 free sites can be calculated. Suppose we denote x as the proportion of molecules with one anchorage. In that case, the percentage of molecules having two anchorages is (1 − x). Knani and co-workers [84] also show that nm = x + 0.5 × (1 − x). In our study, Table 6 reveals that at 25 °C, nm = 0.61. This finding indicates that approximately 22% of MB molecules were anchored with a single site, while 78% were adsorbed with two free active sites. At 30 °C, nm = 0.75, meaning that 50% of MB molecules were anchored with a single anchorage, and 50% were adsorbed with two free active sites. It should be noted that at both 25 °C and 30 °C, MB molecules were adsorbed in a parallel position. Conversely, at 40 °C, nm = 1.49, exceeding 1, which implies, as previously mentioned, that 100% were adsorbed with a single anchorage in a perpendicular position.
Figure 11a depicts an increase in the number of adsorbed MB molecules per site (nm), which can be attributed to thermal collision [40].
  • Parameter NM
Figure 11b demonstrates the variation in receptor site density (NM) with temperature. It is evident from this figure that the receptor site density of ZJS- H3PO4 decreases with temperature. This trend can be explained by the increased solubility of MB with rising temperature, resulting in stronger interactions between the liquid phase (water and dye molecules) than between MB molecules and the surface of ZJS-H3PO4 [40]. These interpretations underscore the dominant role of temperature in the biosorption process.
  • Parameter Q0
The saturation biosorption capacity relies on several variables, including parameters nm and NM, which signify the potential of the ZJS-H3PO4 surface to adsorb MB molecules. In Figure 11c, Q0 is plotted as a function of temperature. It is observable that increasing the initial temperature from 25 to 30 °C led to an increase in the adsorbed quantity, followed by a decrease at 40 °C. Hence, it can be inferred that T = 30 °C can be regarded as the optimal temperature for the biosorption process. The energetic study further validated this proposition.

3.9.2. Energetic Interpretation

The biosorption energy −ΔE is a critical parameter that represents the depth of good potentials at the receptor site on the surface of ZJS-H3PO4 [83,86]. This parameter can help to make an energetic interpretation where it is calculated according to the following relation:
E = R T l n   C 1 / 2 C s
In the above equation, R is the ideal gas constant, T is the absolute temperature expressed in K, and Cs is the solubility in water.
Figure 12 depicts the temperature-based biosorption energy variation. The range of (5–8 kJ mol−1) observed in Figure 12 corresponds to physical interactions, typically electrostatic interactions and hydrogen bonds [40]. Furthermore, the biosorption energy obtained at 30 °C confirms that this temperature is optimal.

3.10. Gaussian Process Regression

As previously mentioned, the optimization phase of the kernel model was crucial in our study, aiming to determine the most effective model for predicting MB adsorption by ZJS-H3PO4. By carefully examining ten different kernel functions and meticulously adjusting the parameters of each, including the kernel scale represented by [sigmaM, sigmaF], as well as sigma itself, we are able to evaluate each model’s ability to capture the complex relationships present in our data. This rigorous approach enables us to identify the most suitable model, ensuring the reliability and effectiveness of MB adsorption prediction.
Following the optimization of the kernel function, the best-performing model is presented in Table 7.
After meticulous optimization, the GPR model achieved remarkable performance. By focusing on selecting the most suitable kernel and basis functions for each phase of the study, we were able to maximize the model’s ability to capture the complex relationships present in the data. The decision to use the ARD-Exponential kernel function was due to its automatic adaptation of radial distance, providing optimal flexibility to model variations in the data. Additionally, incorporating the Constant basis function ensured fundamental stability in the model, regardless of fluctuations in the input data.
The results obtained are particularly impressive. The high R values across all datasets, 0.9997 for the training set, 0.9997 for the test data, 0.9998 for validation, and 0.9998 for the overall dataset, indicate the model’s ability to explain the variance in the observed data effectively. The model performance is supported by the low RMSE values, which are 0.312 for training, 0.161 for testing, 0.346 for validation, and 0.2805 for the overall dataset. These values indicate that the model’s predictions closely align with actual values, demonstrating its accuracy and reliability in predicting MB adsorption by ZJS-H3PO4.
These results are visually represented in Figure S5, illustrating the performance metrics of the optimized GPR model.
The optimized GPR model significantly advances our ability to model and understand the MB adsorption process. Its exceptional ability to generalize and accurately predict data strengthens its relevance and utility in this study and paves the way for potential future applications in similar research and industrial settings.

3.10.1. Residues Study

To confirm the effectiveness and performance of the obtained model, the residual method was utilized [87]. From the outset, experimental and predicted values were plotted together as time series to visually verify any differences between the values (Figure 13a). Subsequently, a histogram of the errors was plotted to provide a comprehensive understanding of the distribution and magnitude of these differences (Figure 13b). This rigorous validation process not only allows for the direct comparison between observed and predicted values but also provides insights into the consistency and accuracy of the model across the entire dataset. By employing such a systematic approach, we ensure that the model captures the overall trends and accurately represents the variability and uncertainties inherent in the data. Overall, this methodology reinforces the reliability and robustness of the model, validating its efficacy in predicting MB adsorption by ZJS-H3PO4.
Figure 13a reveals a compelling superposition between the experimental and predicted values, showcasing the model’s ability to predict the actual data closely. This visual alignment underscores the accuracy and fidelity of the model in capturing the intricate nuances present within the dataset. Furthermore, Figure 13b shows that the model errors approximately follow Gaussian distribution with zero mean, signifying the model’s validity. This approximate Gaussian distribution of errors with zero mean reaffirms the effectiveness and reliability of the model across a range of scenarios. These graphical representations provide compelling evidence of the model’s robust performance in predicting MB adsorption by ZJS-H3PO4, instilling confidence in its applicability and utility for practical use.
In conclusion, the visual analyses presented in Figure 13a,b provide compelling evidence of the effectiveness and reliability of the obtained model in predicting MB adsorption by ZJS-H3PO4. These findings collectively affirm the robustness and utility of the model, instilling confidence in its practical application in predicting and understanding MB adsorption processes.

3.10.2. Interface for Optimization and Prediction

In the scope of this work, a dedicated application has been developed to predict the amount of MB absorbed by Ziziphus jujuba stones treated with ortho-phosphoric acid, as shown in Figure S6. This application represents a significant advancement in environmental process modelling, providing researchers and professionals with a valuable tool for modelling and predicting MB absorption. It also allows for the simulation and analysis of trends in MB absorption in various environments, thus opening up new perspectives for environmental research and ecosystem management.

4. Conclusions

The chemical modification of Ziziphus jujuba stones treated with ortho-phosphoric acid (ZJS-H3PO4) has shown promising results in enhancing its adsorption properties for organic dyes. A comprehensive physicochemical characterization showed that ZJS-H3PO4 exhibited improved porosity, bulk density, and acidity compared to untreated ZJS, indicating its suitability as an adsorbent material. The significant increase in phosphorus content confirmed the successful incorporation of orthophosphoric acid during the treatment process. Furthermore, the adsorption capacity of ZJS-H3PO4 for methylene blue (MB) was found to be substantial, with a maximum adsorption capacity of 179.83 mg g−1. This finding demonstrates the potential of ZJS-H3PO4 as an effective adsorbent for organic dyes, highlighting its relevance in environmental remediation and wastewater treatment applications. Applying Gaussian process regression (GPR) allowed for developing a predictive model to estimate MB adsorption by ZJS-H3PO4. The optimized GPR model demonstrated exceptional performance in capturing the complex relationships in the data, as evidenced by high correlation coefficients (R) and low root mean square errors (RMSEs) across all datasets. The validation of the model through residual analysis further confirmed its accuracy and reliability in predicting MB adsorption. Moreover, developing a user-friendly interface for the GPR model development enhances its accessibility and usability, providing researchers and professionals with a valuable tool for simulating and analyzing trends in MB adsorption. This tool significantly advances environmental process modeling, offering new perspectives for environmental research and ecosystem management. The findings presented in this study contribute to the growing body of knowledge on using waste materials for environmental remediation. The successful modification of ZJS with orthophosphoric acid opens up possibilities for its practical application as an efficient adsorbent in various environmental and industrial settings, thereby promoting sustainable waste management practices and addressing challenges related to water pollution. Further research could focus on exploring the performance of ZJS-H3PO4 in real-world scenarios and optimizing its synthesis process to enhance its adsorption efficiency and cost-effectiveness.

Supplementary Materials

The following supporting information can be downloaded at: https://www.mdpi.com/article/10.3390/w16091208/s1, Figure S1. Chemical structure of methylene blue; Figure S2. The change in final pH as a function of the initial pH for solutions of ZJS-H3PO4 during the determination of the point of zero charge PZC; Figure S3. SEM images of ZJS-H3PO4 with different aggrandizement ((a): ×500; (b): ×1000); Figure S4. Equilibrium isotherms for MB biosorption onto ZJS-H3PO4 at different temperatures (agitation speed = 250 rpm, pH = 10); Figure S5. Comparison between experimental and predicted values: (a) training data, (b) testing data, (c) validation data, and (d) all data; Figure S6. Application for prediction MB uptake using the GPR.

Author Contributions

Conceptualization, A.G., A.B., H.T., D.C., J.Z., L.K., A.A.A. and A.A.; data curation, A.G., A.B., D.C. and J.Z.; formal analysis, A.G., A.B., H.T., D.C., J.Z., L.K., A.A.A. and A.A.; investigation, A.G., A.B., H.T., D.C., J.Z. and A.A.; methodology, A.G., A.B., H.T., D.C., J.Z. and A.A.; project administration, H.T., J.Z. and A.A.; resources, H.T., D.C., J.Z. and A.A.; supervision, A.B., D.C. and A.A.; validation, A.G., A.B., H.T., D.C., J.Z., L.K., A.A.A. and A.A.; visualization, A.G., A.B., H.T., D.C., J.Z. and A.A.; writing—original draft, A.G. and H.T.; writing—review and editing, A.B., D.C., J.Z., L.K., A.A.A. and A.A. All authors have read and agreed to the published version of the manuscript.

Funding

This research received no external funding.

Data Availability Statement

Data is contained within the article (and Supplementary Materials).

Acknowledgments

This work was supported and funded by the Deanship of Scientific Research at Imam Mohammad Ibn Saud Islamic University (IMSIU) (grant number IMSIU-RP23013).

Conflicts of Interest

The authors declare no conflicts of interest.

References

  1. Deniz, F.; Kepekci, R.A. Dye Biosorption onto Pistachio By-Product: A Green Environmental Engineering Approach. J. Mol. Liq. 2016, 219, 194–200. [Google Scholar] [CrossRef]
  2. Temesgen, F.; Gabbiye, N.; Sahu, O. Biosorption of Reactive Red Dye (RRD) on Activated Surface of Banana and Orange Peels: Economical Alternative for Textile Effluent. Surf. Interfaces 2018, 12, 151–159. [Google Scholar] [CrossRef]
  3. Lessa, E.F.; Nunes, M.L.; Fajardo, A.R. Chitosan/Waste Coffee-Grounds Composite: An Efficient and Eco-Friendly Adsorbent for Removal of Pharmaceutical Contaminants from Water. Carbohydr. Polym. 2018, 189, 257–266. [Google Scholar] [CrossRef] [PubMed]
  4. Moro, T.R.; Henrique, F.R.; Malucelli, L.C.; de Oliveira, C.M.R.; da Silva Carvalho Filho, M.A.; de Vasconcelos, E.C. Adsorption of Pharmaceuticals in Water through Lignocellulosic Fibers Synergism. Chemosphere 2017, 171, 57–65. [Google Scholar] [CrossRef] [PubMed]
  5. Albadarin, A.B.; Solomon, S.; Kurniawan, T.A.; Mangwandi, C.; Walker, G. Single, Simultaneous and Consecutive Biosorption of Cr(VI) and Orange II onto Chemically Modified Masau Stones. J. Environ. Manag. 2017, 204, 365–374. [Google Scholar] [CrossRef] [PubMed]
  6. Torab-Mostaedi, M.; Asadollahzadeh, M.; Hemmati, A.; Khosravi, A. Equilibrium, Kinetic, and Thermodynamic Studies for Biosorption of Cadmium and Nickel on Grapefruit Peel. J. Taiwan Inst. Chem. Eng. 2013, 44, 295–302. [Google Scholar] [CrossRef]
  7. Lin, G.; Ma, R.; Zhou, Y.; Liu, Q.; Dong, X.; Wang, J. KOH Activation of Biomass-Derived Nitrogen-Doped Carbons for Supercapacitor and Electrocatalytic Oxygen Reduction. Electrochim. Acta 2018, 261, 49–57. [Google Scholar] [CrossRef]
  8. Rangabhashiyam, S.; Lata, S.; Balasubramanian, P. Biosorption Characteristics of Methylene Blue and Malachite Green from Simulated Wastewater onto Carica Papaya Wood Biosorbent. Surf. Interfaces 2018, 10, 197–215. [Google Scholar] [CrossRef]
  9. Riggert, J.; Humpe, A.; Legler, T.J.; Wolf, C.; Simson, G.; Köhler, M. Filtration of Methylene Blue-photooxidized Plasma: Influence on Coagulation and Cellular Contamination. Transfusion 2001, 41, 82–86. [Google Scholar] [CrossRef]
  10. Ihaddaden, S.; Aberkane, D.; Boukerroui, A.; Robert, D. Removal of Methylene Blue (Basic Dye) by Coagulation-Flocculation with Biomaterials (Bentonite and Opuntia Ficus Indica). J. Water Process Eng. 2022, 49, 102952. [Google Scholar] [CrossRef]
  11. Tahraoui, H.; Toumi, S.; Boudoukhani, M.; Touzout, N.; Sid, A.N.E.H.; Amrane, A.; Belhadj, A.-E.; Hadjadj, M.; Laichi, Y.; Aboumustapha, M. Evaluating the Effectiveness of Coagulation–Flocculation Treatment Using Aluminum Sulfate on a Polluted Surface Water Source: A Year-Long Study. Water 2024, 16, 400. [Google Scholar] [CrossRef]
  12. Ayekoe, C.Y.P.; Robert, D.; Lanciné, D.G. Combination of Coagulation-Flocculation and Heterogeneous Photocatalysis for Improving the Removal of Humic Substances in Real Treated Water from Agbô River (Ivory-Coast). Catal. Today 2017, 281, 2–13. [Google Scholar] [CrossRef]
  13. Kanjal, M.I.; Muneer, M.; Jamal, M.A.; Bokhari, T.H.; Wahid, A.; Ullah, S.; Amrane, A.; Hadadi, A.; Tahraoui, H.; Mouni, L. A Study of Treatment of Reactive Red 45 Dye by Advanced Oxidation Processes and Toxicity Evaluation Using Bioassays. Sustainability 2023, 15, 7256. [Google Scholar] [CrossRef]
  14. Ke, J.; Liu, J.; Sun, H.; Zhang, H.; Duan, X.; Liang, P.; Li, X.; Tade, M.O.; Liu, S.; Wang, S. Facile Assembly of Bi2O3/Bi2S3/MoS2 n-p Heterojunction with Layered n-Bi2O3 and p-MoS2 for Enhanced Photocatalytic Water Oxidation and Pollutant Degradation. Appl. Catal. B Environ. 2017, 200, 47–55. [Google Scholar] [CrossRef]
  15. Natarajan, T.S.; Thampi, K.R.; Tayade, R.J. Visible Light Driven Redox-Mediator-Free Dual Semiconductor Photocatalytic Systems for Pollutant Degradation and the Ambiguity in Applying Z-Scheme Concept. Appl. Catal. B Environ. 2018, 227, 296–311. [Google Scholar] [CrossRef]
  16. Shao, X.; Wang, J.; Liu, Z.; Hu, N.; Liu, M.; Duan, C.; Zhang, R.; Quan, C. Cellulose Based Cation-Exchange Fiber as Filtration Material for the Rapid Removal of Methylene Blue from Wastewater. Cellulose 2021, 28, 9355–9367. [Google Scholar] [CrossRef]
  17. Aghigh, A.; Alizadeh, V.; Wong, H.Y.; Islam, M.S.; Amin, N.; Zaman, M. Recent Advances in Utilization of Graphene for Filtration and Desalination of Water: A Review. Desalination 2015, 365, 389–397. [Google Scholar] [CrossRef]
  18. Dickhout, J.M.; Moreno, J.; Biesheuvel, P.M.; Boels, L.; Lammertink, R.G.H.; de Vos, W.M. Produced Water Treatment by Membranes: A Review from a Colloidal Perspective. J. Colloid Interface Sci. 2017, 487, 523–534. [Google Scholar] [CrossRef]
  19. Kenfoud, H.; Baaloudj, O.; Nasrallah, N.; Bagtache, R.; Assadi, A.A.; Trari, M. Structural and electrochemical characterizations of Bi12CoO20 sillenite crystals: Degradation and reduction of organic and inorganic pollutants. J. Mater. Sci. Mater. Electron. 2021, 32, 16411–16420. [Google Scholar] [CrossRef]
  20. Bekru, A.G.; Tufa, L.T.; Zelekew, O.A.; Goddati, M.; Lee, J.; Sabir, F.K. Green Synthesis of a CuO–ZnO Nanocomposite for Efficient Photodegradation of Methylene Blue and Reduction of 4-Nitrophenol. ACS Omega 2022, 7, 30908–30919. [Google Scholar] [CrossRef]
  21. Siong, V.L.E.; Lee, K.M.; Juan, J.C.; Lai, C.W.; Tai, X.H.; Khe, C.S. Removal of Methylene Blue Dye by Solvothermally Reduced Graphene Oxide: A Metal-Free Adsorption and Photodegradation Method. RSC Adv. 2019, 9, 37686–37695. [Google Scholar] [CrossRef]
  22. Baaloudj, O.; Assadi, A.A.; Azizi, M.; Kenfoud, H.; Trari, M.; Amrane, A.; Assadi, A.A.; Nasrallah, N. Synthesis and Characterization of ZnBi2O4 Nanoparticles: Photocatalytic Performance for Antibiotic Removal under Different Light Sources. Appl. Sci. 2021, 11, 3975. [Google Scholar] [CrossRef]
  23. Madi, K.; Chebli, D.; Ait Youcef, H.; Tahraoui, H.; Bouguettoucha, A.; Kebir, M.; Zhang, J.; Amrane, A. Green Fabrication of ZnO Nanoparticles and ZnO/rGO Nanocomposites from Algerian Date Syrup Extract: Synthesis, Characterization, and Augmented Photocatalytic Efficiency in Methylene Blue Degradation. Catalysts 2024, 14, 62. [Google Scholar] [CrossRef]
  24. Boillereau, C.; Peulon, S. An Efficient Eco-Friendly Water Depollution Process Based on Electrodeposited Birnessite Thin Films Coupled to Electrochemistry: Application to Methylene Blue Degradation as Phenothiazines Model Molecule. J. Water Process Eng. 2023, 54, 104024. [Google Scholar] [CrossRef]
  25. Shokoohi, R.; Nematollahi, D.; Samarghandi, M.R.; Azarian, G.; Latifi, Z. Optimization of Three-Dimensional Electrochemical Process for Degradation of Methylene Blue from Aqueous Environments Using Central Composite Design. Environ. Technol. Innov. 2020, 18, 100711. [Google Scholar] [CrossRef]
  26. Fadillah, G.; Saleh, T.A.; Wahyuningsih, S.; Putri, E.N.K.; Febrianastuti, S. Electrochemical Removal of Methylene Blue Using Alginate-Modified Graphene Adsorbents. Chem. Eng. J. 2019, 378, 122140. [Google Scholar] [CrossRef]
  27. Panizza, M.; Barbucci, A.; Ricotti, R.; Cerisola, G. Electrochemical Degradation of Methylene Blue. Sep. Purif. Technol. 2007, 54, 382–387. [Google Scholar] [CrossRef]
  28. Huang, Z.; Li, Y.; Chen, W.; Shi, J.; Zhang, N.; Wang, X.; Li, Z.; Gao, L.; Zhang, Y. Modified Bentonite Adsorption of Organic Pollutants of Dye Wastewater. Mater. Chem. Phys. 2017, 202, 266–276. [Google Scholar] [CrossRef]
  29. Konicki, W.; Aleksandrzak, M.; Mijowska, E. Equilibrium, Kinetic and Thermodynamic Studies on Adsorption of Cationic Dyes from Aqueous Solutions Using Graphene Oxide. Chem. Eng. Res. Des. 2017, 123, 35–49. [Google Scholar] [CrossRef]
  30. Ngabura, M.; Hussain, S.A.; Ghani, W.A.W.A.; Jami, M.S.; Tan, Y.P. Utilization of Renewable Durian Peels for Biosorption of Zinc from Wastewater. J. Environ. Chem. Eng. 2018, 6, 2528–2539. [Google Scholar] [CrossRef]
  31. Hamri, N.; Imessaoudene, A.; Hadadi, A.; Cheikh, S.; Boukerroui, A.; Bollinger, J.-C.; Amrane, A.; Tahraoui, H.; Tran, H.N.; Ezzat, A.O. Enhanced Adsorption Capacity of Methylene Blue Dye onto Kaolin through Acid Treatment: Batch Adsorption and Machine Learning Studies. Water 2024, 16, 243. [Google Scholar] [CrossRef]
  32. Somasekhara Reddy, M.C.; Sivaramakrishna, L.; Varada Reddy, A. The Use of an Agricultural Waste Material, Jujuba Seeds for the Removal of Anionic Dye (Congo Red) from Aqueous Medium. J. Hazard. Mater. 2012, 203–204, 118–127. [Google Scholar] [CrossRef]
  33. Marković, S.; Stanković, A.; Lopičić, Z.; Lazarević, S.; Stojanović, M.; Uskoković, D. Application of Raw Peach Shell Particles for Removal of Methylene Blue. J. Environ. Chem. Eng. 2015, 3, 716–724. [Google Scholar] [CrossRef]
  34. Goswami, M.; Phukan, P. Enhanced Adsorption of Cationic Dyes Using Sulfonic Acid Modified Activated Carbon. J. Environ. Chem. Eng. 2017, 5, 3508–3517. [Google Scholar] [CrossRef]
  35. Imessaoudene, A.; Cheikh, S.; Bollinger, J.-C.; Belkhiri, L.; Tiri, A.; Bouzaza, A.; El Jery, A.; Assadi, A.; Amrane, A.; Mouni, L. Zeolite Waste Characterization and Use as Low-Cost, Ecofriendly, and Sustainable Material for Malachite Green and Methylene Blue Dyes Removal: Box–Behnken Design, Kinetics, and Thermodynamics. Appl. Sci. 2022, 12, 7587. [Google Scholar] [CrossRef]
  36. Belhouchat, N.; Zaghouane-Boudiaf, H.; Viseras, C. Removal of Anionic and Cationic Dyes from Aqueous Solution with Activated Organo-Bentonite/Sodium Alginate Encapsulated Beads. Appl. Clay Sci. 2017, 135, 9–15. [Google Scholar] [CrossRef]
  37. Albadarin, A.B.; Collins, M.N.; Naushad, M.; Shirazian, S.; Walker, G.; Mangwandi, C. Activated Lignin-Chitosan Extruded Blends for Efficient Adsorption of Methylene Blue. Chem. Eng. J. 2017, 307, 264–272. [Google Scholar] [CrossRef]
  38. Guediri, A.; Bouguettoucha, A.; Chebli, D.; Chafai, N.; Amrane, A. Molecular Dynamic Simulation and DFT Computational Studies on the Adsorption Performances of Methylene Blue in Aqueous Solutions by Orange Peel-Modified Phosphoric Acid. J. Mol. Struct. 2019, 1202, 127290. [Google Scholar] [CrossRef]
  39. Amrhar, O.; El Gana, L.; Mobarak, M. Calculation of Adsorption Isotherms by Statistical Physics Models: A Review. Environ. Chem. Lett. 2021, 19, 4519–4547. [Google Scholar] [CrossRef]
  40. Dotto, G.L.; Pinto, L.A.A.; Hachicha, M.A.; Knani, S. New Physicochemical Interpretations for the Adsorption of Food Dyes on Chitosan Films Using Statistical Physics Treatment. Food Chem. 2015, 171, 1–7. [Google Scholar] [CrossRef]
  41. Knani, S.; Khalfaoui, M.; Hachicha, M.A.; Ben Lamine, A.; Mathlouthi, M. Modelling of Water Vapour Adsorption on Foods Products by a Statistical Physics Treatment Using the Grand Canonical Ensemble. Food Chem. 2012, 132, 1686–1692. [Google Scholar] [CrossRef]
  42. Gong, R.; Jin, Y.; Chen, J.; Hu, Y.; Sun, J. Removal of Basic Dyes from Aqueous Solution by Sorption on Phosphoric Acid Modified Rice Straw. Dyes Pigments 2007, 73, 332–337. [Google Scholar] [CrossRef]
  43. Kousha, M.; Daneshvar, E.; Sohrabi, M.S.; Jokar, M.; Bhatnagar, A. Adsorption of Acid Orange II Dye by Raw and Chemically Modified Brown Macroalga Stoechospermum Marginatum. Chem. Eng. J. 2012, 192, 67–76. [Google Scholar] [CrossRef]
  44. Yu, J.; Tong, M.; Sun, X.; Li, B. A Simple Method to Prepare Poly(Amic Acid)-Modified Biomass for Enhancement of Lead and Cadmium Adsorption. Biochem. Eng. J. 2007, 33, 126–133. [Google Scholar] [CrossRef]
  45. Bohli, T.; Ouederni, A.; Fiol, N.; Villaescusa, I. Evaluation of an Activated Carbon from Olive Stones Used as an Adsorbent for Heavy Metal Removal from Aqueous Phases. Comptes Rendus Chim. 2015, 18, 88–99. [Google Scholar] [CrossRef]
  46. Zhang, Z.; Xu, M.; Wang, H.; Li, Z. Enhancement of CO2 Adsorption on High Surface Area Activated Carbon Modified by N2, H2 and Ammonia. Chem. Eng. J. 2010, 160, 571–577. [Google Scholar] [CrossRef]
  47. Baaloudj, O.; Kenfoud, H.; Badawi, A.K.; Assadi, A.A.; El Jery, A.; Assadi, A.A.; Amrane, A. Bismuth Sillenite Crystals as Recent Photocatalysts for Water Treatment and Energy Generation: A Critical Review. Catalysts 2022, 12, 500. [Google Scholar] [CrossRef]
  48. Kebir, M.; Tahraoui, H.; Chabani, M.; Trari, M.; Noureddine, N.; Assadi, A.A.; Amrane, A.; Ben Hamadi, N.; Khezami, L. Water Cleaning by a Continuous Fixed-Bed Column for Cr (VI) Eco-Adsorption with Green Adsorbent-Based Biomass: An Experimental Modeling Study. Processes 2023, 11, 363. [Google Scholar] [CrossRef]
  49. Djama, C.; Bouguettoucha, A.; Chebli, D.; Amrane, A.; Tahraoui, H.; Zhang, J.; Mouni, L. Experimental and Theoretical Study of Methylene Blue Adsorption on a New Raw Material, Cynara Scolymus—A Statistical Physics Assessment. Sustainability 2023, 15, 10364. [Google Scholar] [CrossRef]
  50. Foo, K.Y.; Hameed, B.H. Insights into the Modeling of Adsorption Isotherm Systems. Chem. Eng. J. 2010, 156, 2–10. [Google Scholar] [CrossRef]
  51. Kumar, K.V.; Porkodi, K.; Rocha, F. Isotherms and Thermodynamics by Linear and Non-Linear Regression Analysis for the Sorption of Methylene Blue onto Activated Carbon: Comparison of Various Error Functions. J. Hazard. Mater. 2008, 151, 794–804. [Google Scholar] [CrossRef] [PubMed]
  52. Langmuir, I. The Adsorption of Gases on Plane Surfaces of Glass, Mica and Platinum. J. Am. Chem. Soc. 1918, 40, 1361–1403. [Google Scholar] [CrossRef]
  53. Sivarajasekar, N.; Baskar, R. Adsorption of Basic Magenta II onto H2SO4 Activated Immature Gossypium hirsutum Seeds: Kinetics, Isotherms, Mass Transfer, Thermodynamics and Process Design. Arab. J. Chem. 2019, 12, 1322–1337. [Google Scholar] [CrossRef]
  54. Bounaas, M.; Bouguettoucha, A.; Chebli, D.; Reffas, A.; Harizi, I.; Rouabah, F.; Amrane, A. High Efficiency of Methylene Blue Removal Using a Novel Low-Cost Acid Treated Forest Wastes, Cupressus semperirens Cones: Experimental Results and Modeling. Part. Sci. Technol. 2019, 37, 504–513. [Google Scholar] [CrossRef]
  55. Redlich, O.; Peterson, D.L. A Useful Adsorption Isotherm. J. Phys. Chem. 1959, 63, 1024. [Google Scholar] [CrossRef]
  56. Baghdadi, M. UT (University of Tehran) Isotherm as a Novel and Useful Adsorption Isotherm for Investigation of Adsorptive Removal of Pollutants. J. Environ. Chem. Eng. 2017, 5, 1906–1919. [Google Scholar] [CrossRef]
  57. Lagergren, S. Zur Theorie Der Sogenannten Adsorption Geloster Stoffe. K. Sven. Vetenskapsakademiens Handl. 1898, 24, 1–39. [Google Scholar]
  58. Özer, A. Removal of Pb(II) Ions from Aqueous Solutions by Sulphuric Acid-Treated Wheat Bran. J. Hazard. Mater. 2007, 141, 753–761. [Google Scholar] [CrossRef] [PubMed]
  59. Bouguettoucha, A.; Chebli, D.; Mekhalef, T.; Noui, A.; Amrane, A. The Use of a Forest Waste Biomass, Cone of Pinus Brutia for the Removal of an Anionic Azo Dye Congo Red from Aqueous Medium. Desalination Water Treat. 2015, 55, 1956–1965. [Google Scholar] [CrossRef]
  60. Khalfaoui, M.; Knani, S.; Hachicha, M.A.; Lamine, A.B. New Theoretical Expressions for the Five Adsorption Type Isotherms Classified by BET Based on Statistical Physics Treatment. J. Colloid Interface Sci. 2003, 263, 350–356. [Google Scholar] [CrossRef]
  61. Sellaoui, L.; Guedidi, H.; Knani, S.; Reinert, L.; Duclaux, L.; Ben Lamine, A. Application of Statistical Physics Formalism to the Modeling of Adsorption Isotherms of Ibuprofen on Activated Carbon. Fluid Phase Equilibria 2015, 387, 103–110. [Google Scholar] [CrossRef]
  62. Mobarak, M.; Mohamed, E.A.; Selim, A.Q.; Eissa, M.F.; Seliem, M.K. Experimental Results and Theoretical Statistical Modeling of Malachite Green Adsorption onto MCM–41 Silica/Rice Husk Composite Modified by Beta Radiation. J. Mol. Liq. 2019, 273, 68–82. [Google Scholar] [CrossRef]
  63. Aouaini, F.; Knani, S.; Yahia, M.B.; Bahloul, N.; Kechaou, N.; Lamine, A.B. Application of Statistical Physics on the Modeling of Water Vapor Desorption Isotherms. Dry. Technol. 2014, 32, 1905–1922. [Google Scholar] [CrossRef]
  64. Tahraoui, H.; Belhadj, A.-E.; Amrane, A.; Houssein, E.H. Predicting the Concentration of Sulfate Using Machine Learning Methods. Earth Sci. Inform. 2022, 15, 1023–1044. [Google Scholar] [CrossRef]
  65. Tahraoui, H.; Belhadj, A.-E.; Triki, Z.; Boudellal, N.R.; Seder, S.; Amrane, A.; Zhang, J.; Moula, N.; Tifoura, A.; Ferhat, R. Mixed Coagulant-Flocculant Optimization for Pharmaceutical Effluent Pretreatment Using Response Surface Methodology and Gaussian Process Regression. Process Saf. Environ. Prot. 2023, 169, 909–927. [Google Scholar] [CrossRef]
  66. Yahoum, M.M.; Toumi, S.; Hentabli, S.; Tahraoui, H.; Lefnaoui, S.; Hadjsadok, A.; Amrane, A.; Kebir, M.; Moula, N.; Assadi, A.A.; et al. Experimental Analysis and Neural Network Modeling of the Rheological Behavior of Xanthan Gum and Its Derivatives. Materials 2023, 16, 2565. [Google Scholar] [CrossRef] [PubMed]
  67. Nedjhioui, M.; Nasrallah, N.; Kebir, M.; Tahraoui, H.; Bouallouche, R.; Assadi, A.A.; Amrane, A.; Jaouadi, B.; Zhang, J.; Mouni, L. Designing an Efficient Surfactant–Polymer–Oil–Electrolyte System: A Multi-Objective Optimization Study. Processes 2023, 11, 1314. [Google Scholar] [CrossRef]
  68. Tahraoui, H.; Toumi, S.; Hassein-Bey, A.H.; Bousselma, A.; Sid, A.N.E.H.; Belhadj, A.-E.; Triki, Z.; Kebir, M.; Amrane, A.; Zhang, J. Advancing Water Quality Research: K-Nearest Neighbor Coupled with the Improved Grey Wolf Optimizer Algorithm Model Unveils New Possibilities for Dry Residue Prediction. Water 2023, 15, 2631. [Google Scholar] [CrossRef]
  69. Liao, P.; Malik Ismael, Z.; Zhang, W.; Yuan, S.; Tong, M.; Wang, K.; Bao, J. Adsorption of Dyes from Aqueous Solutions by Microwave Modified Bamboo Charcoal. Chem. Eng. J. 2012, 195–196, 339–346. [Google Scholar] [CrossRef]
  70. Tran, H.N.; Wang, Y.-F.; You, S.-J.; Chao, H.-P. Insights into the Mechanism of Cationic Dye Adsorption on Activated Charcoal: The Importance of π–π Interactions. Process Saf. Environ. Prot. 2017, 107, 168–180. [Google Scholar] [CrossRef]
  71. Kumar, A.; Jena, H.M. Preparation and Characterization of High Surface Area Activated Carbon from Fox Nut (Euryale Ferox) Shell by Chemical Activation with H3PO4. Results Phys. 2016, 6, 651–658. [Google Scholar] [CrossRef]
  72. Nahil, M.A.; Williams, P.T. Pore Characteristics of Activated Carbons from the Phosphoric Acid Chemical Activation of Cotton Stalks. Biomass Bioenergy 2012, 37, 142–149. [Google Scholar] [CrossRef]
  73. Basu, S.; Ghosh, G.; Saha, S. Adsorption Characteristics of Phosphoric Acid Induced Activation of Bio-Carbon: Equilibrium, Kinetics, Thermodynamics and Batch Adsorber Design. Process Saf. Environ. Prot. 2018, 117, 125–142. [Google Scholar] [CrossRef]
  74. Guo, J.; Lua, A.C. Textural and Chemical Properties of Adsorbent Prepared from Palm Shell by Phosphoric Acid Activation. Mater. Chem. Phys. 2003, 80, 114–119. [Google Scholar] [CrossRef]
  75. Paduraru, C.; Tofan, L.; Teodosiu, C.; Bunia, I.; Tudorachi, N.; Toma, O. Biosorption of Zinc(II) on Rapeseed Waste: Equilibrium Studies and Thermogravimetric Investigations. Process Saf. Environ. Prot. 2015, 94, 18–28. [Google Scholar] [CrossRef]
  76. Hameed, B.H.; Ahmad, A.A. Batch Adsorption of Methylene Blue from Aqueous Solution by Garlic Peel, an Agricultural Waste Biomass. J. Hazard. Mater. 2009, 164, 870–875. [Google Scholar] [CrossRef]
  77. Donohue, M.D.; Aranovich, G.L. Classification of Gibbs Adsorption Isotherms. Adv. Colloid Interface Sci. 1998, 76–77, 137–152. [Google Scholar] [CrossRef]
  78. Kumar, K.V.; Kumaran, A. Removal of Methylene Blue by Mango Seed Kernel Powder. Biochem. Eng. J. 2005, 27, 83–93. [Google Scholar] [CrossRef]
  79. Chebli, D.; Bouguettoucha, A.; Mekhalef, T.; Nacef, S.; Amrane, A. Valorization of an Agricultural Waste, Stipa Tenassicima Fibers, by Biosorption of an Anionic Azo Dye, Congo Red. Desalination Water Treat. 2015, 54, 245–254. [Google Scholar] [CrossRef]
  80. Vieira, S.S.; Magriotis, Z.M.; Santos, N.A.V.; das Gracas Cardoso, M.; Saczk, A.A. Macauba Palm (Acrocomia aculeata) Cake from Biodiesel Processing: An Efficient and Low Cost Substrate for the Adsorption of Dyes. Chem. Eng. J. 2012, 183, 152–161. [Google Scholar] [CrossRef]
  81. Manna, S.; Roy, D.; Saha, P.; Gopakumar, D.; Thomas, S. Rapid Methylene Blue Adsorption Using Modified Lignocellulosic Materials. Process Saf. Environ. Prot. 2017, 107, 346–356. [Google Scholar] [CrossRef]
  82. Messaoudi, N.E.; Dbik, A.; Khomri, M.E.; Sabour, A.; Bentahar, S.; Lacherai, A. Date Stones of Phoenix dactylifera and Jujube Shells of Ziziphus lotus as Potential Biosorbents for Anionic Dye Removal. Int. J. Phytoremediation 2017, 19, 1047–1052. [Google Scholar] [CrossRef]
  83. Yahia, M.B.; Knani, S.; Hsan, L.B.H.; Yahia, M.B.; Nasri, H.; Ben Lamine, A. Statistical Studies of Adsorption Isotherms of Iron Nitrate and Iron Chloride on a Thin Layer of Porphyrin. J. Mol. Liq. 2017, 248, 235–245. [Google Scholar] [CrossRef]
  84. Knani, S.; Aouaini, F.; Bahloul, N.; Khalfaoui, M.; Hachicha, M.A.; Ben Lamine, A.; Kechaou, N. Modeling of Adsorption Isotherms of Water Vapor on Tunisian Olive Leaves Using Statistical Mechanical Formulation. Phys. Stat. Mech. Its Appl. 2014, 400, 57–70. [Google Scholar] [CrossRef]
  85. Li, Z.; Sellaoui, L.; Dotto, G.L.; Lamine, A.B.; Bonilla-Petriciolet, A.; Hanafy, H.; Belmabrouk, H.; Netto, M.S.; Erto, A. Interpretation of the Adsorption Mechanism of Reactive Black 5 and Ponceau 4R Dyes on Chitosan/Polyamide Nanofibers via Advanced Statistical Physics Model. J. Mol. Liq. 2019, 285, 165–170. [Google Scholar] [CrossRef]
  86. Sellaoui, L.; Knani, S.; Erto, A.; Hachicha, M.A.; Ben Lamine, A. Equilibrium Isotherm Simulation of Tetrachlorethylene on Activated Carbon Using the Double Layer Model with Two Energies: Steric and Energetic Interpretations. Fluid Phase Equilibria 2016, 408, 259–264. [Google Scholar] [CrossRef]
  87. Mechati, S.; Zamouche, M.; Tahraoui, H.; Filali, O.; Mazouz, S.; Bouledjemer, I.N.E.; Toumi, S.; Triki, Z.; Amrane, A.; Kebir, M. Modeling and Optimization of Hybrid Fenton and Ultrasound Process for Crystal Violet Degradation Using AI Techniques. Water 2023, 15, 4274. [Google Scholar] [CrossRef]
Figure 1. FTIR spectra of samples: ZJS, ZJS-H3PO4 and ZJS-H3PO4 in the range of 4000–500 cm−1.
Water 16 01208 g001
Figure 2. XRD data of treated and raw Ziziphus jujuba stones.
Water 16 01208 g002
Figure 3. Thermogravimetric analysis of ZJS and ZJS-H3PO4.
Water 16 01208 g003
Figure 4. Effect of pH on methylene blue biosorption onto ZJS-H3PO4 (agitation speed = 250 rpm, m = 50 mg, V = 50 mL, T = 25 °C).
Water 16 01208 g004
Figure 5. H3PO4 treatment effect on the performance of the MB adsorption capacity (T = 25 °C, stirring speed = 250 rpm, pH = 10).
Water 16 01208 g005
Figure 6. Effect of the contact time and the initial MB concentration on the biosorption capacity (T = 25 °C, agitation speed = 250 rpm, pH = 10.
Water 16 01208 g006
Figure 7. Modeling by the Langmuir (a), Freundlich (b), Sips (c) and Redlich–Peterson (d) models of the MB adsorption isotherm onto ZJS-H3PO4 at different temperatures (agitation speed = 250 rpm, pH = 10).
Water 16 01208 g007
Figure 8. Experimental (symbols) and calculated data (continuous lines) using pseudo-first-order (a), pseudo-second-order (b), and pseudo-nth-order kinetics models (c) for MB adsorption onto ZJS-H3PO4 at various concentrations (T = 25 °C, agitation speed = 250 rpm, pH 10).
Water 16 01208 g008
Figure 9. Experimental (symbols) and calculated data (continuous lines) by means of an intraparticle diffusion model for MB adsorption onto ZJS-H3PO4 (T = 25 °C, agitation speed = 250 rpm, pH 10).
Water 16 01208 g009
Figure 10. Effect of NaCl and Humic acid on methylene blue biosorption onto ZJS-H3PO4 (T = 25 °C, agitation speed = 250 rpm, pH 10).
Water 16 01208 g010
Figure 11. Behavior of the steric parameters with temperature: (a) parameter n, (b) parameter NM, (c) parameter Q0.
Water 16 01208 g011
Figure 12. Energy of biosorption at three temperatures (298 K, 303 K, and 313 K).
Water 16 01208 g012
Figure 13. GPR model performance: (a) experimental data and the predicted data at different samples and (b) histogram of errors.
Water 16 01208 g013aWater 16 01208 g013b
Table 1. Some physical and chemical characteristics of ZJS and ZJS-H3PO4.
Porosity (%) Apparent
Density
(g mL−1)
Moisture Content (%)Ash Content
(%)
Acidity
(m eq g g−1)
Basicity
(m eq g g−1)
pHPCZpH in Water Solution
ZJS80.21 ± 20.031 ± 0.0050.15 ± 0.00333.12 ± 20.31 ± 0.010.32 ± 0.017.4 ± 0.16.5 ± 0.1
ZJS-H3PO487.29 ± 20.034 ± 0.0050.12 ± 0.00331.42 ± 20.35 ± 0.010.30 ± 0.016.8 ± 0.16.1 ± 0.1
Elemental Composition by XRF
ElementC (%)O (%)Mg (%)Al (%)Si (%)P (%)Others
ZJS48.70050.4000.1310.0480.0440.0300.647
ZJS-H3PO447.50051.7000.0220.1060.1500.1100.412
Table 2. Comparison of some values of maximum biosorption amount of MB onto various adsorbents.
BiosorbantQe (mg g−1)Reference
Ziziphus jujuba stones (ZJS-H3PO4)179.83This work
Peach shells183.6[33]
Mango seed kernel142.9[78]
S. tenassicima fiber5.35[79]
Treated Macauba palm cake33.06[80]
Treated lignocellulosic769[81]
Table 3. Langmuir, Freundlich, Sips and Redlich–Peterson constants for the biosorption of MB onto ZJS-H3PO4.
Models Parameters25 °C30 °C40 °C
LangmuirQexp (mg/g)160.85173.45179.83
Qm (mg/g)160.57172.71176.99
KL (L/mg)0.3910.4670.189
R20.9770.9680.981
APE (%)0.5241.2140.421
RL50 mg/L500 mg/L50 mg/L500 mg/L50 mg/L500 mg/L
0.0560.0060.0930.0100.5190.098
Freundlich 1/n0.1250.1160.123
KF(mg/g) (L/mg) 1/n82.71090.73491.973
R20.8530.5170.542
APE (%)4.26510.35111.125
SipsQm (mg/g)170.50177.16176.37
KS (L/mg)0.3690.0170.180
m0.6450.2231.18778
R20.9760.9580.949
APE (%)0.8541.9583.874
kRP (L/g)87.16695.1430.40
Redlich–PetersonαR (L/mg)0.6800.6090.146
βR0.9560.9801.03
R20.9720.9580.928
APE (%)1.2312.8473.145
Table 4. Kinetic parameters and coefficients of determination for nonlinear regression of PFO PSO and PNO models for the biosorption of MB onto ZJS-H3PO4.
ModelParametersC0 (mg/L)
50100150
PFOQexp, (mg g−1)50.0093.27129.14
Qecal, (mg g−1)48.8990.86116.10
K1, (min−1)1.060.1880.289
R20.9840.9930.903
APE (%)3.1282.4525.763
PSOQecal, (mg g−1)49.7595.69121.01
K2 × 104, (gmg−1 min−1)0.0550.0040.003
R20.9960.9780.975
APE (%)0.9611.6233.842
PNOQecal, (mg g−1)51.1991.21135.54
kn, (min−1) (mg g−1) 1−n0.00220.1151.64 × 10−6
n3.201.123.74
R20.9980.9930.991
APE (%)0.2320.2920.312
Table 5. Values of R2 and AIC of fitting of MB on the ZJS-H3PO4.
T (°C)25 °C30 °C40 °C
ModelR2AICR2AICR2AIC
Monolayer0.991266.010.994176.000.997216.00
Double-layer model with two energies0.991098.010.993538.000.998118.00
Double-layer model with one energy0.991096.010.993536.000.998116.00
Limited multilayer0.99931710.020.9944710.000.9987910.00
Table 6. Values of fitting parameters of the monolayer model describing adsorption of MB on ZJS-H3PO4.
Q0C1/2nmR2
T = 25 °C172.172.760.61099126
T = 30 °C177.501.970.750.99417
T = 40 °C172.145.691.490.99721
Table 7. Performance of the best GPR model.
Kernel FunctionBasis FunctionKernel ScaleSigmaRRMSE
SigmaMSigmaF TrainTestValALLTrainTestValALL
ARD-ExponentialConstant1.7642
83.2462
0.0347
0.2946
9.4089
8.64610.73400.99970.99970.99980.99980.3120.1610.3460.2805
Disclaimer/Publisher’s Note: The statements, opinions and data contained in all publications are solely those of the individual author(s) and contributor(s) and not of MDPI and/or the editor(s). MDPI and/or the editor(s) disclaim responsibility for any injury to people or property resulting from any ideas, methods, instructions or products referred to in the content.

