
Analysis of Self-Rescue Possibilities for Pedestrians in the Aftermath of Destabilization during a Flood Event
by
 , , ,
, , ,
Xin Guo
1 ,
,
Wenhai Wang
1,2,*,
Xing Fang
3 ,
,
Yongwei Gong
1,2,
Junqi Li
1,2,
Mengying Wang
1 and
Xiaojing Li
1 1
Key Laboratory of Urban Stormwater System and Water Environment, Ministry of Education, Beijing University of Civil Engineering and Architecture, Beijing 100044, China
2
Beijing Sustainable Urban Drainage System Construction and Risk Control Engineering Technology Research Center, Beijing University of Civil Engineering and Architecture, Beijing 100044, China
3
Department of Civil and Environmental Engineering, Auburn University, Auburn, AL 36849, USA
*
Author to whom correspondence should be addressed.
Water 2024, 16(9), 1218; https://doi.org/10.3390/w16091218
Submission received: 22 March 2024
/
Revised: 20 April 2024
/
Accepted: 22 April 2024
/
Published: 24 April 2024
(This article belongs to the Section Hydrogeology)
Abstract
:Human safety is paramount in flood disasters. Current research indicates that the majority of fatalities in such disasters are due to people moving in water. Existing studies on human stability in floods have primarily focused on the static resistance of a standing posture against water flow, neglecting the realistic scenario where people need to move and attempt self-rescue in the aftermath of destabilization. This paper introduces an analysis of the stability during the self-rescue process following a fall in floodwaters, providing insights into the baseline risks of human impact in floods. The self-rescue process is defined as the recovery to a standing position after a fall, segmented into four postures: sitting, kneeling, squatting, and standing. Additionally, considering the significant variability of the current method ( water depth multiplied by flow velocity) used to assess human stability in floods, this research thoroughly investigates previously undefined parameters, including submerged volume, frontal area, wet friction coefficient, and flow resistance coefficient. This leads to the development of a physically meaningful self-rescue risk assessment formula, which is validated against previous studies for accuracy, with the aim of contributing new insights to flood risk management and public education.
1. Introduction
Floods are one of the most common natural disasters, which affect a wider range of people than other natural disasters. Every year, floods cause huge disasters, significant economic losses, and human casualties [1,2]; Over the past decade, many studies [3,4,5]; have shown that the leading cause of death in cities during floods is related to roads, as the pathway of fast-moving flooding water. Globally, the socio-economic vulnerability to flood hazards is on the rise, as evidenced by the significant damages inflicted by recent major flooding events in various countries [6,7].
In 2011, Australia Queensland experienced a major flooding event due to a very heavy rainfall event, with flood reconstruction costs estimated at more than $5 billion; a total of 33 people lost their lives, and several people were swept away by floodwaters [8,9,10]. Similarly, the severe floods in Pakistan that started in June 2022 have resulted in catastrophic consequences. About a third of the country’s landmass has been submerged, leading to the destruction of 3.6 million acres of crops and the loss of over 750,000 livestock [11]. Additionally, nearly 24,000 schools have been damaged, along with numerous roads and bridges [12]. The economic toll of the floods, including infrastructure damage and the loss of crop and food production, is estimated to surpass $30 billion [13]. In July 2023, due to an average of 170 mm of rainfall over a 20-h period, with a maximum of 460 mm of rainfall in the Fang Shan area of Beijing, China, a severe flash flooding occurred, and the direct economic damage from this flooding was estimated to be US$1–8.6 billion, with 1–6 million people affected by the flooding and about 80 lives lost [14]. In the same rainfall event, flooding affected 110 counties (cities and districts) in Hebei Province, with 3,888,600 people suffering from flooding and $13.37 billion of direct economic losses in the province [15]. The risk of loss of life by flooding is expected to increase due to population agglomeration and urban development in flood-prone areas, as well as the effects of climate change [16].
The loss of life in inundation scenarios is a crucial aspect of the interaction between humans and floods. The loss of human stability in floods represents the most direct, concrete, and rapid interaction between water and humans, a topic that has received less attention in recent years, compared to other hydrology branches. To date, the primary focus has been on dam failure disasters [17,18], physical experiments [19,20,21,22], and conceptual models [23,24,25]. However, studies have identified two key hydrodynamic mechanisms leading to body instability: overturning instability caused by moment imbalance and sliding instability resulting from horizontal forces’ (friction) imbalance. Overturning instability occurs when the moment generated by the water flow bypassing the body outweighs the stabilizing moment due to the body’s weight [19,21]; sliding instability, on the other hand, happens when the hydrodynamic push force of the water flow bypassing a human body is greater than the friction between the standing feet and the substrate surface.
In the Netherlands, 33% of drowning deaths occur in vehicles, with pedestrians accounting for 25%; in fact, many of the injuries and deaths occur when people are trying to move in floodwaters [10,26], which suggests previous studies may be somewhat overly optimistic [27]. Pedestrian instability in flooding in the upright state is affected by a variety of factors, such as floating vision being obstructed by floodwaters (preventing clear observation of road conditions, leading to tripping over curbs and other obscured underwater objects); stepping into empty spaces at the edges of sidewalks, causing instability; and the impact of water flow caused by large vehicles passing by, etc. Therefore, the ability to carry out effective self-rescue has become the key action to reduce/eliminate the risk of pedestrians involved in the water. The main focus of this article is not to identify the various unexpected factors that may affect a person’s stability in water, but rather to explore the analysis of individuals’ self-rescue abilities after losing stability, due to unforeseen circumstances in the water. Therefore, the listed unexpected situations will not be discussed in detail. Hence, assessing the risk of pedestrians in water solely based on their ability to maintain a stable posture is not sufficient to fully understand all the potential dangers they may face. It is necessary to analyze the self-help process and postures that pedestrians may take after destabilization and assess the stability of pedestrians at various postures to the flooding water as a basis for judging the risk of roads, as the pathway of flooding water, to pedestrians. This helps to make a more detailed classification of the risks pedestrians face when encountering floods.
The main purpose of this study is to provide a new way of thinking about the existing experimental methods for human stability underwater flow and to provide a set of comprehensive physical equations to assess the risk to pedestrians in floods. This paper introduces for the first time the self-rescue process after human instability (i.e., fall) and makes it the focus of the study on human stability in floods. Previous studies, which only assessed the pedestrian’s ability to stand still against the impact of flooding water flow, did not fully represent the various risks to humans in floods. People do not stand and wait in place for the impact of floodwaters. Rather, they move in floodwaters and are more likely to face disaster, i.e., a high risk of falling and being washed away if they cannot self-rescue. Therefore, the ability to self-rescue after losing stability is a true and better measure of human endurance to floods. This approach may be more conservative in numerical terms but advances the understanding of human stability in floods from a static to a dynamic perspective. Due to the lack of detailed numerical studies on human parameters, such as submerged volume and frontal area, in the literature, we introduced simplified three-dimensional models of four postures after human instability. These models describe the relationship between specific human parameters and water depth in different postures, which was not present in previous research. Based on these models, we conducted a numerical model analysis to better understand the hydrodynamic interaction between the human body and average flood flow. Ultimately, we present a set of physically meaningful equations for assessing the chance of self-rescue after instability in floods.
2. Study of Human Instability in Floods
2.1. Existing Human Stability Studies
In the past decades, many researchers have carried out detailed studies on the forces applied to and stability limit of the human body in floods, and most of these studies involved both theoretical analysis and experimental research. The theoretical part is mainly carried out through mechanical analysis, which analyzes the forces that the human body may be subjected to in the water one by one, and then the corresponding expressions of the relationship between the flow rate and the depth of the water can be deduced [21,22,25]. Experiments include model experiments and real human body experiments— model experiments have some use of concrete or marble board instead of the real human body, or the use of an equal proportion of the reduced human body model instead of the real human body [19,20,21,22,23,28,29,30,31,32]; in the water, it is washed down or washed away to determine the current conditions for the human body’s wading limit, and then corrected according to the model of the ratio scale of the flow rate and depth of the water to get the final human body wading limit. The real experiment for the stability of pedestrians in the flood judgment criteria is mainly obtained through the water impact on standing human body when people in a standing position are washed down or feel that the water flow on the human body is a clear threat, making it possible to judge the depth of water and the flow rate of the human body’s wading limit. Summarization of the human experimental data up to now is shown in Table 1.
By organizing the experimental subjects and experimental data, it can be seen that the factors that may affect the stability of the human body in the water that have been focused on by previous researchers include the type and slope of the underlay, the physical parameters of the experimental subjects, and the state of the human being when conducting the experiment. However, the existing studies are limited to the standing posture or simple moving state, and there are no studies involving other postures.
2.2. Self-Help Stance after Destabilization
Through the domestic and foreign real water-related disaster event videos combined, it was found that the human body in the water after the accidental destabilization [33] can basically be divided into the following two states: (1) directly washed away by the current, incapable of self-rescue. (2) The friction force developed between the human body and the ground is greater than the pushing drag force of the flooding water current, and the person can remain static and stable—at this time, the primary goal of self-rescue is to recover to a standing position [33]. Therefore, this study concentrates on the self-rescue process that is employed to restore the human body to a standing position following accidental destabilization in flooding water. It identifies the most hazardous part of this process, which serves as a foundation for developing strategies in road flood management.
To elucidate the process of self-rescue in floods, it is imperative to first examine the dynamics of destabilization, as the initial posture following destabilization acts as the commencement point for self-rescue, with the subsequent choice of self-help approach being contingent on this posture. The act of falling can be broadly categorized into two types: forward and backward falls. In a backward fall, individuals land on their buttocks and may utilize their hands to support themselves against the ground backward to counter the oncoming flow, thereby enhancing stability (Figure 1a). Conversely, in a forward fall, individuals typically employ their hands to brace against the ground, with knees making direct contact and legs bent into a kneeling position (Figure 1b) [34].
The 3D model proposed in this paper was developed by analyzing real flood videos, selecting the most likely postures after destabilization and their self-rescue processes: it is a simplification of the self-rescue process in real floods.
The process of attempting to regain one’s footing after a fall is defined as a “self-rescue process”. The self-rescue process is more complicated than the fall, and there are various options for recovering from sitting or kneeling to standing, but people generally do not have good locomotor ability in the water, and actions such as one-handed bracing and other unstable movements are difficult to complete successfully in the water when there is a certain flow rate, so all unstable postures need to be transitioned to standing through the intermediate posture of squatting (Figure 1) [34].
3. Analysis of the Force State of the Human Body in Water
The transition from the prone kneeling posture shown in Figure 1a to the subsequent upright kneeling posture is relatively easy; when facing the incoming flow, the trunk/torso directly bears the impact of the water flow and the head is in a low position facing the risk of water ingestion, meaning the human body is forced to transition from the prone to the upright kneeling posture. Therefore, this study temporarily omits this posture, focusing only on the sitting, kneeling, squatting, and standing postures.
First, a force analysis of the human body in water under backward fall is conducted (Figure 1(a1)). In water, a person will experience forces in both horizontal and vertical directions; horizontally, they need to withstand the fluid pushing (drag) force caused by the water flow impact on the submerged part of the body, and the frictional force generated by the contact between the body and the ground. Similarly, in the vertical direction, the human body is subjected to its weight , buoyancy , and the support force from the ground.
3.1. Gravitational Analysis
For a specific individual, the gravitational force they experience is also fixed and unchanging. The weight is the product of the constant human body weight m and the gravitational acceleration , and can also be expressed as the product of human body density , gravitational acceleration , and the total volume of the human body . This value is only related to the total volume of the human body, and is unrelated to the posture of the body. The formula for calculating it is written as:
3.2. Buoyancy Analysis
Buoyancy is a function of the density of water , the gravitational acceleration , and the volume of the human body submerged in water. The formula for calculating it is shown in Equation (2).
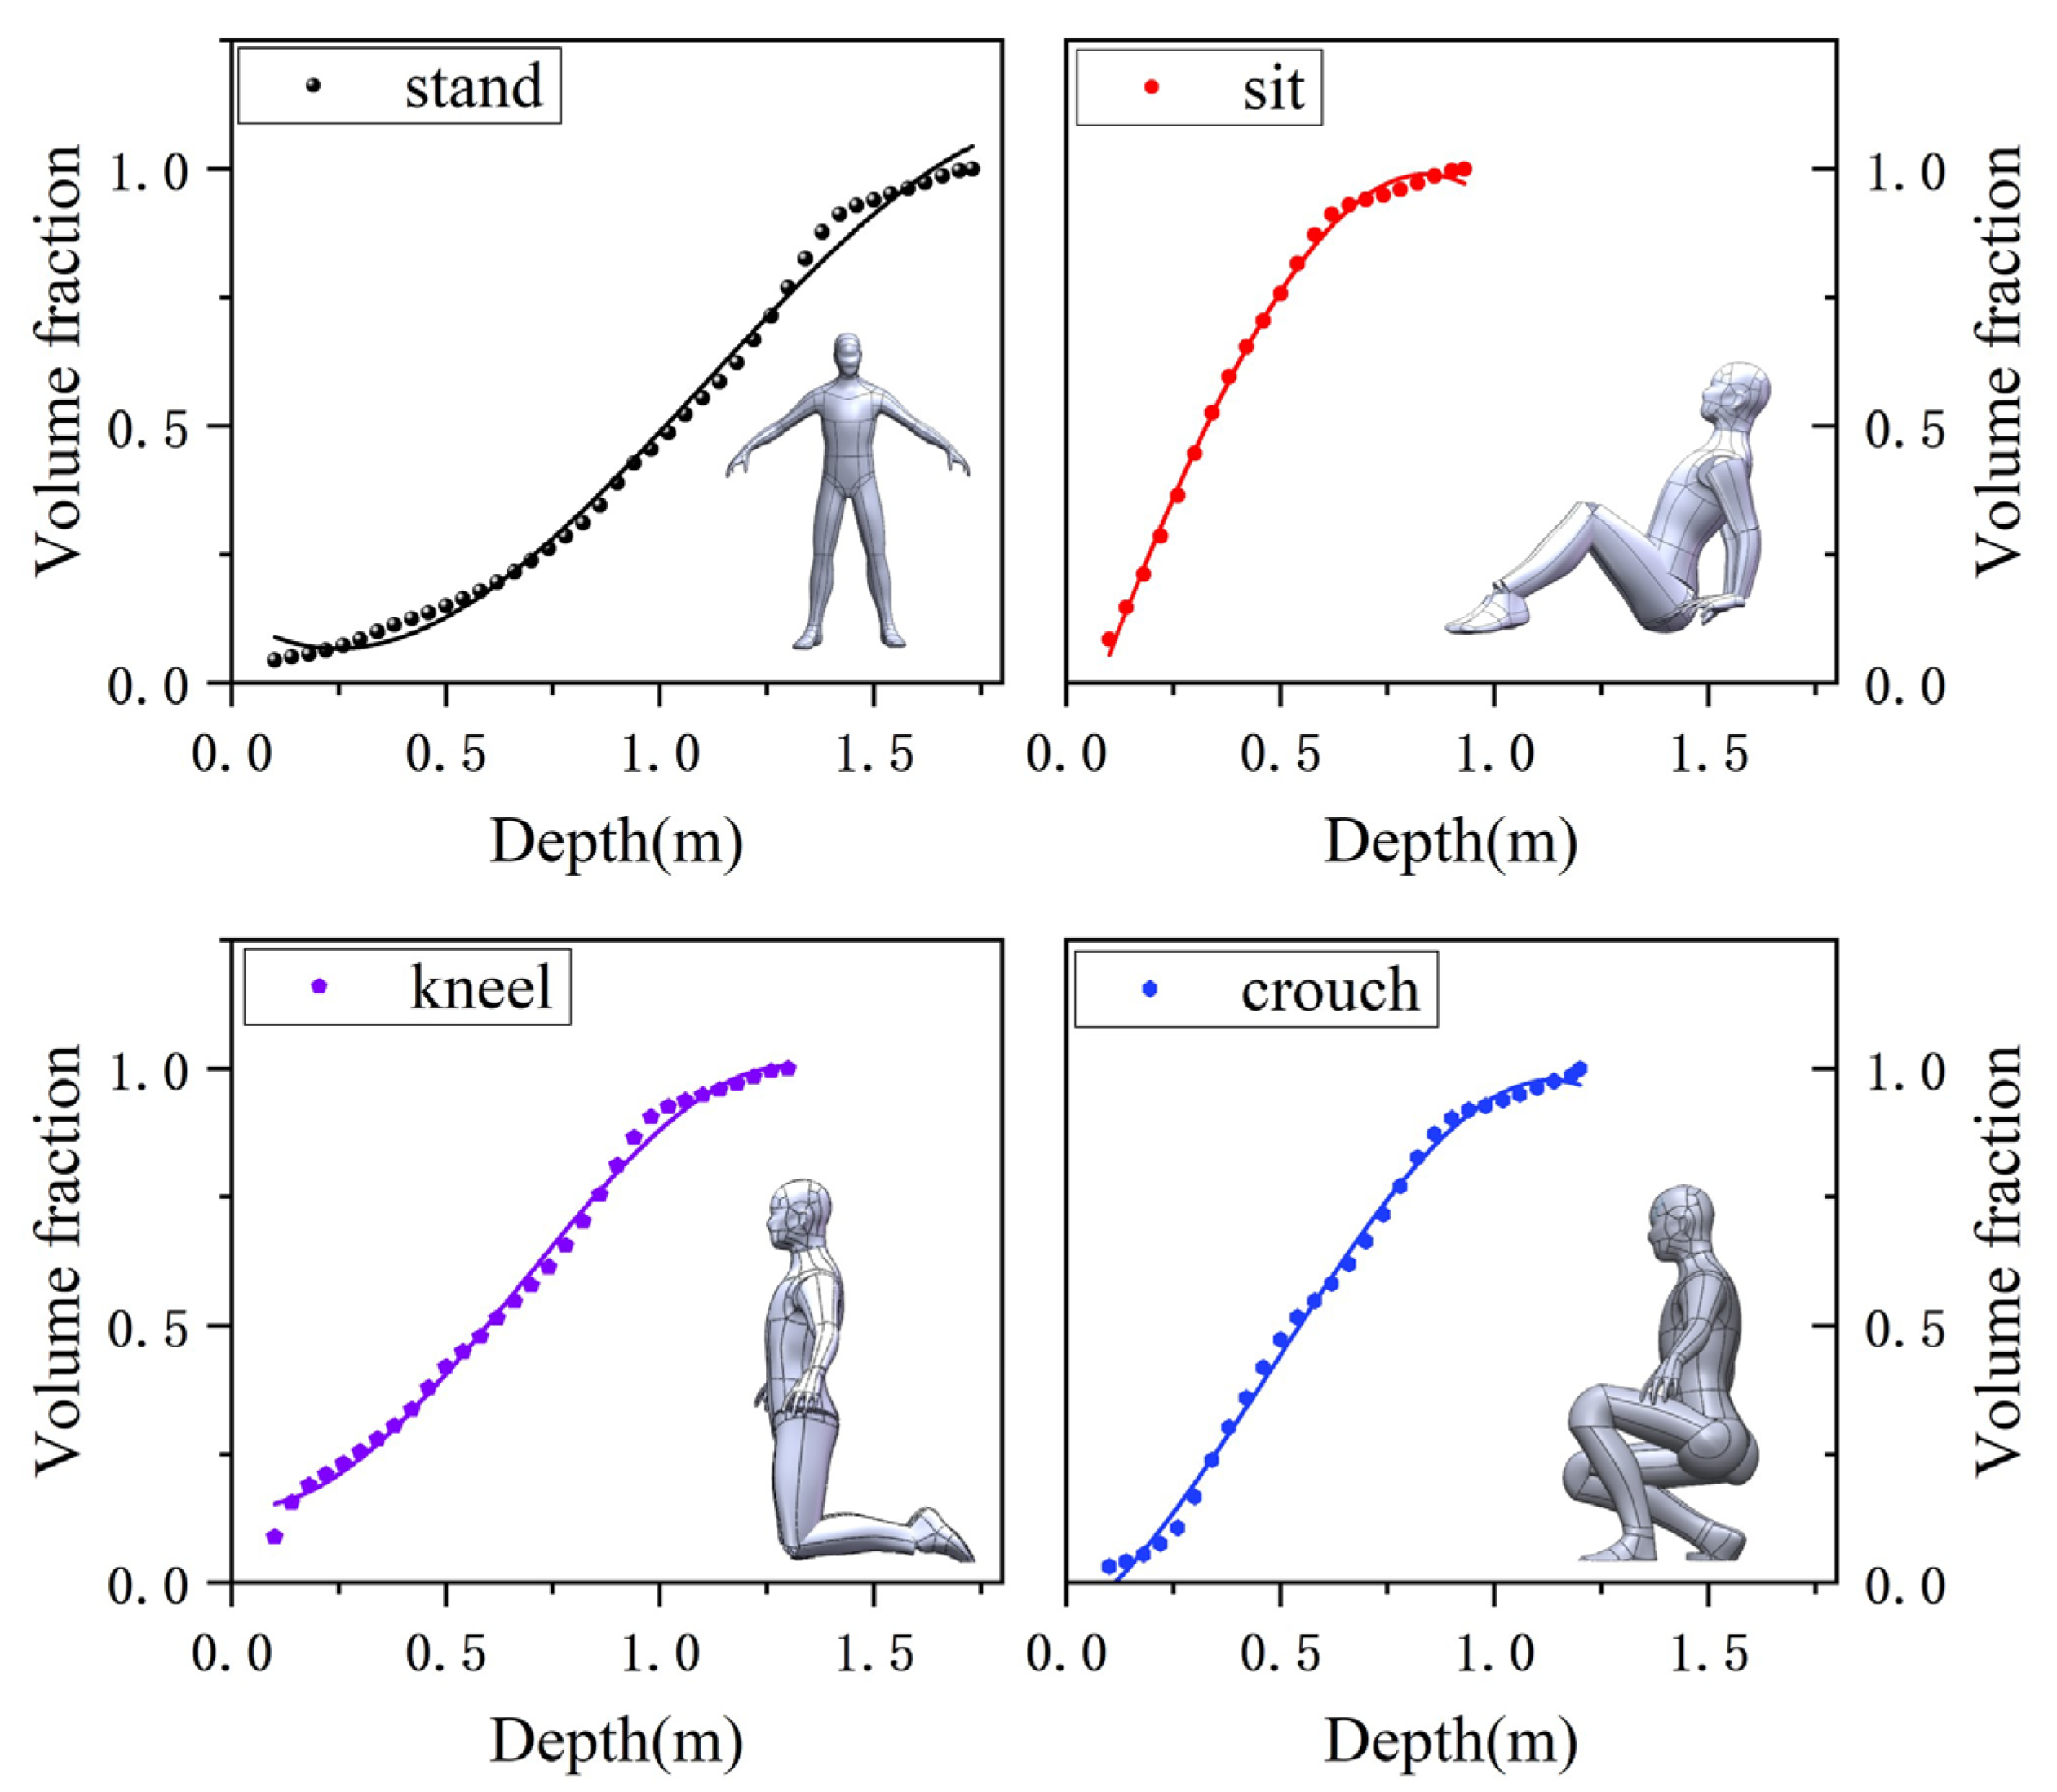
The density of water and the acceleration due to gravity are constant. Therefore, to calculate buoyancy at different water depths, it is necessary to establish a relationship between submerged volume and water depth. However, determining the change in submerged volume with varying water depth for the irregular geometric shape of the human body presents a challenge. This issue becomes particularly complex when analyzing postures other than standing. Previous studies often simplify the human body’s shape by approximating it as a combination of cylinders and prisms, but this approach tends to yield relatively low accuracy. Moreover, certain postures, such as squatting, cannot be easily approximated using combinations of regular geometric shapes. In this study, we address these challenges by employing 3D modeling in specialized software to accurately represent the human body. Subsequently, we utilize the software’s volume calculation function to establish the precise relationship between submerged volume and water depth. The specific modeling process can be found in the Supplementary Materials S1.
In the software, by slicing the human body model at different water depths, the variation in the volume ratio with height can be determined. This process results in four fitted curves (Equations (3)–(7)) that show how the submerged volume changes with depth, thereby determining the buoyancy exerted on the human body. The calculation results are shown in the curve in Figure 2.
Although there are some differences in the fitted curves and data points, this is acceptable and more accurate than past research that used cylinders or other geometries instead of the human body. The expressions for the variation in the submerged volume ratio with water depth in various postures are derived as follows (see Table 2).
3.3. Friction Analysis
3.3.1. Friction Calculation Method
In a water flow, the human body exerts pressure on the ground due to the action of gravity. If the water flow applies a pushing force against the body (creating a tendency to slide backward), friction will be generated at the contact surface between the body and the ground. This frictional force is the decisive factor in maintaining the stability of the body in the water. The formula for calculating it is as follows:
The friction force is equal to the effective weight (weight minus buoyancy ) multiplied by the static friction coefficient . The gravity () and buoyancy () in the above equation are known, so the determination of the friction coefficient becomes the key to the calculation of friction.
3.3.2. The Determination of Friction Coefficient under Wet Conditions
Obviously, the friction coefficient between materials like ceramic floor tiles and steel plates, and types of footwear, such as sports shoes and canvas shoes, significantly decreases when the support surface is wet. However, in the human postures targeted in this study, such as sitting and kneeling, the main weight of the body is concentrated on the buttocks and legs. In these cases, it is the pants that contact the ground. Therefore, in addition to shoes, it is also necessary to determine the static friction coefficient between wet pants and the ground. Currently, there is no data disclosed on this, and so experimental determination is required (Supplementary Material S2).
3.4. Calculation of Drag Force F
In this study, drag is a force acting opposite to the relative motion of human body moving with respect to the surrounding flooding water. It exists between water and a body surface, including (1) form or pressure drag due to the size and shape of a body, and (2) skin friction drag or viscous drag due to the friction between water and the body. The formula of the drag force is as follows:
Based on previous research conclusions [35,36]; it is believed that speed and water depth are the main bases for assessing risk, and are considered known factors; the frontal area, , facing the flow depends on water depth and human body data, which can be obtained through human body modeling (Figure 3), and can be fitted into a function of water depth(see Table 3); the disturbance caused by the human body in water is a typical blunt body disturbance. The drag coefficient is related to the shape and size of the submerged part of the body and is less related to the flow velocity around it. Its value is obtained through the following numerical simulations.
When calculating drag from flow disturbances, the first step is to determine whether the water flow is in laminar or turbulent regime. As the Reynolds number increases, transitioning from laminar to turbulent flow, the drag force generally increases due to the greater turbulence and mixing in the flow. At low Reynolds numbers, where flow is laminar, drag force tends to be relatively low and proportional to the square of the velocity. However, in turbulent flow, characterized by chaotic and irregular motion of fluid particles, drag force increases significantly as turbulent eddies create more resistance to the object’s motion through the fluid. It is important to note that the precise relationship between Reynolds number and drag force can vary, depending on factors such as the object’s shape, surface roughness, and other flow conditions.
Due to the irregular geometry of the human body, there is no definitive solution for determining the Reynolds number of water flow around it. Therefore, the Reynolds number for flow around the human body in this study is calculated based on the same water flow conditions as those used for a cylindrical body.
Based on the analysis of numerous cases where pedestrians lose stability in water, it has been found that the flow velocities posing dangers typically range between 0.5–4 . is the dynamic viscosity of the fluid (typically measured in ). The Reynolds number, , can then be calculated according to Equation (9). The Reynolds number is expected to fall within the range of to , which indicates the presence of turbulent flow.
4. Numerical Simulation
The fluid domain is set as a rectangular domain, simulating the common scenario of pedestrians encountering floodwaters on roads. The fluid domain extends 2.5 m in front of the model, 2 m behind, 1.5 m to each side of the model, and 0.05 m above the model’s head, ensuring sufficient space for computational stability. A tetrahedral mesh is used for the fluid domain, with a mesh size of 0.08 m. Given the model’s numerous curves and lines, to avoid excessively long computation times due to capturing too many curved surfaces, virtual topology is employed to merge multiple faces of the same part that are not necessary for the computation into a single face (Figure 4b). Subsequently, the “Body of influence (BOI)” local mesh refinement method is used to create a region around the model in the fluid domain for mesh densification (Figure 4c), extending 1.5 m in front of, 1 m behind, and 0.45 m to each side of the model. The mesh size is controlled at 0.03 m, with local sizing and control applied to the model, setting its surface mesh size to 0.008 m. The SST-K omega model is used for mesh sensitivity analysis, testing three different mesh sizes of the BOI: 0.03 m, 0.02 m, and 0.015 m. The 0.015-m mesh produces a clearer interface, but the difference in the drag coefficient is minimal. Therefore, to ensure computational speed, the 0.03-m mesh size is chosen. The total number of cells varies with the posture, generally ranging between and . Since it is difficult to define the types and elastic conditions of clothing materials, the influence of clothing on the flow around the body is not considered for the time being.
Firstly, the simulation boundary condition for water depth is established. With the upper limit set at 80 cm. Road standards stipulate that passage is prohibited when the water depth exceeds 80 cm, as depths above 80 cm can generally submerge the trunk of an adult male.
The lower limit of water depth was based on the calf length of a child capable of travelling alone. According to the Chinese adult human body size [37] (GB/T 10000/2023), the minimum calf length of Chinese 11–12-years-old female children is 300 mm, assuming that the water depth not exceeding the calf has a relatively low possibility of causing injury to the human body; because of the existence of the study of sitting posture, the upper limit of the study is the height of the head of Chinese adult males in a sitting posture, and at 800 mm of the water can basically be submerged in the head of an adult male—the increase in water depth after the submergence is not very meaningful for the stability of the sitting posture. Moreover, this study only examines the characteristics of the forces on the human body, and ultimately derives formulas that are applicable to a wide range of situations based on the laws of force application.
Therefore, the study discusses water depths between 30–80 cm as the reference for setting boundary conditions. Although the variation in flow rate significantly impacts the drag coefficient around the body, it is still essential to replicate the flow speed at the point of instability as closely as possible for accurate calculations. To ensure the precision of the calculations, it is necessary to estimate the flow speed threshold at which the human body becomes unstable at different water depths. These estimations are then used as the standard for setting the simulation’s inlet boundary conditions. The specific values are based on the risk curves for road overflow detailed in an article published by Xia and others [22], which delineates the combinations of water depth and flow speed that pose a risk to humans. Table 4 lists the flow speed and water depth data used for the numerical simulations.
The simulations were conducted using FLUENT, employing a pressure-based solver for transient analysis. The multiphase flow model was activated with the open channel flow boundary condition selected. An implicit solver was used, enabling interface sharpening and implicit body forces. The SST K-OMEGA model was chosen for the viscosity model.
The simulation considers two phases: water and air, with air designated as the primary phase and water as the secondary phase. Surface tension is configurable in the set-tings, though it has a negligible effect in the studied scenarios. Boundary conditions are set for both inlet and outlet. The inlet boundary is set as a velocity inlet with open channel wave boundaries enabled. The coordinates of the channel bottom and the free surface are set perpendicular to the direction of gravitational acceleration. The outlet is similarly configured to the inlet, with open channel flow and coordinates set for the channel bottom and the free surface.
Given the substantial difference in densities between water and air in this scenario, using an average density as the reference would lead to significant errors. Therefore, the density of air is set as the reference density in FLUENT, where the lighter phase is typically used as the reference. Through analysis of previous simulation methods for calculating flow resistance, we have found that the SST-K omega model is the most suitable among various models for this calculation condition, as it is commonly applied in the calculation of drag coefficients. A number of studies have used this method to calculate the drag on cylinders, demonstrating the feasibility of this approach [38,39,40,41].
The numerical results are analyzed in terms of flow characteristics and hydrodynamic forces. For the sub-critical flow condition, the flow is disturbed upstream of the human body, where a slight deceleration occurs. Vortices occur immediately downstream of the obstacle (Figure 5a,e). For super-critical flows, a significant splashing area is detected in correspondence with the impact zone (Figure 5c).
The sitting posture displayed is from the simulation at a water depth of 0.8 m (Figure 5d). It is evident that, at this depth, even though the person tries to lift their head, the water flow can still submerge the top of the head, corroborating the rationale behind choosing 80 cm as the upper limit for the simulated water depth, which explains why the for sitting is not monotonically increasing. Figure 6 shows the drag coefficient as a function of water depth and posture. Equations (14)–(17) represent the empirically fitted formulas for the drag coefficients(see Table 5).
As a pioneering study in the multi-posture force analysis, the focus of this research is on analyzing the differences in the ability of the human body in various postures to resist water flow. Chiara’s study [25] also mentions that adjustments in posture have a significant impact on the safety threshold for human bodies subjected to water flow impacts.
5. Destabilization Analysis
In a state of instability in water, self-rescue efforts by a human body require the fulfillment of two prerequisites: first, the ability to maintain stability in a standing posture; and second, the capability to adjust posture under the impact of water flow.
5.1. Slide Destabilization
Being swept away by water can be understood as slipping and losing stability, which mechanically manifests as the drag force from the flow exceeds the maximum static friction between the human body and the ground. At this point, slipping or being swept away occurs. Subsequently, since sliding friction is less than the maximum static friction, it becomes very difficult for a person to self-rescue through their actions under constant water flow conditions. This can be expressed using the formula:
Clearly, for standing and squatting postures, the friction coefficient should be based on the static friction coefficient between the wet soles of shoes and the ground; for kneeling and sitting postures, the static friction coefficient of wet pants should be used. In the formulas, the human body density and water density are numerically very close, so a unified value of 998.2 kg/m3 is used here, with a 60 kg human body having a volume of 0.060 m3.
The calculations using a body type of 1.75 m and 60 kg are not universally applicable, hence the introduction of the height ratio scale . The ratio of height, frontal area, volume, and other geometric quantities to those of the computed human body establish a relationship with . The total volume ratio should be the cube of , and the frontal area ratio should be the square of . However, when calculating the frontal area, as the height changes, the height of the frontal area remains the water depth, which does not change. Therefore, the ratio of the frontal area is to the first power of . Similarly, the submerged volume ratio is to the square of . Subsequently, by substituting these relationships into the expression, the formula for the resistance of human bodies of different heights and postures to water flow impacts can be derived.
Substituting the ratio and area of said and into Equation (20) and simplifying gives:
This formula is applicable for calculating human stability in floods within a water depth range of to meters, to ensure that the human body is not completely submerged in water.
From this, the correspondence between the flow velocity and the water depth when the force of the winding group is equal to the friction force is plotted, as shown in Figure 7a.
Figure 7a shows that the standing posture offers excellent resistance to sliding instability, making sliding instability very unlikely to occur. Existing research also rarely reports sliding instability in a standing position. This is because the coefficient of friction is similar across all postures, but the submerged volume in the standing position is the smallest. As a stabilizing factor, the frictional force is greatest in the standing posture, and its shape is the simplest, resulting in the least drag when water flows around it. In contrast, the sitting posture, due to its more complex shape and the largest submerged volume at the same water depth, has the weakest resistance to sliding.
5.2. Toppling Destabilization
In self-rescue, the human body, apart from slipping and losing stability, also faces the possibility of overturning instability. This can be understood as the body being unable to maintain its current posture, due to the excessive overturning torque caused by the water flow impact, leading to a secondary fall in the water. The difference between this and slipping instability is that the former occurs due to insufficient friction, resulting in being directly swept away by the water flow. In contrast, the latter is due to the current posture becoming untenable under the water flow, leading to instability and a fall. This increases both the frontal area and the submerged volume, followed by slipping and being swept away, resulting in the loss of self-rescue capability. Since overturning involves a transition from other postures to a sitting position, there is no overturning in the sitting posture, only slipping (Figure 8).
Overturning instability occurs when the overturning torque caused by the drag force exceeds the stabilizing torque provided by gravity. The overturning torque is equal to the product of the drag force and the overturning arm. The overturning arm is the distance from the point of action of the drag force to the ground. The stabilizing torque is the product of the supporting force and the stabilizing arm.
where is the arm of drag force and is the arm of weight , which can be obtained by simplifying the above equation:
The value of is approximately half the water depth; the value of is equal to the distance between the ground projection of the body’s center of gravity p and the rearmost point of support o of the body (Figure 1(a1)). For a fixed individual, the stabilizing arm is solely related to the body’s center of gravity and is independent of the water depth, making it a constant value. However, the stabilizing arm varies linearly with changes in the height ratio scale as the individual’s dimensions change. This can be determined for different postures using the center of gravity measurement in modeling software, with the results summarized in Table 6.
Substituting the expressions and coefficients for each force into Equation (26), the followin can be obtained:
By substituting all the coefficients, i.e., expressions, into Equation (27), an expression for the correspondence between flow velocity and water depth for the four attitudes can be derived:
This formula is applicable for calculating human stability in floods within a water depth range of to meters, which helps to ensure that the human body is not completely submerged in water.
Topping instability is difficult to occur in the kneeling position because the stabilizing force arm length in the kneeling position is the entire calf plus the length of the foot, and topping is relatively easy to occur in the standing position versus the squatting position (Figure 7b).
5.3. Comparison with Existing Studies
5.3.1. Verification of the Derivation Formula
Since no one has analyzed the possibility of self-rescue after being destabilized in a flood, only the derivation formula for overturning destabilization in the standing condition is currently verified for its approximation to the results of existing studies (Figure 9).
It is evident that, at high water depths, the data from this study align closely with the real-life experimental results conducted by Abt (1989) [19] and Karvonen (2000) [20], Additionally, the impact data curves for children derived through the reduction of the height ratio scale also align well with the experimental results of Yee (2003) [30]. This preliminarily demonstrates the feasibility of the method proposed in this study.
5.3.2. Rational Analysis of Height Scale Scaling
To further validate the reasonableness of the model scale calculations described in the formula, previous experimental studies were referenced to subdivide the capability of resisting water flow impacts based on different heights ( in m) and masses ( in kg). This approach yielded results for the product () of water depth ( in m) and the tolerable flow velocity ( in m/s) under different products () of height and mass. By modifying in the formula to alter the corresponding body type, the calculated values of that the human body can withstand were compared with data from prior studies [43].
The red data points represent the computational results of this study for different scale ratios. It can be observed that at the smaller scale of children in Figure 10, the computational results align well with Foster’s experimental data. At conventional scales [28], such as height and mass product (m·kg), the data obtained from the calculations show a high degree of agreement with Abt’s experimental data, sufficient to justify the introduction of as a computational correction method. However, when the human body , Abt’s experimental data [19] show a strong dispersion, and the correlation between the body’s ability to resist the impact and the product of height and mass, , significantly deteriorates. This may be due to a greater variety of body compositions at higher values, such as shorter people with higher mass and well-proportioned, muscular individuals. These two categories might have similar values but exhibit significant differences in physical capabilities. However, considering that the study aims to provide early warnings for the danger of flooded roads, data from individuals with larger values are generally not utilized as a basis for warning assessments.
5.4. Comprehensive Analysis of Self-Rescue Capabilities
The two curves in Figure 11 delineate three distinct regions within the flooding water flow (Based on the siting slipping shown in Figure 7). The lower curve represents the risk curve for slipping in a seated position, while the upper curve indicates the risk curve for instability in any posture other than sitting (based on the minimum values in the curves shown in Figure 7 for all curves except sitting). Based on the preceding analysis, when an individual falls backward in water, they typically commence the self-rescue process from a seated position. In such a scenario, the water flow conditions in the orange region pose a significant risk. However, given the likelihood of adjusting one’s posture to avoid falling into a seated position during instability in floodwaters, this phase cannot fully represent the risk of falling in all scenarios. To ensure a comprehensive study and consider that in real-life situations people often fall forward, the kneeling posture is regarded as the initial phase of the self-rescue process. This is followed by potential transitions from kneeling to squatting and then to standing. In these instances, individuals who fall forward are unlikely to transition to a seated position for self-rescue. Consequently, using a seated posture to represent the extreme limit of self-rescue in water seems overly conservative.
When people fall forward if the risk of instability in a seated posture is not considered, the probabilities of slipping and capsizing in the other three postures are evaluated. The posture presenting the highest risk is identified as the limit of human self-rescue stability. According to the calculations, in conditions of low water depth and high flow velocity, slipping is most likely to occur first in a kneeling posture. This tendency can be attributed to the fact that at low water depths, the submerged volume and frontal area are the largest in the kneeling posture, with a drag coefficient similar to that of squatting. As the water depth increases, the submerged volume and drag coefficient of the squatting posture also increase, leading to heightened buoyancy. Additionally, the friction coefficient of the soles of shoes is slightly lower than that of common pants, making the squatting posture the riskiest among the three.
Ultimately, as water depth continues to rise, the risk of capsizing in the squatting posture becomes more pronounced. At this stage, instability may result in a transition from squatting to sitting, signifying a significant loss of self-rescue capability. Therefore, the upper-right three segments of the curves in Figure 11 can be interpreted as the limit of self-rescue capability for the typical human body in cases of accidental instability. The red region in the upper-right signifies the “unrecoverable” zone, the orange region between the two lines represents the “self-recoverable zone through posture adjustment”, and the green region in the lower-left is deemed the safe zone.
6. Comments about the Utility of This Research
In the aforementioned section, we presented the anti-instability capabilities of different postures under various flow velocities and water depths. We hope these conclusions can aid individuals affected by flood disasters to determine which posture to adopt to withstand the impact of water currents after destabilization, thereby increasing the chances of successful self-rescue, or to plan and choose the optimal escape routes based on different road risks.
Public knowledge of risk management in flood situations is limited, and the government plays a crucial role in flood management. Beyond monitoring and forecasting, conducting lectures on avoiding disaster and safety self-rescue during floods is also vital; in this respect, the government acts as a bridge between researchers and the public. Additionally, in areas prone to frequent flooding, the government could consider developing and installing flood warning systems along roadways, which could autonomously assess risks and provide warnings to nearby individuals, helping to reduce or avoid the risks posed by floods. Overall, the dissemination of knowledge related to flood disasters and the work of the government should proceed simultaneously, as efforts from only one side are insufficient to perfect and strengthen flood disaster control and management systems.
Mastering the mechanisms and criteria for instability of the human body in various postures during floods is fundamental for linking rainfall and flood monitoring data with pedestrian risk warnings. Only through more rational flood risk assessment standards and the use of advanced flood warning devices can effective guidance be provided to pedestrians to avoid flood risks. Therefore, researching and improving flood disaster risk assessment models is not only a need for academic exploration but is also an indispensable component of practical applications.
7. Conclusions
The calculation of human body stability under flood conditions is an important aspect of urban flood risk assessment. Extensive research indicates that, during floods, drowning incidents are not majorly due to the static phase of the human body in water, as being static in water places one in a more dangerous situation. Only by seeking self-rescue can one possibly survive the risk of flooding. Currently, flood risk assessment relies on the product of depth and velocity (), but this standard is empirical and neglects human body characteristics, which are the main factors affecting human body stability in floods. This paper explores the relationship between main human body parameters, water depth (submersion volume and frontal area) and fixed characteristics (friction coefficient, stability arm), and does this through modeling and studying the main characteristics that affect the calculation results.
The 3-D model introduced in this paper is simplified; however, through the assessment of hydraulics and corresponding coefficients, it determines that the seated slipping posture is the riskiest in the process of self-rescue in water. The study also identifies the riskiness of other unstable postures besides the seated posture, which is based on posture coefficients. The human body in this study is simulated as rigid, and it described by detailed three-dimensional triangular geometry; a total of 24 numerical simulations were then conducted, covering disaster-occurring water depths in floods (0.3–0.8 m) to demonstrate the impact on four different postures under the same flow conditions. The numerical simulation also restores the force situations in different postures. Instability and self-rescue of the human body in water is a complex dynamic process; however, due to research constraints, this paper only decomposes the process into different postures for static simulation study. Subsequent research should involve experiments with models in various postures and costumes to obtain more objective and accurate mechanical data, ultimately providing a basis for water risk early warning.
This paper provides a detailed formulaic expression of the physical process of human instability in water through hydrodynamic concepts, making the judgment of instability in floods physically meaningful. It also offers a new method for assessing the danger to individuals in floods. The research on post-instability self-rescue in floods is based on studies of different flood disaster videos, comparing the preparedness for water flow impact; it is the unexpected instability that is more likely to occur in floods. This research is an example of transitioning the numerical study of human stability in water from static to dynamic, and it also looks forward to more dynamic studies in the future.
Supplementary Materials
The following supporting information can be downloaded at: https://www.mdpi.com/article/10.3390/w16091218/s1, S1. Construction of a manikin; S2. The determination of friction coefficient under wet conditions. Figure S1: (a) Parameterized dimensional drawings of standard human body parts (HP stands for “GB/T 10000-2023, national standard”) (b) Schematic diagram of human body modeling.; Figure S2: Types of flooring materials and clothing materials used in the test. Figure S3. (a) Principle of Friction Coefficient Experiment (b) Experimental site photos. Table S1: Measured friction coefficients between shoes or pants in the wet or dry state and four types of the road surfaces.
Author Contributions
Conceptualization, X.G. and W.W.; methodology, W.W.; software, X.G.; validation, W.W. and J.L.; formal analysis, X.G., M.W. and X.L.; resources, W.W.; writing—original draft preparation, X.G.; writing—review and editing, W.W. and X.F.; supervision, J.L. and X.L.; project administration, Y.G. and J.L.; funding acquisition, Y.G. and J.L. All authors have read and agreed to the published version of the manuscript.
Funding
This work was supported by the National Natural Science Foundation of China (52370093).
Data Availability Statement
Data that support the findings of this study are available from the corresponding author, Wenhai Wang, upon reasonable request.
Conflicts of Interest
The authors declare no conflict of interests, and also no possible conflicts of interest.
References
- Wang, W.-J.; Kim, D.; Han, H.; Kim, K.T.; Kim, S.; Kim, H.S. Flood risk assessment using an indicator based approach combined with flood risk maps and grid data. J. Hydrol. 2023, 627, 130396. [Google Scholar] [CrossRef]
- Szoenyi, M.; Venkateswaran, K.; Keating, A.; MacClune, K. After the Flood Is Before the Next Flood: The Post-Event Review Capability Methodology Developed by Zurich’s Flood Resilience Alliance. In Flood Damage Survey and Assessment: New Insights from Research and Practice; Advancing Earth and Space Science (AGU): Washington, DC, USA, 2017; pp. 135–149. [Google Scholar]
- Grimaldi, S.; Schumann, G.P.; Shokri, A.; Walker, J.; Pauwels, V. Challenges, opportunities, and pitfalls for global coupled hydrologic-hydraulic modeling of floods. Water Resour. Res. 2019, 55, 5277–5300. [Google Scholar] [CrossRef]
- Tehrany, M.S.; Pradhan, B.; Jebur, M.N. Flood susceptibility analysis and its verification using a novel ensemble support vector machine and frequency ratio method. Stoch. Environ. Res. Risk Assess. 2015, 29, 1149–1165. [Google Scholar] [CrossRef]
- Widiasari, I.R.; Nugroho, L.E. In Deep learning multilayer perceptron (MLP) for flood prediction model using wireless sensor network based hydrology time series data mining. In Proceedings of the 2017 International Conference on Innovative and Creative Information Technology (ICITech), Salatiga, Indonesia, 2–4 November 2017; pp. 1–5. [Google Scholar]
- Bhutta, Z.A.; Bhutta, S.Z.; Raza, S.; Sheikh, A.T. Addressing the human costs and consequences of the Pakistan flood disaster. Lancet 2022, 400, 1287–1289. [Google Scholar] [CrossRef] [PubMed]
- Koks, E.; Van Ginkel, K.; Van Marle, M.; Lemnitzer, A. Brief communication: Critical infrastructure impacts of the 2021 mid-July western European flood event. Nat. Hazards Earth Syst. Sci. Discuss. 2022, 22, 3831–3838. [Google Scholar] [CrossRef]
- Insurance Council of Australia. Climate Change Impact Series: Flooding and Future Risks; Insurance Council of Australia: Sydney, Australia, 2022; 12p. [Google Scholar]
- Brown, R.; Chanson, H. Turbulence and suspended sediment measurements in an urban environment during the Brisbane River flood of January 2011. J. Hydraul. Eng. 2013, 139, 244–253. [Google Scholar] [CrossRef]
- Chanson, H.; Brown, R.; McIntosh, D. Human body stability in floodwaters: The 2011 flood in Brisbane CBD. In Hydraulic Structures and Society—Engineering Challenges and Extremes, Proceedings of the 5th IAHR International Symposium on Hydraulic Structures (ISHS2014), Brisbane, Australia, 25–27 June 2014; Chanson, H., Toombes, L., Eds.; The University of Queensland: Brisbane, Australia, 2014; pp. 1–9. [Google Scholar]
- Pakistan Meteorological Department. Pakistan Monthly Climate Summary. August 2022. Available online: http://www.pmd.gov.pk/cdpc/PakistanMonthly_Climate_Summary_August2022.pdf (accessed on 6 September 2022).
- UNICEF. Pakistan Humanitarian Situation Report no 3. 20 September 2022. Available online: https://www.uniceforg/media/127711/file/Pakistan-Humanitarian-SitRep-No.3-(Floods)-20-Sep-2022.pdf (accessed on 22 September 2022).
- Asifs UN Chief Calls for “Massive” Help as Pakistan Puts Cost of Pakistan’s Flood Losses at $30 billion. Reuters, 9 September 2022. Available online: https://www.reuters.com/world/asia-pacific/un-chief-guterres-arrives-pakistan-support-flood-response-2022-09-09 (accessed on 20 September 2022).
- Wang, K.; Wang, L.; Wei, Y.-M.; Ye, M. Beijing storm of July 21, 2012: Observations and reflections. Nat. Hazards 2013, 67, 969–974. [Google Scholar] [CrossRef]
- Zhao, Z.; Zhang, B.; Wu, F.; Yang, J. In Deep Learning-Based Flood Detection Using Multi-Temporal Sentinel-1 SAR Data: A Case Study in Beijing Area, 2023. In Proceedings of the 2023 SAR in Big Data Era (BIGSARDATA), Beijing, China, 20–22 September 2023; pp. 1–4. [Google Scholar]
- Zhang, X. A rapid disaster intensity assessment method using social media data: A case study of the flood disaster in the Beijing-Tianjin-Hebei region. In Proceedings of the EGU General Assembly 2024, Vienna, Austria, 14–19 April 2024. [Google Scholar]
- Aboelata, M.; Bowles, D.S. LIFESim: A tool for estimating and reducing life-loss resulting from dam and levee failures. In Proceedings of the Association of State Dam Safety Officials “Dam Safety”, Indian Wells, CA, USA, 7–11 September 2008; pp. 533–574. [Google Scholar]
- Chakraborty, J.; Tobin, G.A.; Montz, B.E. Population evacuation: Assessing spatial variability in geophysical risk and social vulnerability to natural hazards. Nat. Hazards Rev. 2005, 6, 23–33. [Google Scholar] [CrossRef]
- Abt, S.; Wittier, R.; Taylor, A.; Love, D. Human stability in a high flood hazard zone 1. JAWRA J. Am. Water Resour. Assoc. 1989, 25, 881–890. [Google Scholar] [CrossRef]
- Karvonen, R.; Hepojoki, H.; Huhta, H.; Louhio, A. The Use of Physical Models in Dam-Break Flood Analysis, Development of Rescue Actions Based on Dam-Break Flood Analysis (RESCDAM); Final Report of Helsinki University of Technology; Finnish Environment Institute: Helsinki, Finland, 2000. [Google Scholar]
- Jonkman, S.; Penning-Rowsell, E. Human instability in flood flows 1. JAWRA J. Am. Water Resour. Assoc. 2008, 44, 1208–1218. [Google Scholar] [CrossRef]
- Xia, J.; Falconer, R.A.; Wang, Y.; Xiao, X. New criterion for the stability of a human body in floodwaters. J. Hydraul. Res. 2014, 52, 93–104. [Google Scholar] [CrossRef]
- Love, D.; McGuire, J.; Taylor, A.; Birch, D. Analysis of a High-hazard Flood Zone. In Floodplain Harmony; The Natural Hazards Research and Applications Information Center Institute of Behavioral Science: Boulder, CO, USA, 1988. [Google Scholar]
- Milanesi, L.; Pilotti, M.; Ranzi, R. A conceptual model of people’s vulnerability to floods. Water Resour. Res. 2015, 51, 182–197. [Google Scholar] [CrossRef]
- Arrighi, C.; Oumeraci, H.; Castelli, F. Hydrodynamics of pedestrians’ instability in floodwaters. Hydrol. Earth Syst. Sci. 2017, 21, 515–531. [Google Scholar] [CrossRef]
- Di Mauro, M.; De Bruijn, K.M.; Meloni, M. Quantitative methods for estimating flood fatalities: Towards the introduction of loss-of-life estimation in the assessment of flood risk. Nat. Hazards 2012, 63, 1083–1113. [Google Scholar] [CrossRef]
- Siegrist, M.; Gutscher, H. Natural hazards and motivation for mitigation behavior: People cannot predict the affect evoked by a severe flood. Risk Anal. Int. J. 2008, 28, 771–778. [Google Scholar] [CrossRef] [PubMed]
- Foster, D.; Cox, R. Stability of Children on Roads Used as Floodways; Technical Report No.73/13; University of New South Wales Water Research Laboratory: Manly Vale, Australia, 1973. [Google Scholar]
- Takahashi, S.; Endoh, K.; Muro, Z. Experimental Study on People’s Safety against Overtopping Waves on Breakwaters; Report on the Port and Harbour Institute: Yokosuka, Japan, 1992; Volume 34, pp. 4–31. [Google Scholar]
- Yee, M. Human stability in floodways. Undergraduate Honors Thesis, School of Civil and Environmental Engineering, University of New South Wales, Sydney, Australia, 2003. [Google Scholar]
- Russo, B.; Gómez, M.; Macchione, F. Pedestrian hazard criteria for flooded urban areas. Nat. Hazards 2013, 69, 251–265. [Google Scholar] [CrossRef]
- Chanson, H.; Brown, R. Stability of individuals during urban inundations: What should we learn from field observations? Geosciences 2018, 8, 341. [Google Scholar] [CrossRef]
- Becker, J.; Taylor, H.; Doody, B.; Wright, K.; Gruntfest, E.; Webber, D. A review of people’s behavior in and around floodwater. Weather. Clim. Soc. 2015, 7, 321–332. [Google Scholar] [CrossRef]
- Milanesi, L.; Pilotti, M.; Bacchi, B. Using web-based observations to identify thresholds of a person’s stability in a flow. Water Resour. Res. 2016, 52, 7793–7805. [Google Scholar] [CrossRef]
- Zhang, X.; Yan, J.; Zhao, J.; Wang, Y.; Pan, Q. Vertical force acting on partly submerged spindly cylinders. AIP Adv. 2014, 4, 047118. [Google Scholar] [CrossRef]
- Arslan, T.; Malavasi, S.; Pettersen, B.; Andersson, H.I. Turbulent flow around a semi-submerged rectangular cylinder. J. Offshore Mech. Arct. Eng. 2013, 135, 041801. [Google Scholar] [CrossRef]
- GB/T 10000-2023; Human Dimensions of Chinese Adults. State Administration for Market Regulation: Beijing, China, 2023.
- Ahmad, M.F.; Haniffah, M.R.M.; Kueh, A.; Kasiman, E.H. In Numerical study on drag and lift coefficients of a marine riser at high Reynolds number using COMSOL multiphysics. IOP Conf. Ser. Earth Environ. Sci. 2020, 476, 012075. [Google Scholar] [CrossRef]
- Karim, M.M.; Rahman, M.; Alim, M.A. Performance of SST k-ω turbulence model for computation of viscous drag of axisymmetric underwater bodies. Trans. B Appl. 2011, 24, 139–146. [Google Scholar]
- Qiu, W.; Lee, D.-Y.; Lie, H.; Rousset, J.-M.; Mikami, T.; Sphaier, S.; Tao, L.; Wang, X.; Magarovskii, V. Numerical benchmark studies on drag and lift coefficients of a marine riser at high Reynolds numbers. Appl. Ocean. Res. 2017, 69, 245–251. [Google Scholar] [CrossRef]
- Yakkundi, V.K.; Mantha, S. Computational Analysis of “Drag & Lift” of a car With K-ε std, and K-ω SST (Shear Stress Transport) Turbulence Models & Effect of Mesh Refinement. CURIE J. 2010, 3, 117–129. [Google Scholar]
- Xia, J.Q.; Dong, B.L.; Zhou, M.R. Research Progress on Human Instability Mechanism and Discrimination Criteria in Urban Floods. Adv. Water Sci. 2022, 33, 153–163. (In Chinese) [Google Scholar]
- Cox, R.; Shand, T.; Blacka, M. Australian Rainfall and Runoff Revision Project 10: Appropriate Safety Criteria for People; Water Research Laboratory: Manly Vale, Australia, 2010. [Google Scholar]
Figure 1.
(a–e) The process of human self-rescue in floods (a1) Schematic diagram of the forces on the human body in water.
Figure 1.
(a–e) The process of human self-rescue in floods (a1) Schematic diagram of the forces on the human body in water.

Figure 2.
The Relationship between Submerged Volume and Water Depth.

Figure 3.
Correspondence between headwater area and water depth.

Figure 4.
Computational mesh around the human body (a) Manikin (b) Virtual topology (c) Computational mesh around the human body.
Figure 4.
Computational mesh around the human body (a) Manikin (b) Virtual topology (c) Computational mesh around the human body.

Figure 5.
Numerical simulation plots for different attitudes. (a) crouch side view (b) crouch frontal view (c) kneel frontal view (d) sit side view (e) stand frontal view .
Figure 5.
Numerical simulation plots for different attitudes. (a) crouch side view (b) crouch frontal view (c) kneel frontal view (d) sit side view (e) stand frontal view .

Figure 6.
Fitted curves of variation with water depth.

Figure 7.
Instability risks in different postures (a) sliding (b) toppling.

Figure 8.
Schematic diagram of capsizing in water.

Figure 9.
Relationships between the water depth and corresponding incipient velocity for a model human body at instability of toppling [10,19,20,22,30,31,42].

Figure 10.
Comparative graph of (m2/s) versus (mkg) for several studies concerning human stability in waterways (modified from Shand et al., 2010) [19,20,21,28,29,30,43].

Figure 11.
Instability scenarios under varying water flow conditions.


Table 1.
Summary of Human Stability Experiments in Existing Floods.
| Setup | Surfaces | Slope | Subject Characteristics | Subject Action | Failure Mechanism | H × M | |
|---|---|---|---|---|---|---|---|
| [19] | flume | Concrete, turf, gravel, and steel. | 0.8% 2.9% | Children | Standing walking turning | loose footing | 62–172 |
| [20] | Moving platform through basin | Steel grating | 0% | Rescue workers with safety equipment | Standing walking | loose footing | 77–195 |
| [21] | flood relief channel | Concrete | 1% | Professional stuntman | Standing walking | loose footing | 116 |
| [28] | flume | Painted timber | 0% | Children | Standing walking, turning | feels unsafe or loses footing | 32–53 |
| [29] | Funnelled basin | Metal load cell | 0% | Adult | Standing | loose footing | 106–133 |
| [30] | Flume | Painted timber | 0% | Children | Standing walking | feel unsafe loose footing | 20–32 |
| [31] | sidewalks | Concrete | 2% | Adult and children | walking turning | loose footing | 48–120 |
| [32] | flood | Concrete | 0% | Adult | Standing walking | loose footing | 129–210 |
Notes: H-M is the product of height and weight in m·kg.
Table 2.
Relationship between submerged volume and water depth.
| Postures | Fitting Curve Equations | ||
|---|---|---|---|
| Stand | 0.994 | (3) | |
| Kneel | 0.996 | (4) | |
| Sit | 0.998 | (5) | |
| Crouch | 0.996 | (6) |
Notes: where is the ratio of submerged volume to total volume, and is the water depth in meters.
Table 3.
Relationship between frontal area and water depth.
| Posture | Fitting Curve Equations | ||
|---|---|---|---|
| Stand | 0.999 | (10) | |
| Kneel | 0.998 | (11) | |
| Sit | 0.990 | (12) | |
| Crouch | 0.999 | (13) |
Table 4.
CFD Boundary Condition Setting.
| Simulation Boundary Condition | ||||||
|---|---|---|---|---|---|---|
| Depth (m) | 0.3 | 0.4 | 0.5 | 0.6 | 0.7 | 0.8 |
| Velocity (m/s) | 2.97 | 2.49 | 2.16 | 1.90 | 1.70 | 1.52 |
Table 5.
Relationship between and water depth.
| Posture | Fitting Curve Equations | ||
|---|---|---|---|
| Stand | 0.947 | (14) | |
| Kneel | 0.918 | (15) | |
| sit | 0.950 | (16) | |
| crouch | 0.970 | (17) |
Table 6.
Value of force arm length.
| Arm of Weight (m), Lw | Arm of Winding (m), LD | ||
|---|---|---|---|
| stand | kneel | crouch | All poses are identical |
| 0.0433 | 0.33478 | 0.1906 | D/2 |
Disclaimer/Publisher’s Note: The statements, opinions and data contained in all publications are solely those of the individual author(s) and contributor(s) and not of MDPI and/or the editor(s). MDPI and/or the editor(s) disclaim responsibility for any injury to people or property resulting from any ideas, methods, instructions or products referred to in the content. |
© 2024 by the authors. Licensee MDPI, Basel, Switzerland. This article is an open access article distributed under the terms and conditions of the Creative Commons Attribution (CC BY) license (https://creativecommons.org/licenses/by/4.0/).
Share and Cite
MDPI and ACS Style
Guo, X.; Wang, W.; Fang, X.; Gong, Y.; Li, J.; Wang, M.; Li, X. Analysis of Self-Rescue Possibilities for Pedestrians in the Aftermath of Destabilization during a Flood Event. Water 2024, 16, 1218. https://doi.org/10.3390/w16091218
AMA Style
Guo X, Wang W, Fang X, Gong Y, Li J, Wang M, Li X. Analysis of Self-Rescue Possibilities for Pedestrians in the Aftermath of Destabilization during a Flood Event. Water. 2024; 16(9):1218. https://doi.org/10.3390/w16091218
Chicago/Turabian StyleGuo, Xin, Wenhai Wang, Xing Fang, Yongwei Gong, Junqi Li, Mengying Wang, and Xiaojing Li. 2024. "Analysis of Self-Rescue Possibilities for Pedestrians in the Aftermath of Destabilization during a Flood Event" Water 16, no. 9: 1218. https://doi.org/10.3390/w16091218
Note that from the first issue of 2016, this journal uses article numbers instead of page numbers. See further details here.