
Impacts of Extreme Climate on the Water Resource System in Sichuan Province
1
School of Hydraulic and Electric-Power, Heilongjiang University, Harbin 150080, China
2
Institute of Groundwater in Cold Regions, Heilongjiang University, Harbin 150080, China
*
Author to whom correspondence should be addressed.
Water 2024, 16(9), 1217; https://doi.org/10.3390/w16091217
Submission received: 1 April 2024
/
Revised: 17 April 2024
/
Accepted: 19 April 2024
/
Published: 24 April 2024
(This article belongs to the Section Water and Climate Change)
Abstract
:Based on the data of Sichuan Province from 2007 to 2021, the extreme climate events in Sichuan Province was identified by statistical method, and the coupling coordination degree of water resources-climate system and separate water resource system was analyzed. Based on the difference of coupling coordination degree under these two systems, the influence mechanism of extreme climate factors on the water resource system is analyzed. The results show that the extreme climate types in Sichuan Province gradually transition from extreme drought to extreme precipitation and from extreme low temperature to extreme high temperature. When climate factors are not considered, the coupling coordination degree of the water resource system is generally improved and the distribution is more concentrated. Moreover, the influence of climate factors on the water resource system is not a simple linear relationship.
1. Introduction
In the Sixth Assessment Report of the IPCC [1], “extreme weather events in climate change” has been added, which indicates that extreme climate is happening more and more frequently, and researchers have paid more attention to this issue. Many scholars have analyzed the temporal and spatial changes of extreme climate events [2,3,4] and the effects of extreme climate in a certain region [5,6,7]. Extreme precipitation has a huge impact on agricultural production. Wang et al. [8] analyzed the changes of extreme precipitation in South China by using the machine learning method and concluded that extreme precipitation in South China in recent years decreased from April to May and increased from June to August. It is mainly affected by the ECPC (extreme precipitation circulation pattern), dynamic, and thermodynamic. Li et al. [9] used trend analysis to analyze the global extreme precipitation events and concluded that the proportion of extreme precipitation was on the rise worldwide. Zhu et al. [10] found through research that extreme precipitation has an accelerated effect on nitrate leaching in farmland. Extremely high temperatures pose a great threat to the survival and development of global organisms. Gao et al. [11] believe that after an extremely high temperature occurs, the abundance of the large-animal community in agricultural soil decreases. Yadav et al. [12] believe that high-temperature and heat wave events increase mortality and urban heat island effect. Stoks et al. [13] believe that an extremely high temperature has a great impact on all biological interactions (such as predation, competition, parasitism, etc.). Moreover, many studies have shown that extreme precipitation and high temperature interact [14,15,16], and that the occurrence of heat wave events shortens the time interval of extreme precipitation [17,18,19,20,21]. Extreme drought mainly has a great impact on cultivated land systems and water ecological environments. Under the effect of extreme drought events, ecological functions of crops are inhibited, photosynthetic efficiency and productivity are destroyed [22], and extreme drought also accelerates the discharge of groundwater in floodplain [23]. The simultaneous effect of extremely low temperatures and reduced water content inhibit the respiration of the alpine steppe on the Tibetan Plateau [24]. During the slowdown of global warming, extreme low winter temperature events in Eurasia have a recovery trend [25].
Water resources are indispensable natural resources in the process of social development. The research on water resource systems mainly focuses on two aspects: sustainability [26,27] and carrying capacity [28]. The two major ways of water input and output in the water resource system are precipitation and evaporation, which are mainly affected by climate factors, so climate factors interact with the water resource system [29]. Moses et al. [30] analyzed the effects of wind speed, solar radiation, and relative humidity on the water resources of Okavango Delta through the K-M test method, and the results showed that with the continuous development of climate, the evaporation of water resources in this region would be further increased. Clifton et al. [31] use a model to evaluate the impact of snow cover on the water resources of Blue Mountains in Oregon, USA, and find that in areas with less groundwater resources, the reduction in snow cover and summer rainfall will lead to the reduction in the water supply of aquatic ecosystems and agriculture. Anik et al. [32] studied a large number of references and concluded that Bangladesh faced the challenge of water scarcity due to climate change. Globally, the frequency of extreme climate events is gradually increasing. Wang et al. [33] believe that the global farmland will be exposed to complex drought and heat wave events in the future, which will lead to a continuous increase in agricultural water use in the future. Yang et al. [34] believe that climate change is the main factor leading to population exposure, and it is expected that the population exposure in Asia will be the largest in the future. In this case, it is crucial to ensure the safety of water supply. Therefore, from the global perspective, it is necessary to analyze the impact of extreme climate factors on the water resource system. Since the occurrence and distribution of extreme climate events will vary greatly due to the different topography and geomorphology in the study area, the selection of a small research scope can describe the impact mechanism of extreme climate on the water resource system more accurately.
Based on the above analysis, this paper will analyze the extreme climate events in Sichuan Province from 2007 to 2021, explore the coupling coordination degree of the water resource system when extreme climate events occur, and compare the coupling coordination degree of the water resource–climate resource system and a separate water resource system from 2015 to 2021. The difference between the two is used as an indicator of the degree of influence of extreme climate factors on water resources, aiming to reveal the mechanism of action of climate factors on the water resource system under extreme climate events, and provide a theoretical basis for Sichuan Province to cope with extreme climate events.
2. Materials and Methodology
2.1. Materials
2.1.1. Study Area
With a total area of 48.6 km2 and a jurisdiction over 21 prefectures, Sichuan Province lies between 26°03′~34°19′ north latitude and 97°21′~108°12′ east longitude (Figure 1). The topography of Sichuan Province varies greatly, with a high elevation in the east and a low elevation in the west. It is composed of mountains, hills, plains, basins, and plateaus. The main rivers in Sichuan Province are the Yellow River, the Yangtze River, Yalong River, Jinsha River, Minjiang River, Dadu River, and so on.
2.1.2. The Index System
The evaluation is mainly constructed by the climate system and water resource system, in which the water resource system is divided into the water quantity subsystem, water supply subsystem, and water quality subsystem. After studying the previous references [35,36,37,38,39,40,41] and testing the data consistency, 3 indicators were selected for each subsystem, and a total of 12 indicators were selected to calculate the coupling coordination degree. The specific selected indicators are shown in Table 1.
It is worth noting that in previous studies, scholars included rainfall in other subsystems. For example, Xu et al. [42] included it in the water subsystem, Tao et al. [43] included it in the water resource situation subsystem, and Xu et al. [44] included it in the ecological subsystem. However, rainfall was included in the climate subsystem in this paper.
2.1.3. Sources of Data
The data selected for this paper are mainly from the Sichuan Statistical Yearbook [45], Sichuan Meteorological Bulletin [46], Sichuan Water Resources Bulletin [47], and Sichuan Environmental Bulletin [48] for the years 2007–2021, as well as the Water Resources Bulletin and the Statistical Yearbook for the 21 districts in the province.
2.2. Methodology
2.2.1. Statistical Method
For the identification of extreme climate events, many scholars have adopted statistical methods. For example, Kuwanto et al. [49] used the extreme value theory to analyze the extreme precipitation events in Indramayo, Indonesia. Zhao et al. [50] used the non-parametric M-K test method to calculate urban climate extremes in China; Stocker et al. [51] defined climatic events with a probability of less than 10% as extreme climate events. In this paper, the anomaly and standard deviation are used to analyze extreme climate events. The specific calculation formula is as follows:
In the formula, represents the standard deviation, represents the anomaly, represents the value of rainfall or temperature in the year i of a region, and represents the multi-year average of rainfall or temperature in a region. When , it is defined that extreme precipitation or extreme high temperature events have occurred in the region. When , it is defined that an extreme drought or extreme low temperature event occurred in the area.
In the part of exploring the influence mechanism of extreme climate on the water resource system, in order to increase the amount of data and obtain a more accurate fitting function, the judgment conditions of extreme climate are appropriately relaxed in this part. When , it is defined that extreme precipitation or extreme high temperature events have occurred in the region. When , it is defined that an extreme drought or extreme low temperature event occurred in the area.
2.2.2. Calculation of the Coupling Coordination Degree
Standardization of Data
The dimensions of the data collected in this paper are different, so it is necessary to standardize the data, and the standardized values were made to lie between 0.001 and 0.999, using the following formula [52]:
Positive indicator:
Negative indicator:
In the formula, is the value of the indicator after normalization, is the true value of the indicator, and and are the maximum and minimum values of the indicator, respectively.
Determination of Weights
- Calculation of subjective weights on IFAHP
The intuitionistic fuzzy analytic hierarchy process (IFAHP) [53] introduces the intuitionistic fuzzy set in the basic hierarchical analysis method, which can quantify the measured values of the indicators by describing the scores of the program with the affiliation function. In order to solve the ambiguities occurring during the evaluation process and minimize the influence of human factors, it is necessary to improve the reasonableness of the subjective weighting, which is calculated as follows [54]:
(1) Construct the comparison matrix
It is assumed that the number of experts attended the decision-making process is . Each element in the comparison matrix of the two indicators is an intuitionistic fuzzy number corresponding to the evaluation result.
where , denotes the degree of affiliation, which is the level of preference of the decision maker for indicator i, and denotes the degree of non-affiliation, which is the level of preference for indicator j by the decision-maker. expression of the level of uncertainty of the decision maker, .
(2) Construct the consistency intuitionistic fuzzy judgement matrix
- When or , .
Where
- When or , .
(3) Determine the distance between and
When [55], the judgment matrix is considered to pass the consistency test. For intuitionistic fuzzy judgment matrices that do not satisfy the consistency test, a correction is required, and the corrected matrix is .The correction method is as follows:
(4) Calculation of subjective weights
The calculation of indicator weights for judgement matrices that satisfy consistency is performed with the following formula:
In the formula, is the subjective weight.
- 2.
- Calculation of objective weights based on the improved CRITIC method
The CRITIC method was proposed by Diakoulaki et al. [56] and applied to the calculation of objective weighting, which can reflect the strength and conflict of the indicators well. However, it lacks the consideration of data dispersion, so discrete coefficients should be introduced into the calculation in order to find more reasonable objective weights [57], which are calculated as follows:
where is the mean difference of indicator , is the newly introduced discrete coefficient, is the correlation coefficient between indicator and , and is the objective weight.
- 3.
- Calculation of composite weights
In this paper, the subjective and objective weights are considered together and considered equally important, so the coefficient is made to be calculated as follows:
where is the composite weights.
Modeling of the Coupling Coordination Degree
3. Results
3.1. Distributional Characteristics of Extreme Climate Events
3.1.1. Characteristics of the Temporal Distribution of Extreme Climate Events
According to the above statistical methods, extreme climate events in Sichuan Province in the past 15 years were analyzed, and the results are shown in Figure 2. It can be seen from the figure that the frequency of extreme climate events shows an overall upward trend, which is consistent with the environment in which extreme climate events have become more frequent in many regions in recent years [59,60,61]. In the past 15 years, three cities had extreme drought events in 2009, which was the year with the fewest extreme climate events. In 2015, nine cities had extreme high temperature events, two cities had extreme precipitation events, and one city had extreme drought events, which was the year with the most extreme climate events. In order of frequency, the five extreme events were: extreme precipitation events (34%) > extreme drought events (24%) > extreme high temperature events (18%) = extreme low temperature events (18%) > comprehensive extreme climate events (6%).
The frequency of extreme precipitation events is the highest, but as can be seen from Figure 2, the frequency of extreme precipitation events was low before 2014, and extreme precipitation events began to occur frequently in 2015. The extreme drought events all occurred between 2007 and 2018, and there was no such extreme climate in 2019–2021. Although the frequency of extreme low temperature events and extreme high temperature events is equal, the extreme low temperature events mostly occurred between 2007 and 2014 (79% of the total number of extreme low temperature events occurred during the study period), and the extreme high temperature events mostly occurred after 2014 (60% of the total number of extreme high temperature events occurred during the study period). Through the above analysis, it can be concluded that the type of extreme climate occurring in Sichuan Province gradually transitions from extreme drought to extreme precipitation, and from extreme low temperature to extreme high temperature. These conclusions are consistent with those of Wang et al. [62], Rush et al. [63], and Zhu et al. [64].
The statistical data of specific extreme climate events are shown in Table 3, Table 4, Table 5, Table 6 and Table 7. Due to the large amount of data, only the statistical data of extreme climate events are listed. It can be seen from Table 3 that in the past 15 years, the maximum and minimum rainfall values occurred in Ya’an and Panzhihua, respectively, and the highest and lowest temperature values occurred in Panzhihua and Tibetan Autonomous Prefecture of Garzê, respectively.
3.1.2. Characteristics of the Spatial Distribution of Extreme Climate Events
From the extreme climate identification in Table 4, Table 5, Table 6 and Table 7, it can be seen that Chengdu and Panzhihua experienced eight extreme climate events; Dazhou, Neijiang and Zigong experienced seven extreme climate events; Bazhong, Guangyuan, Meishan, Mianyang and Ziyang experienced six extreme climate events; Leshan, Liangshan Yi Autonomous Prefecture, Nanchong, Ya’an and Yibin experienced five extreme climate events; Aba Tibetan and Qiang Autonomous Prefecture, Guang’an, Luzhou and Suining have experienced four extreme climate events; and Tibetan Autonomous Prefecture of Garzê and Deyang have experienced three extreme climate events.
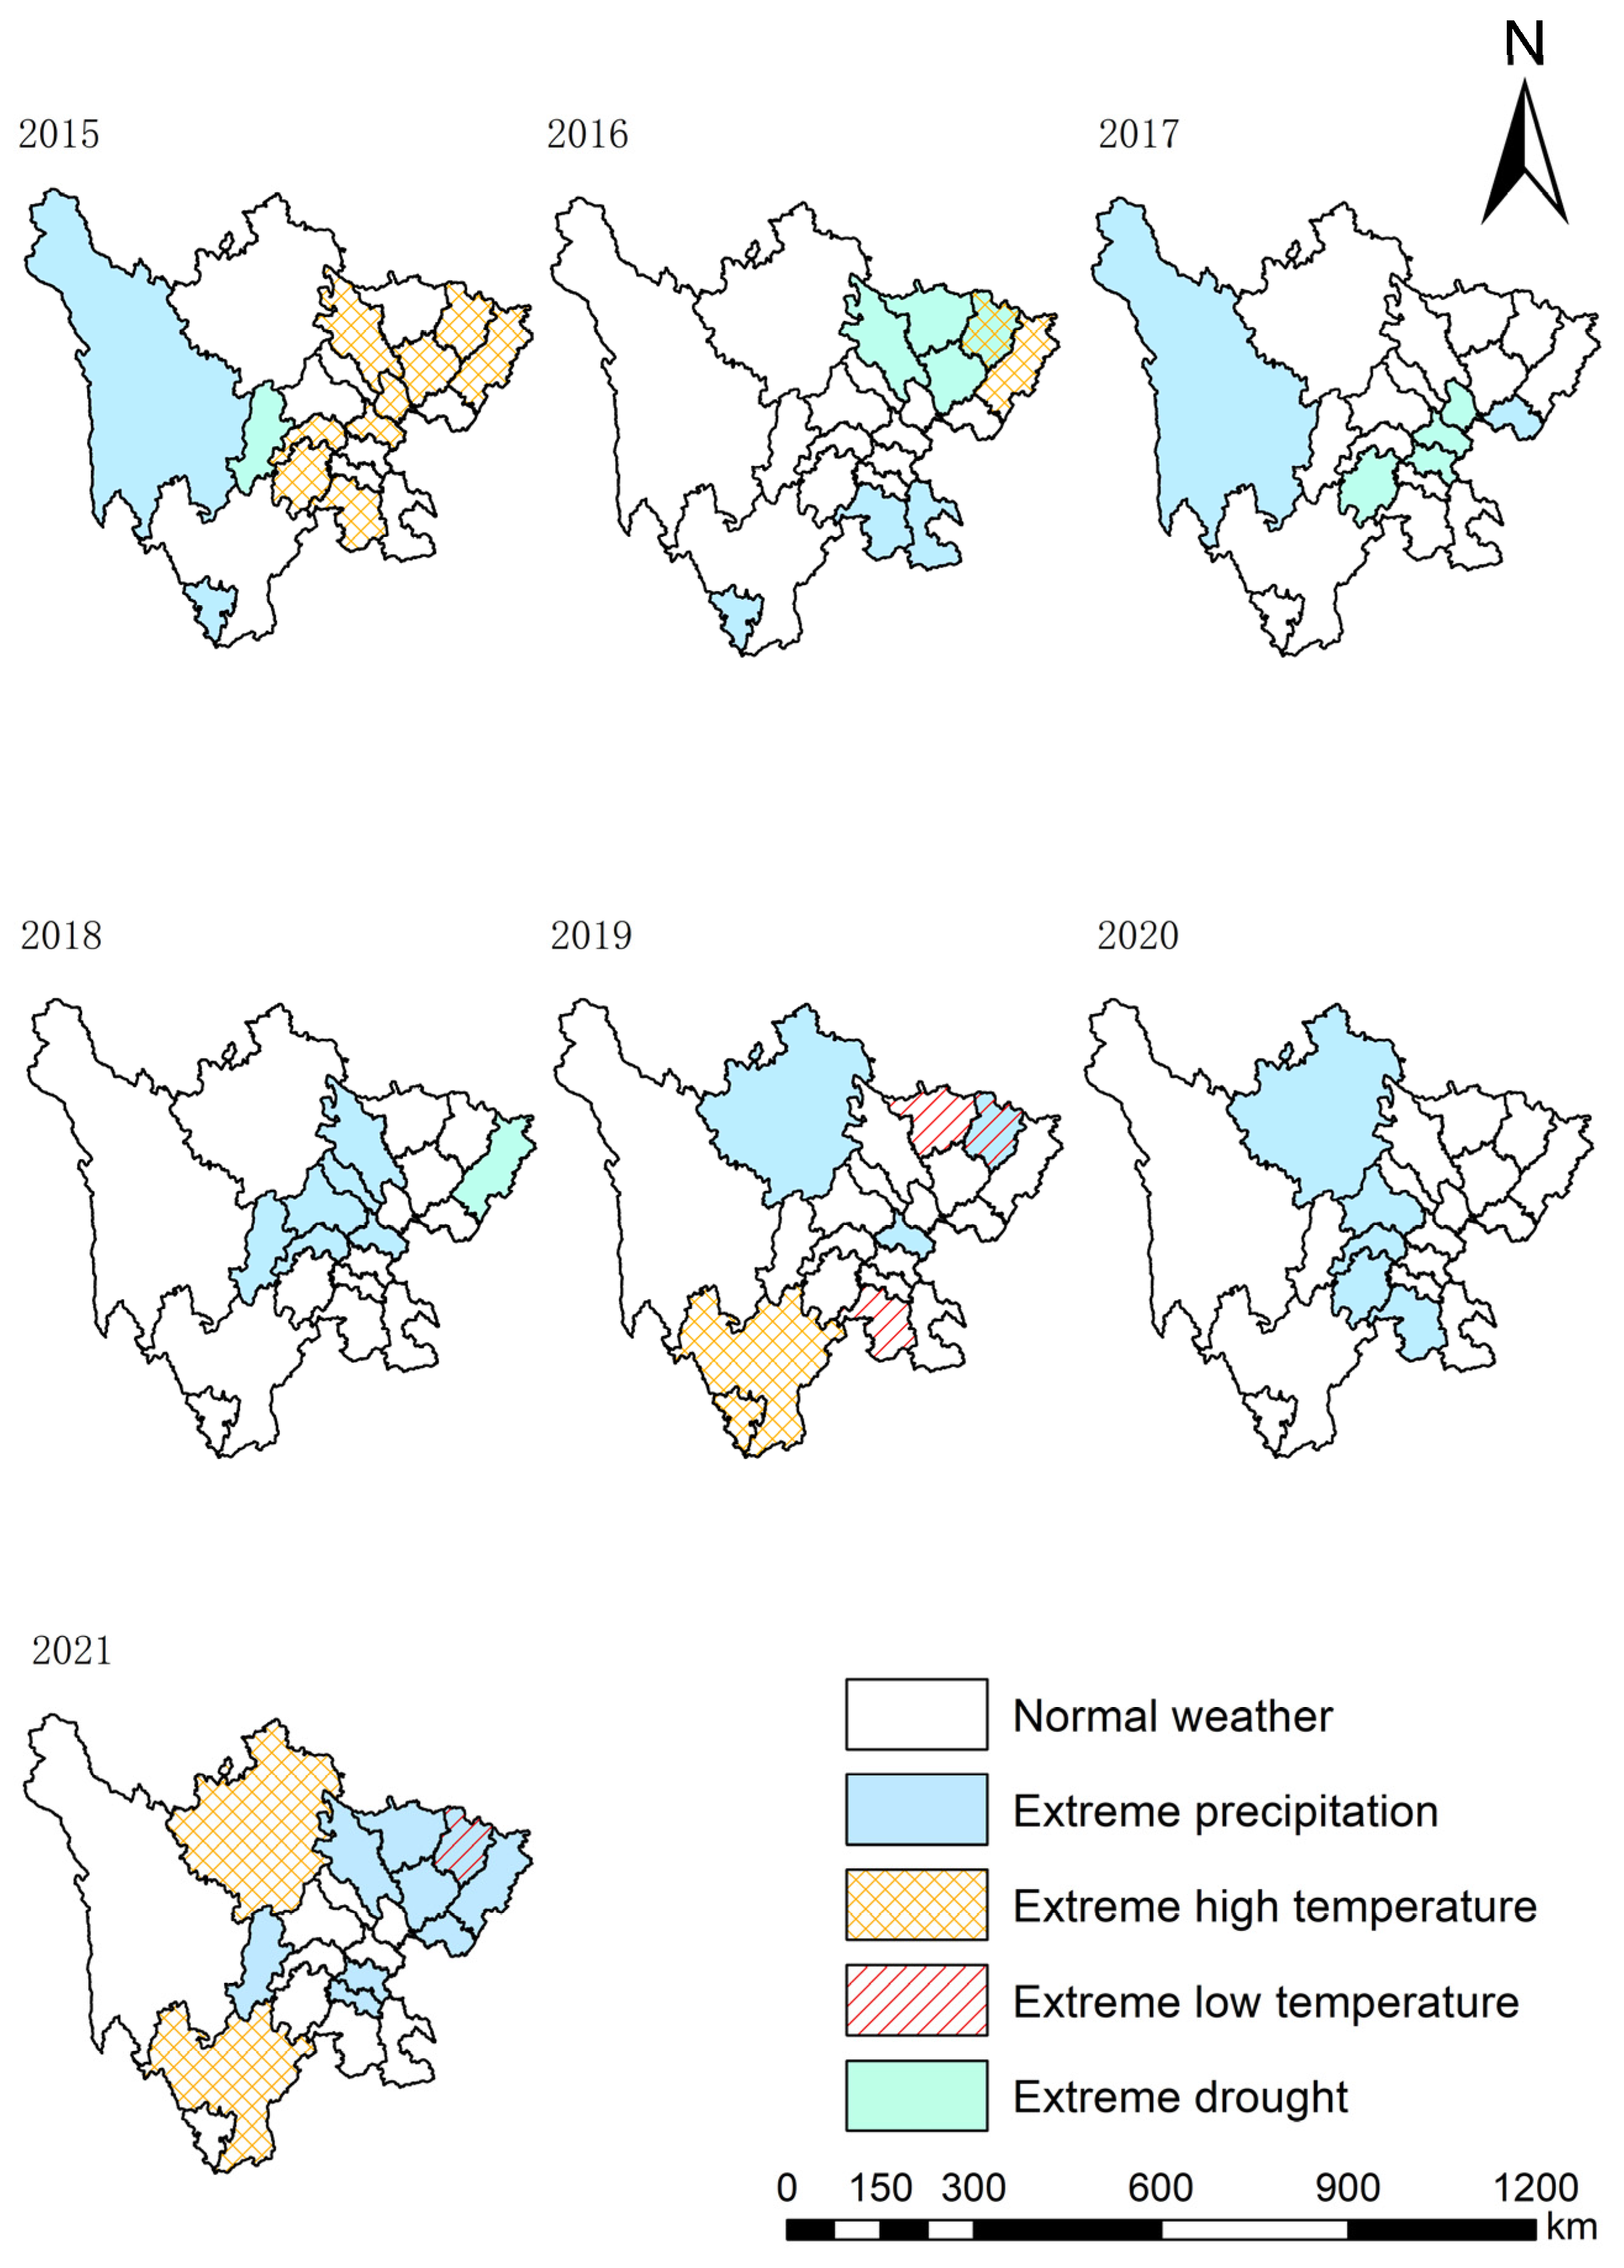
With the approval of the Sichuan government, administrative districts of some towns in Sichuan Province were adjusted in 2015. Therefore, when studying the spatial distribution characteristics of extreme climate events, the research interval was adjusted to 2015–2021. The boundary data of administrative divisions of Sichuan Province during 2015–2021 came from the Resources and Environmental Science Data Registration and Publication system [65]. The spatial characteristics of extreme climate events in the past seven years are analyzed below, and the specific distribution is shown in Figure 3.
As can be seen from Figure 3, extreme precipitation events basically occur in the whole region of Sichuan Province without obvious spatial distribution characteristics. Extreme drought events mostly occur in the northern and central regions of Sichuan Province, extreme high temperature events mostly occur in the western, central, and eastern regions of Sichuan province, and extreme low temperature events occur at a low frequency, only in Guangyuan, Bazhong and Suining. In the past seven years, three comprehensive extreme climate events have occurred, all of which occurred in Bazhong, namely, the comprehensive extreme climate of high temperature and drought in 2016, the comprehensive extreme climate of low temperature and precipitation in 2019 and 2021. The average annual temperature of Bazhong City in 2016 was 17.9 °C, 5% higher than the annual average temperature. The annual rainfall is 863.1 mm, 28% lower than the annual average rainfall, and the rainfall in 2019 and 2021 is 1728.7 mm and 1716.6 mm, respectively, 44% and 43% higher than the annual average rainfall.
3.2. Distributional Characteristics of Extreme Climate Events
According to the calculation method of coupling coordination degree mentioned above, the coupling coordination degree of the water resource–climate system in 21 districts of Sichuan Province from 2015 to 2021 was calculated, and the calculation results are shown in Figure 4.
In recent 7 years, the coupling coordination degree of Sichuan Province fluctuated between serious imbalance and good coordination, and the fluctuation range was large, but most of the coupling coordination levels were between mild imbalance and intermediate coordination. In 2016, the coupling coordination degree of Yibin was 0.13, which was in a serious imbalance state. The coupling coordination degree values of Leshan (2017), Neijiang (2017), Ziyang (2018) and Dazhou (2019) are 0.26, the coupling coordination degree values of Ya’an (2017) and Yibin (2019) are 0.27, the coupling coordination degree values of Aba Tibetan and Qiang Autonomous Prefecture (2019), Guangyuan (2019) and Ya’an (2021) are 0.21, 0.25 and 0.29, respectively, and the above 9 regions are in the moderate imbalance level. The coupling coordination degree values of Guang’an (2019), Ya’an (2020) and Nanchong (2017) are 0.81, 0.81, and 0.82, respectively, and these three cities are in good coordination level.
Combined with Figure 3, it is found that the coupling coordination levels of the regions where extreme climate events occur are all low, and most of the evaluation levels are between a moderate imbalance and barely coordinated. Among them, 13% of the regions fall under moderate imbalance, 34% under mild imbalance, 25% under imminent imbalance, and 15% under barely coordinated. Only Yibin had a serious imbalance level in 2016. Extreme precipitation weather occurred in this year. The γ of rainfall in this year was 2.3, which was a very extreme precipitation year, so the coupling coordination degree was at the lowest value. The evaluation levels of 11% of the regions are in primary coordination and intermediate coordination, among which Bazhong City in 2021 has a comprehensive extreme climate of precipitation and low temperature, the γ of rainfall in this year is 2.0, and the γ of temperature is −1.2. In the case that the two factors are not in line with the values of normal years, the coupling degree of the two extreme data is relatively high, thus it had a high evaluation grade. Therefore, when there are multiple attributes or multiple dimensional factors in an evaluation system, the evaluation of coupling coordination degree should be comprehensively considered. It is not that the higher the value of coupling coordination degree, the better the level of comprehensive development of a region.
3.3. Calculation of Coupling Coordination Degree of the Water Resource System
Without considering the influence of climate on the water resource system, the coupling coordination degree of a single water resource system is calculated, and the results are shown in Figure 5.
As seen in Figure 5, in recent 7 years, 7 cities were at a good coordination level, 41 cities were at an intermediate coordination level, 52 cities were at a primary coordination level, 31 cities were at a barely coordinated level, 9 cities were at an imminent imbalance level, 3 cities were at a mild imbalance level, and 4 cities were at a moderate imbalance level. There were no cities at the extreme imbalance, serious imbalance, and quality coordination levels. Compared with the water resource–climate system, the number of cities in good coordination level increased by 4, the number of cities in intermediate coordination level increased by 24, the number of cities in primary coordination level increased by 35, the number of cities in barely coordination level decreased by 12, the number of cities in imminent imbalance level decreased by 24, and the number of cities in mild imbalance level decreased by 21. The number of cities in the moderate imbalance level is reduced by 5, the number in the serious imbalance level is reduced by 1, the coupling coordination level was greatly improved, and the level distribution was more concentrated.
3.4. Impact of Climatic Factors on the Water Resource System
According to the above analysis, it has been known that the coupling coordination degree of the water resource system shows an overall upward trend without considering the influence of climate factors. Therefore, this paper only selects data with a positive difference value for analysis, that is, the coupling coordination degree of a single water resource system is greater than that of the water resource–climate system. The impact degree of climate factors on water resources was characterized by the difference of the coupling coordination degree of the two systems, and the difference was denoted as . In other words, the larger the , the greater the degree of climate influence on water resource system; The smaller the , the less the degree of climate influence on the water resource system.
3.4.1. Impact of Precipitation on the Water Resource System
When analyzing the influence of rainfall on water resource system, we found that the variation range of rainfall was large, so the logarithmic processing of rainfall was carried out to make the data series more stable. The calculation formula is as follows:
In the above formula, is the amount of rainfall after logarithmic transformation, and is the amount of rainfall during extreme precipitation or extreme drought events.
We fit and . When of the curve is fitted, we believe that the curve can represent the relationship between and . The specific results are shown in Figure 6 and Figure 7.
Effects of Extreme Precipitation Events on the Water Resource Systems
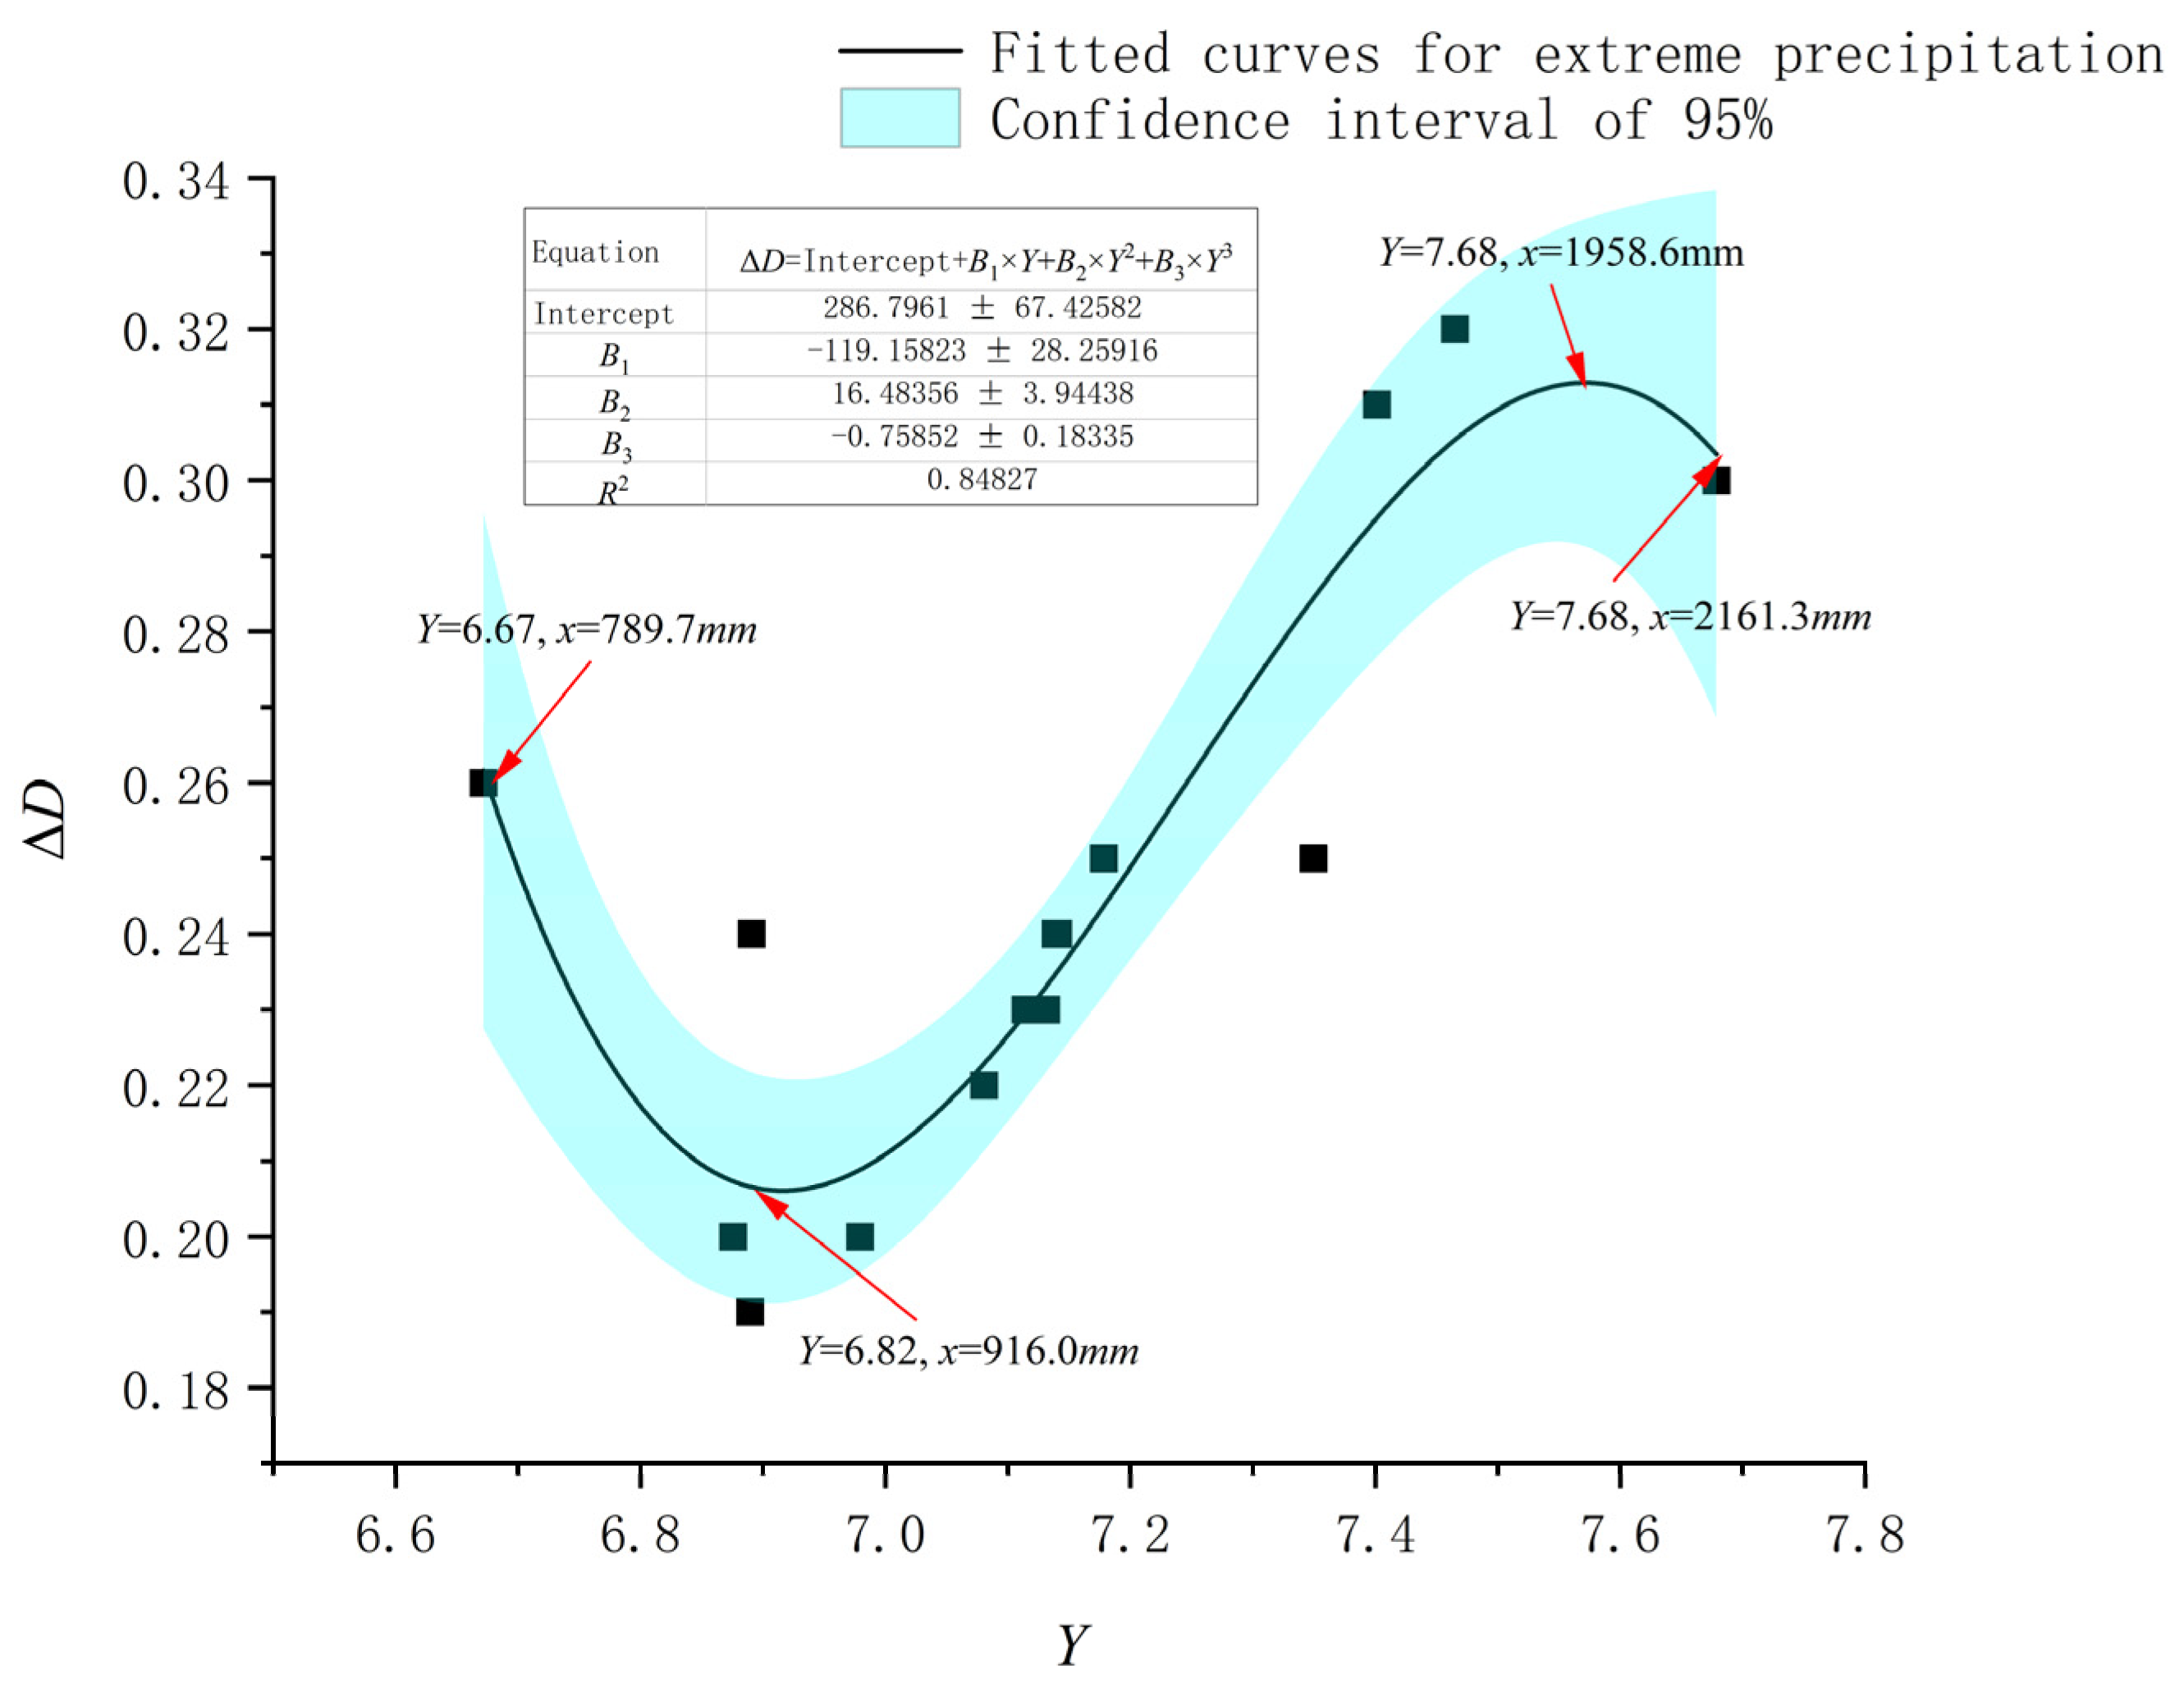
As shown in Figure 6, when extreme precipitation events occur, and present a cubic polynomial relationship ().
Figure 6.
The influence curve of rainfall of extreme precipitation events on the water resource system.
Figure 6.
The influence curve of rainfall of extreme precipitation events on the water resource system.

When the rainfall ranges from 789.7 to 916.0 mm, shows a downward trend with the increase in rainfall; that is, the greater the rainfall, the smaller the impact on the water resource system. The impact effect is that the rainfall increases by 1000 mm and the coupling coordination degree of the water resource system decreases by 0.48. When the rainfall ranges from 916.0 to 1958.6 mm, the shows an upward trend with the increase in rainfall; that is, the greater the rainfall, the greater the impact on the water resource system. The impact effect is that the rainfall increases by 1000 mm and the coupling coordination degree of the water resource system decreases by 0.11, which is consistent with the views of Srinivasan et al. [66]. They believe that increased rainfall will lead to a negative impact on agricultural production, resulting in increased pressure on agricultural water use. When the rainfall ranges from 1958.6 to 2161.3 mm, shows a downward trend with the increase in rainfall; that is, the greater the rainfall, the smaller the impact on the water resource system. The impact effect is to increase the rainfall by 1000 mm, and the coupling coordination degree of the water resource system decreases by 0.10.
Effects of Extreme Drought Events on the Water Resource Systems
As shown in Figure 7, when extreme drought events occurred, and presented a quadratic polynomial relationship ().
Figure 7.
The influence curve of rainfall of extreme drought events on the water resource system.

When the rainfall is between 668.9 and 972.6 mm, shows an upward trend with the decrease in rainfall; that is, the smaller the rainfall, the greater the impact on the water resource system. The impact effect is that the rainfall decreases by 1000 mm and the coupling coordination degree of the water resource system decreases by 0.96. When the rainfall ranges from 972.6 to 1394.1 mm, shows a downward trend with the decrease in rainfall; that is, the smaller the rainfall, the smaller the impact on the water resource system. The impact effect is that every 1000 mm decrease in rainfall, the coupling coordination degree of the water resource system decreases by 0.55, which is consistent with the conclusion of Aparicio et al. [67].
3.4.2. The Effect of Temperature on the Water Resource System
In the process of analyzing the influence of temperature on water resource system, we found that the change of temperature was relatively stable, and the temperature when extreme high temperature climate event or extreme low temperature climate event occurs is denoted as . We fit and . When of the curve is fitted, we believe that the curve can represent the relationship between and . The specific results are shown in Figure 8 and Figure 9.
Impacts of Extreme High Temperature Events on the Water Resource Systems
As shown in Figure 8, when extreme high temperature events occur, the relationship between and is quadratic polynomial ().
Figure 8.
The influence curve of temperature on the water resource system under extreme high temperature events.
Figure 8.
The influence curve of temperature on the water resource system under extreme high temperature events.

When the temperature is between 17.80 °C and 18.65 °C, shows a downward trend with the increase in temperature; that is, the higher the temperature, the smaller the impact on the water resource system. The impact effect is that the temperature increases by 1 °C, and the coupling coordination degree of the water resource system decreases by 0.14. When the temperature is between 18.65 °C and 19.18 °C, shows an upward trend with the increase in temperature; that is, the higher the temperature, the greater the impact on the water resource system. The impact effect is that the temperature rises by 1 °C, and the coupling coordination degree of the water resource system decreases by 0.072, which is consistent with the conclusion of Zhu et al. [68], who believe that under the condition of global warming. The water shortage situation in China’s nine water-scarce cities will further worsen.
Effects of Extreme Low Temperature Events on the Water Resource Systems
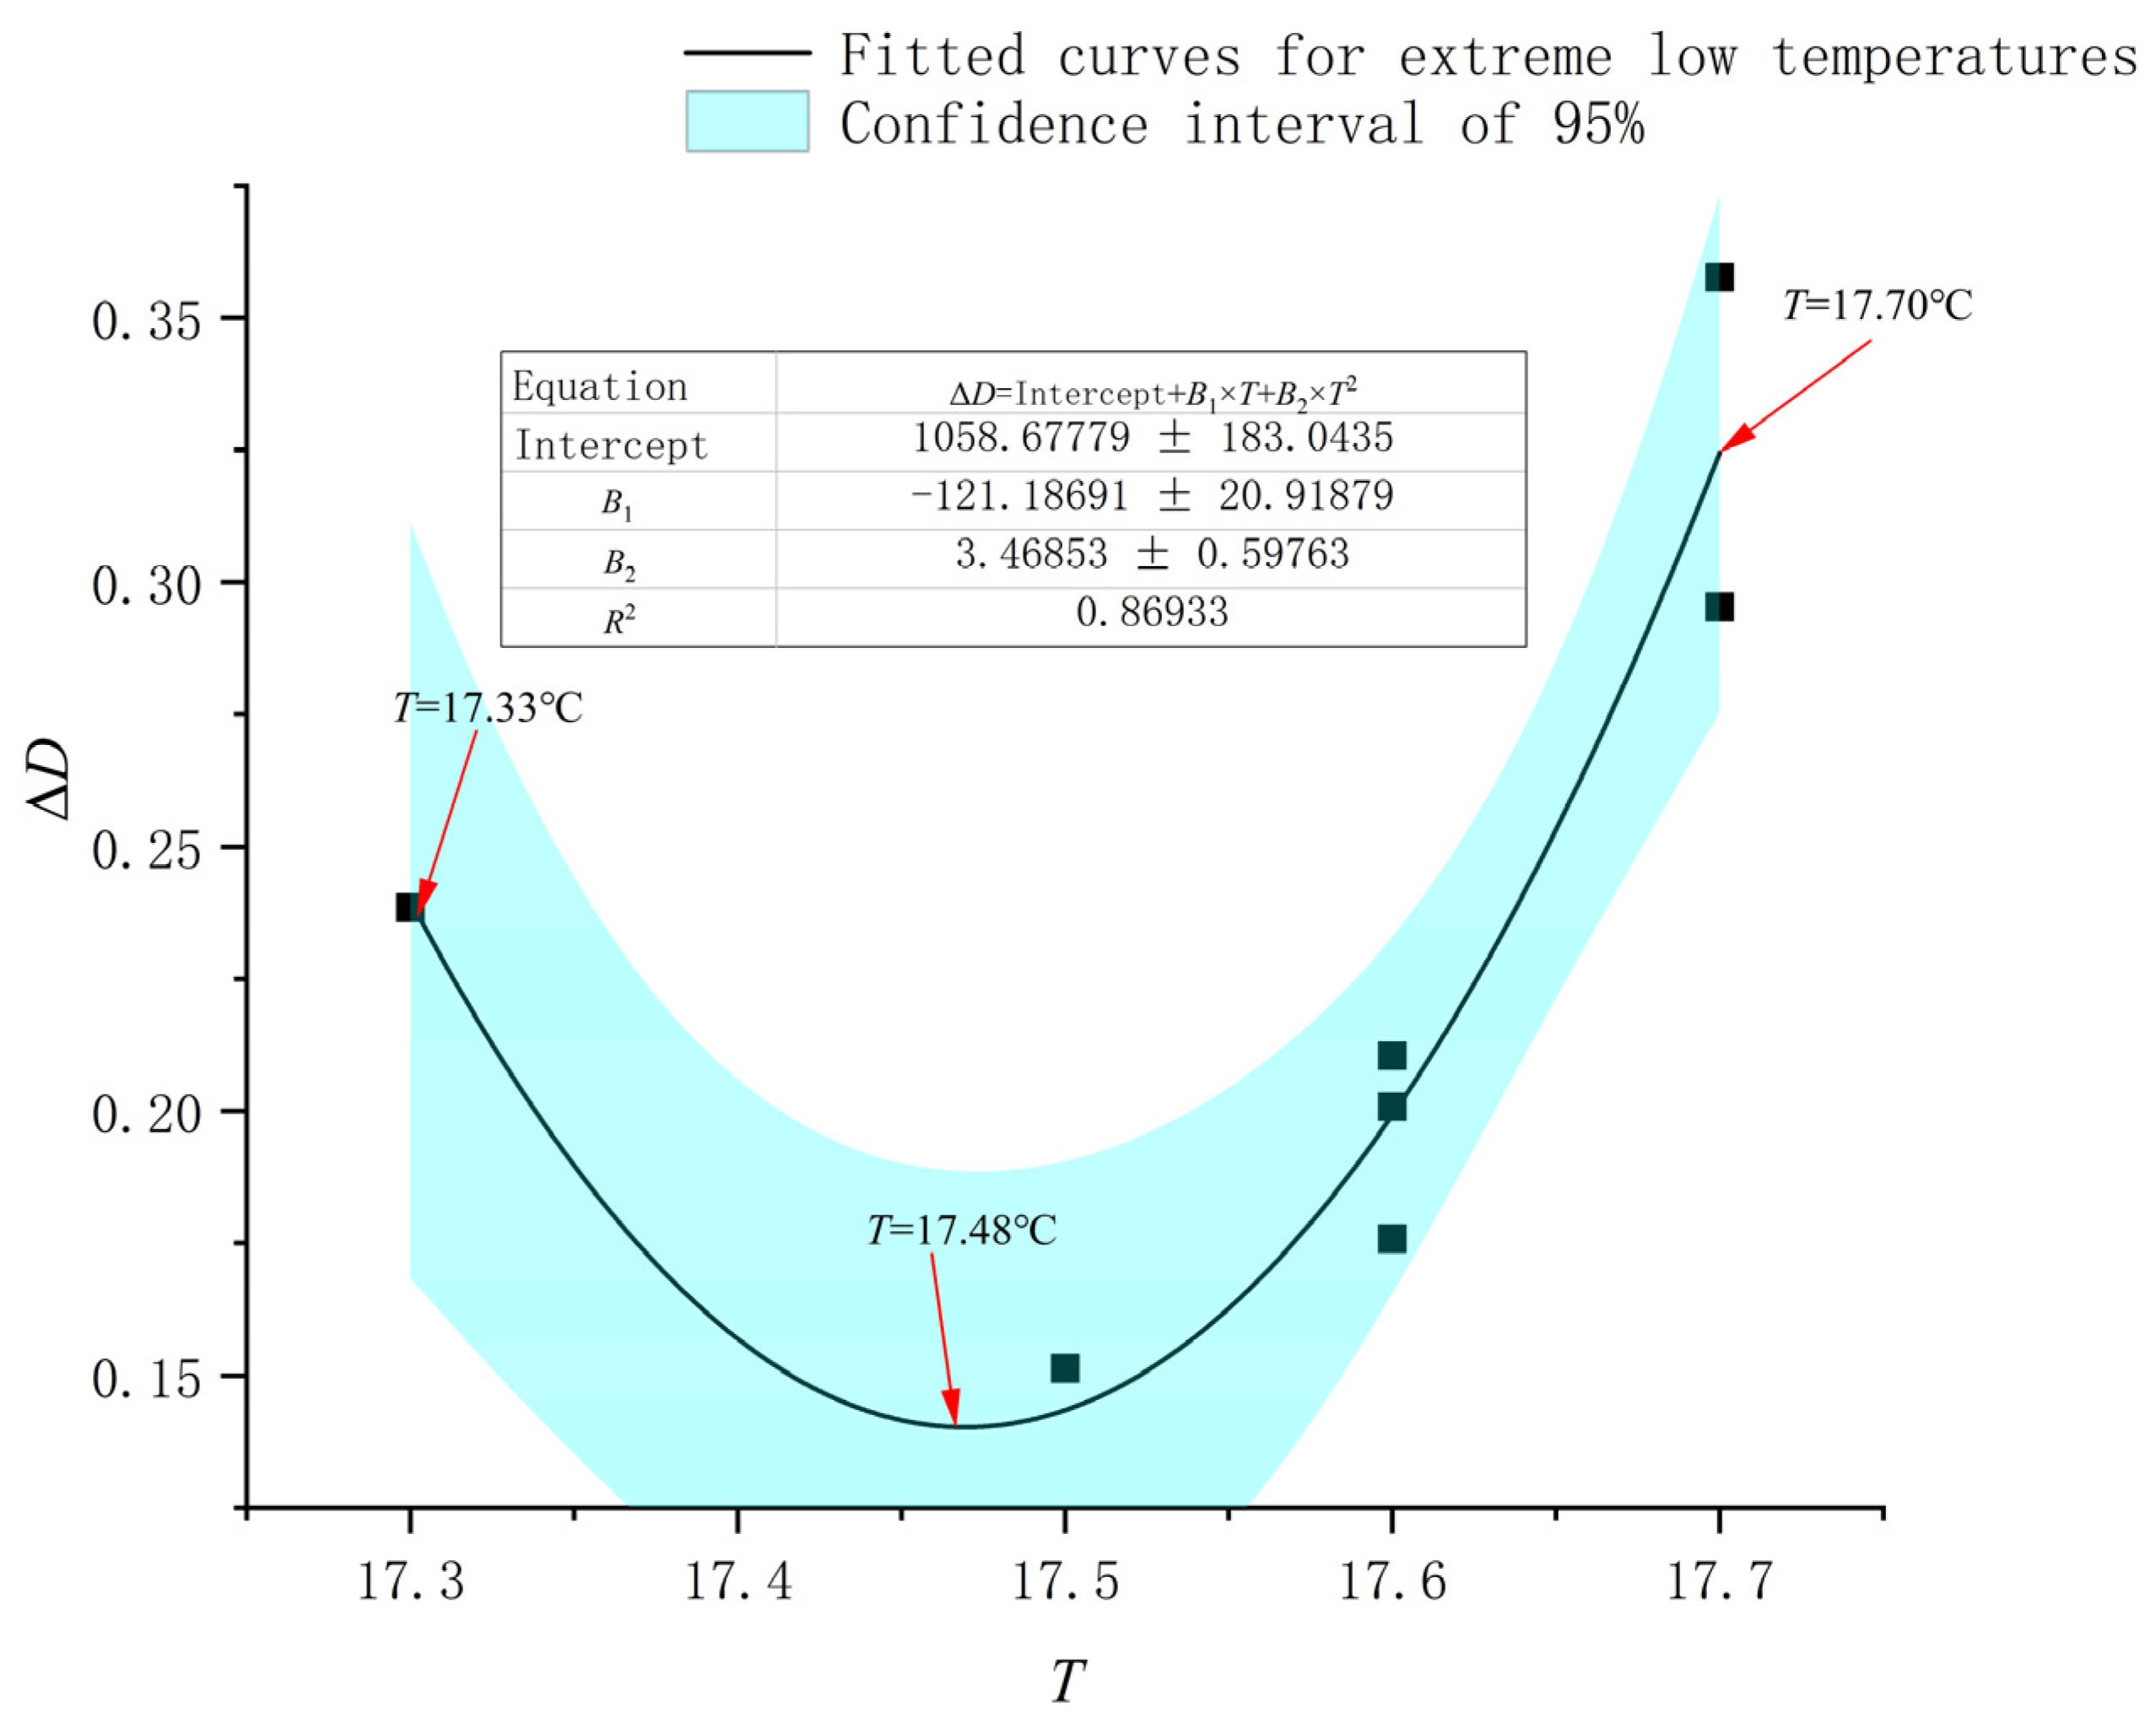
As shown in Figure 9, when extreme low temperature events occur, the relationship between and presents a quadratic polynomial ().
Figure 9.
The influence curve of temperature on the water resource system under extreme low temperature events.
Figure 9.
The influence curve of temperature on the water resource system under extreme low temperature events.

When the temperature is between 17.33 °C and 17.48 °C, shows an upward trend with the decrease in temperature; that is, the lower the temperature, the greater the impact on the water resource system. The impact effect is that the temperature decreases by 1 °C and the coupling coordination degree of the water resource system decreases by 0.45. When the temperature is between 17.48 °C and 17.70 °C, shows a downward trend with the decrease in temperature; that is, the lower the temperature, the smaller the impact on the water resource system. The impact effect is that the temperature decreases by 1 °C and the coupling coordination degree of the water resource system decreases by 0.22.
3.4.3. Comprehensive Effects of Precipitation and Temperature on the Water Resource System
In extreme precipitation (high temperature) events, the end with large rainfall (temperature) is named as the extreme climate end, and the end with small rainfall (temperature) is named as the mild climate end. In extreme drought (low temperature) events, the end with small rainfall (temperature) is named as the extreme climate end, and the end with large rainfall (temperature) is named as the moderate climate end. In the analysis of the impact of precipitation on water resource system, it is found as follows: the extreme climate end of the fitted curve (Figure 6 and Figure 7) has a greater impact on water resources than the mild climate end. The effect of temperature on water resource system is analyzed as follows: the extreme climate end of the fitted curve (Figure 8 and Figure 9) has less impact on the water resource system than the mild climate end.
Based on the above two findings, we can draw the following conclusion; that is, when comprehensive extreme climate events occur in a certain region, one climatic factor is at the extreme climate end and the other is at the mild climate end, the coupling coordination level of the city may be high, which is consistent with the conclusion of Zhang et al. [69]. This explains the reason why the coupling coordination degree is still high in Bazhong City in 2021 when the comprehensive extreme climate of extreme precipitation and extreme low temperature occurs, and also shows once again that the process of evaluating the coupling coordination degree of a certain region should be viewed from a comprehensive perspective.
3.5. Study Limitations
For the analysis of the impact of the above climate factors on the water resource system, this paper has the following two limitations:
- (1)
- This paper considers only the case where is positive. By comparing the coupling coordination degree levels of the two systems, it is found that is negative in only a few areas. Through the analysis of these negative data, the main reason for this occurrence is caused by human activities and urbanization, so this part of data is not included in the analysis.
- (2)
- Due to the limited data acquisition, the conclusions obtained in this paper are suitable for short-term analysis, and it is not suitable to apply the conclusions to long-term future prediction.
4. Discussion
The results show that the water resource system of Sichuan Province is affected by extreme climate factors, and the coupling coordination degree of the water resource system is low when extreme climate events occur, which means that extreme climate factors will reduce the stability of the water resource system. This conclusion is consistent with the research results of Wubneh et al. [70], Sharan et al. [71] and Rankoana [72]. However, these scholars have described qualitatively the impact of extreme climate on water resource system, while this paper describes quantitatively the impact of extreme climate on water resource system. When calculating the coupling coordination degree, IFAHP and the improved CRITIC are used to determine the index weight, which increases the rationality and scientificity of system weighting compared with the original AHP [73] and CRITIC [74].
In the process of analyzing the coupling coordination degree, we find that when one factor is in the extreme climate and the other is in the mild climate, we may get a high coupling coordination level, which may be caused by the mutual influence of extreme climate factors. In previous studies [14,15,16], some scholars have suggested that extreme precipitation and high temperature waves are mutually promoting, and extreme precipitation generally occurs after high temperature heat wave events. Whether the interaction between extreme climate is the cause of the occurrence of comprehensive extreme climate events, and whether the effect of comprehensive extreme weather on the water resource system is stronger than that of a single extreme climate on the water resource system are questions that we should study and solve in the future.
In the selection of climate subsystem indicators, this paper mainly considers rainfall and temperature, and lacks the selection of other meteorological indicators (such as pressure, wind speed, wind direction, sunshine duration, solar radiation, etc.). Due to the limitation of data acquisition, the research period of this paper is short, and the identification of extreme climate events is not rich enough. In the future research will continue to improve the above deficiencies.
5. Conclusions
Extreme climate events occur more and more frequently around the world, so it is very necessary to study the impact mechanism of extreme climate on the water resource system. This paper identified the extreme climate events in Sichuan Province from 2007 to 2021, and studied the coupling coordination degree of the water resource–climate system and water resource system in Sichuan Province from 2015 to 2021. Based on the difference of the coupling coordination degree of the two systems, the effects of rainfall and temperature on the water resource system were investigated. The conclusions are as follows:
- (1)
- The five types of extreme events in Sichuan Province are listed in the order of frequency from large to small: extreme precipitation events > extreme drought events > extreme high temperature events = extreme low temperature events > comprehensive extreme climate events, and the extreme climate types of Sichuan Province in recent years have gradually transited from extreme drought to extreme precipitation, and from extreme low temperature to extreme high temperature.
- (2)
- In the past 15 years, Chengdu and Meishan are the cities with the most extreme climate events, while Deyang City and Tibetan Autonomous Prefecture of Garzê are the cities with the least extreme climate events. From 2015 to 2021, extreme precipitation events basically spread throughout Sichuan Province, extreme drought events mostly occurred in the northern and central parts of Sichuan Province, extreme high temperature events mostly occurred in the western, central and eastern parts of Sichuan Province, and extreme low temperature events only occurred in Guangyuan, Bazhong and Suining.
- (3)
- In recent 7 years, the coupling coordination degree of Sichuan Province was between serious imbalance and good coordination, among which the lowest coordination level occurred in Yibin City in 2016, and the highest coordination level occurred in Nanchong City in 2017, but most of the coupling coordination levels were between mild imbalance and intermediate coordination. The coupling coordination levels of the regions where extreme climate events occurred were all low, the lowest coordination level occurred in Yibin in 2016, where extreme precipitation events occurred, and the highest coordination level occurred in Bazhong in 2021, where the combined extreme climate events of extreme low temperature and extreme precipitation occurred, and most of the evaluation levels were between moderate imbalance and barely coordination.
- (4)
- The climatic factors of extreme drought, extreme high temperature and extreme low temperature are all related to quadratic polynomial, and only the rainfall of extreme precipitation events is related to cubic polynomial. When one climate factor is at the extreme end of the climate and the other is at the moderate end of the climate, a high coupling coordination level may be obtained, which explains the high coupling coordination level of Bazhong City where comprehensive extreme climate occurs in the previous conclusion.
Author Contributions
Conceptualization, F.M. and Z.L.; methodology, F.M.; software, F.M.; validation, F.M. and Z.L.; formal analysis, F.M.; resources, F.M. and Z.L.; data curation, F.M.; writing—original draft preparation, F.M.; writing—review and editing, Z.L.; funding acquisition, Z.L. All authors have read and agreed to the published version of the manuscript.
Funding
This study was supported by the Basic Research Expenses of Provincial Colleges and Universities of Heilongjiang Province (project no.: 2022-KYYWF-1238).
Data Availability Statement
The data used in this study can be found on the website mentioned in the article.
Conflicts of Interest
The authors declare no conflicts of interest.
References
- Zhang, Y.Q.; Ge, J.N.; Qi, J.Y.; Liu, H.P.; Zhang, X.L.; Marek, G.W.; Yuan, C.C.; Ding, B.B.; Feng, P.Y.; Liu, D.L.; et al. Evaluating the effects of single and integrated extreme climate events on hydrology in the Liao River Basin, China using a modified SWAT-BSR model. J. Hydrol. 2023, 623, 129772. [Google Scholar] [CrossRef]
- Xu, H.W.; Chen, H.P.; Wang, H.J. Future changes in precipitation extremes across China based on CMIP6 models. Int. J. Climatol. 2021, 42, 635–651. [Google Scholar] [CrossRef]
- Supari; Tangang, F.; Juneng, L.; Aldrian, E. Observed changes in extreme temperature and precipitation over Indonesia. Int. J. Climatol. A J. R. Meteorol. Soc. 2017, 37, 1979–1997. [Google Scholar] [CrossRef]
- Mo, C.X.; Zhu, H.L.; Ruan, Y.L.; Xie, Y.P.; Lei, X.B.; Lai, S.F.; Sun, G.K.; Xing, Z.X. Spatial and temporal variation characteristics and frequency analysis of extreme precipitation from 1959 to 2017: A case study of the Longtan watershed, southwest China. J. Water Clim. Chang. 2022, 13, 2610–2626. [Google Scholar] [CrossRef]
- Liu, D.J.; Zhang, C.; Ogaya, R.; Estiarte, M.; Penuelas, J. Effects of decadal experimental drought and climate extremes on vegetation growth in Mediterranean forests and shrublands. J. Veg. Sci. 2020, 31, 768–779. [Google Scholar] [CrossRef]
- Liu, Y.Z.; Song, W. Influences of Extreme Precipitation on China’s Mining Industry. Sustainability 2019, 11, 6719. [Google Scholar] [CrossRef]
- Jacksom, G. Environmental subjectivities and experiences of climate extreme-driven loss and damage in northern Australia. Clim. Chang. 2023, 176, 93. [Google Scholar] [CrossRef]
- Wang, B.J.; Wei, W.; Yin, Z.J.; Xu, L.L. Using machine learning to analyze the changes in extreme precipitation in southern China. Atmos. Res. 2024, 302, 107307. [Google Scholar] [CrossRef]
- Li, S.; Chen, Y.N.; Wei, W.; Fang, G.H.; Duan, W.L. The increase in extreme precipitation and its proportion over global land. J. Hydrol. 2024, 628, 130456. [Google Scholar] [CrossRef]
- Zhu, X.Q.; Miao, P.; Zhu, H.; Li, W.H.; Liang, X.Y.; Wang, L.; Chen, Z.J.; Zhou, J.B. Extreme precipitation accelerates nitrate leaching in the intensive agricultural region with thick unsaturated zones. Sci. Toyal Environ. 2024, 918, 170789. [Google Scholar] [CrossRef]
- Gao, M.X.; Chen, P.; Hu, Y.X.; Liu, W.X.; Ye, Y.Y.; Zheng, Y.; Chen, T.W. Composition and vertical distribution of agricultural soil Macrofauna community after an extreme high temperature event in the summer of 2022. Ecol. Indic. 2023, 153, 110439. [Google Scholar] [CrossRef]
- Yadav, N.; Rajendra, K.; Awasthi, A.; Singh, C.; Bhushan, B. Systematic exploration of heat wave impact on mortality and urban heat island: A review from 2000 to 2022. Urban Clim. 2023, 51, 101622. [Google Scholar] [CrossRef]
- Stocks, R.; Verheyen, J.; Dievel, M.V.; Tuzun, N. Daily temperature variation and extreme high temperatures drive performance and biotic interactions in a warming world. Curr. Opin. Insect Sci. 2017, 10, 35–42. [Google Scholar] [CrossRef] [PubMed]
- Raymond, C.; Suarez-Gutierrez, L.; Kornhuber, K.; Pascolini-Campbell, M.; Sillmann, J.; Waliser, E.D. Increasing spatiotemporal proximity of heat and precipitation extremes in a warming world quantified by a large model ensemble. Environ. Res. Lett. 2022, 17, 035005. [Google Scholar] [CrossRef]
- Myhre, G.; Alterskjær, K.; Stjern, C.W.; Hodnebrog, Ø.; Marelle, L.; Samset, B.H.; Sillmann, J.; Schaller, N.; Fischer, E.; Schulz, M.; et al. Frequency of extreme precipitation increases extensively with event rareness under global warming. Sci. Rep. 2019, 9, 16063. [Google Scholar] [CrossRef] [PubMed]
- Wu, Y.; Miao, C.; Sun, Y.; AghaKouchak, A.; Shen, C.; Fan, X. Global Observations and CMIP6 Simulations of Compound Extremes of Monthly Temperature and Precipitation. Geoheaith 2021, 5, e2021GH000390. [Google Scholar] [CrossRef] [PubMed]
- Bian, Y.; Sun, P.; Zhang, Q.; Luo, M.; Liu, R. Amplification of non-stationary drought to heatwave duration and intensity in eastern China: Spatiotemporal pattern and causes. J. Hydrol. 2022, 612, 128154. [Google Scholar] [CrossRef]
- Du, H.; Alexander, L.V.; Donat, M.G.; Lippmann, T.; Srivastava, A.; Salinger, J.; Wu, Z. Precipitation from persistent extremes is increasing in most regions and globally. Geophys. Res. Lett. 2019, 46, 6041–6049. [Google Scholar] [CrossRef]
- Sedlmeier, K.; Feldmann, H.; Schadler, G. Compound Summer Temperature and Precipitation Extremes over central Europe. Theor. Appl. Climatol. 2018, 131, 1493–1501. [Google Scholar] [CrossRef]
- Zhang, W.; Villarini, G. Deadly Compound Heat Stress-Flooding Hazard Across the Central United States. Geophys. Res. Lett. 2020, 47, 15. [Google Scholar] [CrossRef]
- Sun, P.; Bian, Y.J.; Yu, S.F.; Yao, R.; Wang, Z.T.; Zhang, Q.; Chen, W.H.; Ge, C.H.; Du, W.Y. Are longer and more intense heatwaves more pron to extreme precipitation? Glob. Planet. 2024, 236, 104428. [Google Scholar] [CrossRef]
- Huang, F.X.; Liu, L.L.; Gao, J.B.; Yin, Z.Y.; Zhang, Y.B.; Jiang, Y.; Zuo, L.Y.; Fang, W.G. Effects of extreme drought events on vegetation activity from the perspectives of meteorological and soil droughts in southwestern China. Sci. Total Environ. 2023, 903, 166562. [Google Scholar] [CrossRef] [PubMed]
- Chen, J.; Li, Y.L.; Shu, L.C.; Fang, S.W.; Yao, J.; Cao, S.J.; Zeng, B.R.; Yang, Y. The influence of the 2022 extreme drought on groundwater hydrodynamics in the floodplain wetland of Poyang Lake using a modeling assessment. J. Hydrol. 2023, 626, 130194. [Google Scholar] [CrossRef]
- Wang, T.H.; Wang, X.F.; Zhang, S.L.; Song, X.Y.; Zhang, Y.; Tan, J.L.; Ren, Z.G.; Xu, Z.W.; Che, T.; Yang, Y.P.; et al. Extreme low air temperature and reduced moisture jointly inhibit respiration in alpine grassland on the Qinghai-Tibetan Plateau. Sci. Total Environ. 2024, 927, 172039. [Google Scholar] [CrossRef] [PubMed]
- Zhang, Y.X.; Liu, Y.J.; Ding, Y.H. Identification of winter long-lasting regional extreme low-temperature events in Eurasia and their variation during 1948–2017. Adv. Clim. Chang. Res. 2021, 12, 353–362. [Google Scholar] [CrossRef]
- Hekmatnia, M.; Isanezhad, A.; Ardakani, A.F.; Ghojghar, M.A.; Ghaleno, N.D. An attempt to develop a policy framework for the global sustainability of freshwater resources in the virtual water trade. Sustain. Prod. Consum. 2023, 39, 311–325. [Google Scholar] [CrossRef]
- Jing, P.R.; Sheng, J.B.; Hu, T.S.; Mahmoud, A.; Guo, L.D.; Liu, Y.; Wu, Y.T. Spatiotemporal evolution of sustainable utilization of water resources in the Yangtze River Economic Belt based on an integrated water ecological footprint model. J. Clean. Prod. 2022, 358, 132035. [Google Scholar] [CrossRef]
- Wang, L.T.; Zeng, W.H.; Cao, R.X.; Zhou, Y.; Fu, J.; Wang, J.P. Overloading risk assessment of water environment-water resources carrying capacity based on a novel Bayesian methodology. J. Hydrol. 2023, 622, 129697. [Google Scholar] [CrossRef]
- Rahaman, M.H.; Masroor, M.; Rehman, S.; Singh, R.; Ahemd, R.; Sahana, M.; Sajjad, H. State of Art of Review on Climate Variability and Water Resources: Bridging Knowledge Gaps and the Way Forward. Water Resour. 2022, 49, 699–710. [Google Scholar] [CrossRef]
- Moses, O.; Hambira, W.L. Effects of climate change on evapotranspiration over the Okavango Delta water resources. Phys. Chem. Earth Parts A/B/C 2018, 105, 98–103. [Google Scholar] [CrossRef]
- Clifton, C.F.; Ddy, K.T.; Luce, C.H.; Grant, G.E.; Safeeq, M.; Halofsky, J.E.; Staab, B.P. Effects of climate change on hydrology and water resources in the Blue Mountains, Oregon, USA. Clim. Serv. 2018, 10, 9–19. [Google Scholar] [CrossRef]
- Anik, A.H.; Sultan, M.B.; Alam, M.; Parvin, F.; Ali, M.M.; Tareq, S.M. The impact of climate change on water resources and associated health risks in Bangladesh: A review. Water Secur. 2023, 18, 100133. [Google Scholar] [CrossRef]
- Wang, A.Q.; Tao, H.; Ding, G.; Zhang, B.L.; Huang, J.L.; Wu, Q.Y. Global cropland exposure to extreme compound drought heatwave events under future climate change. Weather. Clim. Extrem. 2023, 40, 100559. [Google Scholar] [CrossRef]
- Yang, Y.; Zhao, N. Future projections of compound temperature and precipitation extremes and corresponding population exposure over global land. Glob. Planet. Chang. 2024, 236, 104427. [Google Scholar] [CrossRef]
- Yuan, D.H.; Du, M.R.; Yan, C.L.; Wang, J.Z.; Wang, C.; Zhu, Y.Y.; Wang, H.; Kou, Y.Y. Coupling coordination degree analysis and spatiotemporal heterogeneity between water ecosystem service value and water system in Yellow River Basin cities. Ecol. Inform. 2024, 79, 102440. [Google Scholar] [CrossRef]
- Liu, X.L.; Vu, D.; Perera, S.C.; Wang, G.F.; Xiong, R. Nexus between water-energy-carbon footprint network: Multiregional input-output and coupling coordination degree analysis. J. Clean. Prod. 2023, 430, 130639. [Google Scholar] [CrossRef]
- Song, S.R.; Chen, X.; Liu, T.; Zan, C.J.; Hu, Z.Y.; Huang, S.Y.; Maeyer, P.D.; Wang, M.; Sun, Y. Indicator-based assessments of the coupling coordination degree and correlations of water-energy-food-ecology nexus in Uzbekistan. J. Environ. Manag. 2023, 345, 118674. [Google Scholar] [CrossRef]
- Wang, Y.H.; Song, C.Q.; Cheng, C.X.; Wang, H.Y.; Wang, X.Y.; Cao, P.C. Modelling and evaluating the economy-resource-ecological environment system of a third-polar city using system dynamics and ranked weights-based coupling coordination degree model. Cities 2023, 12, 133. [Google Scholar] [CrossRef]
- Bian, D.H.; Yang, X.H.; Xiang, W.Q.; Sun, B.Y.; Chen, Y.J.; Babuna, P.; Li, M.H.; Yuan, Z.X. A new model to evaluate water resource spatial equilibrium based on the game theory coupling weight method and the coupling coordination degree. J. Clean. Prod. 2022, 366, 132907. [Google Scholar] [CrossRef]
- Zhang, J.T.; Dong, Z.C. Assessment of coupling coordination degree and water resources carrying capacity of Hebei Province (China) based on WRESP2D2P framework and GTWR approach. Sustain. Cities Soc. 2022, 82, 103862. [Google Scholar] [CrossRef]
- Cheng, G.; Li, G.Y.; Pu, X.J.; Chen, C.; He, Y. Advancing coupling coordination simulation in the social-human-ecological system of the Three Gorges Reservoir Area: A multi-scenario system dynamics approach. Ecol. Indic. 2024, 158, 111504. [Google Scholar] [CrossRef]
- Xu, S.S.; He, W.J.; Shen, J.Q.; Degefu, D.M.; Yuan, L.; Kong, Y. Coupling and Coordination Degrees of the Core Water–Energy–Food Nexus in China. Int. J. Environ. Res. Public Health 2019, 16, 1648. [Google Scholar] [CrossRef] [PubMed]
- Tao, J.; Xie, Y.J.; Zhou, H.Y.; Xu, Y.Q.; Zhao, G.S. Cross-County Characteristics of Water–Ecology–Economy Coupling Coordination in the Wuding River Watershed, China. Land 2022, 11, 2283. [Google Scholar] [CrossRef]
- Xu, L.T.; Chen, S.S. Coupling coordination degree between social-economic development and water environment: A case study of Taihu lake basin, China. Ecol. Indic. 2023, 148, 110118. [Google Scholar] [CrossRef]
- Sichuan Provincial Bureau of Statistics. Sichuan Survey Team of the National Bureau of Statistics. Sichuan Statistical Yearbook; China Statistics Press: Beijing, China, 2021; pp. 1–511. [Google Scholar]
- Sichuan Provincial Climate Center. Sichuan Climate Bulletin; Sichuan Provincial Climate Center: Chengdu, China, 2021. [Google Scholar]
- Sichuan Provincial Hydrology and Water Resources Survey Center. Sichuan Province Water Resources Bulletin; Sichuan Provincial Hydrology and Water Resources Survey Center: Chengdu, China, 2021. [Google Scholar]
- Department of Ecology and Environment Sichuan Province. Sichuan Ecology and Environment Statement 2021; Department of Ecology and Environment Sichuan Province: Chengdu, China, 2021. [Google Scholar]
- Kuswanto, H.; Andari, S.; Permatasari, E.O. Identification of Extreme Events in Climate Data from Multiple Sites. Procedia Eng. 2015, 125, 304–310. [Google Scholar] [CrossRef]
- Zhao, Q.K.; Gao, L.; Meng, Q.Y.; Zhu, M.M.; Xiong, M.Y. Nonlinear causal relationships between urbanization and extreme climate events in China. J. Clean. Prod. 2024, 434, 139889. [Google Scholar] [CrossRef]
- limate Change (IPCC). Climate Change 2013—The Physical Science Basis: Working Group I Contribution to the Fifth Assessment Report of the Intergovernmental Panel on Climate Change; Cambridge University Press: Cambridge, UK, 2014. [Google Scholar]
- Yang, R.X.; Hong, M.; Gao, Y.Y.; Wang, H.R.; Yu, S.; Yuan, H.H. Evaluation of Intensive and Safe Utilisation of Regional Water Resources—A Case Study of Beijing Municipality. J. Beijing Norm. Univ. (Nat. Sci.) 2024, 60, 1012202. [Google Scholar]
- Sadiq, R.; Tesfamariam, S. Environmental decision-making under uncertainty using intuitionistic fuzzy analytic hierarchy process (IF-AHP). Stoch. Environ. Recearch Risk Assess. 2009, 23, 75–91. [Google Scholar] [CrossRef]
- Peng, S.Q.; Lv, C.; Huang, D.R.; Cheng, Y.J.; Zhao, L. Fault Mode and Effectiveness Analysis Based on Intuitionistic Fuzzy AHP and Fuzzy MAIRTIC. Control Theory Appl. 2023, 107641. [Google Scholar]
- Papageorgiou, E.I.; Lakovidis, D.K. Intuitionistic fuzzy cognitive maps. IEEE Trans. Fuzzy Syst. 2012, 21, 342–354. [Google Scholar] [CrossRef]
- Diakoulaki, D.; Mavrotas, G.; Papayannakis, L. Determining objective weights in multiple criteria problems: The critic method. Comput. Oper. Res. 1995, 22, 763–770. [Google Scholar] [CrossRef]
- Wen, X.X.; Nie, Y.; Du, Z.X.; Huang, L.K. Operational Safety Assessment of Straddle-Type Monorail Vehicle System Based on Cloud Model and Improved Critic Method. Eng. Fail. Anal. 2022, 139, 106463. [Google Scholar] [CrossRef]
- Wu, B.; Jin, X.Z.; Li, D.; Wang, B.J. Spatial–Temporal Evolution of Coupling Coordination Development between Regional Highway Transportation and New Urbanization: A Case Study of Heilongjiang, China. Sustainability 2023, 15, 16365. [Google Scholar] [CrossRef]
- Mishra, V.; Thirumalai, K.; Singh, D.; Aadhar, S. Future exacerbation of hot and dry summer monsoon extremes in India. Npj Clim. Atmos. Sci. 2020, 3, 10. [Google Scholar] [CrossRef]
- Wang, R.; Lu, G.N.; Ning, L.; Yuan, L.W.; Li, L.H. Likelihood of compound dry and hot extremes increased with stronger dependence during warm seasons. Atmos. Res. 2021, 260, 105692. [Google Scholar] [CrossRef]
- Pongracz, R.; Bartholy, J.; Szabo, P.; Gelybo, G. A comparison of the observed trends and simulated changes in extreme climate indices in the Carpathian Basin by the end of this century. Int. J. Glob. Warm. 2016, 1, 336–355. [Google Scholar] [CrossRef]
- Wang, C.X.; Chen, C.; Zhang, S.Q.; Zhang, Z.F.; Pang, Y.M. Variation characteristics of extreme climate events in Southwest China from 1961 to 2017. Heliyon 2023, 9, e19648. [Google Scholar] [CrossRef]
- Rush, W.D.; Kiehl, J.T.; Shields, C.A.; Zachos, J.C. Increased frequency of extreme precipitation events in the North Atlantic during the PETM: Observations and theory. Palaeogeogr. Palaeoclimatol. Palaeoecol. 2021, 568, 110289. [Google Scholar] [CrossRef]
- Zhu, Y.L.; Song, F.W.; Guo, D. Interdecadal changes in the frequency of winter extreme cold events in North China during 1989–2021. Atmos. Ocean. Sci. Lett. 2024, 2, 5. [Google Scholar] [CrossRef]
- Xu, X.L. Multi-Year Data on the Boundaries of Provincial Administrative Divisions in China; Resource Environmental Science Data Center and Publishing System; 2023. Available online: https://www.resdc.cn/Datalist1.aspx?FieldTyepID=%20,33 (accessed on 18 April 2024).
- Srinivasan, G.; Agarwal, A.; Bandara, U. Chapter 2—Climate change impacts on water resources and agriculture in Southeast Asia with a focus on Thailand, Myanmar, and Cambodia. In The Rolr of Toropics in Climate Change; Elsevier: Amsterdam, The Netherlands, 2024; pp. 17–32. [Google Scholar]
- Aparicio, J.S.; Penafiel, L.L.; Alcala, F.J.; Saez, P.J.; Sanchez, J.P. Climate change impacts on renewable groundwater resources in the andosol-dominated Andean highlands, Ecuador. Catena 2021, 236, 107766. [Google Scholar] [CrossRef]
- Zhu, X.P.; Liu, J.; Gao, X.R.; Zhao, X.H.; Zhu, B.W. Future changes and distribution of water resources in China under global warming levels of 1.5–4.5 °C. J. Hydrol. Reg. Stud. 2024, 53, 101781. [Google Scholar] [CrossRef]
- Zhang, G.L.; Chen, X.; Zhou, Y.; Jiang, L.; Jin, Y.L.; Wei, Y.K.; Li, Y.P.; Pan, Z.H.; An, P.L. Aridification in a farming-pastoral ecotone of northern China from 2 perspectives: Climate and soil. J. Environ. Manag. 2022, 302, 114070. [Google Scholar] [CrossRef] [PubMed]
- Wubneh, M.A.; Workku, T.A.; Chekol, B.Z. Climate change impact on water resources availability in the kiltie watershed, Lake Tana sub-basin, Ethiopia. Heliyon 2023, 9, e13941. [Google Scholar] [CrossRef] [PubMed]
- Sharan, A.; Lal, A.; Datta, B. Evaluating the impacts of climate change and water over-abstraction on groundwater resources in Pacific island country of Tonga. Groundw. Sustain. Dev. 2023, 20, 100890. [Google Scholar] [CrossRef]
- Rankoana, S.A. Climate change impacts on water resources in a rural community in Limpopo province, South Africa: A community-based adaptation to water insecurity. Int. J. Clim. Chang. Strateg. Manag. 2020, 12, 587–598. [Google Scholar] [CrossRef]
- Kibria, A.S.; Seekamp, E.; Xiao, X.; Dalyander, S.; Eaton, M. Multi-criteria decision approach for climate adaptation of cultural resources along the Atlantic coast of the southeastern United States: Application of AHP method. Clim. Risk Manag. 2024, 43, 100587. [Google Scholar] [CrossRef]
- Ilham, N.I.; Dahlan, N.Y.; Hussin, M.Z. Optimizing solar PV investments: A comprehensive decision-making index using CRITIC and TOPSIS. Renew. Energy Focus 2024, 49, 100551. [Google Scholar] [CrossRef]
Figure 1.
Distribution map of the main rivers and elevation in Sichuan Province.

Figure 2.
Frequency of extreme climate events in Sichuan Province, 2007–2021.

Figure 3.
Regional distribution of extreme climate events in Sichuan Province, 2015–2021.

Figure 4.
The coupling coordination degree rating of the water resource–climate system in Sichuan Province, 2015–2021.
Figure 4.
The coupling coordination degree rating of the water resource–climate system in Sichuan Province, 2015–2021.

Figure 5.
Coupling coordination degree of the water resource system in Sichuan Province from 2015 to 2021.
Figure 5.
Coupling coordination degree of the water resource system in Sichuan Province from 2015 to 2021.


Table 1.
Sichuan Province water resource–climate system evaluation indicator system.
| System Layer | Element Layer | Indicator Layer | Unit | Nature |
|---|---|---|---|---|
| Water resource–climate system | water quantity subsystem | surface water resources | 108 m3 | + |
| underground water resources | 108 m3 | + | ||
| total water resources | 108 m3 | + | ||
| water supply subsystem | surface water supply | 108 m3 | + | |
| groundwater supply | 108 m3 | + | ||
| water supply from other water resources | 108 m3 | + | ||
| water quality subsystem | sewage discharge | 104 m3 | − | |
| sewage treatment rate | % | + | ||
| precipitation pH | - | + | ||
| climate subsystem | rainfall | mm | − | |
| temperature | °C | − | ||
| relative humidity | % | − |
Table 2.
Classification of the coupling coordination degree levels.
| Range of Coupling Coordination Degree | Serial Number | Coordination Level |
|---|---|---|
| [0.0, 0.1) | 1 | extreme imbalance |
| [0.1, 0.2) | 2 | serious imbalance |
| [0.2, 0.3) | 3 | moderate imbalance |
| [0.3, 0.4) | 4 | mild imbalance |
| [0.4, 0.5) | 5 | imminent imbalance |
| [0.5, 0.6) | 6 | barely coordination |
| [0.6, 0.7) | 7 | primary coordination |
| [0.7, 0.8) | 8 | intermediate coordination |
| [0.8, 0.9) | 9 | good coordination |
| [0.9, 1.0] | 10 | quality coordination |
Table 3.
The maximum, minimum, and average values of rainfall and temperature in 21 regions of Sichuan Province.
Table 3.
The maximum, minimum, and average values of rainfall and temperature in 21 regions of Sichuan Province.
| City | Rainfall (mm) | Temperature (°C) | ||||
|---|---|---|---|---|---|---|
| Maximum | Minimum | Average | Maximum | Minimum | Average | |
| Aba Tibetan and Qiang Autonomous Prefecture | 1074.4 | 588.8 | 858.3 | 9.9 | 8.9 | 9.4 |
| Bazhong | 1728.7 | 863.1 | 1204.6 | 17.9 | 16.3 | 17.1 |
| Chengdu | 1343.3 | 610.9 | 972.2 | 16.9 | 15.9 | 16.5 |
| Dazhou | 1638.1 | 976.1 | 1271.4 | 18.6 | 17.3 | 17.9 |
| Deyang | 1650.6 | 711.0 | 963.2 | 17.9 | 16.0 | 16.9 |
| Tibetan Autonomous Prefecture of Garzê | 994.9 | 712.9 | 847.1 | 8.4 | 7.1 | 7.9 |
| Guang’an | 1538.6 | 837.6 | 1144.7 | 18.3 | 17.2 | 17.6 |
| Guangyuan | 1485.1 | 895.4 | 1036.2 | 17.3 | 17.1 | 16.5 |
| Leshan | 1555.3 | 768.9 | 1226.7 | 18.8 | 17.2 | 18.1 |
| Yi Autonomous Prefecture of Liangshan | 1284.3 | 558.2 | 1015.3 | 19.2 | 17.3 | 17.8 |
| Luzhou | 1443.7 | 765.0 | 1149.5 | 18.6 | 17.2 | 18.1 |
| Meishan | 1310.5 | 754.9 | 999.2 | 18.4 | 17.1 | 17.8 |
| Mianyang | 1367.0 | 545.5 | 911.7 | 18.1 | 16.5 | 17.3 |
| Nanchong | 1262.8 | 863.6 | 1095.4 | 18.9 | 17.4 | 17.9 |
| Neijiang | 1246.3 | 646.5 | 1000.9 | 18.6 | 17.1 | 17.9 |
| Panzhihua | 1053.4 | 537.7 | 759.7 | 22.6 | 20.5 | 21.3 |
| Suining | 1311.0 | 795.6 | 1024.5 | 18.2 | 16.8 | 17.6 |
| Ya’an | 2161.3 | 1833.6 | 1729.5 | 17.5 | 15.9 | 16.8 |
| Yibin | 1746.0 | 644.2 | 1078.8 | 19.3 | 17.5 | 18.4 |
| Ziyang | 1203.3 | 633.3 | 918.3 | 18.6 | 17.0 | 17.8 |
| Zigong | 1223.2 | 605.2 | 970.4 | 19.3 | 17.8 | 18.6 |
Table 4.
Identification of extreme high temperature events.
| Time | City | γ | Time | City | γ | Time | City | γ |
|---|---|---|---|---|---|---|---|---|
| 2021 | Panzhihua | 1.24 | 2015 | Suining | 1.47 | 2015 | Yibin | 1.30 |
| 2013 | Zigong | 1.54 | Leshan | 1.29 | 2016 | Dazhou | 1.40 | |
| Guangyuan | 2.39 | Nanchong | 2.27 | Bazhong | 1.57 | |||
| Neijiang | 1.63 | Meishan | 1.39 | 2019 | Panzhihua | 2.11 | ||
| Nanchong | 2.27 | Bazhong | 1.38 | Yi Autonomous Prefecture of Liangshan | 2.69 | |||
| Yibin | 1.46 | Ziyang | 1.70 | 2021 | Aba Tibetan and Qiang Autonomous Prefecture | 1.83 | ||
| 2015 | Mianyang | 1.42 | Dazhou | 1.26 | Yi Autonomous Prefecture of Liangshan | 1.38 |
Table 5.
Identification of extreme precipitation events.
| Time | City | γ | Time | City | γ | Time | City | γ |
|---|---|---|---|---|---|---|---|---|
| 2007 | Dazhou | 1.25 | 2016 | Yibin | 2.30 | 2020 | Meishan | 1.78 |
| 2010 | Ya’an | 1.45 | 2017 | Tibetan Autonomous Prefecture of Garzê | 1.33 | Leshan | 1.32 | |
| 2012 | Yi Autonomous Prefecture of Liangshan | 1.53 | Guang’an | 1.62 | Yibin | 2.30 | ||
| Neijiang | 1.21 | 2018 | Mianyang | 2.10 | 2021 | Mianyang | 1.53 | |
| 2013 | Chengdu | 1.75 | Deyang | 2.89 | Guangyuan | 2.38 | ||
| Zigong | 1.41 | Chengdu | 1.31 | Dazhou | 1.65 | |||
| Luzhou | 1.41 | Ya’an | 1.73 | Guang’an | 1.82 | |||
| Suining | 2.01 | Meishan | 1.89 | Nanchong | 1.33 | |||
| 2014 | Dazhou | 1.37 | Ziyang | 1.74 | Ya’an | 1.42 | ||
| Yi Autonomous Prefecture of Liangshan | 1.79 | 2019 | Aba Tibetan and Qiang Autonomous Prefecture | 1.59 | Neijiang | 1.27 | ||
| 2015 | Panzhihua | 2.22 | Bazhong | 2.05 | Zigong | 1.51 | ||
| Tibetan Autonomous Prefecture of Garzê | 1.31 | Ziyang | 1.65 | Bazhong | 2.00 | |||
| 2016 | Panzhihua | 1.48 | 2020 | Aba Tibetan and Qiang Autonomous Prefecture | 1.34 | / | ||
| Luzhou | 1.30 | Chengdu | 1.21 | |||||
Table 6.
Identification of extreme low temperature event.
| Time | City | γ | Time | City | γ | Time | City | γ |
|---|---|---|---|---|---|---|---|---|
| 2007 | Panzhihua | −1.34 | 2010 | Suining | −1.49 | 2012 | Luzhou | −2.20 |
| Yi Autonomous Prefecture of Liangshan | −1.21 | Meishan | −1.22 | 2013 | Panzhihua | −1.51 | ||
| 2008 | Zigong | −1.24 | 2011 | Deyang | −1.76 | 2014 | Chengdu | −1.28 |
| Neijiang | −1.29 | Mianyang | −1.60 | Ziyang | −1.78 | |||
| Dazhou | −1.35 | Meishan | −1.46 | 2019 | Guangyuan | −1.26 | ||
| 2010 | Chengdu | −1.28 | Ya’an | −1.34 | Yibin | −1.90 | ||
| Zigong | −1.59 | 2012 | Chengdu | −1.63 | Bazhong | −1.37 | ||
| Mianyang | −1.22 | Luzhou | −2.20 | 2021 | Bazhong | −1.20 |
Table 7.
Identification of extreme drought events.
| Time | City | γ | Time | City | γ | Time | City | γ |
|---|---|---|---|---|---|---|---|---|
| 2007 | Chengdu | −1.46 | 2010 | Luzhou | −1.56 | 2016 | Mianyang | −1.69 |
| Leshan | −1.24 | Deyang | −1.51 | Guangyuan | −1.34 | |||
| Meishan | −1.48 | 2011 | Zigong | −2.18 | Nanchong | −1.47 | ||
| Ziyang | −1.74 | Panzhihua | −1.68 | Bazhong | −1.33 | |||
| 2008 | Chengdu | −1.46 | Neijiang | −1.83 | 2017 | Leshan | −1.52 | |
| Leshan | −1.24 | Leshan | −1.84 | Neijiang | −1.71 | |||
| 2009 | Meishan | −1.48 | 2012 | Chengdu | −1.70 | Ziyang | −1.53 | |
| Ziyang | −1.74 | Guang’an | −1.99 | Suining | −1.61 | |||
| Chengdu | −1.46 | Guangyuan | −1.31 | 2018 | Dazhou | −1.33 | ||
| 2010 | Leshan | −1.24 | 2015 | Ya’an | −1.36 | / | ||
Disclaimer/Publisher’s Note: The statements, opinions and data contained in all publications are solely those of the individual author(s) and contributor(s) and not of MDPI and/or the editor(s). MDPI and/or the editor(s) disclaim responsibility for any injury to people or property resulting from any ideas, methods, instructions or products referred to in the content. |
© 2024 by the authors. Licensee MDPI, Basel, Switzerland. This article is an open access article distributed under the terms and conditions of the Creative Commons Attribution (CC BY) license (https://creativecommons.org/licenses/by/4.0/).
Share and Cite
MDPI and ACS Style
Ma, F.; Li, Z. Impacts of Extreme Climate on the Water Resource System in Sichuan Province. Water 2024, 16, 1217. https://doi.org/10.3390/w16091217
AMA Style
Ma F, Li Z. Impacts of Extreme Climate on the Water Resource System in Sichuan Province. Water. 2024; 16(9):1217. https://doi.org/10.3390/w16091217
Chicago/Turabian StyleMa, Fang, and Zhijun Li. 2024. "Impacts of Extreme Climate on the Water Resource System in Sichuan Province" Water 16, no. 9: 1217. https://doi.org/10.3390/w16091217
Note that from the first issue of 2016, this journal uses article numbers instead of page numbers. See further details here.