Article

Peatlands as Filters for Polluted Mine Water?—A Case Study from an Uranium-Contaminated Karst System in South Africa—Part I: Hydrogeological Setting and U Fluxes

1
North-West University, School of Environmental Sciences and Development, Private Bag X6001, Potchefstroom, 2520, South Africa
2
Geotechnical Environmental Specialists, 108 Wenning Street, Groenkloof, Pretoria, 0181, South Africa
*
Author to whom correspondence should be addressed.
Water 2011, 3(1), 291-322; https://doi.org/10.3390/w3010291
Submission received: 12 February 2011 / Accepted: 10 March 2011 / Published: 15 March 2011

Abstract

:
Located downstream of goldfields of the Witwatersrand basin, the Gerhard Minnebron (GMB) Eye—as major water source for downstream community of some 300,000 people—may be impacted on by mining-related water pollution especially with uranium (U). Containing up to 5 m-thick deposits of peat that is frequently reported to act as a filter for U and other heavy metals, this paper is the first part of a series that aims to quantify the ability of the GMB peatland to act as buffer against current and future U pollution. In a first step, this paper outlines the geohydrological conditions and discusses how deep–level gold mining impacted on the dolomitic aquifers. Subsequently, the potential influx of U into the wetland is estimated and associated sources and pathways analyzed. Finally, a model is proposed explaining the significant differences in degree and dynamics of U observed within a single groundwater compartment.

1. Introduction

Peat consists of partially decomposed wetland plants accumulating in waterlogged environments where the surplus of dead organic matter results in anaerobic conditions under which complete decomposition cannot be achieved. With 99% of all known peat deposits being located in humid regions of the northern hemisphere, peat in southern Africa is a generally scarce resource [1,2]. This is particular true for the semiarid interior plateau of South Africa where the studied peatland is located. The peatland at the Gerhard Minnebron (GMB) wetland owes its existence mainly to a strong perennial discharge of groundwater from a karst spring known as the ‘Gerhard Minnebron Eye’ and can thus be classified as a karst fen [3,4]. Currently, the spring water is mainly used for the domestic water supply system of the downstream municipality of Potchefstroom as well as by local farmers.
The GMB eye is fed by groundwater emanating from an extensive system of discrete, interlinked dolomitic karst aquifers (so-called ‘compartments’). Four of the nine compartments that affect the fluvial system of the Wonderfonteinspruit (WFS) that runs upstream of the GMB eye are impacted on by deep level gold mining. Apart from large-scale dewatering, which lowered the groundwater table by up to 1,000 m in places, this also includes pollution through the filling of caves and sinkholes with uraniferous tailings, the discharge of polluted effluents into the WFS as well as through significant volumes of seepage flowing directly from tailings deposits into the underlying karst aquifer. While the associated water pollution of the GMB spring has been discussed in previous studies [5,6,7,8], the actual extent and the specific sources as well as the exact pathways and mechanisms are still largely unknown.
Since 1993, an estimated 60% of the peat has been extracted from the wetland mainly for mushroom production (casing substrate) and for use in horticultural soil enhancing products. In view of the rapid destruction of a potentially beneficial resource, in 2006, the Department of Water Affairs (DWA) commissioned a study to assess associated impacts on the hydrological system [9]. A major focal point of the study is to investigate to what extent the remaining peat deposits may act as a buffer between upstream mining pollution, especially with waterborne uranium (U), and the downstream water supply of Potchefstroom. Such buffer function was inferred from the frequently reported ability of peat to remove uranium and other contaminants from water [10,11,12,13,14,15] and could be vital in a possible (worst case) post-mining scenario where the GMB eye is expected to be one of three major outflow points through which large volumes of highly contaminated mine water may be discharged from flooded underground mine voids [16].
In part one of this paper the hydrogeological setting of the GMB peatland and its significance for the formation of the peatland at GMB are discussed. Furthermore, hydraulic links between the peatland and adjacent fluvial systems and aquifers, on surface and underground, are analyzed and associated water fluxes quantified including a preliminary quantification of the total contribution of the peatland system to the downstream water supply system. In order to estimate the pollution potential posed by the upstream gold mines, the total annual load of dissolved U entering the Wonderfonteinspruit as well as a karst aquifer associated with the GMB peatland is determined.
The second part of the paper concentrates on quantifying the buffer/filter function of the peatland for waterborne uranium. This includes a brief overview on possible mechanisms of U removal and accumulation as reported in the literature as well as a series of batch experiments to assess to what extent peat, under local conditions, is able to trap and retain U from typical mine waters. U concentration in different types of waters of the peatland as well as sediments and peat samples from various depths are determined to identify possible effects of mining-related pollution.
The effectiveness of peat as a potential filter is not only determined by its ability to remove U from the water phase but also by the extent of surface and groundwater water fluxes moving through the peat. In order to obtain a first order approximation the hydraulic conductivity of peat is determined in a column experiment as well as in situ. The latter is based on quasi-continuous datalogger-controlled measurements in undisturbed peat. Based on the above, a conceptual model will be presented on the formation and hydrological significance of the peatland and its ability to act as buffer against current and future uranium pollution emanating from upstream mining areas.

2. Hydrological and Hydrogeological Conditions

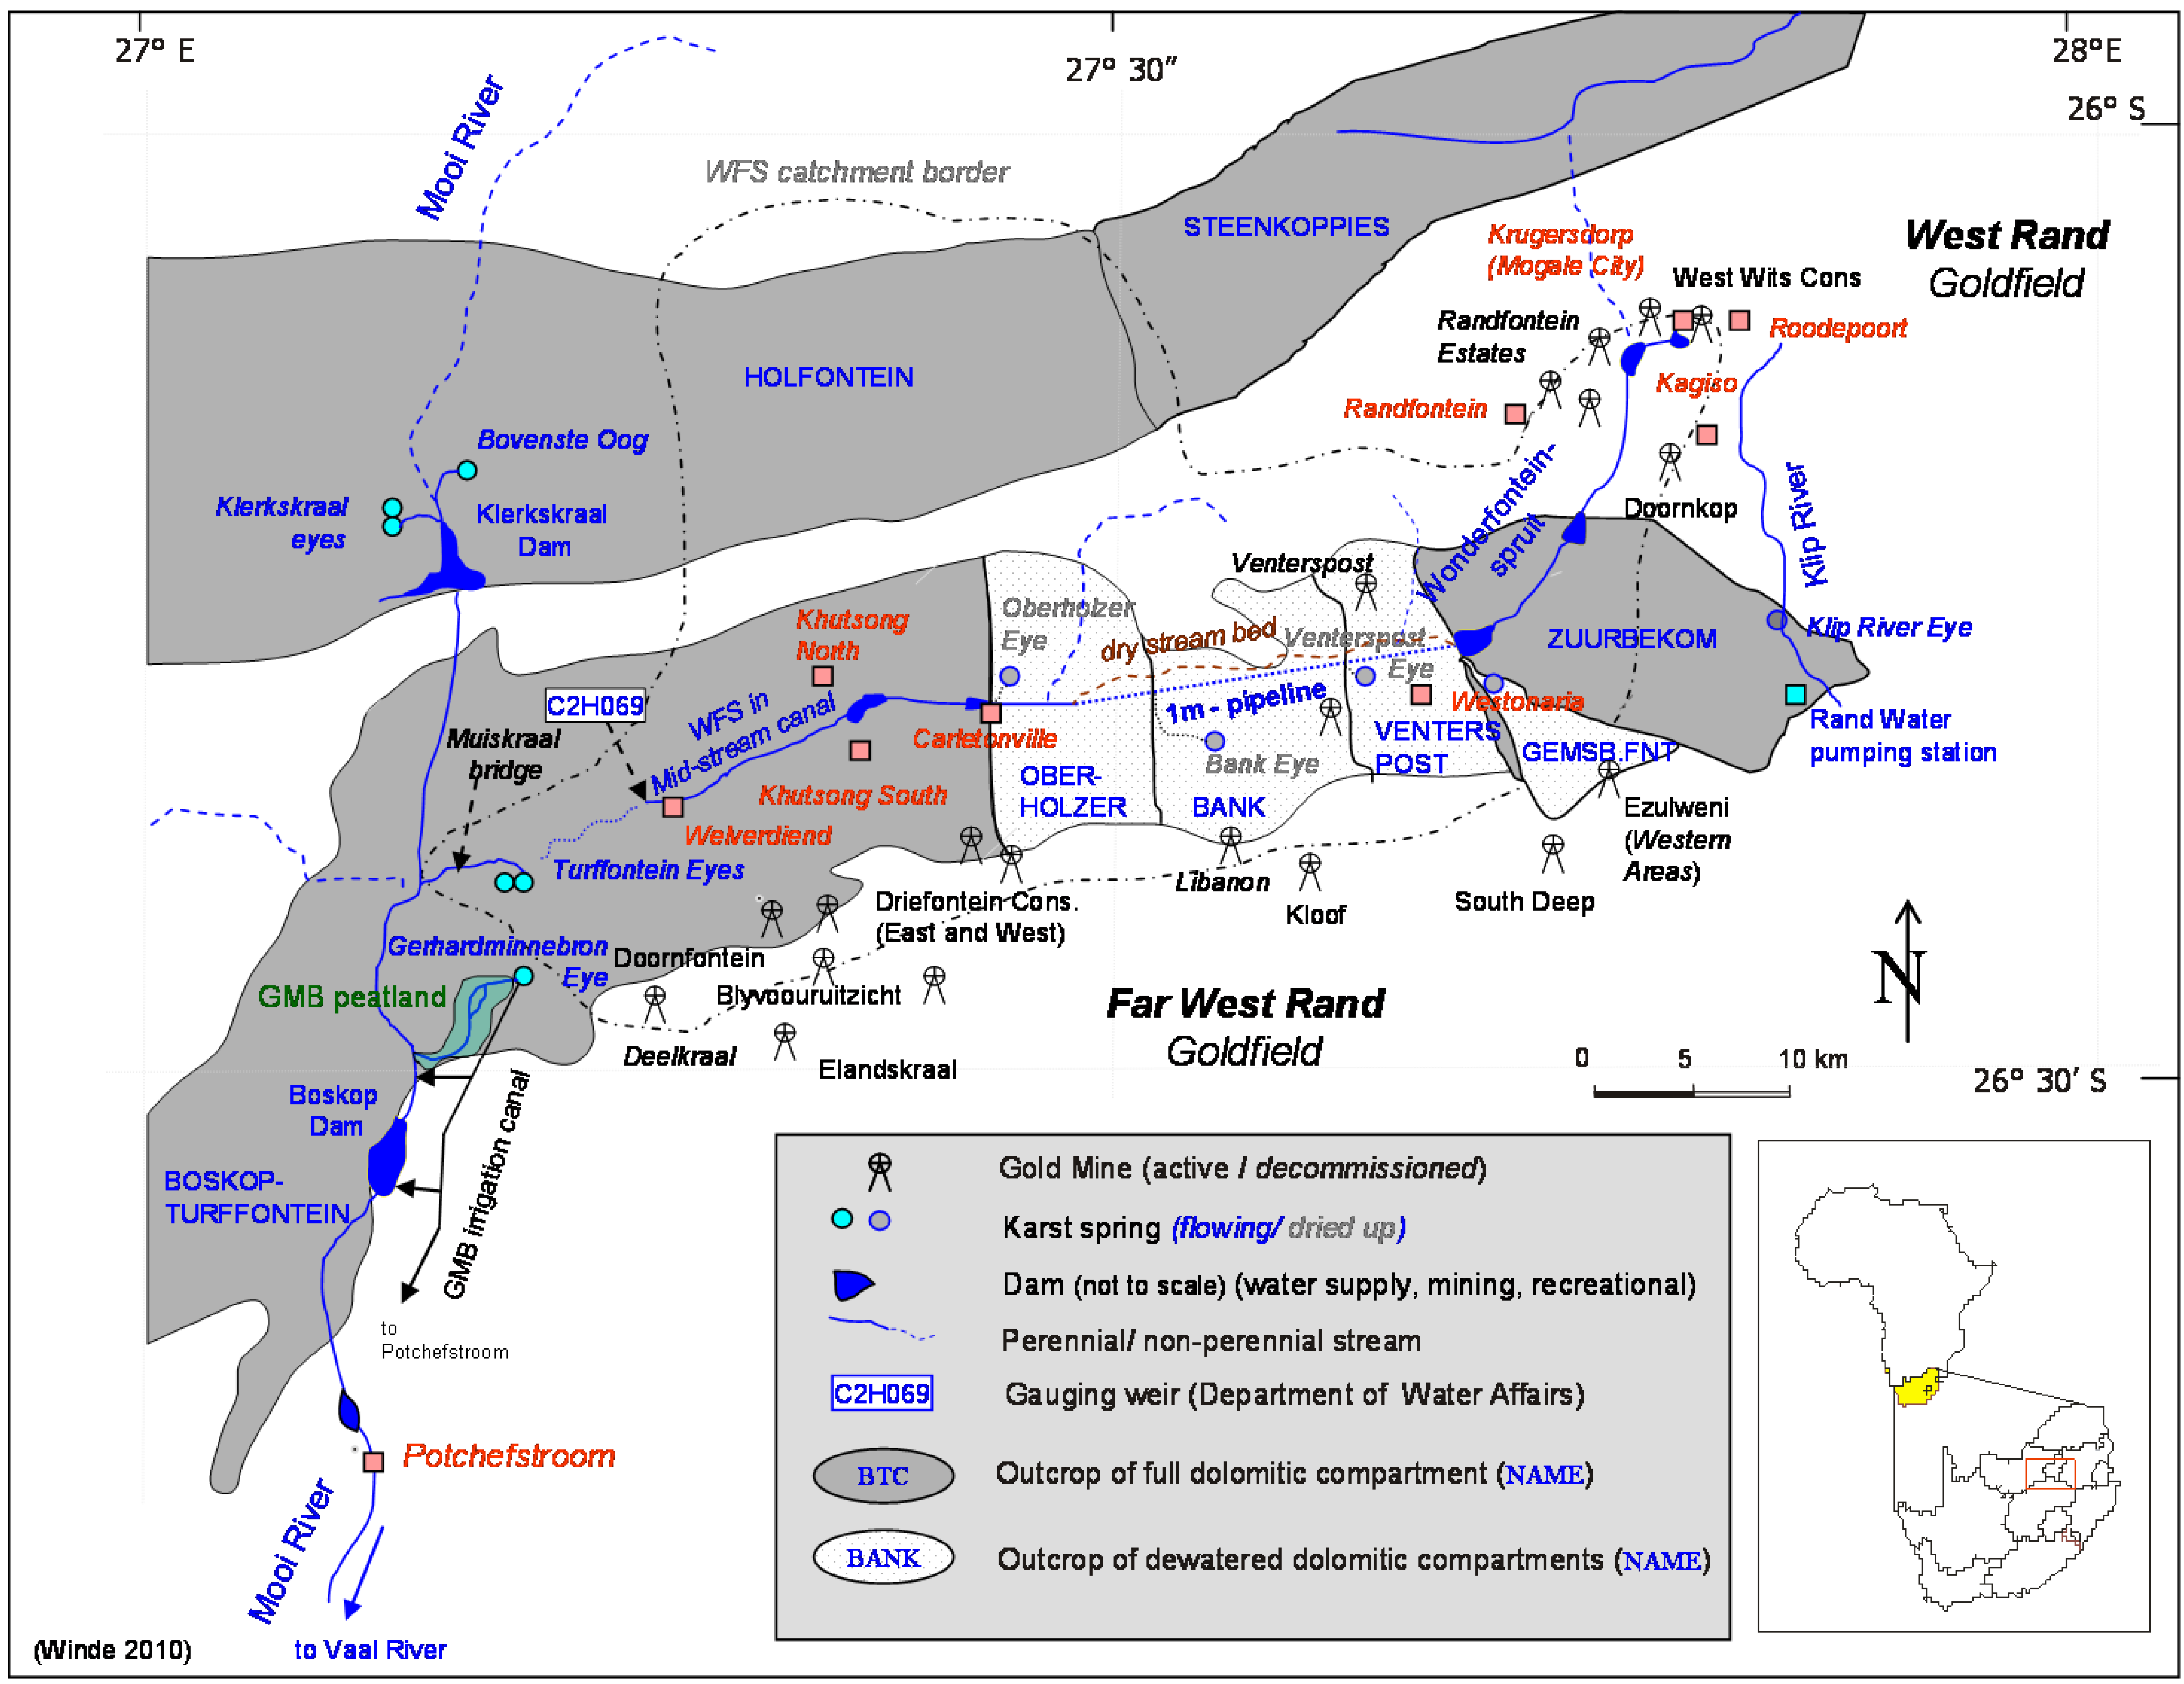
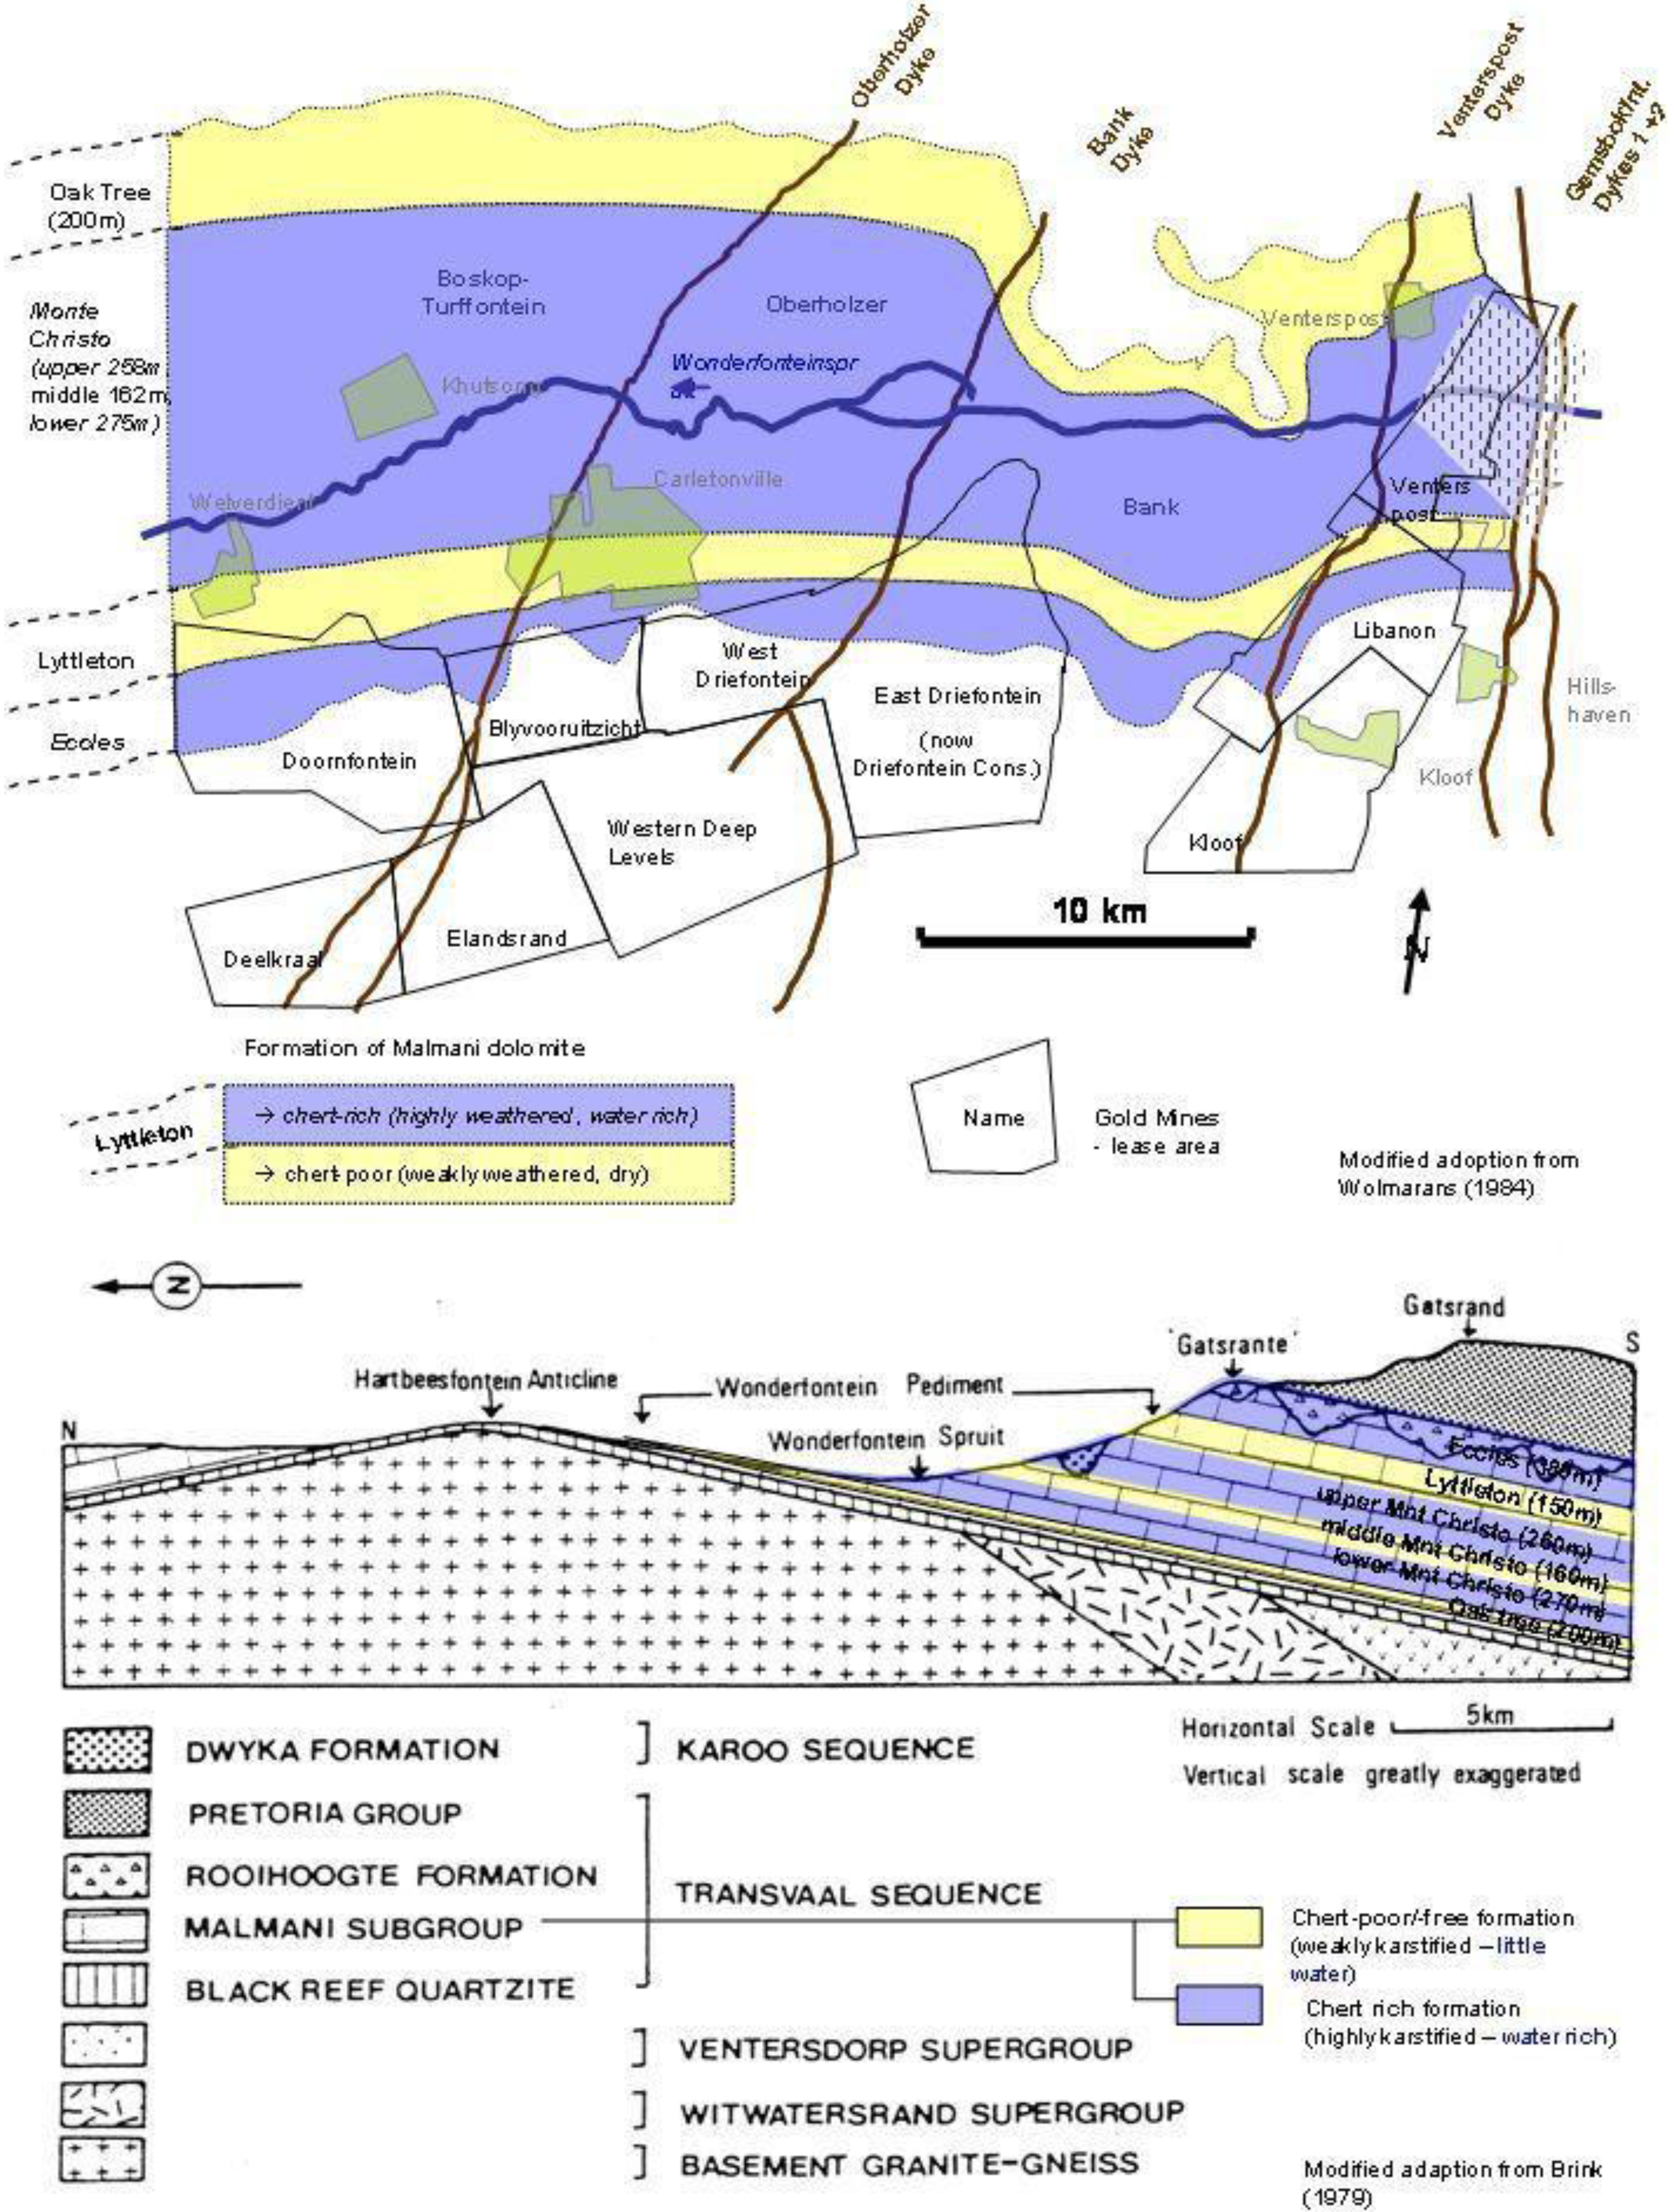
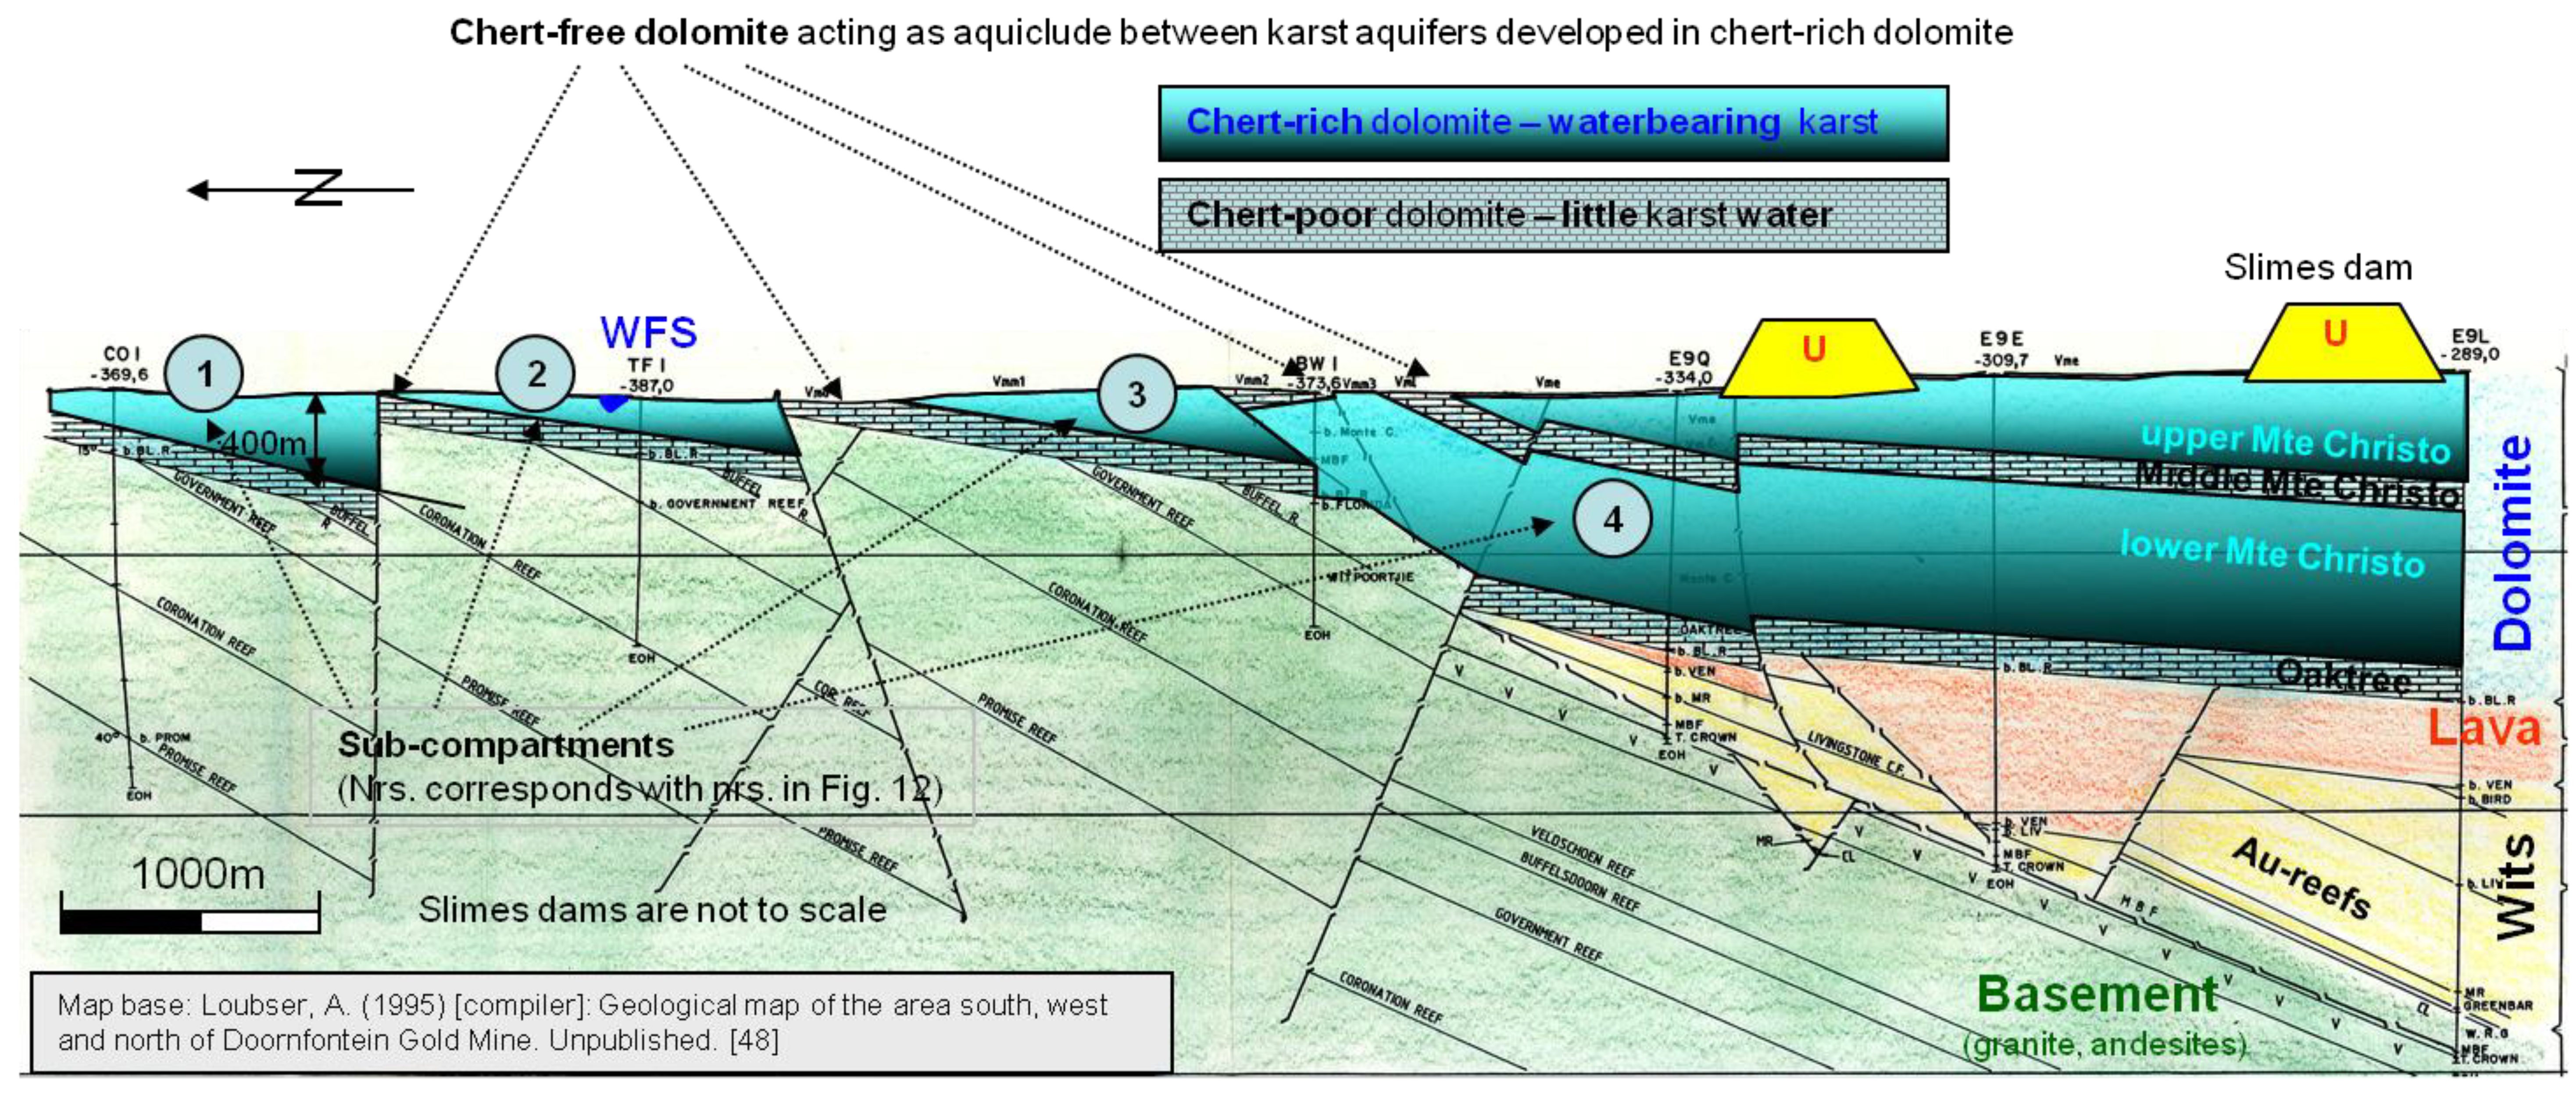
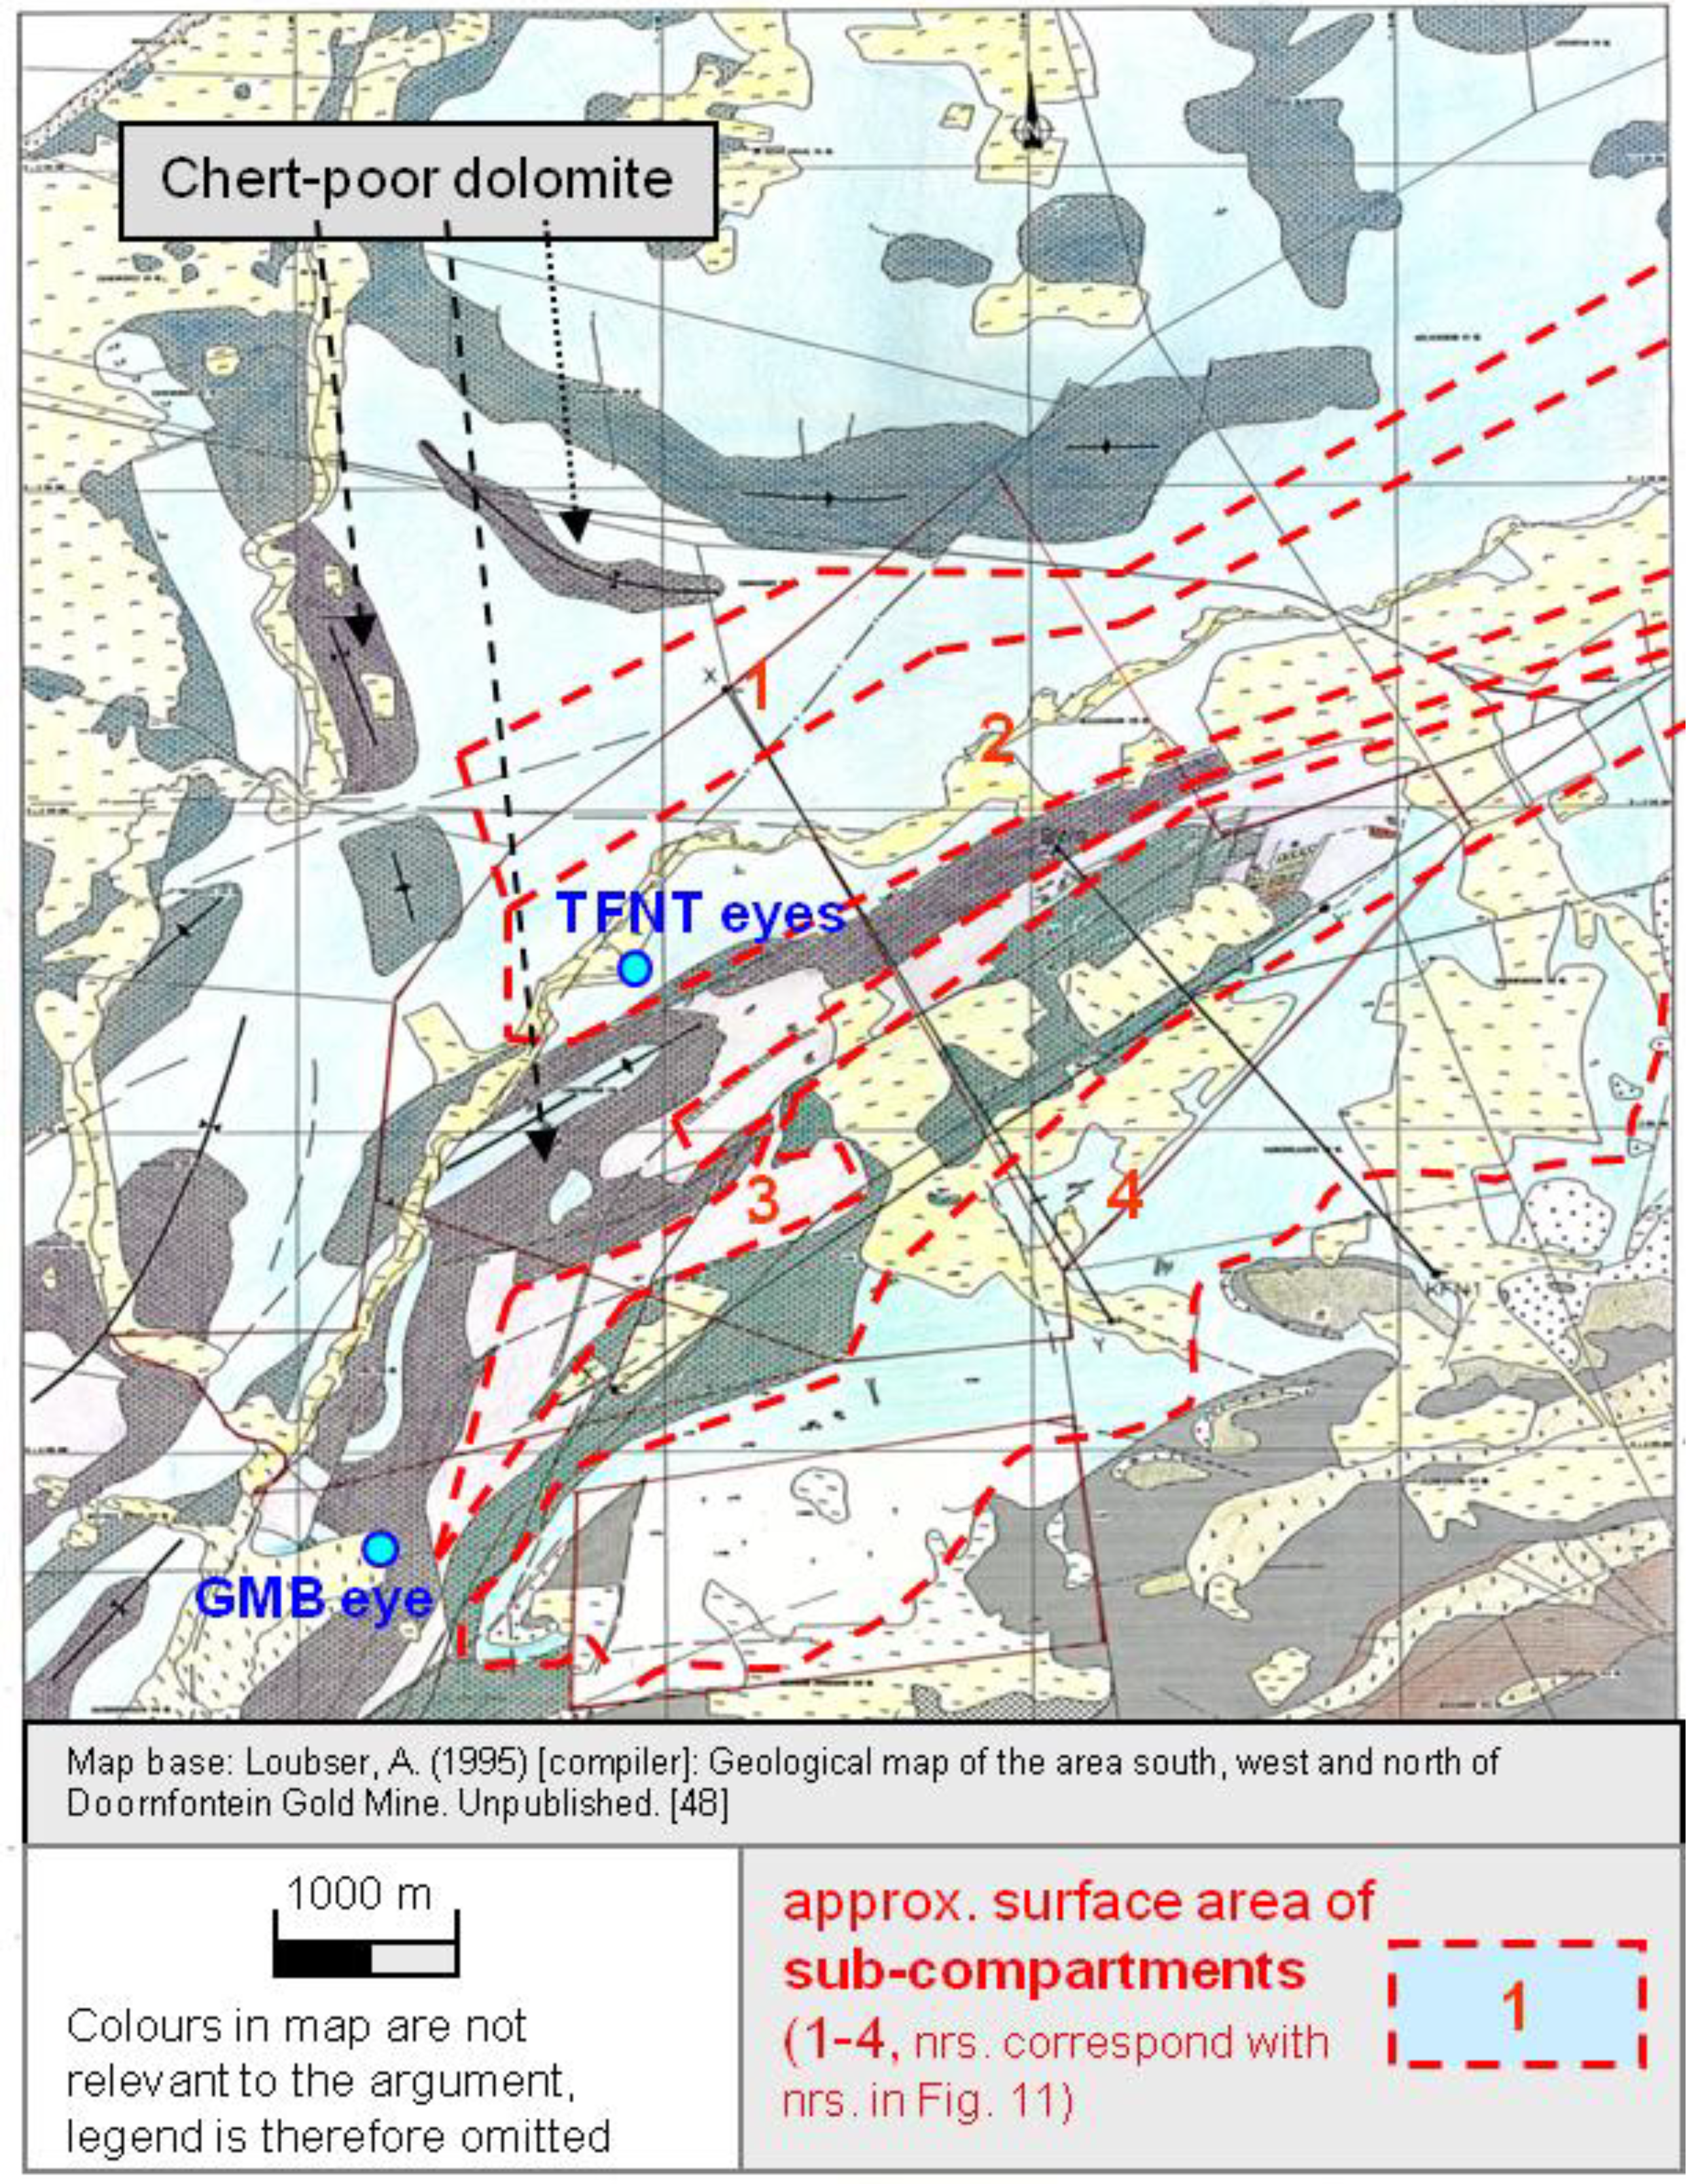
2.1. Regional Overview

The GBM eye together with the upper and lower Turffontein eyes constitutes the major outflow point of dolomitic groundwater from a large karst aquifer called ‘Boskop-Turffontein Compartment’ (BTC). This compartment is the largest and lowest lying in a succession of several others located further up in the Wonderfonteinspruit (WFS) catchment [17,18].
Originating south of the sub-continental divide near Krugersdorp (now Mogale City) the 90 km-long WFS runs over approximately 80 km across several dolomitic compartments to finally join the upper Mooi River. The GMB peatland, however, falls outside the (surface) catchment of the WFS and feeds via an unnamed stream (in this study called ‘GMB-stream’) also into the upper Mooi River, some 4 km upstream of Boskop Dam as the main reservoir for the water supply of some 250,000 people of the Potchefstroom municipality (now Tlokwe) (Figure 1).
Separated from each other by near impervious, approximately north-south trending syenite and dolorite dykes the dolomitic compartments, perennially, feed large volumes of dolomitic groundwater via so-called eyes (karst springs) into the WFS as reflected in its Afrikaans name (‘Miraculous Fountain Stream’) (Figure 2).
Most of the groundwater is stored in the upper 40–100 m (below the original water table prior to dewatering) of the outcropping Malmani dolomite in what is termed the ‘cavernous zone’ [19,20,21]. This zone consists of a network of caves and cavities interconnected by solutions slots, underground channels and fractures, totaling a storage capacity which exceeds that of the full Vaal Dam (with 2,536 million m3 at full capacity the second largest dam in South Africa) by several times. The 2.65–2.47 billion year-old dolomite [22] has been subjected to extensive karstification resulting in the five longest caves in southern Africa being present in the WFS catchment as well as a number of karst springs (locally termed ‘eye’ or ‘oog’ in Afrikaans) which are amongst the strongest in the country [23]. Owing to their significant storage capacity and associated spring flow, the dolomitic compartments in the WFS catchment and other karst aquifers in the Transvaal (a former province in south Africa) have historically been the subject of many water-related investigations [6,17,18,19,24,25,26,27].
Figure 1. Location of the Gerhard Minnebron wetland in relation to dolomitic compartments and gold mines in the adjacent catchment of the Wonderfonteinspruit.
Water 03 00291 g001
Figure 2. Schematic cross section of the dolomitic compartments associated with the Wonderfonteinspruit and the Gerhard Minnebron eye indicating pre-mining discharge rates from dolomitic eyes, groundwater storage volumes in associated compartments as well as differences in water table elevation between the individual compartments (based on data and a figure in Enslin, 1967, [27] the storage volume for the Boskop-Turffontein compartment is estimated).
Water 03 00291 g002
The degree of karstification is not homogenous across the up to 1.5 km-thick dolomite in the study area but varies in accordance with a number of parameters, the most significant being the percentage of chert (layers) in the various dolomitic formations. Generally, chert-rich formations display a higher degree of karstification and thus contain more groundwater than chert-poor or chert-free dolomite [6].
Table 1 lists the relevant different dolomitic formations and the associated chert- and water content in relation to the general stratigraphy of the study area.
Table 1. Stratigraphic position of different dolomitic formations in study area.
Sequence/Supergroup (SG)GroupSubgroupFormationSub-formationChert-/water contents of dolomite * (Yield [L/s]) **Type of rocksAv. thickness in study area [m] *
Transvaal sequencePretoriaRooihoogteshales~300
ChuniespoortMalmaniEccleshigh (11)dolomite~380
LyttletonLow (3)dolomite~50
Monte Christoupperhigh (12)dolomite~260
middlelowdolomite~160
lowerhighdolomite~270
Oak TreeLow (6)dolomite~200
Black Reefquartzite, shales~10
Ventersdorp SGVentersdorp lavalavas~1,800
Venterspost conglomerateVentersdorp Contact Reefquartzite0...~3
Witwatersrand SGCentral RandVarious gold reefs (incl. carbon leader)quartzite, shales~3,000
Basementgranites, gneiss
* [28]; ** average borehole yield according to [29] as observed in a total of 950 boreholes in the Schoonspruit compartment
Table 2 displays the hydraulic transmissivity for dolomite at different depths as determined by [6] through pumping test conducted in boreholes of the dewatered Bank compartment.
Table 2. Hydraulic transmissivity for dolomite in the Bank compartment [6].
Depth (below groundwater rest level*)Transmissivity [m3/d × m2]
0–2 m>7,000
--> highest transmissivity found next to the Bank Dyke and the Wonderfonteinspruit
>1,000
Southern flank of the Wonderfontein Valley
2–12 m1,000–100
>12 m<100
(* ‘Groundwater rest level’—the elevation at which the groundwater table stabilizes after a pumping test. Since boreholes first need to intersect water bearing karst channels before water is struck the ‘rest level’ is frequently several tens of meters higher than the bottom of the drilled borehole owing to water equilibrating with the level in higher lying karst reservoir connected to the struck karst channel).
Approximately 95% of the water overlying the mine voids is stored in the upper 5% of the rock column. Based on an average porosity of some 10 volume%, the dewatered part of the outcropping dolomite underlying the WFS (365 km²) has a storage capacity of 3,500 million m3 (estimated based on data in [6,21,30]. This is in addition to the storage capacity of the downstream Boskop–Turffontein compartment that comprises an outcrop area of an estimated 800 km². At a similar porosity and weathering depth as found in the upstream compartments that would add some 7,700 million m3 of underground storage capacity (Figure 2). However, the actual storage capacity depends to a large extent on the chert-contents of the most prominent outcropping formation. Since the dolomite dips toward the south at an angle of approximately 7 degrees older, that is stratigraphically lower, formations are also exposed to the surface. Figure 3 illustrates the areas the different dolomitic formations occupy in the WFS catchment as well as a vertical cross section.
Figure 3 illustrates that the stream channel of the WFS is mainly eroded into highly karstified (chert-rich) dolomite of the upper and lower Monte Christo formation that also covers much of the BTC (the dolomitic outcrop area to the west of the Oberholzer dyke). In contrast, chert-poor and thus water free formations such as Oak Tree (at the northern rim of the dolomite outcrop) and Lyttleton (between the lower Monte Christo and the Eccles formation at the southern rim of the dolomite outcrop) cover only a comparably small proportion of the outcrop area. Since the proportions between water-rich and water-poor formations are similar across all compartments it is assumed that the Boskop-Turffontein displays a similar high storage capacity as developed in the three upstream dewatered compartments.
In this context, it is worth noting that the upper part of the BTC is also affected by increased sinkhole formation which, amongst others, necessitate the (expensive) relocation of some 18,000 households from Khutsong North, which was established on chert-rich dolomites, to an (also dolomitic, but chert poor) area further south [31]. Reasons for the increased ground instability include the area being underlain by chert rich dolomite formations in a zone of the BTC that is naturally dewatered, and urban induced concentrated surface ingress. The latter is caused by a combination of urban disturbances of a naturally occurring soil seal that acts as a dispersing mechanism for ingressing surface water, and that the large proportion of sealed surface areas commonly found in urban settlements tend to concentrate stormwater run off, which in the upstream dewatered compartments was found to be a major trigger of sinkhole formation. (This is mainly through subterraneous erosion by infiltrating water that removes soil and other filling material from pre-existing, underground cavities into even deeper lying karst receptacles that fell dry after the groundwater table and thus the erosion base was lowered. The continued removal of fine fill material results in a growing hollow cavity, the arch of which finally collapses due to a lack of support resulting in the sudden, and therefore often catastrophic, appearance of sinkholes. Large sinkholes occurring in the wake of dewatering measured up to 100 m in diameter and several tens of meters in depth [20]). In the case of the BTC, such lowering of the groundwater table has occurred due to erosion in the lower (western) part of the compartment, lowering the topographic surface and water table intersection plane and thus the associated groundwater table. In the somewhat steeper upper (eastern) part of the BTC, this may have resulted in a water level drop that dried up a previously water bearing karst channel system that now acts as a receptacle for the eroded overburden. Such natural drops in groundwater level over long periods of time (since the deposition of the dolomite) is the reason for the frequent presence of sinkholes that were subsequently filled with sediment and soil—paleo-sinkholes—and are now reactivated in and around the Khutsong area.
Figure 3. Horizontal and vertical location of water-rich and water poor dolomitic formation in the study area (upper map based on [6] (modified); lower cross section adopted from [28]).
Water 03 00291 g003
Apart from the increased volume of storm water drainage, disturbances of natural seals such as clay layers and increased stress on building ground that is associated with the continued growth of the settlement and urban development, the observed rise in ground instability may also relate to a more recent drop in the elevation of the groundwater table. Since the compartment is not actively dewatered, this is regarded as largely unrelated to the nearby deep-level mining activities. However, localized groundwater depression cones surrounding pumping shafts at the Blyvooruitzicht GM may indicate that some groundwater is abstracted by mining (and subsequently used for mining purposes) and may thus somewhat contribute to the overall drop in groundwater levels. Since Khutsong North is located in close proximity to the dyke, where the groundwater level is currently some 60 m below surface, this may have contributed to accelerated ground instability.
It should perhaps also be investigated if possible abstraction of groundwater for irrigation is taking place in the area and if so to what extent it may contribute to the lowering of the groundwater level in this area.

2.2. Type and Formation of Karst Springs

Dolomitic eyes in the Wonderfonteinspruit catchment

Most of the dolomitic eyes in the WFS catchment are ‘dammed springs’ that owe their existence to the dykes which dam groundwater in the underground karst aquifer resulting in rising groundwater levels [32]. The actual spring or eye occurs where the groundwater table intersects the topographic surface commonly close to the dyke and the WFS stream channel in low lying parts of the floodplain that are connected to the underground karst channel system. Fed by a continuous stream of up-welling groundwater overflowing the lowest point of the perimeter of the eye the flow from these springs is commonly slow and steady even though large volumes may be discharged. Spring discharge is particularly high where the associated dyke cuts across the entire compartment forcing all the water of the karst aquifer to drain towards this spring. Typical examples for such high-volume, dammed springs are the Venterspost-, Bank- and Oberholzer-eye, which all dried up soon after dewatering in the associated compartments commenced. They followed the Klip River eye in the Zuurbekom compartment that was the first spring that fell dry in 1913 due to sustained groundwater abstraction by the Rand Water pumping station [33]. The latter is still in operation. Where dykes do not cut through the entire compartment but remain localized barriers within a larger aquifer, some of the groundwater may be able to bypass the dyke rendering flow from the associated eye less strong. Examples in the study area include the upper and the lower Turffontein eye.

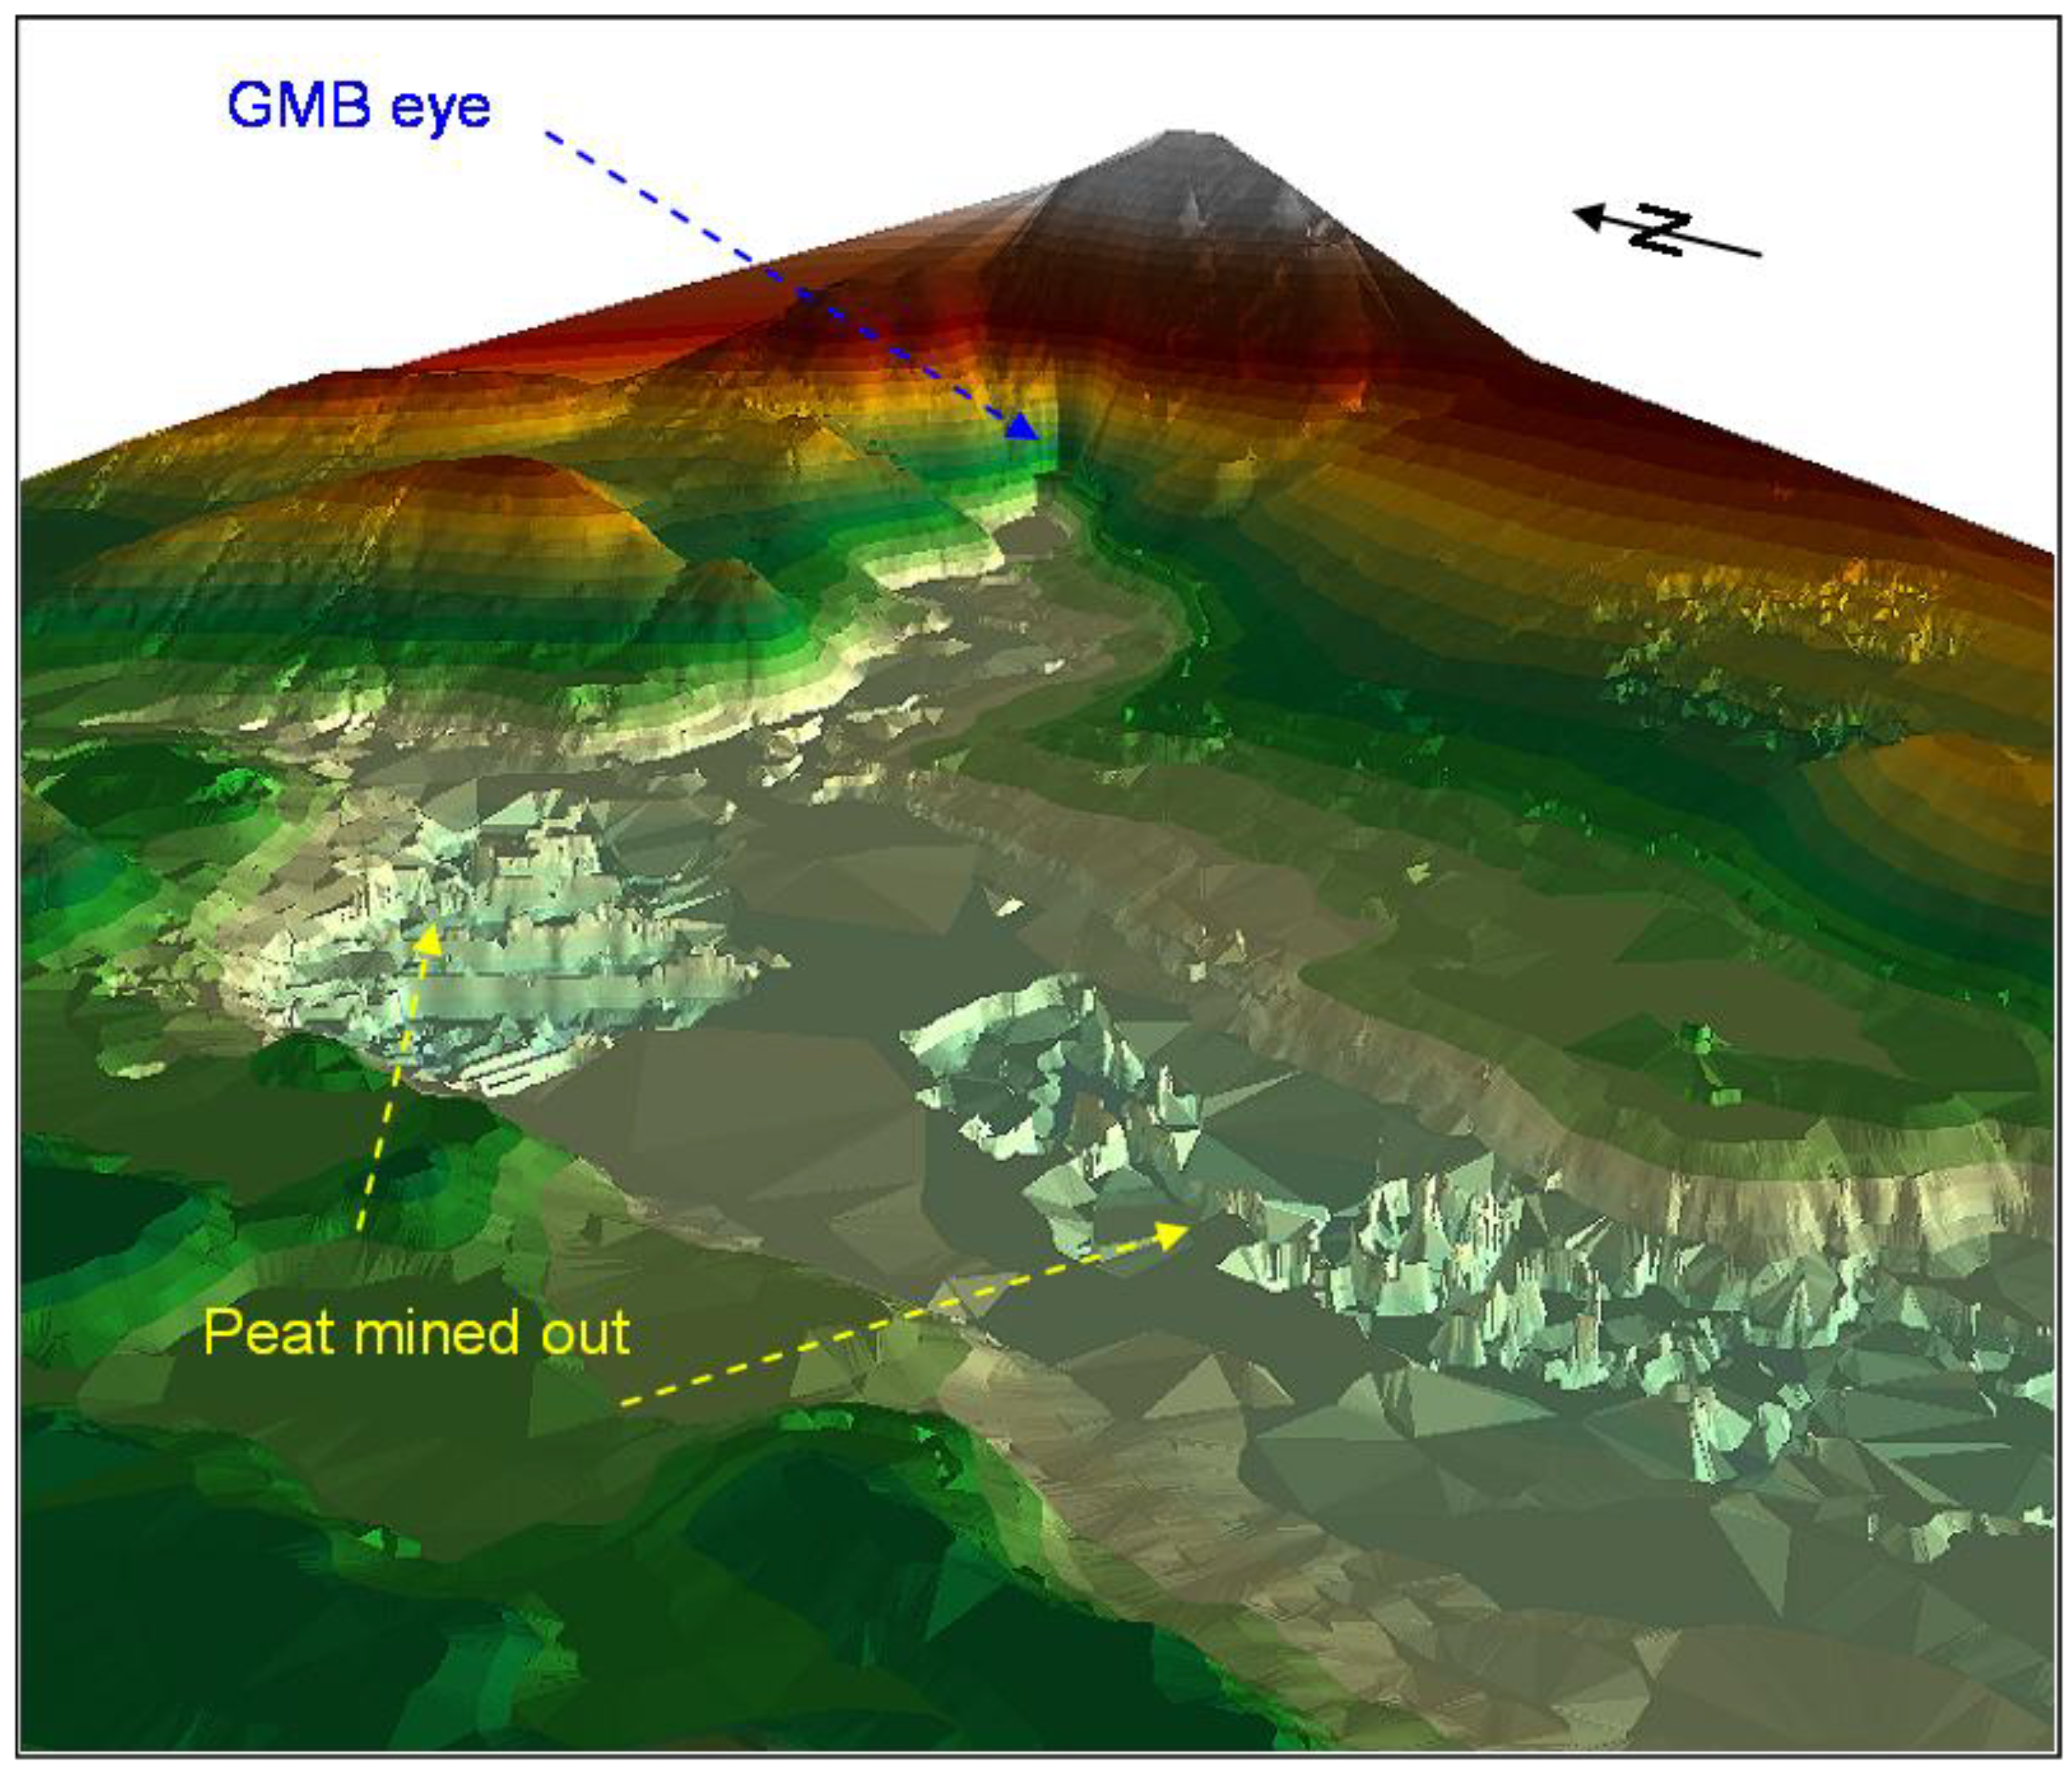
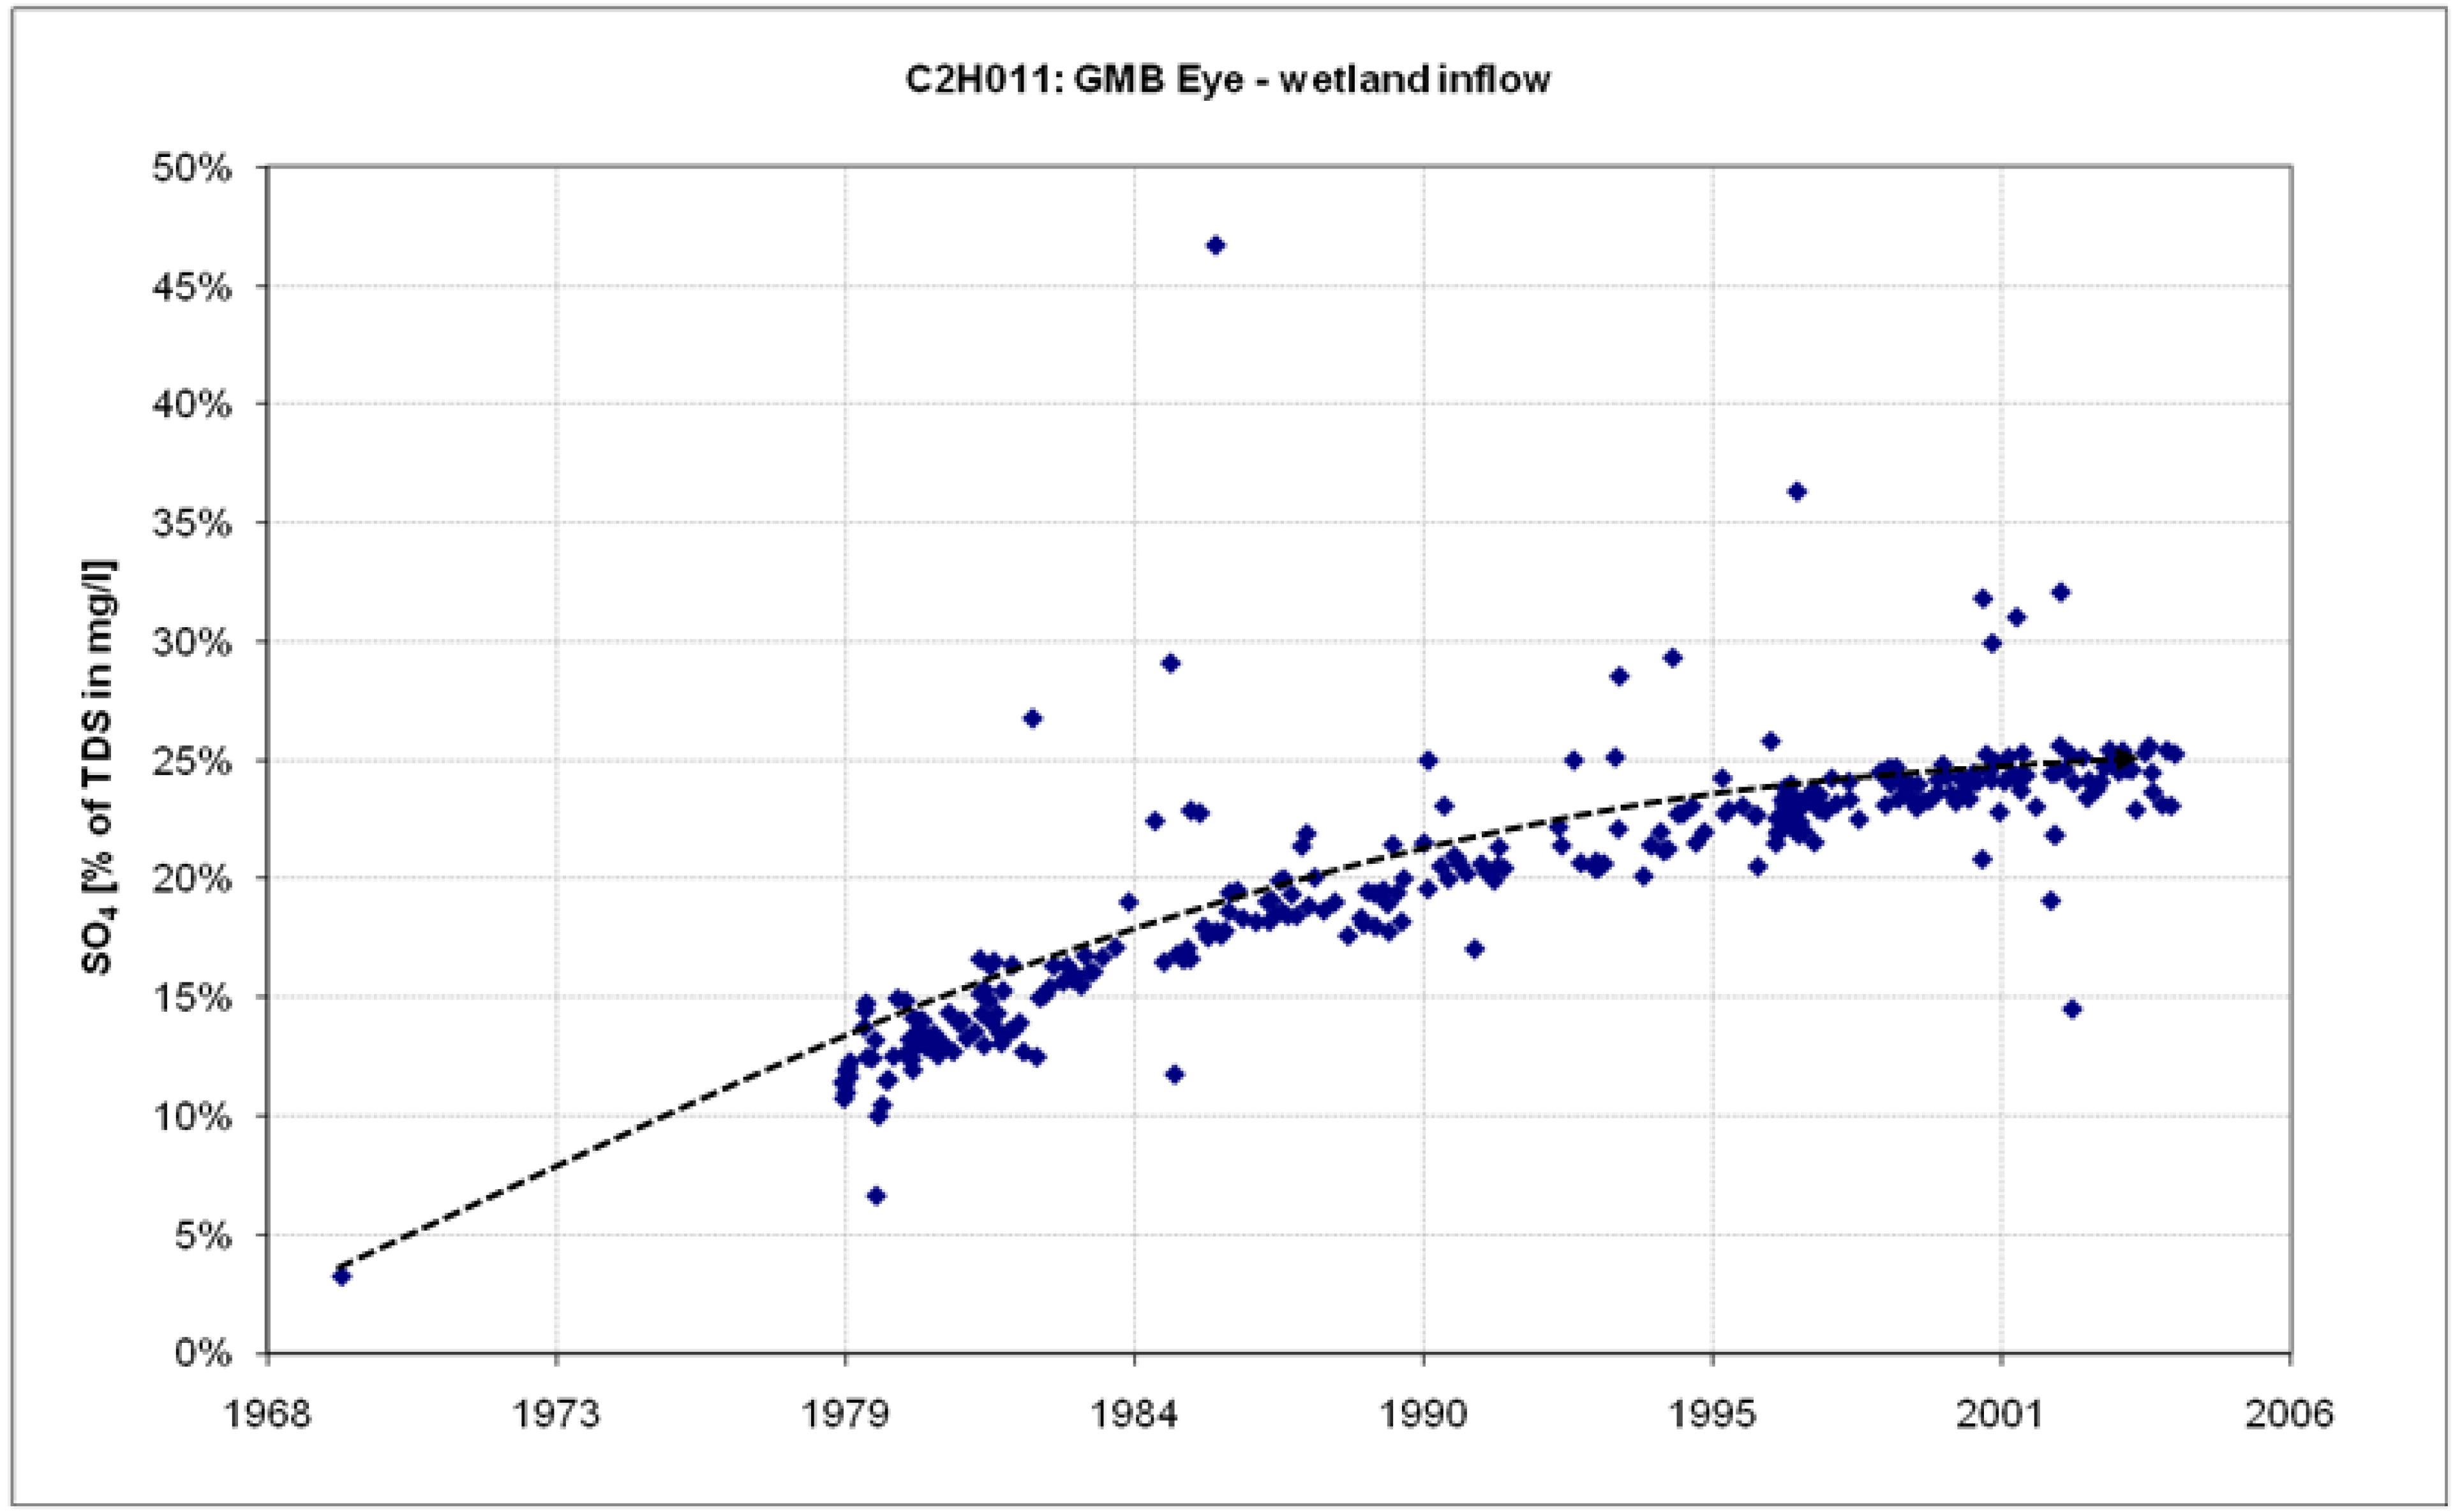
The Gerhard Minnebron Eye

Compared to the dammed springs in the WFS catchment, the GMB eye appears to be different in nature as the spring is not related to a dyke. The early travelers reported that water was ‘gushing out’ from the spring, which presents an image of a free-draining spring type [24]. Situated at the foot of a 10–15 m high cliff that is located at the head of a narrow valley less than 100 m wide, the spring appears to be largely morphology-controlled with the relief dropping below the upstream groundwater table. There is no major upstream drainage line or large surface catchment that allowed for the carving out of such valley by fluvial erosion. The sudden drop in land surface elevation, therefore, most probably relates to the collapse of an underground karst channel possibly in the format of what is described as a ‘polje’ structure. Although the present morphological configuration of the GMB peatland conforms more to a semi-polje structure, being filled up with peat and having an outflow point in contrast with swallow holes of a classic polje structure, it is assumed that the original structure had indeed swallow-hole-type outflow points as the peat consists predominantly of sedge reed material, and it is observed that such vegetation is not established in water deeper than 50–70 cm [1]. The resulting linear depression would have been permanently filled with spring water and thus allowed for the subsequent accumulation of plant debris and sediment that finally made up to 5 m-thick peat deposits even under prevailing semi-arid conditions. Figure 4 depicts a 3-D model of the wetland illustrating the abrupt change in relief at the location of the eye and the linear nature of the associated wetland downstream.
Figure 4. Digital elevation model (DEM) of the GMB wetland.
Water 03 00291 g004
Since the age of the oldest peat sampled at a depth of 4.5 m below surface in the lower part of the wetland was determined by the radio-carbon method at 13,910 years before present (a bp) (this corresponds to 11,310 a bp for a 5.5 m deep sample taken at GMB by Smuts [1]) this collapse must have occurred before the last Pleistocene cold period ended. Even though South Africa was not covered by ice at the time, as was much of Europe and North America, the climate was generally colder and drier than today (much of the precipitation water was taken out of the global circulation and bound in N-hemisphere glaciers and ice sheets) [34,35]. The fact that peat forming vegetation appeared in the GMB wetland (mainly consisting of common reeds, Phragmaties australia, which according to pollen analyses of peat deposits at the nearby Schoonspruit eye did not change much since then, [36]) confirms that the spring flow must have provided sufficient water throughout the year despite the generally drier conditions fed by a comparable large catchment with a high recharge rate within the Boskop Turffontein compartment.
A slightly modified explanation for the origin of the peat deposit would be that the polje collapse was triggered by lowering of the BTC water table associated with the most recent cold period that culminated about 18,000 years ago, lowering precipitation to less than 200 mm/a in the central parts of Southern Africa (thus a natural dewatering event). Reed growth and thus the onset of peat accumulation only commenced 14,000 years ago as presumably the climate started to warm up at that period in time and precipitation increased sufficiently for the GMB eye to decant. Evidence for a brief warming period starting around 15,000 a before present is reported by [34] based on pollen analyses from Aliwal North (Eastern Cape, South Africa).
In how far the polje development may relate to tectonic movements or seismic activity associated with movements along the ‘Graben’ structure in the area (known as ‘Gerhard Minnebron Graben’) and so-called ‘thrusts faults’ created by a meteorite impact at the nearby Vredefort dome is uncertain. It is, however, of possible relevance that the eye lies very close or even on top of a regional SE-NW running thrust fault that crosses the area and the peatland’s polje structure is intimately associated with it [37]. There appears to be an inter-relationship of cave systems on the Highveld with Vredefort-related thrust faulting ramp zones including the Gatsrand, Sterkfontein and Kromdraai caves [38].
Given the fault width (approximately 500 m), and that the fault material consists largely of impervious, metamorphosed (re-crystallized) dolomite and chert, it probably acts as a localized aquiclude creating a dammed spring similar to the dykes. The reported ‘gushing out’ of free flowing water at the foot of a cliff would thus be indicative of water released under some hydrostatic pressure from a possible reservoir dammed up behind the cliff wall.
Since the GMB eye was dammed by a concrete wall in the early 1960s to divert a large proportion of the spring water (some 80%) around the wetland into a newly built irrigation canal to Potchefstroom (opened April 1964) the original configuration of the multiple eyes and the reported ‘gushing out of water’ are no longer visible. It is, currently, difficult to establish whether the phrase ‘gushing out’ was indeed an adequate description of the original water flow. A historic document somewhat differs in its description of the nature of the spring from the one cited earlier. Water from the eye had been used for irrigation since 1865 and later for driving a water mill. A dispute concerning water rights was triggered by the drying up of the Mooi River and WFS in 1911/12. The resulting judgment contains a detailed description of the original appearance of the eye [39]. According to evidence given before Judge Jeppe by Mr Davis on behalf of the landowners Messrs. Levis and Marks, the GMB eye originally consisted of an (unspecified) number of springs arranged at the ‘foot of a cliff’ in a ‘semi-circle with a diameter of perhaps 60 or 70 yards’ (54–63 m). The southern most of these springs was significant enough to be named the ‘Mark’s spring’ after the owner of that portion of the farm Gerhardminnebron. Located some 20 yards (18 m) south of the nearest eye, its water level was reportedly 1.2 feet (~40 cm) higher than that of the center eye [39]. The latter ‘fact’ suggests that the southern eye constituted an artesian or ‘confined’ type of spring [32] implying the presence of a layer that confines the outflow of groundwater creating artesian pressure. This layer could well be formed by one of the many horizontal chert bands under which typically well developed karst systems are found especially in chert-rich dolomite such as the Eccles formations in which the GMB eye is located. This layer function could, however, just also be fulfilled by unweathered dolomite stretching between enlarged fractures, sinkholes and solution slots through which the pressurized groundwater escapes to form artesian springs. The continued artesian outflow at the springs suggests that the hydraulic conductivity of the existing conduits is too small to equalize the pressure difference created by the higher upstream groundwater table (i.e., the water behind the ‘cliff’).
It is likely that the hydraulic gradient that drives the artesian flow in the eye area is comparatively steep as a significant rise in water level at the spring that was associated with the construction of a 2 m-high dam wall in the early 1960s did not appear to impede the discharge from the GMB eye. Expecting declining flow rates, the constructing DWA engineer at the time, Mr. Fischer, raised the dam gradually over a period of two years by approximately 140 cm from the some 60 cm older mason dam to 2 m above ground level of the newly constructed concrete weir while monitoring the spring flow volume at the same time. Over this period, 1962 to 1964, there was no reduction in spring flow volumes according to the observations [33]. The 140-cm-rise in water level would have been significant in most parts of the rather flat topography surrounding the area, yet it did not affect the discharge of the GMB eye. This suggests that the upstream groundwater table at the time must have been at least 1.4 m above the original spring water level. Since artesian outflow of groundwater continues to this day despite the pressure exerted by the overlying 2-m-high water column in the artificial pool, it is assumed that the water level in upstream karst aquifer that feeds the GMB eye remains considerably higher than the increased water level at the spring.
For a later argument regarding recharge of the BTC, it should be noted that the water table at the spring has risen over the past 3–4 years to a level where the spring water now permanently overflows the top of the weir. This is in addition to the relatively large volume of water that flows directly and mostly unrestricted, via a sluice in fixed position, from the pool into the GMB irrigation canal. Owing to the continuous flow into the canal and over the weir, as well as leakage around the weir that almost immediately equalizes possibly increased inflow volumes, water level responses to rain events can no longer be observed. To quantify the responses of the eye to rainfall events, records from the flow gauging station in the irrigation canal a few meters from the outflow point were used as a proxy since rising discharge volumes of the eye increase the flow rate in the canal via a increasing flow velocity even though water levels may remain almost constant or are too small to be detected.

3. Impacts of Deep Level Gold Mining on Hydrological and Geohydrological Conditions

Owing to large volumes of dolomitic groundwater pushing into underlying mine workings, deep level gold mines soon embarked on the ‘dewatering’ of dolomitic compartments in order to reduce the excessive costs for pumping the water from depths of up to 3 km back to the surface. Dewatering was effected by pumping out more water from the receiving mine void than the karst aquifer could naturally be recharged with, and disposing of the groundwater outside the aquifer, lowering the groundwater table by up to 1,000 m in places (normally at pumping shafts as centers of the dewatering cones). Consequences of the large-scale dewatering included the drying up of four springs with a total discharge of approximately 133 ML/d as well as irrigation boreholes as predicted but also some unforeseen effects such as the wide-spread occurrence of sinkholes and dolines often with disastrous effects on people’s live and infrastructure [21]. During an above average wet period in the mid 1970s, many sinkholes had formed right in the stream channel of the WFS diverting large volumes of stream water directly into the underlying mine void partly defeating the original purpose of dewatering. In order to counteract the increased groundwater recharge, in 1977, the stream was diverted into a 30 km-long pipeline (colloquially known as ‘1 m-pipeline’ referring to the diameter of the pipe) that carries the water across the three dewatered compartments (Venterspost, Bank and Oberholzer) to the non-dewatered BTC. From here on the WFS runs for the last 35 km or so in its original stream bed (Figure 1). In order to accommodate the drastically increased stream flow that resulted from the discharge of pumped groundwater from the mines during the active draw down in the initial phase of the dewatering (when pumping rates reached well over 400 ML/d) and to prevent adjacent farm land that was often cultivated right up to the river bank from being flooded, the stream channel on the BTC had to be extended. This was effected by constructing an earthen (unlined) canal within the natural stream bed (the so-called ‘Mid-stream canal’, sometimes also referred to as ‘Westcott canal’ after the constructing engineer) through deepening of the natural stream bed and using the dug-out sediments for raising the elevation of the stream banks. Owing to the earthen nature of the canal and initially high loads of suspended solids in much of the pumped groundwater, the mid-stream canal silted up frequently requiring the regular removal of deposited sediments in order to maintain the needed flow capacity. This service was provided by the mining industry via the Far West Rand Dolomitic Water Association, a body originally created in conjunction with governmental departments to deal with compensation claims by farmers adversely affected by dewatering [40]. Currently gold mines pump approximately 113 ML/d back into the WFS while using some of the abstracted groundwater for internal purposes such as tailings disposal, irrigation of vegetated slimes dams and domestic needs.
Apart from severe impacts on the surface water system through the drying up of springs, diversion of stream flow and changing natural runoff characteristic, deep level gold mining also changed the hydrogeological system by mining through the dykes that compartmentalize the aquifer. With more than 43 km of tunnels, through fares, etc., running through dykes (estimate derived from [20]), deep level mining hydraulically linked previously separate compartments. This also applies to the full (non-watered) BTC, which is now connected to three dewatered compartments upstream forming one large, single ‘Mega-compartment’. In a possible* future rewatering scenario, this results in the final water level being controlled by the elevation of the lowest lying springs i.e., the two Turffontein eyes, the GMB eye and possibly some smaller eyes near Boskop dam (Figure 5).
Figure 5. Simplified E-W cross section of the dolomitic compartments upstream of the Gerhard Minnebron Eye. Owing to the penetration of dykes a kind of ‘Mega-compartment’ could be created consisting of the 4 dewatered compartments and the Boskop-Turffontein compartments (figure adopted from [26]).
Water 03 00291 g005
(*There are two opposing schools of thought of what would happen post mining. The above section gives a worst-case scenario in terms of water pollution and loss of aquifer storability. The opposing argument is that all the aquifers will refill, since the dykes are only breached well below the (non-karstified) dolomites. It assumes that the vertical flow through small fractures within the non-karstified dolomite overlying the mine void and the subsequent lateral flow across the pierced dykes from the mine void below one compartment to mine void in the next compartment will be too small to allow for all naturally recharged groundwater to be accommodated. Thus, the remaining part of the annual recharge will gradually refill the dewatered karst aquifers near the surface and result in the dried up springs to flow again preventing the ‘Mega-compartment’ scenario [20]. Naturally, proponents of a “halfway’ scenario also exists, indicating that springs may reactivate but with lowered flow rate and being more prone to drying up in drier than normal periods. As insufficient research is done to be sure which scenario will apply, the authors conservatively assume the worst-case scenario.)
In the Mega-compartment scenario, the final groundwater table after rewatering would remain up to more than 100 meters below the pre-mining water table resulting in most springs upstream of the BTC remaining dry while the associated recharge contributes to a flow increase in the lowest lying eyes of the BTC estimated to be in the order of 133 ML/d. Allocated to the Tfnt. and GMB springs according to their current discharge ratio of 25%:75%, their possible post-rewatering flow rates are 52 ML/d and 152 ML/d respectively, (Figure 5). After rewatering, the GMB spring would form a major decant point for polluted mine water emanating from the vast network of flooded mine voids. Judged by the extremely poor water quality of water decanting from the flooded mine void in the head water region of the WFS (known as ‘Western Basin’), where pH values <2 and U concentrations of 16 mg/L have been measured, such concentrated outflow could have severe consequences for downstream water users as well as the receiving environment.
Analyses of recent satellite imagery as supplied by Google Earth have revealed that the WFS over the past few years (since April 2003) did not reach the Mooi River but dried up completely well upstream of where the Turffontein eyes feed into the river and re-establish stream flow. After passing through the 1 m–pipeline and receiving mining effluents from Driefontein GM, the river enters the BTC with an average flow rate of approximately 100 ML/d (1,157 L/s) of which only 44 ML/d (long-term average) used to pass gauging station C2H069 some 8 km downstream. In the absence of large-scale abstraction, this reduction indicates that the WFS always lost a significant volume in the upper part of the BTC (on average 56 ML/d). Between October 2002 and April 2003 (i.e., somewhat paradoxically over the wet season), the flow at C2H069 dropped to only about 10 ML/d. Provided that the mining discharge and flow from the 1 m-pipeline remained constant, this drop equals a loss of some 100 ML/d (36.5 million m3/a, nearly double the long-term average loss) of stream water over a total flow distance of just under 10 km. Since no water is abstracted from the stream for irrigation or other purposes and calculated evapotranspiration losses from wetlands were found to be negligible (and are over-compensated by additional discharges of sewage effluents from several municipalities such as Carletonville, Khutsong and Welverdiend along the way amounting to approximately 10 ML/d) it is assumed that nearly all of the stream water is lost to the underlying cavernous karst. However, a possible reduction in discharge volumes of the 1 m-pipeline and the downstream mines also needs to be explored.
This bed loss is particularly likely to occur along stretches of the now silted Midstream canal. After the regular removal of sediments was abandoned by the mines in the late 1990s, the accumulating sediments increasingly force water out of the canal into the adjacent floodplain. In some instances this resulted in water now flowing directly from the inundated floodplain into low-lying karst openings such as cave entrances, sinkholes and dolines that feature prominently along the stream and could explain the high volume of bed loss (Figure 6).
Figure 6. Satellite image (dated 4 December 2009) depicting the silted ‘Midstream canal’ of the Wonderfonteinspruit and the resulting inundation of adjacent dolomitic land allowing stream water to directly flow underground via openings such as cave entrances, sinkholes, etc. (source of image: Google Earth, 2010).
Water 03 00291 g006
(Although the described water losses are a relative new phenomenon since dewatering commenced, it was also the case in the pre-mining situation where the WFS only flowed past Welverdiend during exceptionally wet periods [40]. However, during those times irrigation schemes abstracted most of the decanting eye’s water, thus removing the river baseflow element. However, the irrigation water allocation was regulated by a court decision in such way that—at normal flow conditions—no water flowed past Welverdiend.)
Whether the increased recharge rate of the BTC caused by the bed-loss will lead to rising discharge volume at the three springs is still uncertain. A possible indication for that being indeed the case is the fact that an increase of water levels was observed at the GMB eye where water, since approximately 2006/7, permanently overflows the dam wall, which previously was a rare occurrence. This coincides with farmers downstream of Welverdiend, who for the first time in over 30 years experienced a few years earlier (2003/4) that their dams dried up [41]. Both phenomena are most likely consequences of the fact that currently much more water is lost directly to the underlying karst aquifer that feeds the GMB spring leaving dams downstream of the ingress area dry.
In this context, it may also be relevant that the wetland that accompanies the lowest reach of the WFS downstream of the Turffontein springs continues to expand in width, possibly indicating increased baseflow volumes in this reach (i.e., groundwater exfiltrating from the BTC). This, too, could be in response to increased recharge rates associated with the silting of the Midstream canal.

4. Uranium Flux into the GMB Peatland

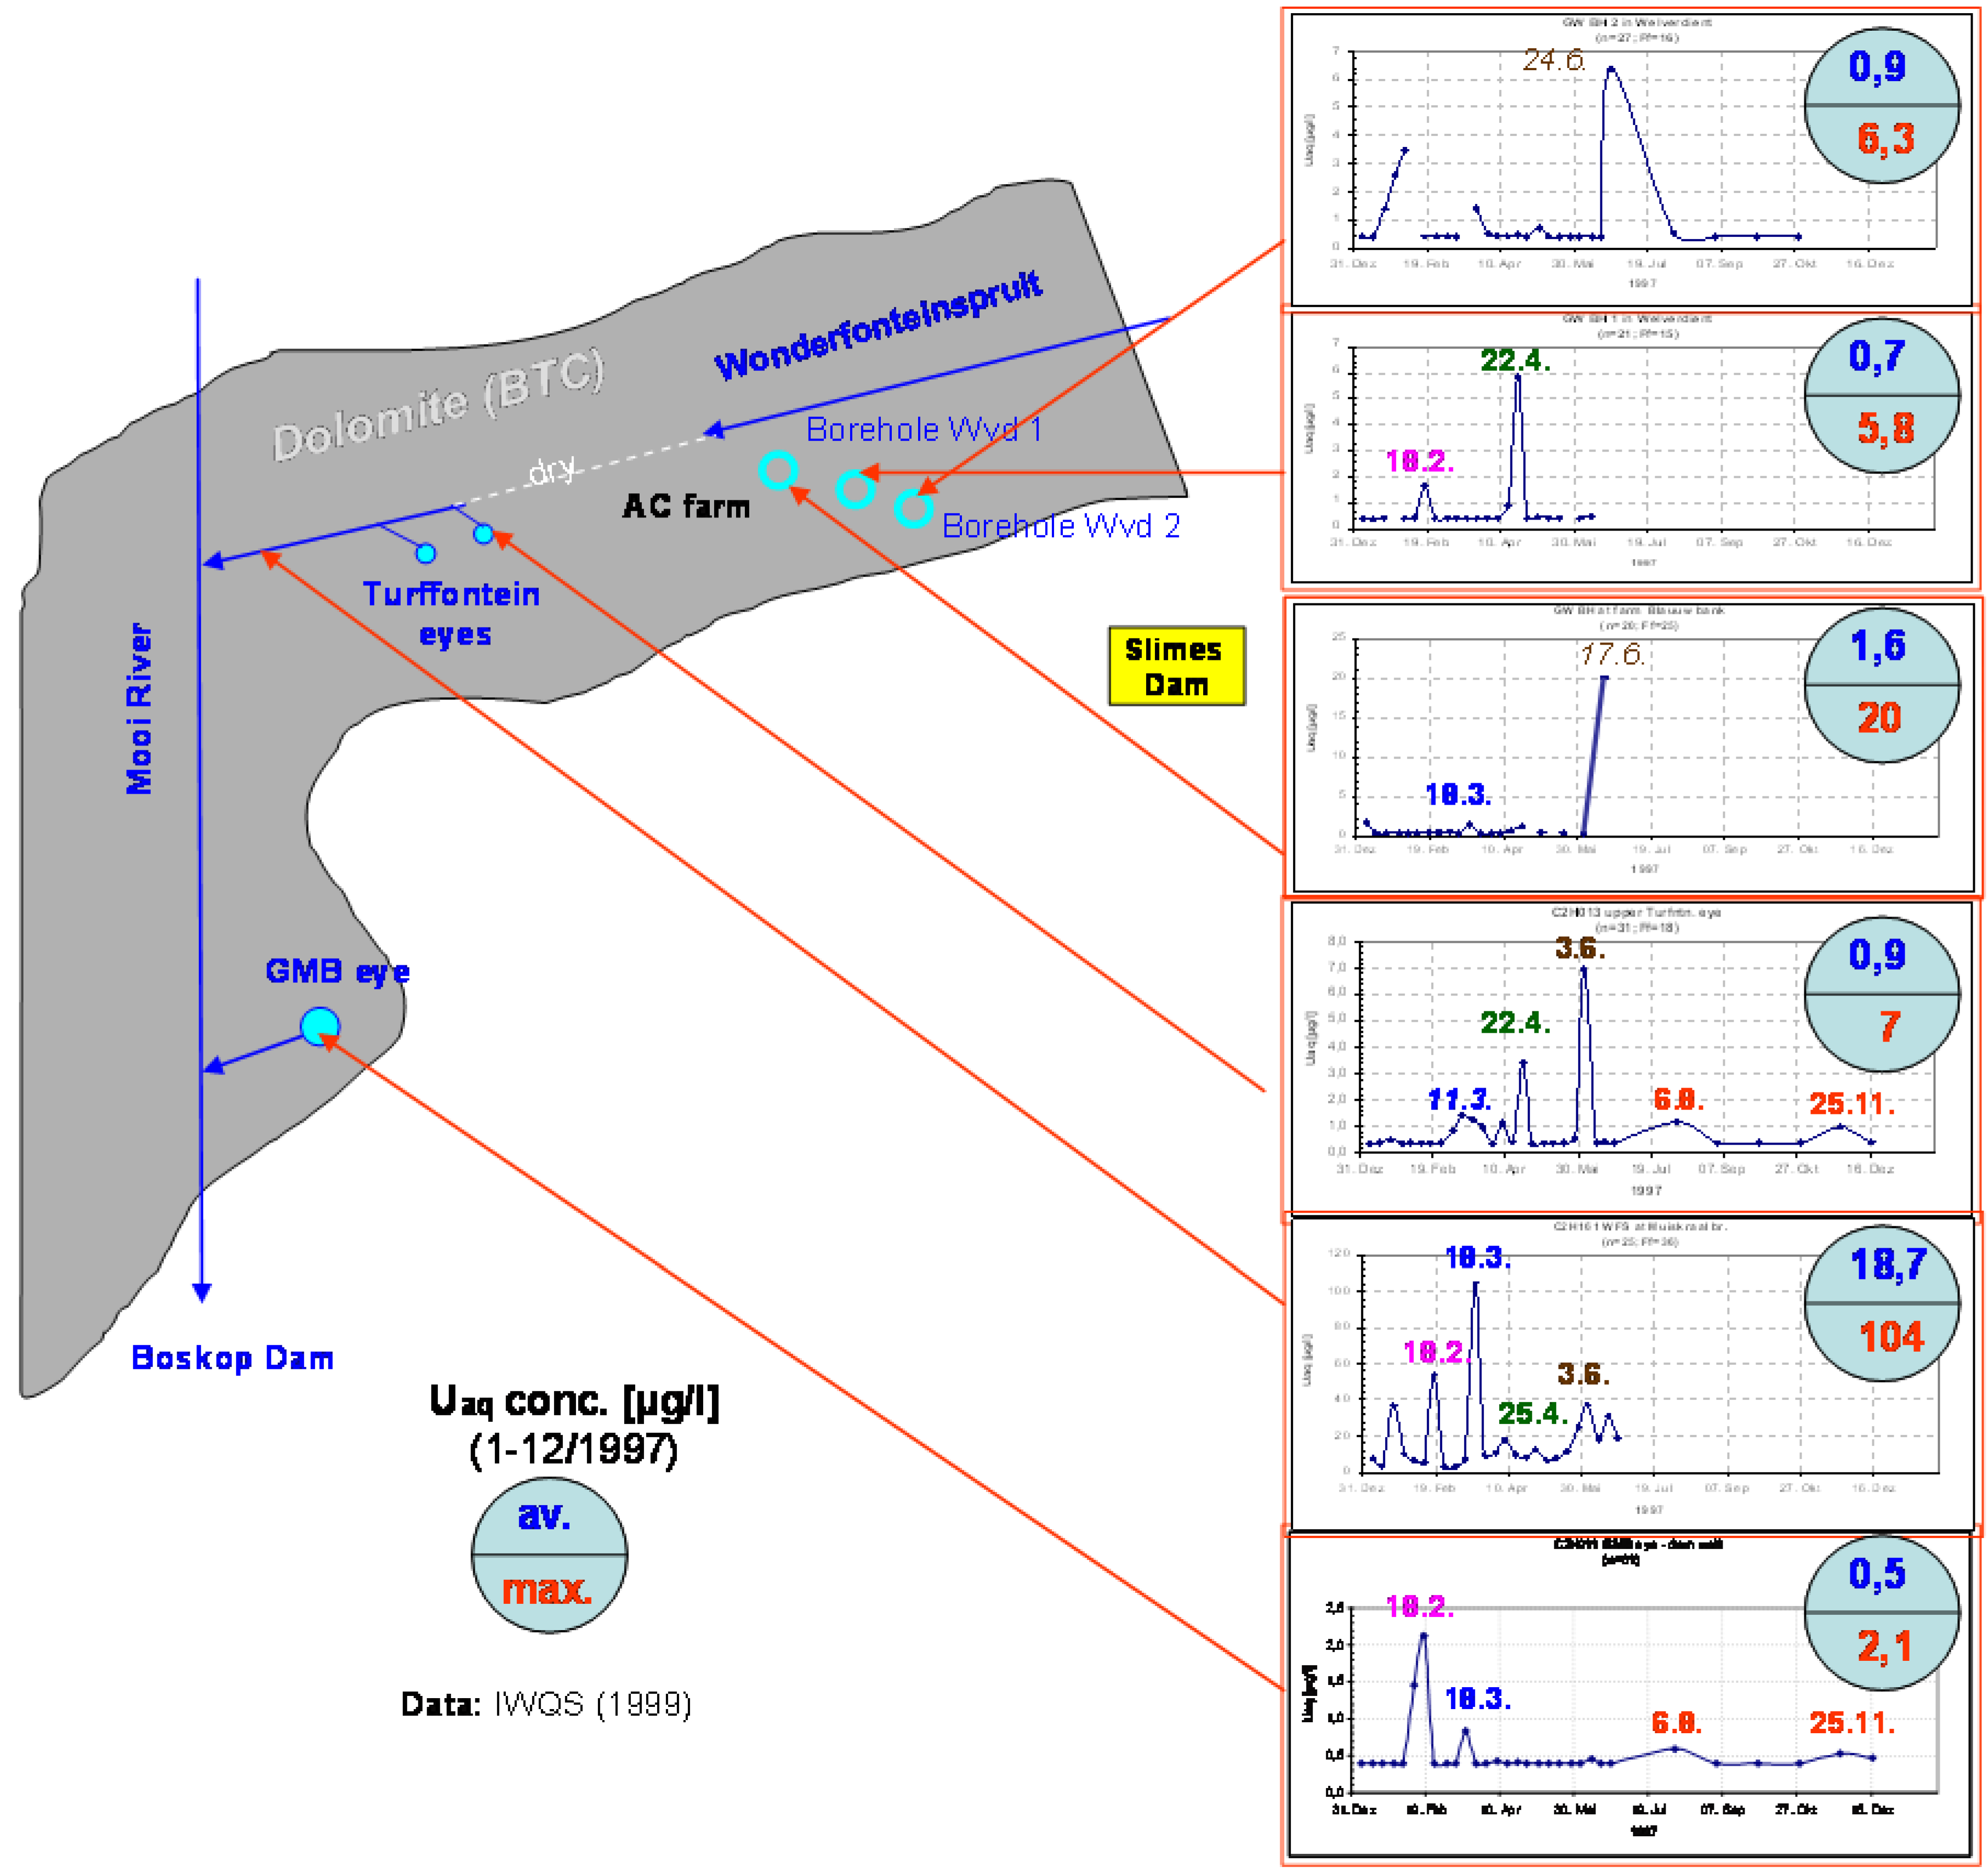
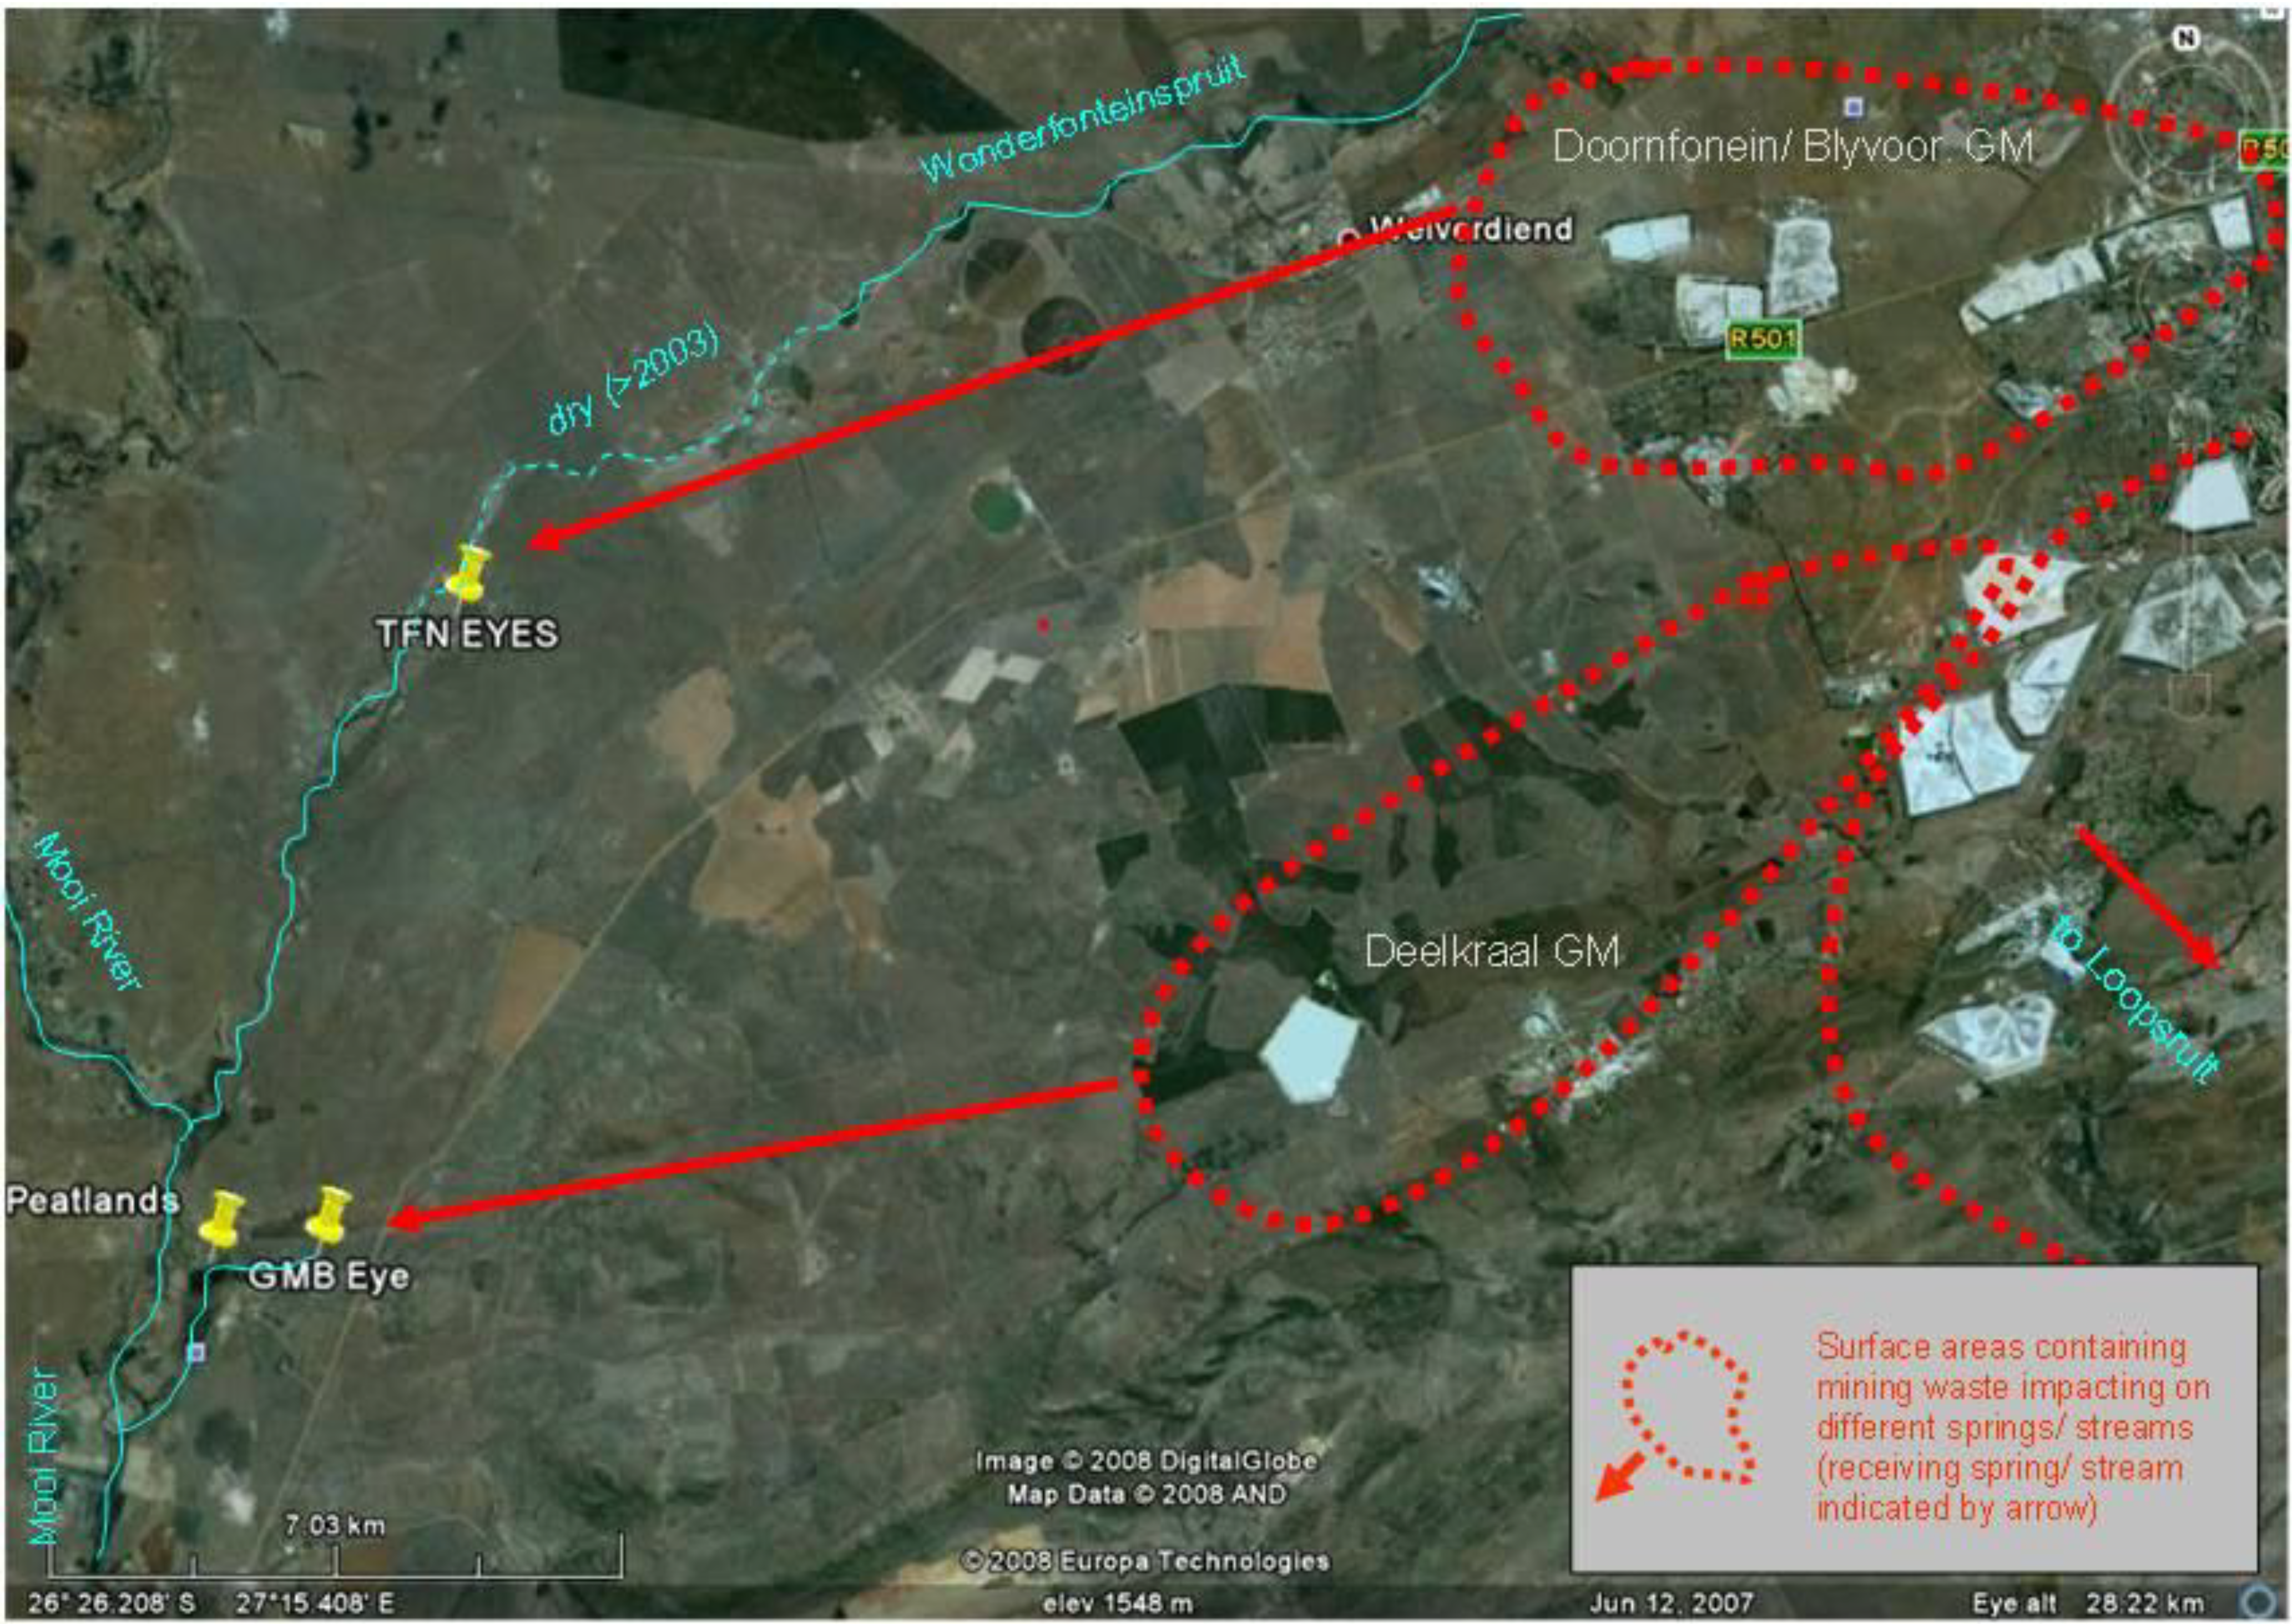
4.1. Sources and Extent of U Pollution

Based on close to 3,400 data readings on U concentration in water samples from the WFS catchment generated by a multitude of studies and monitoring programs between 1997 and 2008, [42] estimated the total load of dissolved U moving down the WFS. For the critical reach at the upper BTC (between the end of the 1 m-pipeline and the dams downstream of Welverdiend, Figure 1) where a large stream loss has been detected, [42] determined an annual U load of close to 3,500 kg transported in the WFS. Assuming that almost all of the stream water is lost to the underlying karst aquifer, the groundwater in the BTC receives nearly 3.5 t of the dissolved radioactive metal. While the U load in the lower WFS remained more or less constant over the observed 12-year period, a sharp increase was found for dolomitic springs in the BTC as well as the lower Mooi River. At the Turffontein eye the annual U load rose over 13-times (7–95 kg/a), while at the GMB eye and the Mooi river at Boskop Dam the U load quadrupled to 43 kg/a and 803 kg/a, respectively [42], probably as a result of the U influx associated with losing contaminated stream water to the BTC. While the absolute amount of U reaching Boskop Dam is still relatively small compared to the load transported in the WFS, it is the consistent and significant increase that constitutes a reason for concern. Should this trend continue over the next five decades where gold mining operations are still expected to be active in the area, ultimately U loads of several tons per year may finally flow into the Boskop Dam as the main reservoir of Potchefstroom’s water supply.
However, analyzing the temporal distribution of U concentrations found in the springs of the BTC it appears that there is no continuous, steady rise in U concentration. The increased average U levels are mainly caused by higher U peak concentrations between which the spring water often returns to almost pristine conditions [42]. Increased levels of EC and dropping pH-values observed by quasi-continuous measurements of water quality in the GMB eye indicate that polluted water possibly of mining origin (high EC, low pH is typical for acid mine drainage) arrives at the eye approximately 5–6 days after rain events occurred in the area [43]. Since slimes dams are deposited throughout the region, polluted stormwater run off from the uraniferous tailings deposits is a potential source of groundwater pollution. This is especially because some of the run off from the slimes dams in the lowest part of the WFS (Blyvooruitzicht and Doornfontein GMs) is captured in a canal that frequently spills over onto adjacent dolomitic land where, consequently, a range of sinkholes developed dotted along the natural drainage line (Figure 7).
Figure 7. 3-D view of a satellite image depicting sinkholes formed in a drainage line down-gradient from uraniferous slimes dams at Blyvooruitzicht Gold Mine caused by frequent spillages from a mine water canal especially after rain events (source of image: Google Earth, 2009).
Water 03 00291 g007
Since these sinkholes now intercept much of the spilled and highly polluted stormwater run off and divert it directly into the underlying karst aquifer, this may explain the deteriorating spring water quality in response to rain events. With a distance of some 18 km and a time lag of six days in the case of GMB (for Turffontein no high resolution time series are available) this would require an average flow speed of some 3 km/d (3.3 × 10⁻² m/s), which does not seem unreasonable for flow in a multiporosity karst system, given the transmissivity values determined in the Bank Compartment (Table 2). A direct link between slimes dam runoff and springs via sinkholes would also explain the frequent U peaks observed at Turffontein (assuming that the secondary data used are accurate).
Apart from polluted storm water run off and stream loss, a third source of water contaminating the GMB wetland may exist. This could relate to polluted mine water currently filling the Deelkraal mine void where underground operations ceased in 2006/7. Being the closest of all mine voids in the Far West Rand (FWR) to the GMB wetland and located upstream of it, escaping mine water may reach the wetland via underground karst channels. Since the mine displays a considerably elevated U level of 2,450 µg/L (n = 2) it could well be the source of the U pollution detected in the GMB wetland [44]. Although the water was comparatively warm when sampled in the mine void (42 °C) it is unlikely that a temperature signal may still be used as a tracer at the GMB wetland after more than 10 km underground transport and possible mixing with groundwater along the way.
Long-term water monitoring data suggest that mining-related impacts on both springs are not a recent phenomenon but have been ongoing for several decades. This is illustrated, amongst others, by elevated levels of sulfate (SO4). Originating mainly from the oxidation of sulfides in the mined gold reefs, sulfate concentration in mine waters are generally high rendering SO4 a good indicator for mining-related impacts. Since elevated sulfate levels lead to a rising electrical conductivity of the water, this easier and quicker determination of EC-values is often used as a proxy to detect mining-related water pollution. However, relying exclusively on the lump parameter EC (which measures the contribution of all dissolved solids to conducting an electrical current through the water) may be misleading in instances where, e.g., decreasing sulfate levels are compensated by increased concentration of other salts from non-mining sources such as sewage effluents or others. In this paper, therefore, not the absolute EC or the corresponding TDS (concentration of total dissolved solids) are used as indicators, but the percentage of sulfate on the TDS. For the upper Turffontein eye this ratio indicates a significant mining impact on the spring water that started as early as 1967 and reached its peak in the mid 1980s when sulfate from the mines accounted for close to 40% of the total salt concentration (Figure 8).
Figure 8. Changes in the proportion of sulfate at the Turffontein upper eye as indication of mining-related impacts on groundwater quality in the BTC (Data source: [45]).
Water 03 00291 g008
Since then the water quality improved possibly due to the decommissioning of a nearby slimes dam at the Doornfontein GM shortly before the improvement started [40]. In contrast to the Turffontein eye at GMB, the proportion of sulfate on TDS is still rising (Figure 9)
Figure 9. Proportion of sulfate at the GMB eye as indication of mining-related impacts on groundwater quality in the BTC (data source: [46]).
Water 03 00291 g009
With 25% of the TDS, SO4-levels at GMB are now approaching the current level at Turffontein eye, which has decreased from over 40% reached more than 20 years ago (Figure 8). Since both springs are located in the same dolomitic compartment, the question arises why their water quality differs significantly, a fact that was noted as early as 1905, i.e., well before any mining commenced in the catchment [24]. Regarding the U pollution of groundwater of the BTC it is interesting to note that most boreholes, springs and groundwater-fed streams show distinct peaks of U concentrations while very low concentrations (i.e., pristine conditions) between these peaks indicate the absence of a permanent polluting U source (Figure 10).
One exception is the WFS at Muiskraal bridge (second diagram from the bottom in Figure 10) where the stream not only displays an average U concentration that is an order of magnitude higher than in the upstream Tfnt. spring (the max. U concentration is even two-orders of magnitude higher) but also shows elevated minima that point to continuous U-input. Since the data were gathered before the WFS dried up well upstream of Muiskraal bridge (following the silting of the midstream canal further upstream) the elevated U-level there was caused by polluted stream water which, at the time, still reached this sampling point on the surface.
Regarding the temporal pattern of the U peaks at the different sites many corresponding peaks were detected. However, this is not consistent at all boreholes but differs from peak to peak and site to site. For example, the relatively high U peak observed at the GMB eye on 18 February 1997 (21 µg/L) corresponds with an U peak in the WFS at the Muiskraal bridge (55 µg/L) and a very slight increase in borehole 1 in Welverdiend (A Coetzee farm, 1.8 µg/L) while no corresponding response can be detected at the Turffontein eye, for example (Figure 10). Overall, the U concentration in groundwater of the BTC displays a rather complex temporal pattern where U peaks correspond at sites that are spatially remote from each other while no such correspondence occurs in sites of close proximity (Figure 10).
Figure 10. The charts display U concentrations as observed in stream water, groundwater from boreholes and springs of the BTC during 1997. Differently colored dates indicate U peaks that occurred at more than 1 site (Data source: [47]).
Water 03 00291 g010
For the BTC it can be concluded that not only the absolute level of U but also its dynamics vary considerably within this compartment. Possible explanations are discussed in the next section, exploring possible pathways of U pollution.

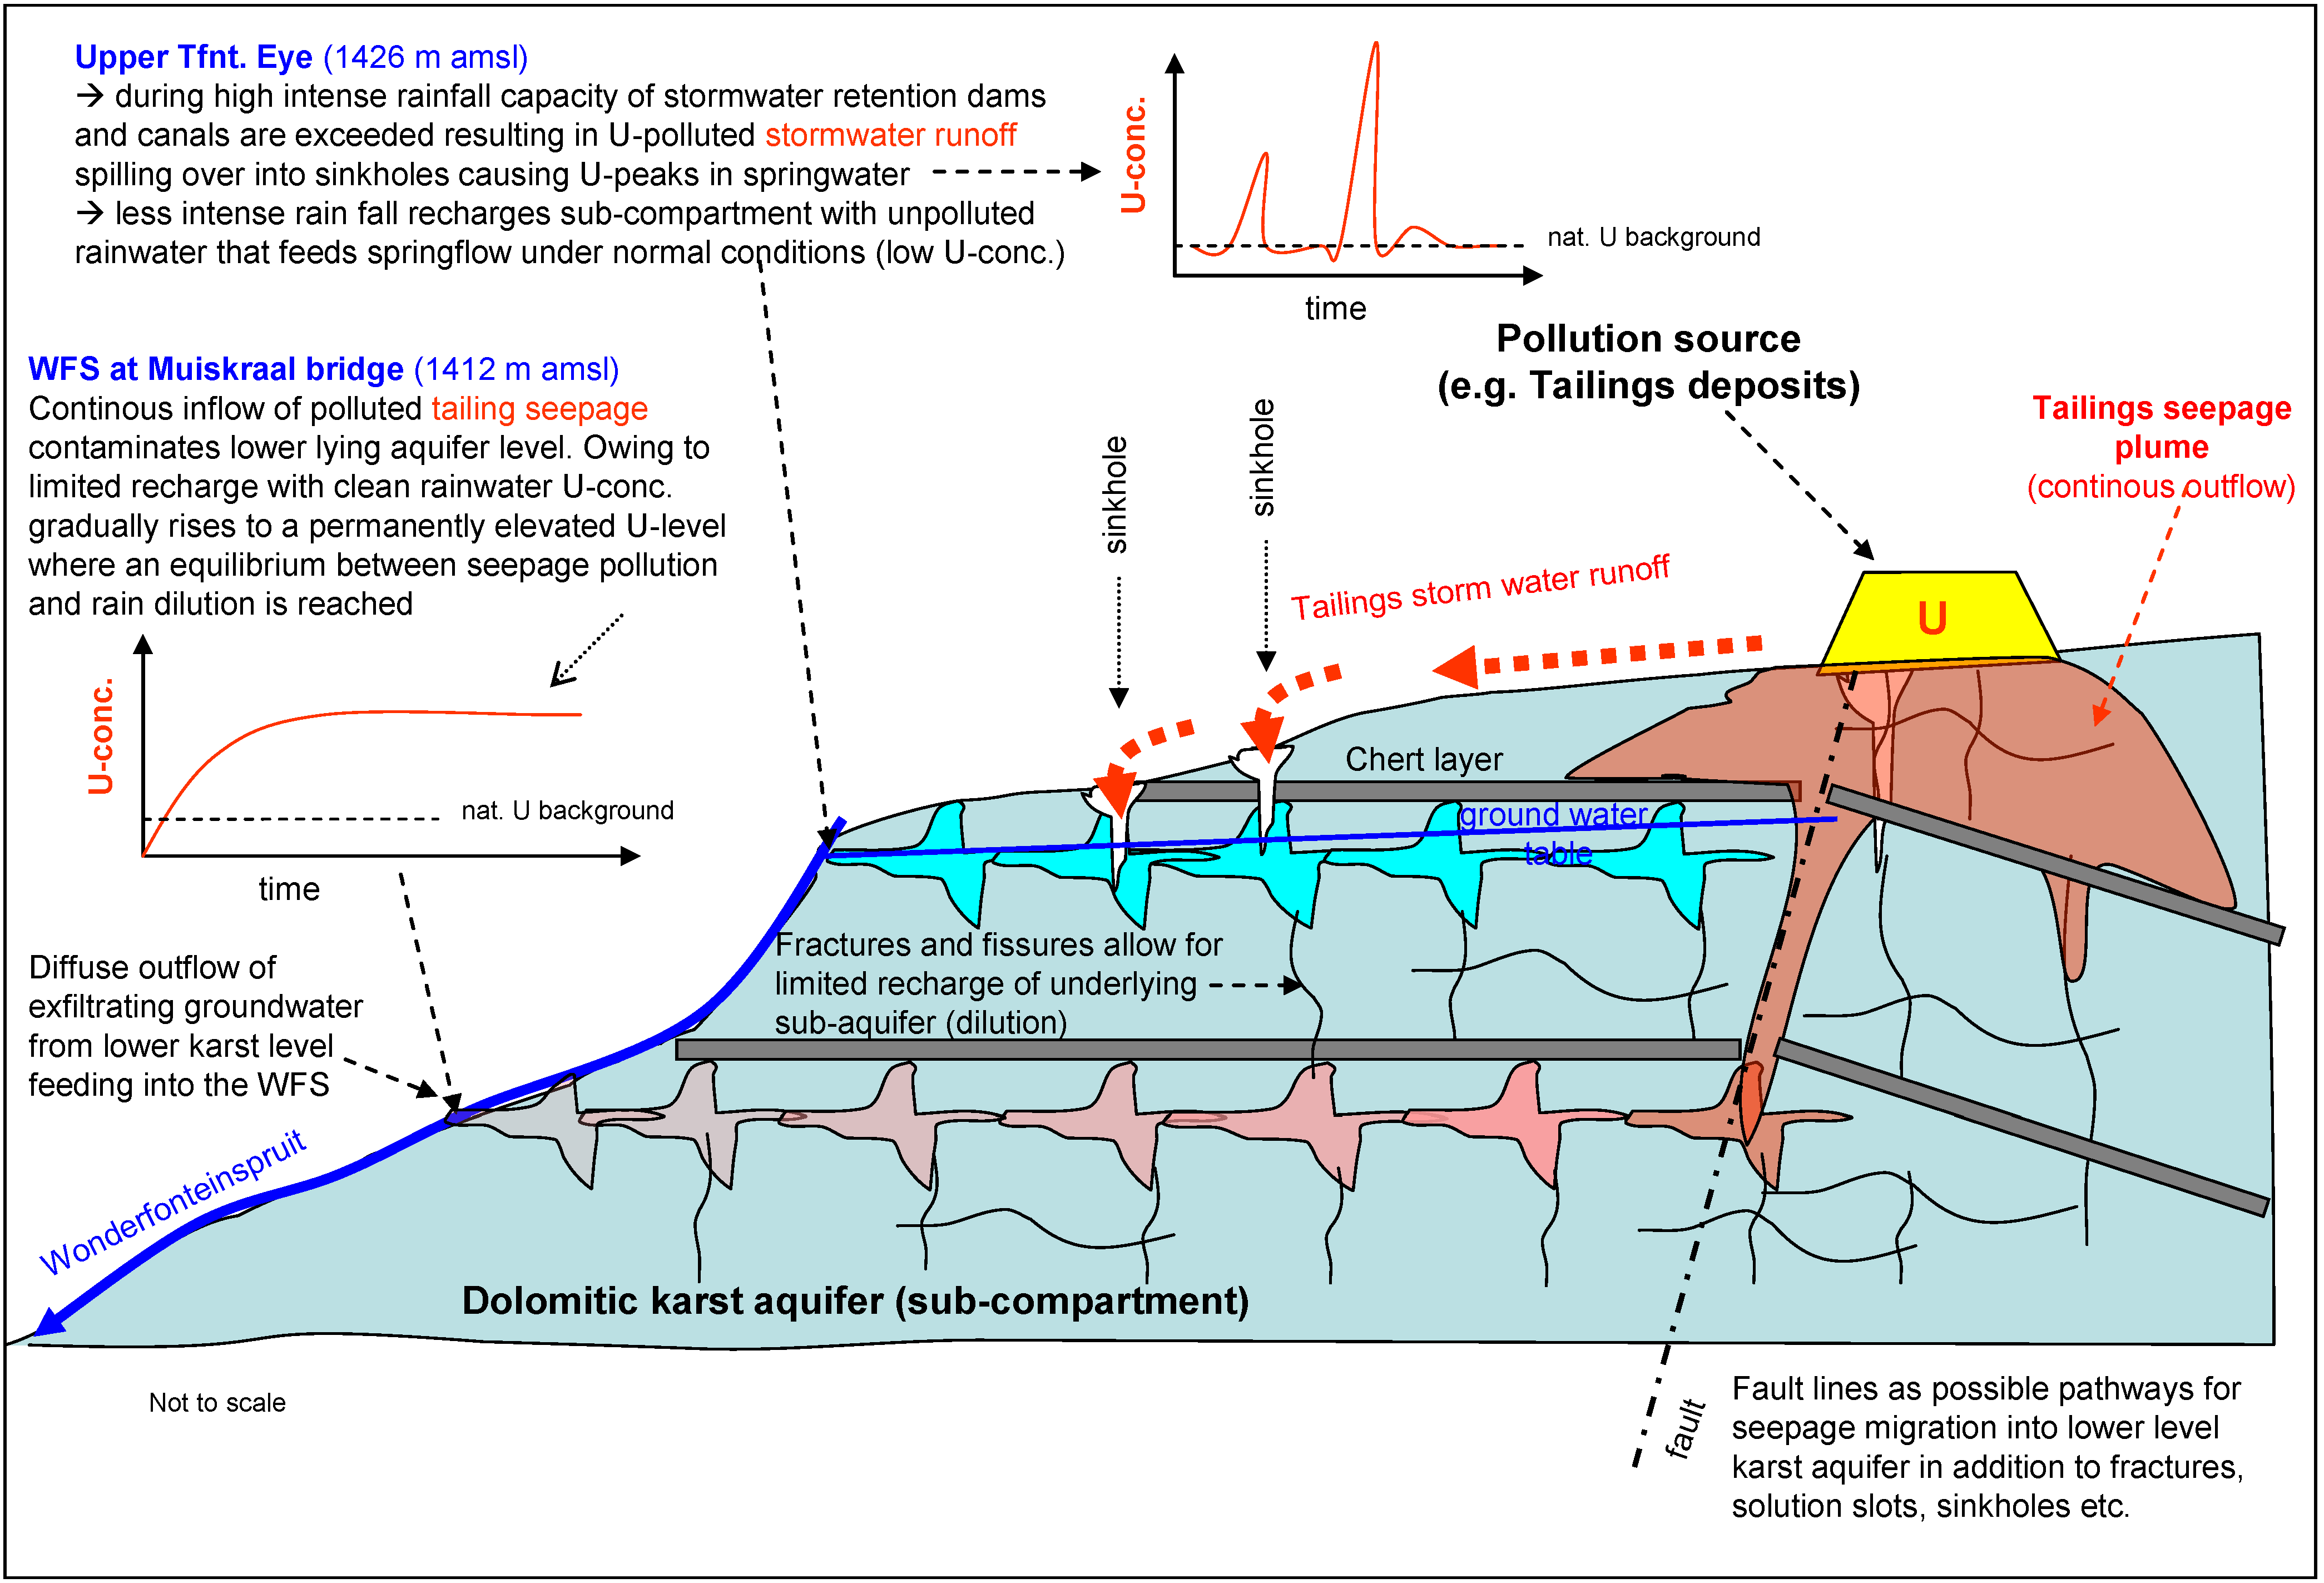
4.2. Pathways of U Pollution

While dolomitic compartments are often treated as a kind of closed hydraulic entity, especially when compared with each other they are by no means to be regarded as a homogenous, underground reservoir that contains water in much the same way as, for example, a dam does. In contrast to a single large water body of a dam, the karst aquifer consists of a multitude of water filled cavities ranging from small fractures to channels with free flowing water and vast caves spanning ten to hundreds of meters in diameter. While many may be hydraulically interconnected other may be not or only to a limited extent, resulting in a multiporosity system with the associated hydraulic conductivity spanning several orders of magnitude. Apart from horizontal water flow also vertical flow between karst levels at different depths may occur. For the WFS at least three distinct karst levels have been identified, each relating to a period of extended chemical weathering at a relative constant groundwater level as indicated by exposed cave systems [23].
It is furthermore important to note that the outcropping dolomites consist of different formations with profound differences regarding the associated water storage capacity. While chert-rich formations tend to be extensively weathered and therefore contain large volumes of groundwater, chert-poor or chert-free dolomite may not be karstified at all and effectively act as an aquiclude.
In the Far West Rand area the outcropping dolomite consists of alternating bands of chert-free/poor and chert-rich formations that run nearly parallel to each other due to a shallow dip component, forming the southern limb of the Rand anticline (Figure 3). In theory, this should result in parallel zones of aquifers separated by aquifuges (the chert-free dolomites). For a number of reasons, beyond the scope of this article, this was not the case in the dewatered, hence best-studied compartments. However, most of these reasons do not seem to apply to the BTC where, as illustrated above, the various eyes display different chemical signatures. Evaluation of exploration-derived cross sections (Figure 11) indicates that the BTF compartment, at least west of Welverdiend (the area covered by drilling), is not only divided in the different lithological zones, but even further subdivided into smaller ‘sub-compartments’ by strike-parallel (Vredefort event-related) faulting.
Boreholes in the BTC monitored in the past by the DWA were analyzed in terms of groundwater levels, and although the borehole coverage is limited, at least one borehole per identified ‘sub-compartment’ exists. For the dewatered compartments it was established that the groundwater levels follow topography and are not absolutely flat as thought earlier, displaying a gradient of 1:1,250 [6]. From borehole information it became clear that each sub-compartment has a unique groundwater level, and furthermore, approximately halfway downstream the BTC compartment these levels were found to be well below the (chert-free) dolomite ‘walls’ separating neighboring sub-compartments. That means that the exchange of groundwater between different sub-compartments, at least for the lower half of the BTC, is unlikely to take place under normal conditions.
Figure 11. Geological N-S cross section through the floodplain of the Wonderfonteinspruit at Carletonville indicating chert-poor/-free dolomitic formations acting as aquifuges between karstified and water bearing chert-rich dolomite (termed ‘sub-compartments, small print in figure is not relevant to the argument) (Map base of Figure: [48]).
Water 03 00291 g011
That would mean that the BTC consists of a number of discrete ‘sub-compartments’ between which little mixing of water may occur. Since each sub-compartment has its own surface and underground catchment area with specific lithology, soil and other relevant features the water quality in the different sub-compartments may differ (Figure 12).
Figure 12. Extent of the surface area outcrop of different sub-compartments in the Boskop-Turffontein Compartment. (Map base of Figure: [48]).
Water 03 00291 g012
It is therefore likely that the Turffontein eyes are fed by a different sub-compartment than the GMB eye explaining the long-known differences in water quality between the two springs. Mining later may have amplified these differences by placing sources of water pollution such as slimes dams, rock dumps, pipe discharging mine effluents, etc., to different extent and size in the respective catchments (Figure 13).
Figure 13. Satellite image indicating the presence of slimes dams in surface catchments associated with sub-compartments that feed the Turffontein and GMB eyes (approximate delineation) (image source: Google Earth, 12 June 2007).
Water 03 00291 g013
For the Tfnt. eye the density of slimes dams deposited in its surface catchment resulted in a higher degree of water pollution compared to the GMB eye (Figure 13). Apart from (horizontal) differences in the extent of U pollution in the surface catchments of the various sub-compartments there are indications that vertical differences in water quality exists within sub-compartments. An example is sub-compartment number 2 that comprises much of the WFS as well as the Tfnt. eyes (Figure 13). U levels in the upper Tfnt. eye (1,426 m amsl) were found to be significant lower (20-times) than those in the WFS at Muiskraal (1,412 m amsl) even after the WFS dried up well upstream of this point in April 2003. Since polluted stream water after April 2003 could no longer reach the Muiskraal bridge and other surface tributaries are not existing, the high U-level found at the site (average 13 µg/L, max. 172 µg/L; measured by the Blyvooruitzicht GM between February 2003 and March 2006; 105 samples [42]) can only be derived from polluted groundwater diffusely entering the stream downstream of the Turffontein eyes. The occurrence of a wide and comparatively large wetland covering this stretch is indicative of significant baseflow feeding the stream in this low lying part of the BTC where the groundwater table frequently intersects the stream channel. In contrast to the somewhat higher lying Turffontein eyes where elevated U levels exclusively appear in form of sporadic, isolated peaks, the exfiltrating groundwater feeding the WFS upstream of Muiskraal appears to carry a permanently elevated U load as indicated by U minima a being above the regional natural background level of 0.2 µg/L). Unfortunately, the Blyvooruitzicht GM stopped monitoring this part of the stream in March 2006. Samples taken thereafter as part of the weekly monitoring program of the Potchefstroom municipality as well as grab samples by the authors showed significantly reduced U levels for the period 2007–2010 (1–2 µg/L), even though in December 2010 a U-peak of nearly 16 µg/L was detected following an intense rain period that allowed the upper WFS to reach the Muiskraal site on surface again.
In order to explain these differences in the degree and temporal pattern of U pollution occurring within the same sub-compartment, a vertical differentiation of the underlying karst system is assumed. Such differentiation could relate to the observed multitude of cave levels with each level acting as conduit to separate and deliver groundwater of different qualities over relatively long distances (Figure 14).
Figure 14. Schematic sketch depicting how a possible vertical differentiation of sub-compartments (different karst levels) may explain the different degree and temporal patterns of U concentration observed in the Turffontein eye and the Wonderfonteinspruit at the Muiskraal bridge sampling site.
Water 03 00291 g014
In the proposed model, the sub-compartment consists of multiple karst levels (in this case two were used as an example) between which hydraulic interactions are limited to some degree of downward flow along fractures and fissures. The flow from the upper to the lower levels allows for limited recharge of the lower aquifers with mostly unpolluted rain/groundwater. In the upper level aquifer, which feeds the Turffontein eye, U polluted water can only enter after intense rain events when contaminated stormwater run off from nearby slimes dams exceeds the carrying capacity of dams and stormwater canals and spills into adjacent sinkholes that are directly linked to the upper karst level. This short-term input of U polluted runoff results in the sporadic U peaks that are typical for the eye. The lower karst level provides baseflow that diffusely enters the WFS at the wetland near Muiskraal bridge (Figure 14). Being directly hydraulically linked via fractures and possibly even sinkholes at the base of slimes dams, the lower karst level permanently receives U polluted seepage that more or less continuously flows out of the slimes dam. This, in turn, results in a gradually rising U concentration in the receiving aquifer up to a level where the U input is balanced by the influx of unpolluted groundwater from the upper aquifer (Figure 14). This would explain that the U level at the Muiskraal bridge is significantly higher than at the Turffontein eye (even in times when there is no surface flow of polluted water from the upper WFS arriving as it was the case since approximately April 2003) as well as the fact that the U level appears to be constant over the past decade or so. The fact, that after 2006, U levels appear to decrease again may relate to the disappearance of a major U source that used to feed U-polluted seepage into the lower sub-compartment level. Such disappearing source could relate to the reclaiming of a large slimes dams complex at the Blyvooruitzicht GM, which was recently completed. However, this all remains speculative at the time of writing as so far no investigations into verifying the model have been conducted.

5. Summary and Conclusions

The project reported on in this paper aims to determine the role that peat deposits at the GMB wetland can play to mitigate impacts of U pollution arising from an upstream gold mining area on the water supply of a municipality with some 250,000 inhabitants. As the first part of a series, this paper outlines the hydrogeological conditions in the wider study area and characterizes some of the impacts associated with decades of deep level gold mining taking place in the area. The latter include a first order quantification of the potential U load that may impact on the GMB wetland as well as a discussion of possible pathways along which such impact may be facilitated. This forms the base for the second part of the paper that explores in how far the peat deposits at the wetland may indeed act as a filter for U and thus protect the water reservoir of the downstream community.
In contrast to the other major karst springs present in the region, which owe their existence to near vertical dykes that force groundwater to the surface, the GMB spring is not a dammed spring in the classical sense. Its formation is probably associated with the collapse of a karst channel and the presence of a regional thrust fault that crosses the area. The collapsed, polje-type of karst system was subsequently filled with up to 5 m thick peat which began to accumulate some 4,000 years before the end of the last Pleistocene cold period.
Deep level gold mining has significantly altered the hydrogeological conditions in the area by adopting a dewatering policy. Apart from lowering the groundwater table and the associated drying up of some of the largest karst springs in South Africa it also caused unpredicted ground movements in form of sinkholes which not only had partly catastrophic impacts on human life and infrastructure but also presumably increased groundwater recharge rates of the area by diverting surface run off, including stream flow, underground. By penetrating through previously impervious dykes in geological strata below the dolomites, gold mines could have irreversibly (it is regarded uneconomical to close the pierced dykes) changed geohydrological conditions underground and—in a worst case scenario—hydraulically linked several dolomitic compartments together creating a single ‘Mega-compartment’. As one of the three main outflow points of this ‘Mega-compartment’ the GMB eye may receive drastically increased volumes of highly polluted mine water decanting from a systems of flooded mine voids years after mines closed in the area. High U levels in mine water currently decanting from a flooded void system in the mined out West Rand area located in the headwater region of the WFS indicate that the radioactive heavy metal may also pose a future threat. This is in addition to current U pollution from diffuse sources like tailings and rock dumps that mainly affects the WFS. Based on an analysis of several thousands of U concentration data from the catchment, Winde calculated an annual U load of some 3.5 t for the lower WFS [42]. Since most of the polluted stream water is lost to the subjacent karst aquifer via either stream bed loss or water directly flowing into karst openings in the flooded area next to the stream, a significant amount of U is annually injected into the BTC. This is reflected by significant increases in U levels observed in the two main (and monitored) springs of the compartment namely the GMB and Tfnt. eye, where the average U level since 1997 rose 4- and 13-times, respectively [42].
Distinct differences in the degree and temporal pattern of U pollution between the two springs as well as other associated water bodies can only be explained by hydraulically largely disconnected karst systems within the compartment (termed ‘sub-compartments’). These sub-compartments result from the different degree of karstification of chert-rich and chert-poor dolomitic formations with only the former allowing for the formation of extensive water bearing karst aquifers, while chert-poor or -free dolomite may in fact act as aquifuge given the hydrological conditions prevailing in the BTC. Owing to differing concentrations of U sources placed by mining in the associated surface and underground catchments of these sub-compartments, their water quality, especially U levels, may differ significantly. However, significant differences in U levels and U dynamics also occurred within the same sub-compartment. A model assuming a vertical differentiation of the sub-compartment in at least two or more karst aquifer levels is able to explain the observed differences but is still in need of verification.
Generally, it can be concluded that a significant U pollution potential already exists under current conditions that may impact on the GMB wetland. Major U sources relate all to mining and include stormwater run off from tailings deposits that was found to directly impact on karst aquifers via sinkholes, contaminated seepage continuously emanating from the base of slimes dams which were often placed on cavernous dolomite with pre-existing sinkholes to facilitate better drainage of porewater and enhance stability, and lastly, direct discharge of U polluted mine effluents via pipelines and canals into the WFS rendering stream water a (secondary) source of U pollution.
While the influx of U polluted stream water into the GMB wetland during extreme flood events cannot be ruled out it is assumed that most of the U arrives in the wetland via underground pathways. So far, it appears that such U influx is confined to a few isolated rain events with water quality recovering to pristine conditions (<0.4 µg U/L) for the overwhelming majority of the time in between.

Acknowledgements

The study is funded by the Department of Water Affairs of South Africa (project no. 213-2006) which is gratefully acknowledged.

References

  1. Smuts, W.J. Characteristics of South African Peats and Their Potential Exploitation; PhD Thesis, Faculty of Science, University of Pretoria, Pretoria, South Africa, 1997; p. 222.
  2. Grundling, P.L.; Marneweck, G.C. Mapping, Characterisation and Monitoring of Highveld Peatlands. Compilation of Existing Data and Evaluation of Inventory Methodology; Wetland Consulting Services Report No. 28/99; Wetland Consulting Services: Pretoria, South Africa, unpublished; 1999. [Google Scholar]
  3. Dini, J.; Cowan, G.I.; Goodman, P. Proposed Wetland Classification System for South Africa (First Draft); Water Research Commission: Pretoria, South Africa, 1998. [Google Scholar]
  4. Grundling, P.L. The karst fens of South Africa. IMCG Newsletter 2001, 2, 15–16. [Google Scholar]
  5. Fleischer, J.N.E. Artificial Recharge and Pollution Aspects in the Dolomitic Aquifers, Turffontein Area; Technical report GH 3109; DEPARTMENT OF WATER AFFAIRS AND FORESTRY OF SOUTH AFRICA: Pretoria, South Africa, unpublished; 1979. [Google Scholar]
  6. Wolmarans, J.F. Ontwatering Van Die Dolomietgebied Aan Die Verre Wes-Rand: Gebeure in Perspektief (Dewatering of the Dolomitic Area at the Far West Rand: Events in Perspective). DSc thesis, University of Pretoria, Pretoria, South Africa, 1984; p. 205. [Google Scholar]
  7. Grundling, P.L. Environmental Impact Assessment for Stander Veen Cc. (Middleground) Expansion to Portions 4,8 & 9; Environmental Impact Assessment Report No. IHL 2002/4/001; Ihlaphosi Enviro Services: Pretoria, South Africa, unpublished; 2002. [Google Scholar]
  8. Bredenkamp, D.B. Use of Natural Isotopes and Groundwater Quality for Improved Recharge and Flow Estimates in Dolomitic Aquifers. Water SA 2007, 33, 87–92. [Google Scholar]
  9. Winde, F. A Hydrological Study on the Gerhard Minnebron Wetland to Determine how the Wetland System Functions and Fits into the Wonderfonteinspruit Catchment due to Licence Applications to Harvest Peat and Existing Peat Harvesting Operations. DWAF Project No. 2006-231,Report on Reconnaissance Phase (1 November 2006–30 April 2007); DEPARTMENT OF WATER AFFAIRS AND FORESTRY OF SOUTH AFRICA: Pretoria, South Africa, 2007; p. 52. [Google Scholar]
  10. Owen, D.E.; Otton, J.K. Mountain wetlands: efficient uranium filters—potential impacts. Ecol. Eng. 1995, 5, 77–93. [Google Scholar] [CrossRef]
  11. Brown, P.A.; Gill, S.A.; Allen, S.J. Metal removal from wastewater using peat. Water Res. 2000, 34, 3907–3916. [Google Scholar] [CrossRef]
  12. Ringquist, L.; Oeborn, I. Copper and zinc adsorption onto poorly humified sphagnum and carex Peat. Water Res. 2001, 36, 2233–2242. [Google Scholar] [CrossRef]
  13. Ringquist, L.; Holmgren, A.; Oeborn, I. Poorly humified peat as an adsorbent for metals in wastewater. Water Res. 2001, 36, 2394–2404. [Google Scholar] [CrossRef]
  14. Coggins, A.M.; Jennings, S.G.; Ebinghaus, R. Accumulation rates of the heavy metals lead, mercury and cadmium in ombrotrophic peatlands in the west of Ireland. Atmosph. Environmt. 2005, 40, 260–278. [Google Scholar] [CrossRef]
  15. van Roy, S.; Vanbroekhoven, K.; Dejonghe, W.; Diels, L. Immobilization of heavy metals in the saturated zone by sorption and in situ bioprecipitation processes. Hydrometall 2006, 83, 195–203. [Google Scholar] [CrossRef]
  16. Winde, F.; Stoch, E.J.; Erasmus, E. Identification and Quantification of Water Ingress into Mine Voids of the West Rand and Far West Rand Goldfields (Witwatersrand Basin) with a View to Long-Term Sustainable Reduction Thereof; Final Report to Council for Geoscience, Project No. 5512; Council for Geosciences: Pretoria, South Africa, unpublished; 2006; p. 261. [Google Scholar]
  17. Fleischer, J.N.E. Report on the Investigation of the Far West Rand Dolomite Aquifers; DWAF interim report; Department for Water Affairs: Pretoria, South Africa, unpublished; 1979. [Google Scholar]
  18. Fleischer, J.N.E. An Analysis of Springs in the Dolomitic Aquifer South-Western Transvaal; Technical report GH 3121; Department for Water Affairs: Pretoria, South Africa, unpublished; 1979. [Google Scholar]
  19. Fleischer, J.N.E. The Geohydrology of the Dolomite Aquifers of the Malmani Subgroup in the South-Western Transvaal; Technical Report No. GH 3169; Department for Water Affairs: Pretoria, South Africa, 1979. [Google Scholar]
  20. Swart, C.J.U.; James, A.R.; Kleywegt, R.J.; Stoch, E.J. The future of the dolomitic springs after mine closure on the far west rand, Gauteng, RSA. Environ. Geol. 2003, 44, 751–770. [Google Scholar] [CrossRef]
  21. Swart, C.J.U.; Stoch, E.J.; van Jaarsveld, C.F.; Brink, A.B.A. The lower Wonderfontein Spruit: An exposé. Environ. Geol. 2003, 43, 635–653. [Google Scholar]
  22. Walraven, F.; Martini, J. Zirkon Pb-evaporation age determination of the Oak Tree formation, Chuniespoort group Transvaal sequence: implications for Transvaal-Griqualand West Basin correlations. S. Afr. J. Geol. 1995, 98, 58–67. [Google Scholar]
  23. Martini, J.E.J.; Kavalieris, I. The karst of the Transvaal (South Africa). Int. J. Speleology 1976, 8, 229–251. [Google Scholar] [CrossRef]
  24. Middleton, J.L.; Hunter, W.; Duff, M.B. Report on the Transvaal-Rand Water Supply. Civil Engineers; private archive EJ Stoch: Welverdiend, Pretoria, unpublished; 1904. [Google Scholar]
  25. Enslin, J.F.; Kriel, J.P. Some Results Obtained from a Hydrological Study of a Dolomitic Catchment Area in the Transvaal; Union of South Africa: Department of Water Affairs, Pretoria, South Africa, 1960. [Google Scholar]
  26. Jordaan, J.M.; Enslin, J.F.; Kriel, J.P.; Havemann, A.R.; Kent, L.E.; Cable, W.H. Final Report of the Interdepartmental Committee on Dolomitic Mine Water: Far West Rand; Department for Water Affairs: Pretoria, South Africa, 1960. [Google Scholar]
  27. Enslin, J.F. Dolomitic Water Supplies in the Transvaal, Republic of South Africa; Technical report No. GH 1317; Department for Water Affairs: Pretoria, South Africa, 1967. [Google Scholar]
  28. Brink, A.B.A. Engineering Geology of Southern Africa; Building Publications Pretoria: Silverton, South Africa, 1979. [Google Scholar]
  29. Polivka, J. Geohydrological Investigation of the Schoonspruit Compartment in the Dolomitic Area of Ventersdorp; Technical Report No. GH 3524; Department for Water Affairs: Pretoria, South Africa, 1987. [Google Scholar]
  30. Schwartz, H.I.; Midgley, D.C. Evaluation of geo-hydrology constants in the far west rand dolomitic formations. Trans. S. Mr. Instn. Civ. Engrs. 1975, 17, 31–36. [Google Scholar]
  31. Stoch, E.J.; Winde, F. Threats and opportunities for post-mining development in dolomitic gold mining areas of South Africa—An hydraulic approach. Part III: Planning and uncertainty—lessons from history. Water SA 2010, 36, 83–88. [Google Scholar] [CrossRef]
  32. Ford, D.; Williams, P. Karst Hydrogeology and Geomorphology, 1st ed.; Wiley: Chichester, UK, 2007. [Google Scholar]
  33. Liebenberg, W.; Head of regional office, Department of Water Affairs, Potchefstroom, South Africa. Personal communication, 2007.
  34. Lewis, C.A. Later quaternary climatic changes, and associated human responses, during the last ~45 000 yr in the Eastern and Adjoining Western Cape, South Africa. Earth Sci. Rev. 2008, 88, 167–187. [Google Scholar]
  35. Chase, B. Evaluating the use of Dune Sediments as a Proxy for Paleo-Aridity: A Southern African Case Study. Earth Sci. Rev. 2009, 93, 31–45. [Google Scholar]
  36. Richer, L. The Hydrology and Geomorphology of the Wetland of the Oog Van Schoonspruit, North-West Province, South Africa; Honours Thesis, University of the Witwatersrand, Johannesburg, South Africa.
  37. Basson, I.J. The Structural Geology of the Northern Portion of the Potchefstroom Fault. Pretoria, South Africa, 1994. [Google Scholar]
  38. Brink, M.C.; Waanders, F.B.; Bischoff, A.A. Katdoornbosch—Witpoortjie fault: A ring thrust of Vredefort event age. S. Afr. J. Geol. 2000, 103, 15–31. [Google Scholar]
  39. Jeppe (Judge). Judgement on Water Allocation on the Farms Gerhard Minnebron and Katdoornbosch. Private archived by Stoch, E.J.; Welverdiend, South Africa, unpublished; 1915.
  40. Stoch, E.J.; Extraordinary professor of the North-West University, Potchefstroom Campus, Faculty of Natural Sciences, Resident in study area, farmer representative and consulting scientist, Welverdiend, South Africa. Personal communication, 2007.
  41. Visser, G.; Local farmer, Welverdiend, South Africa. Personal communication, 2007.
  42. Winde, F. Uranium pollution of the wonderfonteinspruit: 1997–2008. Part II: U in water—concentrations, loads and associated risks. Water SA 2010, 36, 257–278. [Google Scholar]
  43. Winde, F. Uranium Pollution of Water Resources in Mined-Out and Active Goldfields of South Africa—A Case Study in the Wonderfonteinspruit Catchment on Extent and Sources of U Pollution and Associated Health Risks. In International Mine Water Conference, Pretoria, South Africa, 19–23 October 2009.
  44. Pranic, Z. Groundwater Sample Taken from Flooded Stopes of the Deelkraal Gold Mine at 7 July 2009 and submitted for analysis. 2009.
  45. Hydrological Information System: Water Quality Data for Station C2H013, Upper Turffontein Eye; Department of Water Affairs and Forestry of South Africa (DWAF): Pretoria, South Africa, 2005.
  46. Hydrological Information System: Water Quality Data for Station C2H011, Gerhard Minnebron Eye; Department of Water Affairs and Forestry of South Africa (DWAF): Pretoria, South Africa, 2005.
  47. Report on the Radioactivity Monitoring Programme in the Mooi River (Wonderfonteinspruit) Catchment; Report No. N/C200/00/RPQ/2399; Institute for Water Quality Studies (IWQS): Pretoria, South Africa, 1999.
  48. Loubser, A. [compiler]: Geological map of the area south, west and north of Doornfontein Gold Mine. Private archive by Erasmus, E.; Pretoria, South Africa, unpublished; 1995. [Google Scholar]

