Climate Change Impacts on Water Supply and Demand in Rheraya Watershed (Morocco), with Potential Adaptation Strategies

Abstract
:1. Introduction

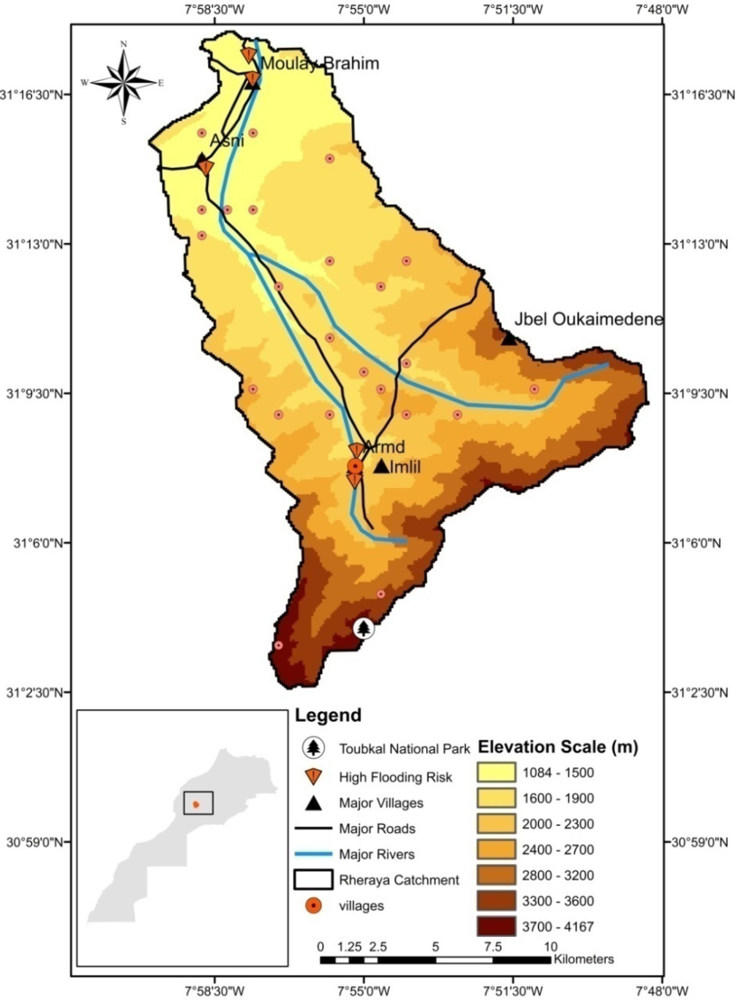
2. Study Area
3. Data Sets
4. Applied Methodology
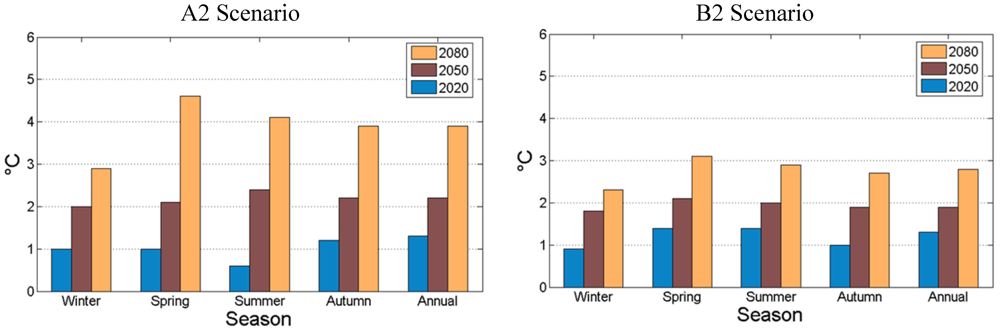
4.1. Climatic Model Development

| Storylines | A2 scenario | B2 scenario |
|---|---|---|
| Regionalization (heterogeneous world) | regionally oriented economic development | local environmental sustainability |
| Population growth | high | medium |
| GDP growth | medium | medium |
| Energy use | high | medium |
| Land-use changes | medium/high | medium |
| Resource availability | low | medium |
| Pace and direction of technological | slow | medium |
| Change favoring | regional | “dynamics as usual” |
4.2. Hydrologic Model Development
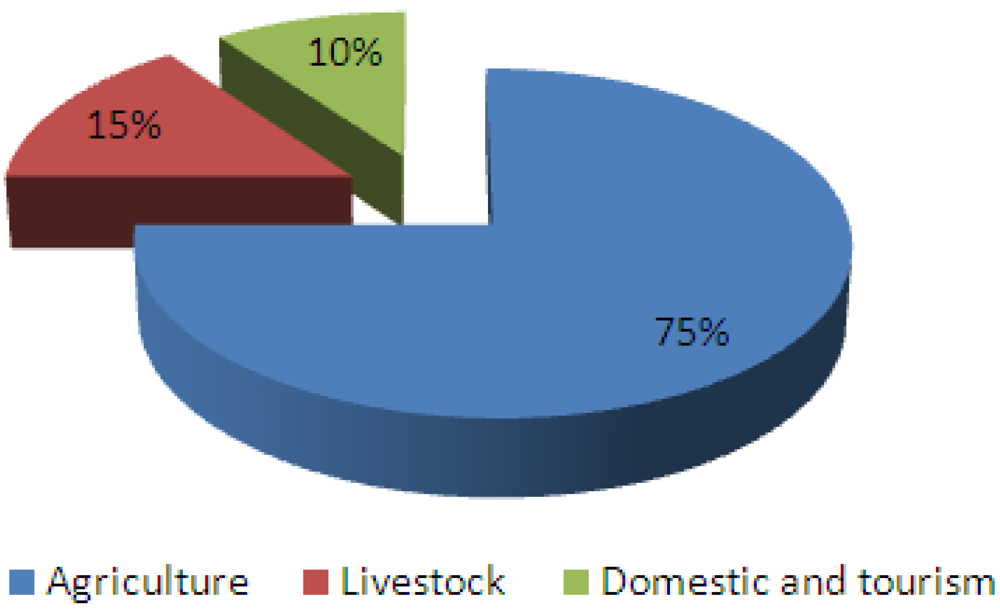
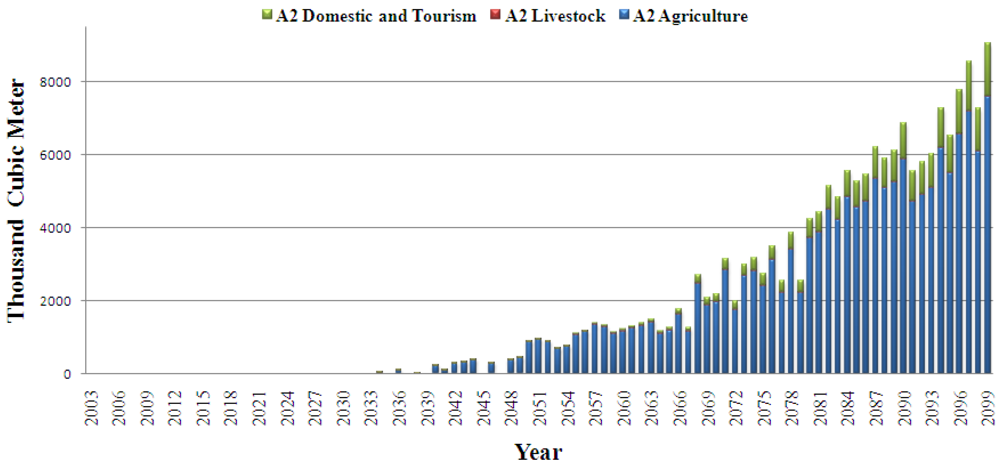
4.3. Future Trends in Water Demands in the Study Area
4.4. Management Responses to the Climate Change Scenarios
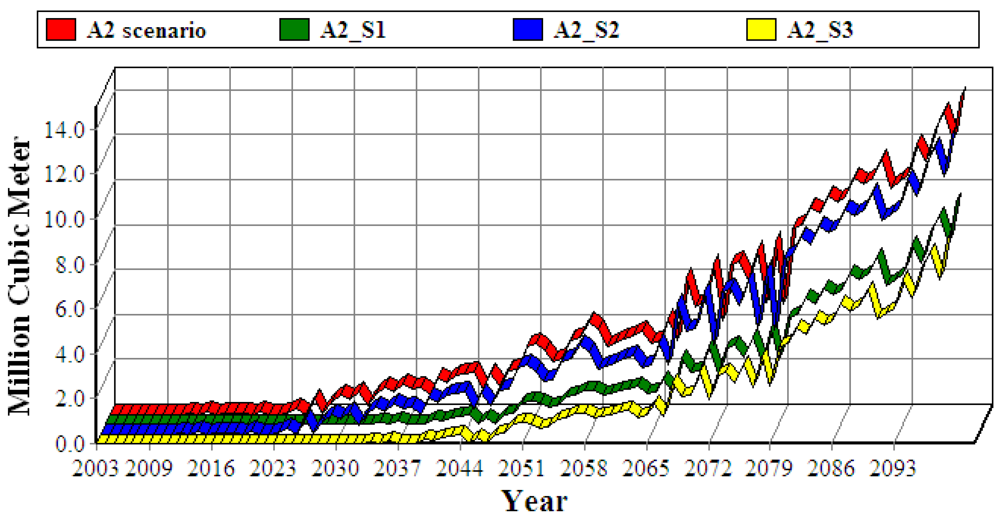
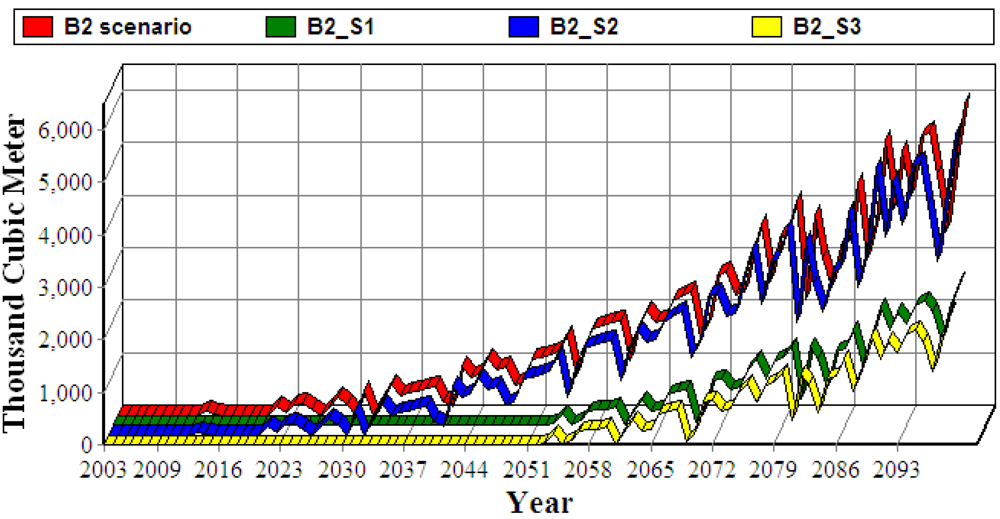
- (a) No Adaptation: Applying A2 and B2 data scenarios, without any adaptation strategy in the catchment.Throughout this study several stakeholder meetings were held (including central and regional government officials, river basin managers, irrigators, Irrigation Communities, environmental NGOs and research institutions); two adaptation strategies that managers plan to implement in the watershed were assessed.
- (b) The agricultural technology development (S1): Drip irrigation is progressively implemented to save water. This is included in the analyses by gradually increasing water use efficiency by 25%. The successive implementation follows a linear trend. Thus, drip irrigation is applied to 50% of the cropping area after 35 years.
- (c) The public awareness (S2): The instruments through which water issues public awareness can be increased include: marketing and management consultants, media exposure, communication support materials, training institutes, and partnerships at an international level. Following this strategy the managers expect a 20% decrease in water consumption per person by 2020.
- (d) The combination of the two adaptation strategies S1 and S2 (S3): takes into account S1 and S2 assumptions.
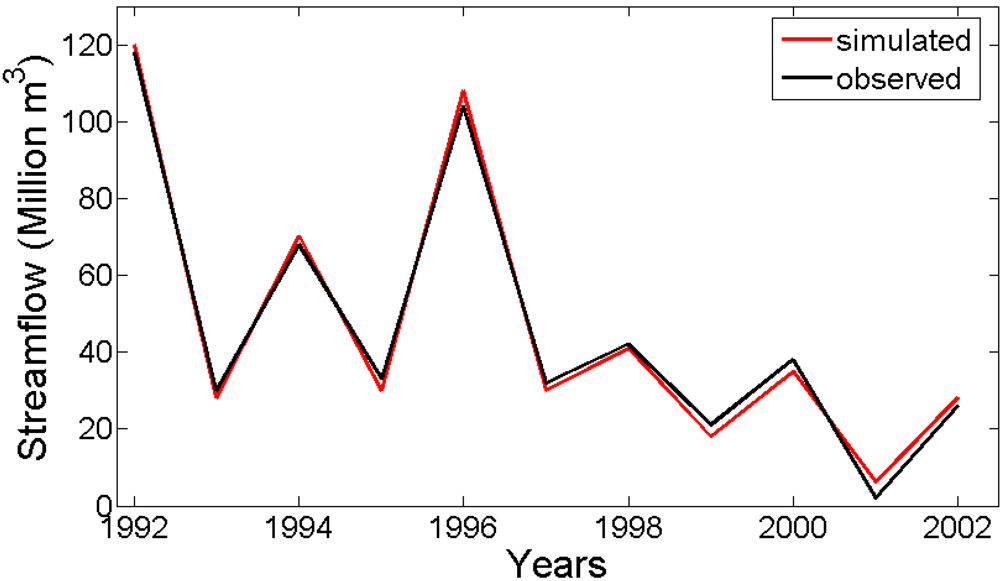
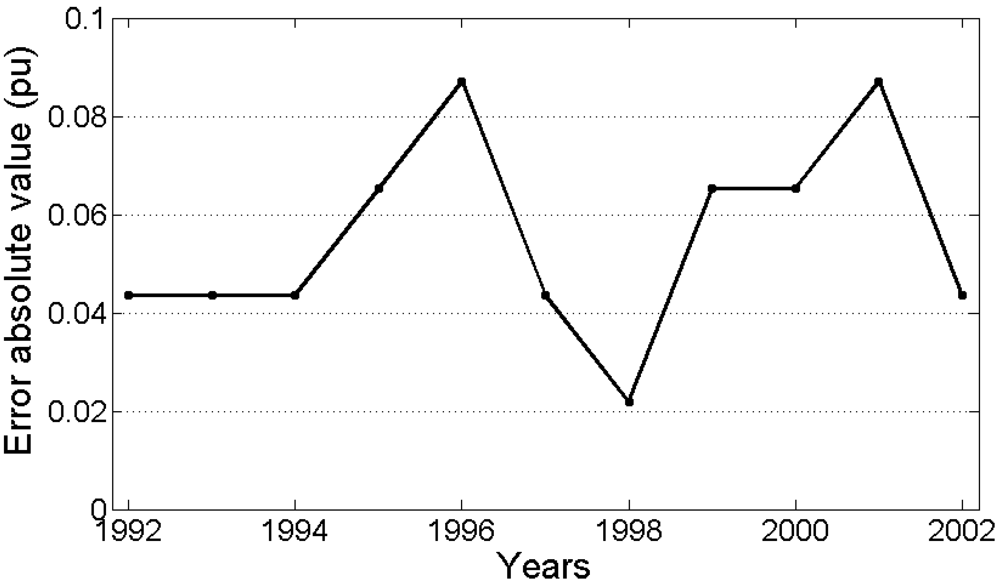
5. WEAP Calibration and Validation


6. Results and Discussion
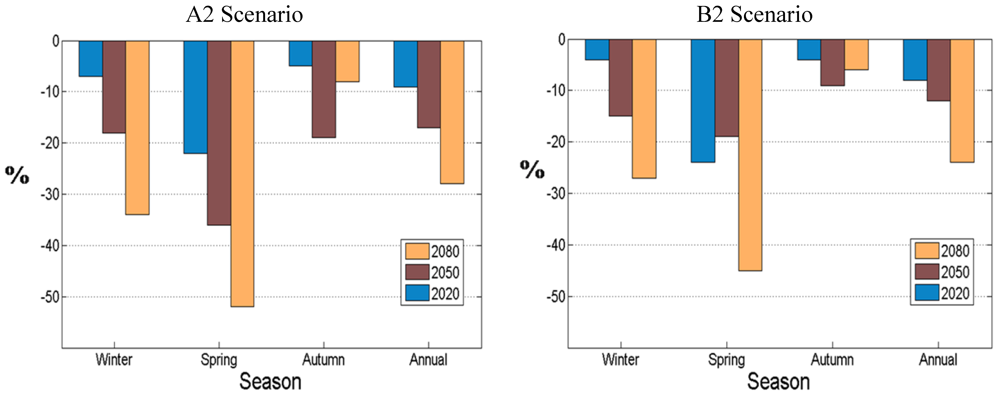
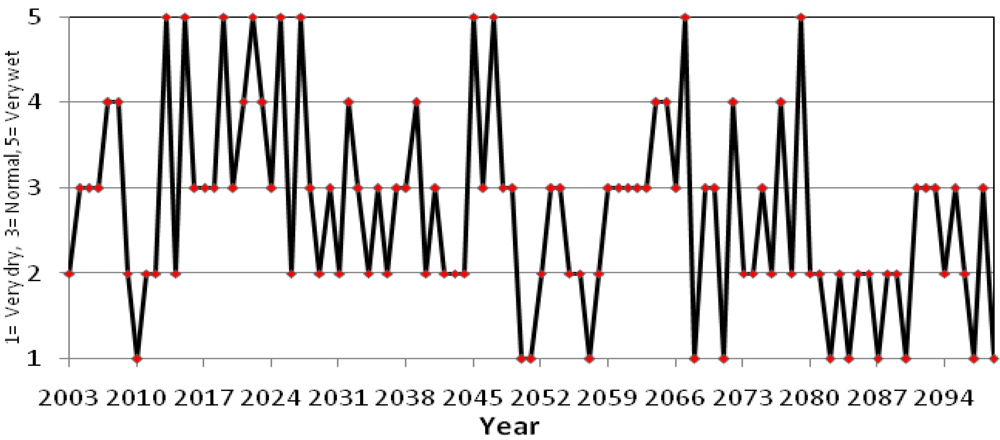
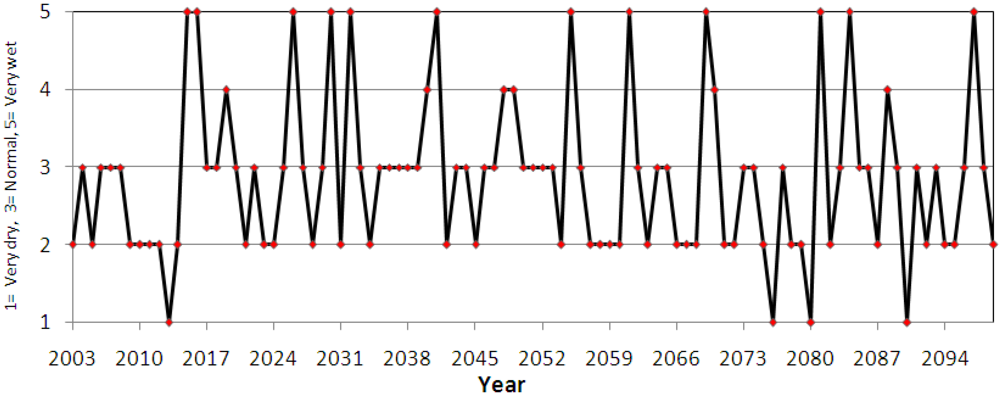
6.1. Climatic Analysis


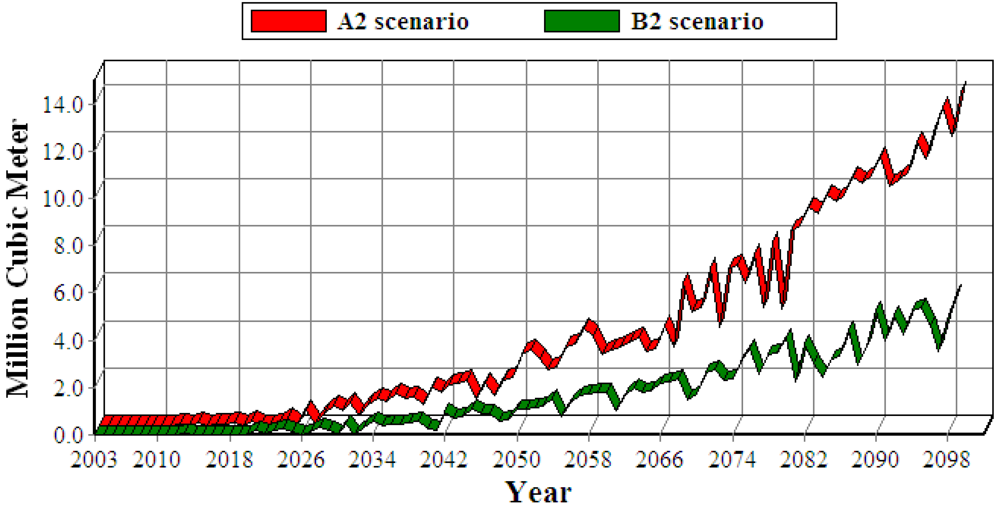
6.2. Hydrologic Analysis
6.2.1. Operations Analysis Without Adaptation Strategies


6.2.2. Operations Analysis with Adaptation Strategies


7. Conclusions
Acknowledgments
References
- García-Ruiz, J.M.; López-Moreno, J.I.; Vicente-Serrano, S.M.; Lasanta-Martínez, T.; Beguería, S. Mediterranean water resources in a global change scenario. Earth Sci. Rev. 2011, 105, 121–139. [Google Scholar] [CrossRef] [Green Version]
- Cudennec, C.; Leduc, C.; Koutsoyiannis, D. Dryland hydrology in Mediterranean regions—A review. Hydrol. Sci. J. 2007, 52, 1077–1087. [Google Scholar]
- Giorgi, F.; Lionello, P. Climate change projections for the Mediterranean region. Glob. Planet. Change 2008, 63, 90–104. [Google Scholar] [CrossRef]
- Ulbrich, U.; May, W.; Li, L.; Lionello, P.; Pinto, J.G.; Somot, S. Chapter 8: The Mediterranean climate change under global warming. In Developments in Earth and Environmental Sciences; Lionello, P., Malanotte-Rizzoli, P., Boscolo, R., Eds.; Elsevier: Amsterdam, The Netherlands, 2006; Volume 4, pp. 399–415. [Google Scholar]
- Giorgi, F. Climate change hot-spots. Geophys. Res. Lett. 2006, 33. [Google Scholar] [CrossRef]
- Bennani, A.; Buret, J.; Senhaji, F. Communication Nationale Initiale à la Convention Cadre des Nations Unies sur les Changements Climatiques; Ministère de l’Aménagement du Territoire de l’Urbanisme de l’Habitat et de l’Environnement: Rabat, Morocco, 2001; pp. 1–101. [Google Scholar]
- Driouech, F.; Déqué, M.; Mokssit, A. Numerical simulation of the probability distribution function of precipitation over Morocco. Clim. Dyn. 2009, 32, 1055–1063. [Google Scholar] [CrossRef]
- Bates, B.C.; Kundzewicz, Z.W.; Wu, S.; Palutikof, J.P. Climate Change and Water. Technical Paper of the Intergovernmental Panel on Climate Change; IPCC Secretariat: Geneva, Switzerland, 2008; p. 210. [Google Scholar]
- Barnett, T.P.; Adam, J.C.; Lettenmaier, D.P. Potential impacts of a warming climate on water availability in snow-dominated regions. Nature 2005, 438, 303–309. [Google Scholar]
- Vicuña, S.; Garreaud, R.; McPhee, J. Climate change impacts on the hydrology of a snowmelt driven basin in semiarid Chile. Clim. Change 2011, 105, 469–488. [Google Scholar] [CrossRef]
- Simonneaux, V.; Hanich, L.; Boulet, G.; Thomas, S. Modelling runoff in the Rheraya catchment (High Atlas, Morocco) using the simple daily model GR4J. Trends over the last decades. In Proceedings of the 13th IWRA World Water Congress 2008, Montpellier, France, 1–4 September 2008.
- Asit, B. Integrated water management: Some international dimensions. J. Hydrol. 1981, 51, 369–379. [Google Scholar] [CrossRef]
- Zalewski, M. Ecohydrology—The use of ecological and hydrological processes for sustainable management of water resources/Ecohydrologie—La prise en compte de processus écologiques et hydrologiques pour la gestion durable des ressources en eau. Hydrol. Sci. J. 2002, 47, 823–832. [Google Scholar] [CrossRef]
- Null, S.E.; Viers, J.H.; Mount, J.F. Hydrologic response and watershed sensitivity to climate warming in California’s Sierra Nevada. PLoS One 2010, 5. [Google Scholar] [CrossRef]
- Milly, P.C.D.; Betancourt, J.; Falkenmark, M.; Hirsch, R.M.; Kundzewicz, Z.W.; Lettenmaier, D.P.; Stouffer, R.J. Stationarity is dead: Whither water management? Science 2008, 319, 573–574. [Google Scholar]
- Al-Omari, A.; Al-Quraan, S.; Al-Salihi, A.; Abdulla, F. A water management support system for amman zarqa basin in Jordan. Water Resour. Manag. 2009, 23, 3165–3189. [Google Scholar] [CrossRef]
- Wilby, R.L.; Dawson, C.W.; Barrow, E.M. SDSM—A decision support tool for the assessment of regional climate change impacts. Environ. Model. Softw. 2002, 17, 145–157. [Google Scholar] [CrossRef]
- Nakicenovic, N.; Alcamo, J.; Davis, G.; de Vries, B.; Fenhann, J.; Gaffin, S.; Gregory, K.; Grubler, A.; Jung, T.Y.; Kram, T.; et al. Special Report on Emissions Scenarios: A Special Report of Working Group III of the Intergovernmental Panel on Climate Change; Cambridge University Press: New York, NY, USA, 2000. [Google Scholar]
- Chaponnière, A.; Maisongrande, P.; Duchemin, B.; Hanich, L.; Boulet, G.; Escadafal, R.; Elouaddat, S. A combined high and low spatial resolution approach for mapping snow covered areas in the Atlas mountains. Int. J. Remote Sens. 2005, 26, 2755–2777. [Google Scholar] [CrossRef] [Green Version]
- Boudhar, A.; Duchemin, B.; Hanich, L.; Chaponnière, A.; Maisongrande, P.; Boulet, G.; Stitou, J.; Chehbouni, A. Snow covers dynamics analysis in the Moroccan High-Atlas using SPOT-VEGETATION data. Sécheresse 2007, 18, 278–288. [Google Scholar]
- Gommes, R.; Kanamaru, H.; El hairech, T.; Rosillon, D.; Babqiqi, A.; Balaghi, R.; Doukkali, R.; Driouech, F.; El ouali, A.; Jlibene, M.; et al. World Bank—Morocco Study on the Impact of Climate Change on the Agricultural Sector; Food and Agriculture Organization: Rome, Italy, 2008; p. 105. [Google Scholar]
- Yates, D.; Sieber, J.; Purkey, D.; Huber-Lee, A. WEAP21—A demand-, priority-, and preference-driven water planning model Part 1: Model characteristic. Water Int. 2005, 30, 487–500. [Google Scholar] [CrossRef]
- Yates, D.; Purkey, D.; Sieber, J.; Huber-Lee, A.; Galbraith, H. WEAP21: A demand, priority, and preference driven water planning model: Part 2, Aiding freshwater ecosystem service evaluation. Water Int. 2005, 30, 501–512. [Google Scholar] [CrossRef]
- Yates, D.; Purkey, D.; Sieber, J.; Huber-Lee, A.; Galbraith, H.; West, J.; Herrod-Julius, S.; Young, C.; Joyce, B.; Rayej, M. Climate driven water resources model of the Sacramento Basin, California. Water Resour. Plan. Manag. 2009, 135, 303–313. [Google Scholar] [CrossRef]
- Lévite, H.; Sally, H.; Cour, J. Testing water demand management scenarios in a water-stressed basin in South Africa: Application of the WEAP model. Phys. Chem. Earth 2003, 28, 779–786. [Google Scholar] [CrossRef]
- Alcamo, J.; Jakeman, A.J. Environmental Futures: The Practice of Environmental Scenario Analysis; Elsevier: Amsterdam, The Netherlands, 2008. [Google Scholar]
- Hoff, H.; Bonzi, C.; Joyce, B.; Tielbörger, K. A water resources planning tool for the Jordan River Basin. Water 2011, 3, 718–736. [Google Scholar] [CrossRef]
- Dai, A.; Lamb, P. J.; Trenberth, K. E.; Hulme, M.; Jones, P. D.; Xie, P. The recent Sahel drought is real. Int. J. Climat. 2004, 24, 1323–1331. [Google Scholar] [CrossRef]
- Hanjra, M.A.; Gichuki, F. Investments in agricultural water management for poverty reduction in Africa: Case studies of Limpopo, Nile, and Volta river basins. Nat. Resour. Forum 2008, 32, 185–202. [Google Scholar] [CrossRef]
- Khan, S.; Hanjra, M.A. Sustainable land and water management policies and practices: A pathway to environmental sustainability in large irrigation systems. Land Degrad. Dev. 2008, 19, 469–487. [Google Scholar] [CrossRef]
- Shah, T.; Bhatt, S.; Shah, R.K.; Talati, J. Groundwater governance through electricity supply management: Assessing an innovative intervention in Gujarat, western India. Agric. Water Manag. 2008, 95, 1233–1242. [Google Scholar] [CrossRef]
- Tilman, D.; Cassman, K.G.; Matson, P.A.; Naylor, R.; Polasky, S. Agricultural sustainability and intensive production practices. Nature 2002, 418, 671–677. [Google Scholar]
- Dudgeon, D. Large-scale hydrological changes in tropical Asia: Prospects for riverine biodiversity. BioScience 2000, 50, 793–806. [Google Scholar] [CrossRef]
© 2012 by the authors; licensee MDPI, Basel, Switzerland. This article is an open-access article distributed under the terms and conditions of the Creative Commons Attribution license (http://creativecommons.org/licenses/by/3.0/).
Share and Cite
Rochdane, S.; Reichert, B.; Messouli, M.; Babqiqi, A.; Khebiza, M.Y. Climate Change Impacts on Water Supply and Demand in Rheraya Watershed (Morocco), with Potential Adaptation Strategies. Water 2012, 4, 28-44. https://doi.org/10.3390/w4010028
Rochdane S, Reichert B, Messouli M, Babqiqi A, Khebiza MY. Climate Change Impacts on Water Supply and Demand in Rheraya Watershed (Morocco), with Potential Adaptation Strategies. Water. 2012; 4(1):28-44. https://doi.org/10.3390/w4010028
Chicago/Turabian StyleRochdane, Saloua, Barbara Reichert, Mohammed Messouli, Abdelaziz Babqiqi, and Mohammed Yacoubi Khebiza. 2012. "Climate Change Impacts on Water Supply and Demand in Rheraya Watershed (Morocco), with Potential Adaptation Strategies" Water 4, no. 1: 28-44. https://doi.org/10.3390/w4010028
APA StyleRochdane, S., Reichert, B., Messouli, M., Babqiqi, A., & Khebiza, M. Y. (2012). Climate Change Impacts on Water Supply and Demand in Rheraya Watershed (Morocco), with Potential Adaptation Strategies. Water, 4(1), 28-44. https://doi.org/10.3390/w4010028