Article

Coastal Flooding in the Solent: An Integrated Analysis of Defences and Inundation

1
Faculty of Engineering and the Environment, University of Southampton, Southampton SO17 1BJ, UK
2
Geodata Institute, University of Southampton, Southampton SO17 1BJ, UK
*
Author to whom correspondence should be addressed.
Water 2012, 4(2), 430-459; https://doi.org/10.3390/w4020430
Submission received: 25 February 2012 / Revised: 16 April 2012 / Accepted: 18 April 2012 / Published: 26 April 2012
(This article belongs to the Special Issue Flood Risk Management)

Abstract

:
This paper demonstrates a methodology for integrating existing models for the rapid simulation of coastal flood events across a large and varied case study area on the UK south coast. Following validation against observations from real coastal floods, synthetic events driven by realistic waves and water levels and the full range of failure mechanisms were modelled for a range of loadings to generate peak flood water depths and an overview of impacts across this spectrum of possible floods. Overtopping is relatively important compared to breaching as coastal floodplains are small. This modelling system supports multiple potential applications, such as planning flood warnings, coastal defence upgrade, and land use, including under sea-level rise. The concepts drawn from this study are transferable to similar coastal regions.

1. Introduction

Floods are an important long term risk to society. While society generally adapts to them, e.g., [1,2], this is usually accomplished in response to real events, which can include significant losses and even deaths. In Europe, developments in coastal flood risk management accelerated following the 1953 North Sea floods which killed 1836 people in the Netherlands, 307 in the UK and 17 in Belgium [3,4,5] and floods on the German Bight in 1962 when more than 300 people lost their lives [6,7]. In comparison with understanding at that time, coastal planners now benefit from a better understanding of the nature and degrees of exposure to flooding due to advances in coastal modelling e.g., [8]. Numerical simulation of coastal inundation is well demonstrated [9,10,11,12], although uncertainties, practical constraints, and the conceptual understanding of coastal flood systems can be limiting [13]; with poor flood incident management still resulting in widespread loss of life and other significant damages [14]. Hurricane Katrina demonstrated the catastrophic effects of defence failures in low-lying and populated coastal areas [15], while flooding in Bangkok has highlighted the impacts of flooding upon a large populous city, cf. [16]. The consequences of un-developed flood management measures were tragically apparent on the French Atlantic coast in February 2010 when more than 40 people died following failure and outflanking of coastal defences during the well forecast storm Xynthia [17]. In the hours before the event, warnings were available, but not specific to coastal flooding consequences, leaving authorities incapable of planning evacuation [18].
This study is differentiated from most flood risk research by focusing upon analysis of inundation over a large area where coastal floodplains are relatively small, and water flowing over defences (overflow and wave overtopping) may be more significant compared to breach (a reduction in the effective crest height). The latter failure mechanism is a particular threat for low-lying and expansive floodplains such as those on the east UK and Belgian, Dutch and German North Sea coasts and has received considerable attention [19]. Sea-level rise is increasing the probability of extreme events in most coastal regions e.g., [20,21,22], hence it is essential that methods are available to identify the likelihood and characteristics of flooding. In Europe, the EU Flood Directive (2007/60/EC) has determined that a framework is required to assess flood risk, including emphasis upon the frequency, magnitude and consequences of flooding. Few flood maps contain information on consequences [23], although flood risk assessment methodologies [24,25,26,27] are available to provide valuable insights to vulnerable defences and floodplain areas. Some countries benefit from national-scale assessments which make optimal use of the information available, e.g., [28], although places remain where flood dangers are unknown, or where spatial and temporal resolutions of broader assessments provide an abstraction of the reality of single coastal flood events.
High resolution datasets and numerical tools are currently available for many coastal areas, although are not routinely integrated; particularly where risks are not obvious or recently experienced This paper describes a method for such integration that can support coastal management measures such as forecasting and warning, defence planning, and land-use zonation. This is intended to provide outputs that are easily communicated to the public and flood managers. The Solent is selected as a case study; a shoreline on the south coast of England which comprises a large estuarine system and wave exposed open coast. Defended and undefended floodplains coexist, whilst flood consequences and risks are not well understood, and sea-level rise is increasing flood risk [20]. The aims of this paper are to:
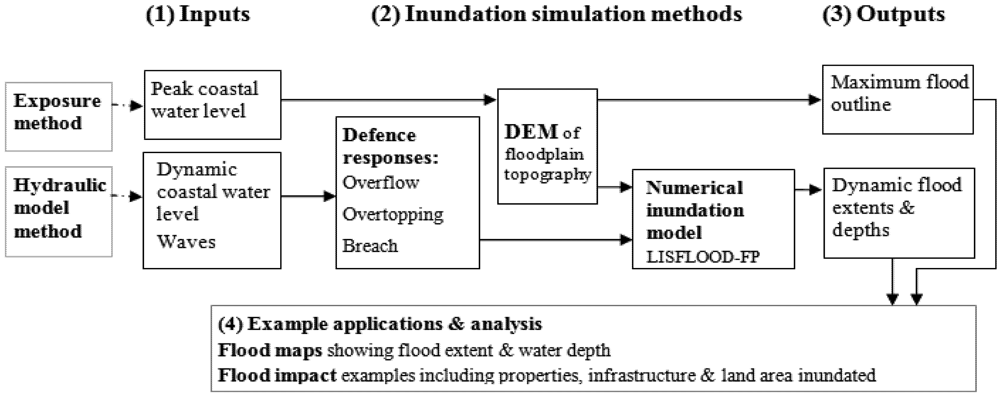
  • Describe a coastal flood modelling methodology, where flood simulations account for real flood defence characteristics and a full range of defence failure mechanisms (ranging from simple overflow or outflanking, through to full breaching).
  • Simulate synthetic coastal floods within the Solent, to indicate flood event impacts under present and 21st century sea levels across this range of failure mechanisms.
  • Compare the flood consequences for different failure mechanisms in these floods.
A background to the Solent will now be described, followed by description of the methodology, results, discussion and conclusions.

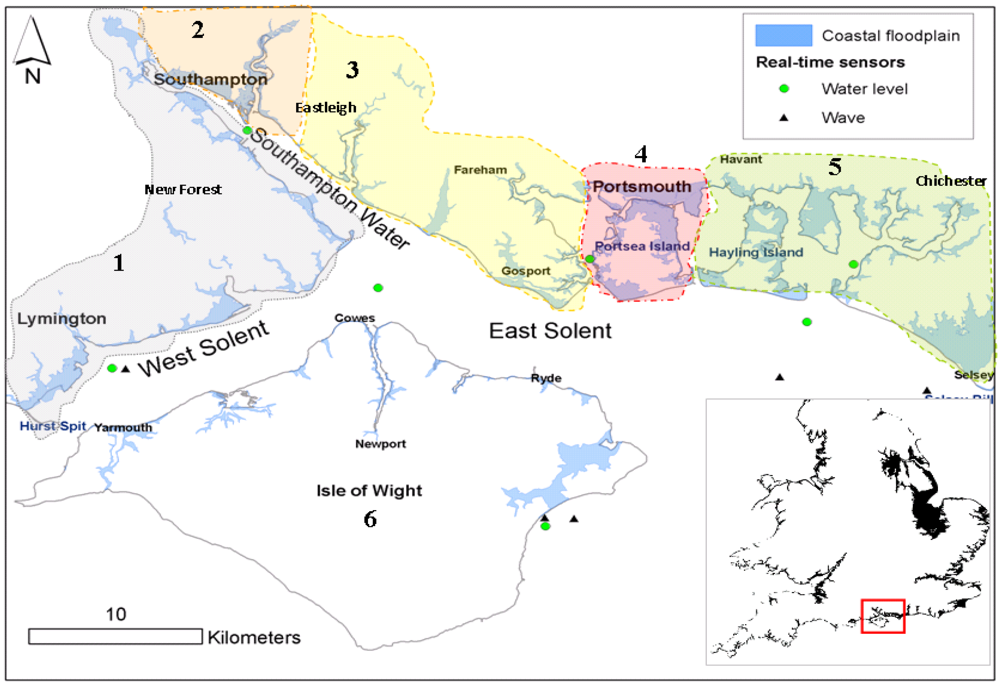
2. The Solent Case-Study Region and Initial Assessment of Coastal Flood Risk

The Solent case-study is within the Environment Agency’s Southeast Region. Alongside the South Downs, the Solent is a sub-region for which defences and flood warnings are managed; and contains two shoreline management plan (SMP) [29] areas (the mainland, and the Isle of Wight). SMP studies provide a framework for dealing with flooding and erosion by dividing sections of shoreline on the basis of coastal processes [30] and related defence systems. Figure 1 introduces the location of the Solent case study area, the areas broadly at risk of coastal flooding, and six ‘sub-regions’ for analysis described later in this paper.
Figure 1. The Solent case-study, locations of wave and water level recorders, and the approximate 1 in 1000 year coastal floodplain (refer to Section 3.2). The base map (lower right) is an Environment Agency 1 in 1000 year indicative coastal floodplain for England and Wales [31]. Sub-regions used to describe flood modelling results later in the paper are: (1). The New Forest; (2). The city of Southampton; (3). The boroughs of Eastleigh, Fareham and Gosport; (4). The city of Portsmouth; (5). The boroughs of Havant and Chichester; (6). The Isle of Wight.
Water 04 00430 g001
Much of the Solent is sheltered from south-westerly Atlantic waves by the Isle of Wight, and a managed shingle barrier at the western end known as Hurst Spit [32]. Storm surges in the Solent mainly occur as a result of low pressure systems that move from the Atlantic eastward over southern England [33] whilst smaller surges also occur as a result of large North Sea storm surge events transmitted into the English Channel through the Dover Strait [34]. Tidal residuals rarely exceed 1 m; with only a 0.33 m difference between a 1 in 10 and 1 in 1000 year water-level [35]. Coastal floods in the Solent during the 20th and early 21st centuries have been frequent but usually involving small water depths, and with no recorded loss of human life [36].
The form and extent of the estuary has largely been controlled by changes in sea level until progressive development and land reclamation began in the 18th century. This was most significant around Southampton Water and Portsmouth; the two cities having grown together to form an urban area containing over one million inhabitants. The tidal range increases from approximately 2 m at Hurst to 5 m at Selsey. The region is internationally renowned for its complex tides [37]. Double high waters occur and are particularly pronounced during large spring tides, and at mid-flood tide the tide is constant for about an hour (Figure 2). Meteorological induced sea level effects on the UK south coast are generally less severe than on the east and west coasts; although surge events [20,38] and Atlantic swells [39] have been associated with coastal flooding. A national assessment of flood risk [40] identified that the South coast would experience some of the largest increases in flood risk during the 21st century. It has been estimated that 24,138 properties in the Solent (excluding the Isle of Wight) are exposed to a 1 in 200 year coastal flood [41] with the largest concentration of risk in Portsmouth which contains more than 15,000 of these properties alone [41,42]. After London and Hull, Portsmouth may contain the greatest coastal flood risk for any city in the UK [43]. It is estimated that 25 percent of the city’s coastal defences provide less than a 1 in 200 year level of protection (the indicative standard of protection for urban coastal areas in England and Wales) [44].
Figure 2. Water level time-series; recorded at three locations across the Solent (refer to Figure 1) during a typical spring tide.
Water 04 00430 g002
Shown in Figure 2 are typical semi-diurnal lunar spring tidal cycles for three locations in the Solent. In Figure 3 are water levels recorded during a recent storm surge event. The Solent’s defences are frequently subjected to hydraulic action, which due to the double high tides can be prolonged during storms. This effect is most prevalent in the central and eastern area of the region. The double high-water is significant at Southampton (which has almost no coastal flood defences). Portsmouth contains floodplains that are situated much lower (relative to extreme water levels) than Southampton, although there are flood walls and/or beaches around the city. Defence design and floodplain characteristics are highly variable across the remainder of the region, as shown in this paper.
Figure 3. Water level time-series recorded during a storm surge event on the 10th March 2008.
Water 04 00430 g003

3. Methods

The modelling approach is summarised in Figure 4. Regional estimates of exposure to coastal flooding in the Solent were generated by combining planar water levels with a digital elevation model (DEM). This approximates coastal flood outlines and depths without considering defences or the dynamics of flooding. The second method simulates flooding more realistically by inclusion of hydraulic connectivity and mass conservancy; by coupling flood defence analysis and storm-tide water level time-series with a suitable numerical inundation model. Data layers were used to help prepare the model and view outputs, using geographical information systems (GIS). These included land-use maps, property datasets (containing commercial, residential, and unoccupied buildings), and aerial photography.
Figure 4. Method and model overview showing (1) inputs; (2) inundation simulation approaches; (3) outputs; and (4) example applications.
Water 04 00430 g004

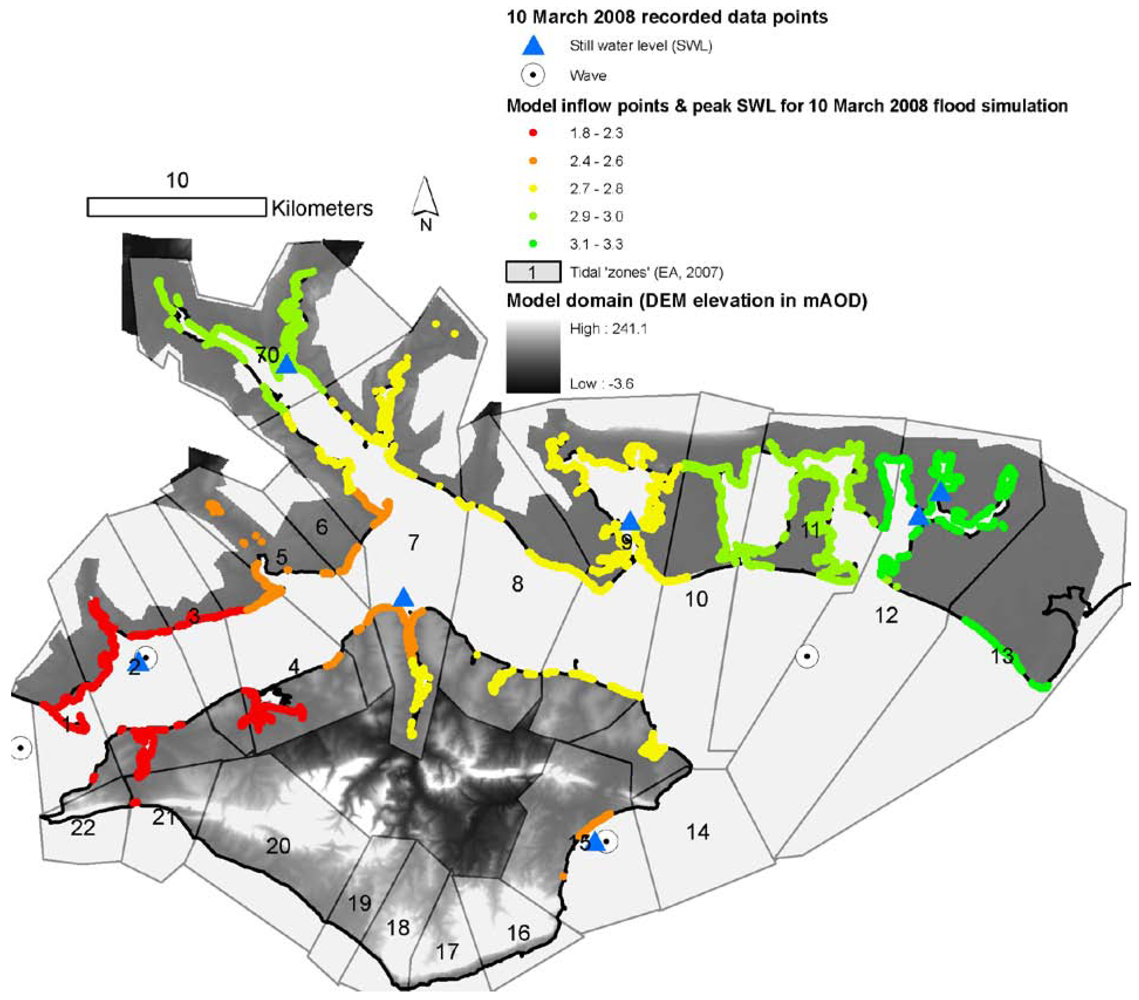
3.1. Regional Topography, Water Level and Defence Datasets

The DEM used for this work was mostly constructed from Light Detection and Ranging (LiDAR) surveys, processed in the format of a digital terrain model (DTM) (artefacts such as buildings removed). At the upper reaches of several tidal rivers the DTM was extended using a 10 m resolution topographic dataset derived from photogrammetry [45]. The LiDAR data was collected in 2007 and 2008 at 1 m and 2 m spatial resolution. Accompanying metadata indicates survey points are within ±0.15 m vertical accuracy [46], although an absolute error of ±0.30 m is often quoted [47,48]. For the hydraulic modelling method, shoreline flood defences were masked from the DEM, which was re-sampled from its original 1 m and 2 m resolution to 50 m cells; using a bilinear interpolation technique recommended for floodplain modelling [49,50]. This grid cell size allowed computational efficiency, and was commensurate with the available flood defence survey data (which was re-inserted onto the DEM). Large areas of the region comprise rural floodplain, and this resolution has been considered suitable in previous studies e.g., [51]; although benefits of finer floodplain grid cell sizes are acknowledged (Section 5.3).
Still water level return periods in the Solent have been periodically updated, and older methods for estimation of extreme still water level probabilities [52,53,54] are noted to significantly over-estimate return levels on the UK south coast [55]. For example, the 1 in 200 year water level definition shows variations of more than 0.1 m between those published in 2007 [56] and recent analysis of tide data at Southampton and Portsmouth [35]; one reason that quantification of property exposed to the 1 in 200 year flood in this work will vary in comparison to previous estimates mentioned in Section 2 of this paper. The latest available still water level return periods are from a national study which applied the Skew Surge Joint Probability Method around the UK coast [57] (e.g., Table 1). These latest levels were used in this work, and prescribed spatially to simulations of flood events by methods used for the Environment Agency’s flood zone mapping and a previous flood risk assessment in the Solent [44] (see Figure 5). In relation to Portsmouth this equates to extreme water levels that are approximately 0.8 m less at the western end of the region (Hurst) and to 0.5 more at the eastern extent (Selsey Bill).
Table 1. Return still water levels at Portsmouth in 2008 [57], mean high water springs, and the still water level recorded during a recent storm surge. The water level datum referred to (mAOD) is approximately mean sea level.
Return period (years)11020501002001000MHWS10th Match 2008
Elevation (mAOD)2.562.812.882.983.053.123.281.972.77
Regional sea-level rise in the past decade has been approximately 1.7 mm per year [58] hence the most recently derived return periods do not require significant adjustment.
Wave data was compiled from different sources, to enable wave loading scenarios to be combined with regional sea level extremes. Significant wave height return periods were available at measured sites (Figure 1) [59]; and fetch-limited conditions were calculated in all areas [60]. Records of the largest swell wave heights and periods that have occurred since records began [46] were also noted for exposed coastline east of Portsea Island.
Defence datasets describing condition and structural elements (such as roughness, berms, and crest heights) were available across the region. Information was also gained from the DEM, aerial photography, photos of defences, literature and site visits. Crest heights were mostly from real-time kinematic (RTK) GPS surveys with a vertical accuracy of ±0.03 m [46]. Recent condition grade scores (between 1 for excellent, and 5 for poor) were supplied by local authorities, allocated by coastal engineers to defences in England and Wales during routine inspections, and which can be mapped to defence performance under loading [61,62].
Figure 5. The computational domain and boundary still water levels for the 10th March 2008 regional flood simulation. For this example water levels at inflow points were spatially (linearly) interpolated between data recorders. For simulations of synthetic flood events (Section 4) the zones shown were used to allocate shared still water level characteristics to the model boundary (refer to Section 3.1). Water level time-series for the hydraulic modelling were based upon a Lymington storm-tide curve for zones 16; Southampton Water for zones 7 and 70; and Portsmouth for zones 715 (refer to Figure 3).
Water 04 00430 g005

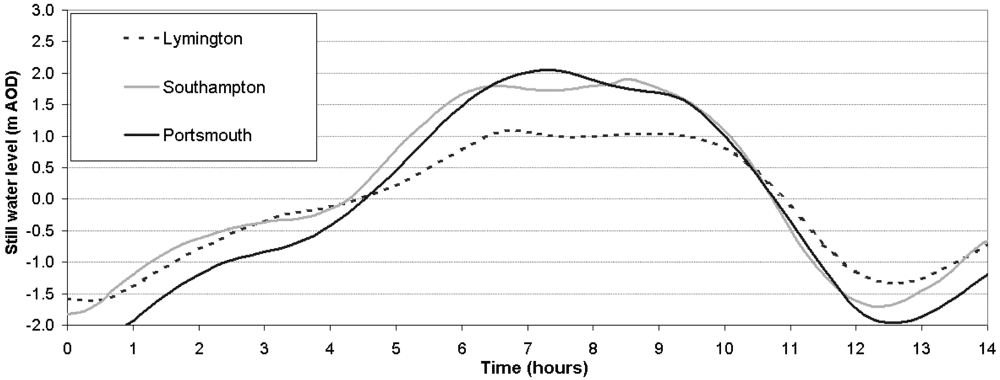
3.2. The Planar Water Level Method

Regionally uniform synthetic coastal events were modelled across a range covering normal tidal levels to extremes which included mid-range estimates of 21st century sea-level rise [63]. The planar water level method defined maximum flooding for given levels of still water (and allowance for 2 m wave run-up to define properties exposed to flooding on the open coast of Hayling Island). This identified 99 hydraulically discrete and independent flood ‘compartments’ covering 120 km2 of land. These compartments were separate on the basis of a 1 in 1000 year regional planar water level plus 0.3 m allowance for vertical data errors.

3.3. Hydraulic Modelling

Where inundation from defence failures was simulated, peak flow was calculated at the boundary of the model. This was spread to adjacent cells by solving of a continuity and momentum equation in each direction using the inertial version of the raster-based inundation model LISFLOOD-FP [64]. LISFLOOD-FP originated as a simple storage cell model solving an analytical approximation of the 2D shallow water equations [65,66]. Use of high spatial resolution and good quality topographic data has allowed similar results to full 2D codes (for sub-critical gradually varied flows only), and LISFLOOD-FP has been previously been used for modelling coastal floods [9,12,51,67].
At higher grid resolutions the requirement for small time-steps to allow stable and realistic simulations of flow [66,68] prompted incorporation of an inertial formulation of the two dimensional shallow water equations into LISFLOOD-FP, which has been noted to significantly increase computational efficiency [64,69]. Flow between neighbouring floodplain cells is calculated as in Equation (1):
Water 04 00430 i001
where q is the flow per unit width, hflow is the depth of water available to flow, ∆t is the model time step, ∆x is the model grid resolution, z is the bed elevation, h is the water depth, and n is the Manning’s friction coefficient. Water depths are updated using Equation (2):
Water 04 00430 i002
where Q is the discharge, hij is the depth of water in the cell (i,j). The stability criterion for this numerical model is given by the Courant–Freidrichs–Levy condition for shallow water flows such that the stable model time step, ∆t, is a function of the grid resolution, ∆x, and the maximum water depth, h, within the domain:
Water 04 00430 i003
where α varies between 0.2 and 0.7. The reader is referred to Bates et al. (2010) [64] for a fuller explanation of this model.
Importantly, when coupled to the defence response models this model is rapid enough for real-time regional simulations up to the peak water level, driven by applying water level time-series at the model boundary. Almost 5000 potential inflow locations were defined along 246 km of intertidal shoreline comprising point vectors with data attached (including defence crest height floodplain height at that location, and parameters for overtopping and breach analysis). These were placed in cells on the seaward edge of the 50 m resolution DEM, covering all flood compartments. A line of points was also placed in cells immediately inland of the defences for wave overtopping failures to be simulated. Water level time series at these locations were based upon tide-surge water level time-series (see Figure 3), adapted according to defence responses if necessary. Failure of defence systems is quite rare, although outflanking, overflow, overtopping and breach were considered.
Scope for calibration by varying surface friction values was limited by a lack of accurate flood observations, although boundary conditions (defence failure, waves, water level, etc.) dominated flood inundation modelling results. A uniform representative composite value of n = 0.035 was used, based on the range of surface roughness values found across the region. Some allowance was made for DEM error by excluding analysis of flooding in cells where water depths were less than 0.05 m [70]. As shown in Table 2, flood simulations over a relatively large area could be run quickly, even using a standard PC.
Table 2. Summary of the model scale and run-time (for a standard 2.5 GHz desktop PC).
ModelDomain sizeDEM resolution (m) and file size (MB)Number of inflow pointsTime-step (seconds)Run-time to simulate 14 hours of real-time flooding (minutes)
Km2columns, rows
Solent105.71227,846503.8749094.2–6.315
City of Portsmouth15.2150, 168500.015955.4–8<1

3.3.1. Overflow

Overflow failure is when the still water level exceeds the crest height of a defence (or of the land if there is no defence). For flood simulations comprising no waves an estimate of overflow during a flood event was calculated by applying still the storm-tide water level time-series to inflow points lying seaward of defences in the DEM. When wave conditions were included, the original peak still water level was routed through boundary cells, although with water level time-series adjusted for the duration that the still water level could theoretically exceed the defence crest height. The latter method is most relevant to shorelines where defence crests are at a similar elevation to the ground level of the surrounding floodplain; or where seepage, gaps, and alongshore variations in crest heights (for any 50 m defence section) may allow a greater inflow.

3.3.2. Overtopping

Flooding due to overtopping is when the combined effects of water levels and waves results in water entering a floodplain at a faster rate than it can drain away. This mode of failure can occur when the still water level is below the height of the defence crest or the floodplain. To generate boundary conditions for the inundation model, the mean overtopping discharge, percentage of overtopping waves, and run-up were calculated at stages of the tidally varying freeboard using empirical methods from the EurOtop Manual [71]. For sloping structures the formula used was that by Owen (1980) [72]; TAW (2002) [73] for beaches; and for vertical and composite sea walls more iterative formulae (to discriminate between pulsating, impulsive and broken wave conditions, according to the standard EurOtop guidance). A bathymetry model was constructed using nearshore sounding data [46] to approximate the regionally variable effects of wave shoaling upon significant wave heights. The duration of overtopping events was delineated by time intervals where mean overtopping rates or run-up exceeded the known capacity of defences. If for any inflow point an overtopping event was simulated; the onset and termination of floodplain discharge was defined by exceedance of the run-up two percent value (at sloping defences) or a mean overtopping volume discharge of greater than 20 l/s/m. When defence crest freeboard was negative and the floodplains below still water level; the still water level time series was simply routed through the failed boundary cell (although restricted to the calculated overtopping duration). For most floodplains the peak (or equilibrium) water level in the overtopped boundary cell was limited to the seaward still water level. This limit was higher for floodplains above still water levels, based upon prior analysis of run-up and overtopping volumes in the relevant flood compartments. The results in this paper assumed a peak significant wave height (Hs) and mean period (Tm) to occur for the duration of an overtopping event; although this could be adjusted to account for more dynamic conditions if required. At each inflow location this was converted to a vertical change in water level expected to occur in the lee of defences during a single tidal cycle; and added to the DEM floodplain level in the boundary cell, forming the peak level in a modified time series of water levels.
Analysis of overflow and overtopping was applied to over 224 km of the region’s shoreline, including beaches, embankments and vertical sea walls. It was found that approximately 116 km of these defences rise far enough above the floodplain (whilst preventing seawater from reaching hinterland) for breaching to be relevant.

3.3.3. Breach Analysis

Breaching, although rare, is considered because this type of defence failure is recognised to greatly increase the consequences of a flood event, especially for large flood plains [19]. Analysis was allocated to defences where breaching is relevant, allowing for the identification of possible regional ‘weak spots’ and information for the modeller to route water through boundary cells if chosen. A simplified reliability analysis generated fragility curves for three selected failure modes. This was facilitated by software developed under FLOODsite Task 7 [74], which enables a Level III reliability approach (i.e., Monte-Carlo simulation), (see [27] for a more thorough description). Three breach failure mechanisms were selected from a much wider inventory [75]. These were: (1) analysis of damage initiated by overflow and/or overtopping [76]; (2) failure caused by water internally eroding defences (piping) [77]; and (3) critical erosion of shingle beaches in response to wave and water level loadings [78]. The former two failure mechanisms were analysed using condition grade scores and structural descriptors to imply defence strength and stability [79]. Topographic profile surveys were used for analysis of shingle beaches (which are important natural and managed defences in many areas of the Solent). Methods exist to calculate progression of breaching, and subsequent release of water onto the floodplain but any deterministic prediction remains highly uncertain [80,81]. Hence the modelling results in this paper take a simplified approach with breaches assumed to be broken down to floodplain level and water flowing through for the entire tidal cycle. Section 3.4.2 (this paper) describes inundation simulations where specific breach locations were approximated for a validation case study; whereas results in Section 4 describe flood simulations where breaching scenarios consider all shoreline defences to have been removed (and wave height reduction coefficients removed where foreshore usually alleviates overtopping). This allowed a simplified comparison with overtopping scenarios, and a more realistic worst-case scenario than the planar-water level results. There is some discussion of breach probabilities during an extreme flood event simulation in Section 4.2.

3.4. Model Validation

A model is said to be validated if its accuracy and predictive capability in the validation period have been proven to lie within acceptable limits or errors for a particular purpose [68]. However, for many coastal areas information to validate inundation models is not available. Flood simulations were compared with observations gained from two actual floods: (1) a regional event on 10th March 2008, which comprised widespread although mostly minor flooding across the Solent; and (2) an event in December 1989 where inundation resulted from overtopping and sea wall breaching between Hurst Spit and Lymington.

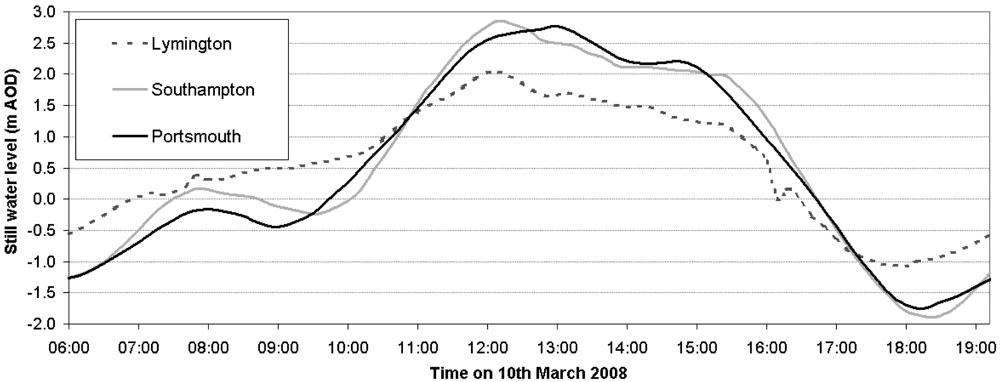
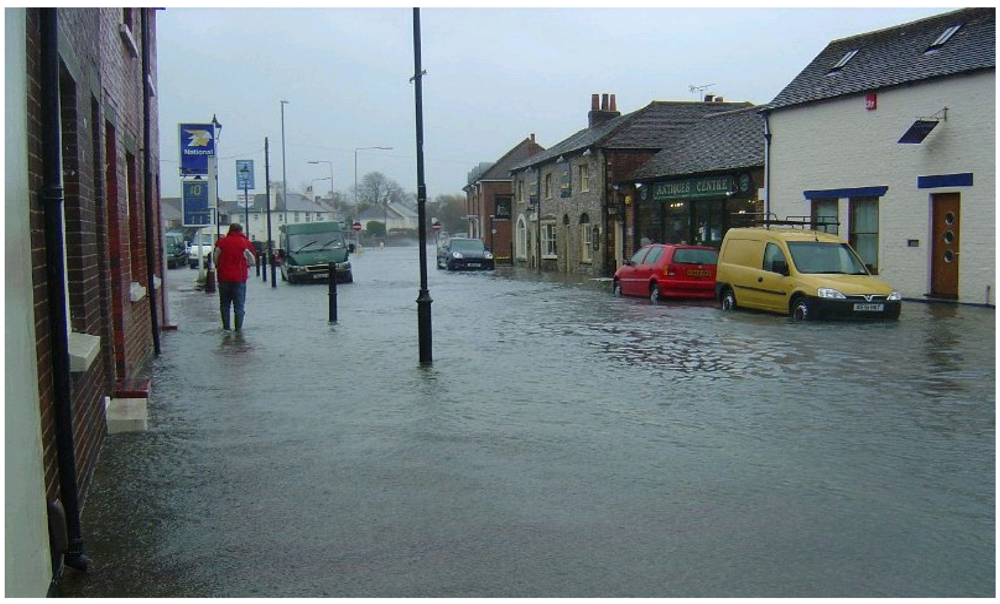
3.4.1. 10th March 2008 Regional Flood Event

On the 10th March 2008 an approximately 1 m storm surge and large waves resulted in widespread flooding across the Solent and other coastal areas in the English Channel [82]. The region’s cities escaped major inundation, although an example of a near miss in Southampton is shown in Figure 6. Observed flood extents were in the range 0.01–0.03 km2 with peak flood water depths mostly less than 1 m. An exception was more severe flooding in eastern extent of the region at Selsey (located at the largest and most easterly floodplain shown in Figure 1), where the only known breach of defences occurred in the region that day due to waves flattening an 800 m section of shingle barrier beach [83]. At the time, the peak still water levels were approximated as a 1 in 20 year extreme at Portsmouth and a 1 in 50 year event at Southampton [20]. Waves and water level observations from the event were available from real-time data recorders used for regional coastal monitoring (Figure 1) and information collated by the Environment Agency [84]. These were spatially interpolated between recording stations and applied to the model boundaries (Figure 5). Outputs were compared with observed flooding in GIS. Observations were interpreted from photos, descriptions and reports, e.g., [84] and close examination of a high resolution version of the floodplain DEM which enabled flood extents and depths to be (approximately) verified and reconstructed.
Previous coastal flood modelling studies [9,11] have compared modelled and observed coastal flood extents using a fit measure (FA) which comprises the intersection and union of predicted (Ep) and observed (E0) flooded pixels. A value of zero corresponds to no agreement, a value of 1 to perfect agreement:
Water 04 00430 i004
Figure 6. High water at Southampton docks on 10th March 2008 [85].
Water 04 00430 g006
For each measurement of FA it was noted whether the model under or over-predicted flooding. Over-prediction or under-prediction by the model was considered negligible unless more than one full flooded cell lay outside of the observed extent. Hence in the case of a good model fit (FA > 0.75) not all values qualified as over or under-predictions. Limitations to this exercise are acknowledged; such as the use of simplified boundary inputs, the relatively large pixel size (50 m) of the model, uncertainty in the timing of the observed flood data, and interference from other flood sources (during the real event). Flood depth was also noted, using photos and the DEM. The uncertainties from this method meant that if the modelled flood depth was within 30 cm of the observed depth (at any location), this was regarded as acceptable. The results of this exercise are summarised in Table 3.
Table 3. Summary of the 10th March 2008 model validation.
Test typeCriteriaResult
Detection of observed floodsThe model indicated flooding at 29 out of 30 locations where floods were reported (the location missed was on a tidal river where additional sources of floodwater may have occurred). At 27 locations, some description of flooding was available to allow comparison with the model; which is summarised below.
Flood extent fit scores Mean FA value (for the 27 compared locations) over-predictionsunder-predictionsneither definitive over or under-prediction0.656813
Number of locations with a good fit (FA > 0.75)
   2 were slight over-predictions, 1 was a slight under-prediction
Number of locations with a moderate fit (FA = 0.50 to 0.75)
   2 over-predictions, 3 under-predictions
Number of locations with a poor fit (FA < 0. 50)
   2 were over-predictions, 4 were under-predictions
12

7

8
Flood depthAll modelled depths were within 30 cm of observed flood depths.
The mean FA value was reduced considerably by over-prediction of flood extent at two small urban floodplains, where the FA values were 0.10 and 0.32. The former of these values was at a location where waves overtopped a shingle beach at the southeast corner of Hayling Island, the latter was overtopping of sea walls at Old Portsmouth (on the southwest corner of Portsea Island). These over-predicted floods comprised water depths of less than 20 cm. It is possible that these were reasonable predictions of overtopped volumes although in reality ponding of overtopped water may be lessened by floodplain drainage and the presence of surface features such as buildings (neither of which were included in the model). Reducing wave shoaling coefficients in the overtopping model (from approximately 0.75 to 0.60) improved these predictions; although the original values were retained for further modelling on the assumption that drainage may be limited in extreme events whilst shoaling may be expected to change with foreshore and nearshore sediment dynamics during storms. Furthermore, these variables are likely to be negligible in comparison to significant defence failures.
Specific locations of the properties affected by this event were not available, although a post-event report [84] suggested that 30 properties in the region were flooded. Viewing photographs taken at 24 of the flooded locations suggested that at least 120 buildings could actually have been in contact with flood waters (see Figure 7). There is uncertainty over how thoroughly floods were reported, whilst these numbers exclude flooding and evacuation of a holiday park at Selsey [86]. The modelled flood outline of this event contained more than 2000 properties, more than half of these accounted for within the shallow flooded cells in the aforementioned over-predicted flood extent on southeast Hayling Island. Filtering these results by the number of properties in grid cells with flood water deeper than 1 m decreased this estimate of inundated properties to 162; and to only 38 with water deeper than 1.5 m. It is probable that flood waters threatened many more properties than reported, but walls, fences, raised floor levels, and flood prevention measures such as sandbagging prevented significant flooding to interiors of buildings.
Figure 7. Flood waters surround properties in Emsworth, Borough of Havant near high water on 10th March 2008, [87].
Water 04 00430 g007

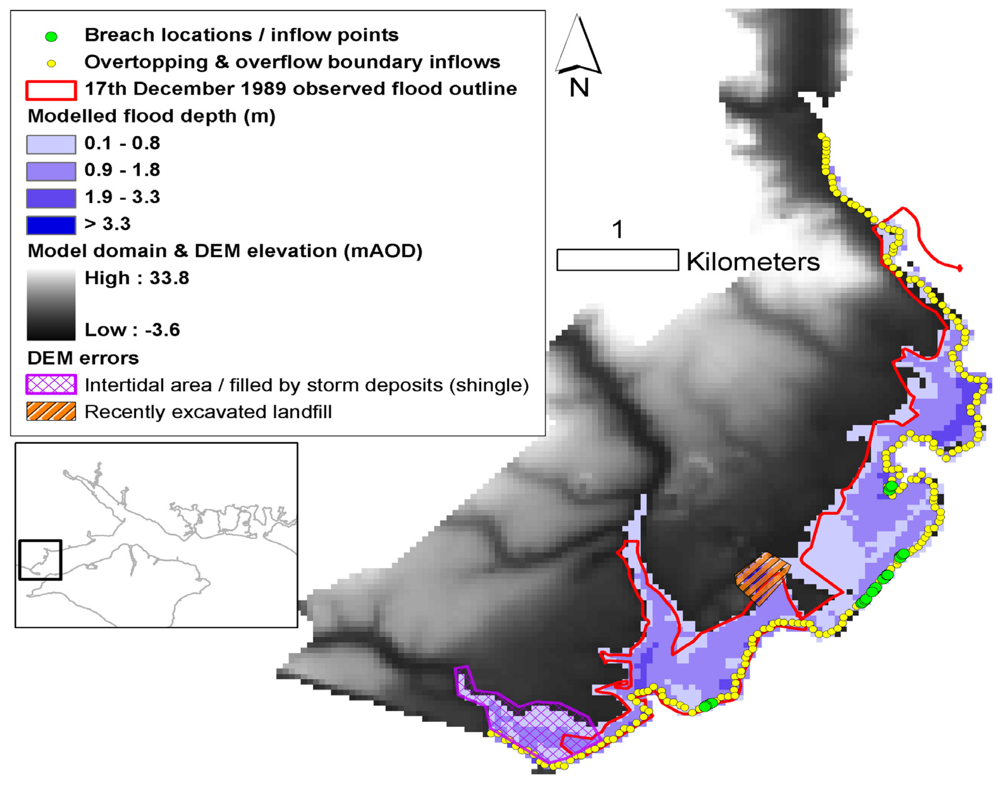
3.4.2. 17th December 1989 Flood Event (Breach Failure)

A historic flood was used to evaluate the model’s ability to simulate larger floods resulting from significant defence breaching. Such an event occurred on the 17th December 1989 at a mostly rural flood compartment between Hurst Spit and the town of Lymington, on the west Solent. Rapid onset and widespread coastal flooding resulted in environmental damage and severe inundation of 10 properties in the rural area of the floodplain; with overtopping also affecting 50 properties in Lymington [88]. Measurements of wind speed, peak water level, breach locations, and defence heights are available for the event [88] and were used to model flooding over a single tidal cycle. Variations of boundary inputs were used to run several flood simulations, and these were compared to observed flood extents producing FA values between 0.7 and 0.8. However, these FA values do not take into account the two notable discrepancies between the present day DEM and the reported flooding of December 1989 (as noted in Figure 8). The landfill area is dynamic and flooding cannot be assessed, while in the vicinity of Milford on Sea, the breaching of Hurst Spit may have sealed a channel, protecting Milford-on-Sea from flooding. It is possible that other areas of the floodplain surface may also have altered between the time of the event and collection of the recent LiDAR data; although the old defence data (which is less detailed than the present-day dataset), nature of breaching, and wave data provides greater uncertainty to the model inputs for this validation exercise. As with the 10th March 2008 validation case-study, filtering properties within grid cells of certain depths provided a closer comparison with reported flooding. Counting only properties where modelled flood water depths exceeded 0.5 m indicated 104 properties to be inundated; depths of greater than 1 m indicated 47 properties to be flooded (60 properties were reported to have actually experienced flood damage [88]).
Figure 8. The 17th December 1989 flood simulation and observed flood outline. A boundary water level of 2.1 mAOD recorded at Lymington [88] was applied across the entire site for this simulation. This may be a relevant approximation since the breach of Hurst Spit that day e.g., [89] would be likely to have altered local hydrodynamics [90,91] (whereas present-day event flood simulations assume Hurst Spit stays in place, and that tidal range/extreme water levels increase eastwards across the site). Over-washed material from the storm may also have blocked the intertidal area shown (at Milford on Sea) complicating comparison between the observed and modelled floods.
Water 04 00430 g008
The fragility curve methodology and recent defence data was partly verified by this event. Information that indicated the condition and height of the sea wall in 1989 [88] produced breach failure probabilities ranging between 0.8–1.00 when subjected to the 17th December 1989 loadings (i.e., the reliability analysis indicating definitive exceedance of the limit state for several sections). The same loadings applied to the present-day sea wall data indicated both minimal inundation from overtopping, and no definitive defence section failures, although breach probabilities were between 0.6 and 0.9 for some sections. This site did not flood on the 10th March 2008, even though the water levels exceeded those of the 17th December 1989.

4. Results

Performance measures verified that the main components of the model (DEM, defence data, etc) are sufficiently accurate for modelling hypothetical coastal flood events. This section firstly focuses upon simulation of a 1 in 200 year regional coastal still water level flood (indicative of the standard of protection for urban coastal defences in England and Wales and definition of Environment Agency flood zone maps). Secondly, inundation across a range of coastal flood simulations is described. This indicates model sensitivity and uncertainty related to boundary water levels, and provides a regional overview of potential flood event impacts at present and higher sea levels. In this paper, the inundation simulations driven by defence failures are in a deterministic form, rather than comprising a sampling-based flood system analysis e.g., [26]. Inundation scenarios modelled for each still water level include: (a) the planar water level flood outline; (b) a worst-case hydraulically modelled flood that includes breach of all defences; and (c) three categories of wave loading simulated with the hydraulic model although without breaching (these include no waves, an annual extreme, and the maximum possible wave conditions) hence accounting for overflow, overtopping and outflanking failures only (for one tidal cycle). The still water levels (and definition of flood event extremity) applied to the model boundaries were based upon the extreme water level analysis described in section 3.1 and Figure 5. The water level time-series applied to the inflow points simply comprised shifting storm-tide curves (Figure 3) to the relevant peak still water level.

4.1. Simulation of an Extreme Present-Day Flood Event

Table 4 summarises the results of a 1 in 200 year water level flood. As expected e.g., [9], hydraulic modelling (even with extreme wave overtopping and breach scenarios) estimated less flooding than calculated by the planar water level method. The flood simulation using an annual wave extreme suggests that more than 10,000 properties could be impacted by this water level event. The model validation case studies indicated that waters exceeding 1 m depth could be a more useful indicator of the number of buildings that experience flooded interiors. This criterion suggests that for the synthetically modelled floods, increasing wave loadings from the annual to maximum extreme (and with no breaching) almost doubles the number of properties that would be significantly inundated. Inclusion of breaching (of all the region’s defences) in the hydraulic flood simulation method almost trebles the effects from waves alone (for the count of properties inundated to greater than 1 m depth).
Table 4. Modelling results for a 1 in 200 year water level coastal flood in the Solent (refer to Figure 1 for locations).
REGION (see Figure 1)LocationExposure (numbers in brackets is land area inundated to >1m depth)Properties flooded by hydraulic simulations
Total (number in brackets are properties inundated to >1 m depth)
Floodplain area (km2)PropertiesBreach of all defences and max. wavesMax. waves1 in 1 yr wavesNo waves
1New Forest14.1
(6.6)
736
(134)
639
(147)
591
(112)
430
(55)
329
(34)
2 City of Southampton2.0
(0.1)
2,148
(249)
978
(21)
973
(21)
919
(21)
715
(10)
3Eastleigh, Fareham & Gosport7.2
(2.4)
1,789
(106)
1,395
(109)
1,321
(93)
1,163
(91)
564
(52)
4City of Portsmouth13.8
(4.9)
14,055
(3,483)
10,922
(2,734)
6,437
(459)
4,660
(110)
1,923
(8)
5Havant & Chichester29.8
(13.2)
3,781
(1,657)
3,168
(613)
2,995
(448)
2,602
(329)
1,033
(90)
6Isle of Wight (all)11.4
(5.6)
617
(155)
505
(114)
377
(67)
354
(67)
255
(25)
TotalSolent78.3
(32.8)
23,126
(5,784)
17,607
(3,728)
12,694
(1,200)
10,128
(673)
4,816
(219)
In the city of Portsmouth, a substantial amount of the region’s property is threatened by flooding under all loading scenarios. However the city’s flood defences greatly reduce the number of properties exposed to more than 1 m flood depth; and the extreme wave and overtopping and breaching scenarios are required to significantly increase the count of buildings likely to be severely flooded. The reliability analysis indicated that loads associated with the 1in 200 water level (combined with waves) would generate low probabilities of breach for most of the city’s defence structures. The probability of failure from the fragility curves was less than 20 percent for defences protecting two of the largest clusters of property in the central south and mainland areas, although failure probabilities are higher for sea walls on the east coast of Portsea Island. In the city of Southampton the added effect of waves with still water level expands the flooded area significantly, despite the fetch-limited nature of the shoreline. However, only 21 properties in the city are inundated to greater than 1 m depth. Hence, at present sea level Southampton is likely to be subject to disruptive impacts from coastal flooding, rather than significant risk to life and property.
Note that 531 properties were flooded to greater than 2 m depth in the case of an extreme breaching scenario (and approximately 130 for maximum and annual wave scenarios). The majority of these are in Portsmouth (311 properties) under the breach scenario; whilst most are in Chichester and Havant (102 properties) when applying only the maximum waves scenario (to generate extreme overtopping-dominated defence failures). There are also substantial areas of floodplain where flood depths are between 1 m and 2 m, which can be particularly dangerous when floodwaters are fast moving [92]. The extraction of this information from the model indicates pockets of particularly high damage potential and risk to life. Inclusion of widespread breaching is shown to increase regional flooding impacts substantially (Table 4), although only a relatively small length of coastline actually appears at high risk of this kind of failure. Locations with the highest probability of breaching are mostly in rural areas on tidal rivers and in the harbours. Simulating inundation through defence sections for which the failure probability exceeded 90 percent (along approximately 35 km of defence line) is not shown here, although generated a similar inundation extent to that of the extreme wave overtopping scenario. Slightly greater floodplain water depths resulted from inclusion of these breaches, although many of these defences are likely to have already significantly overtopped prior to breaching. Such failures would inevitably increase the consequences of a flood event, although the overall impacts would be dependent upon factors such the timing of breach initiation and growth, and repair measures.

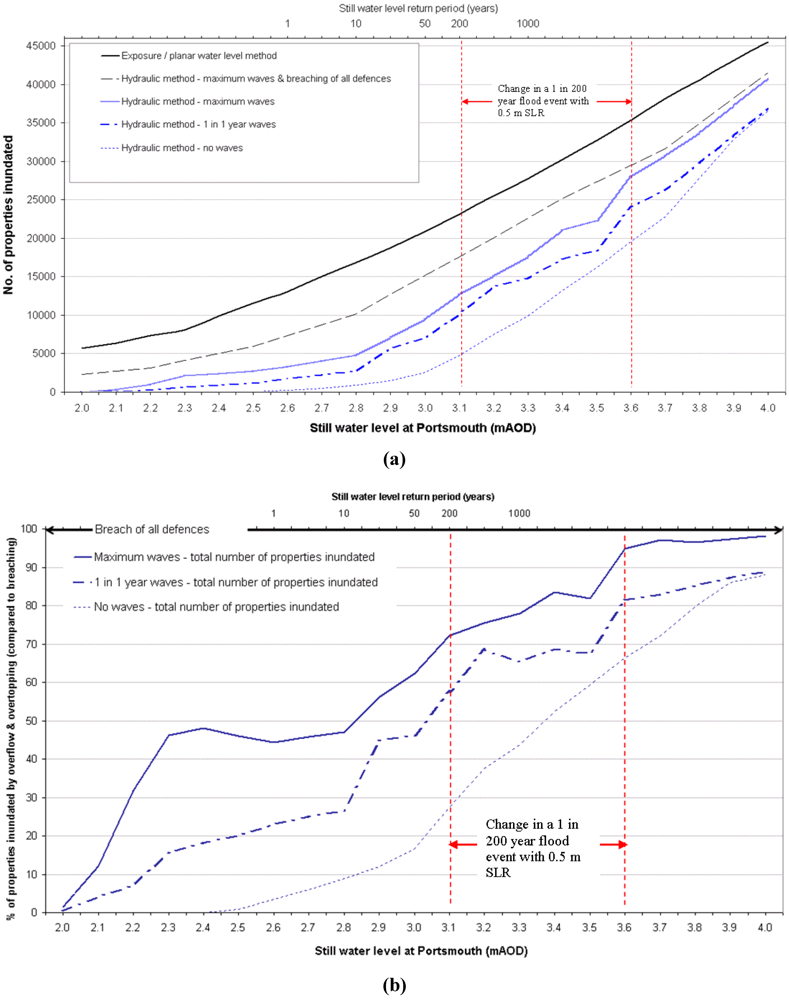
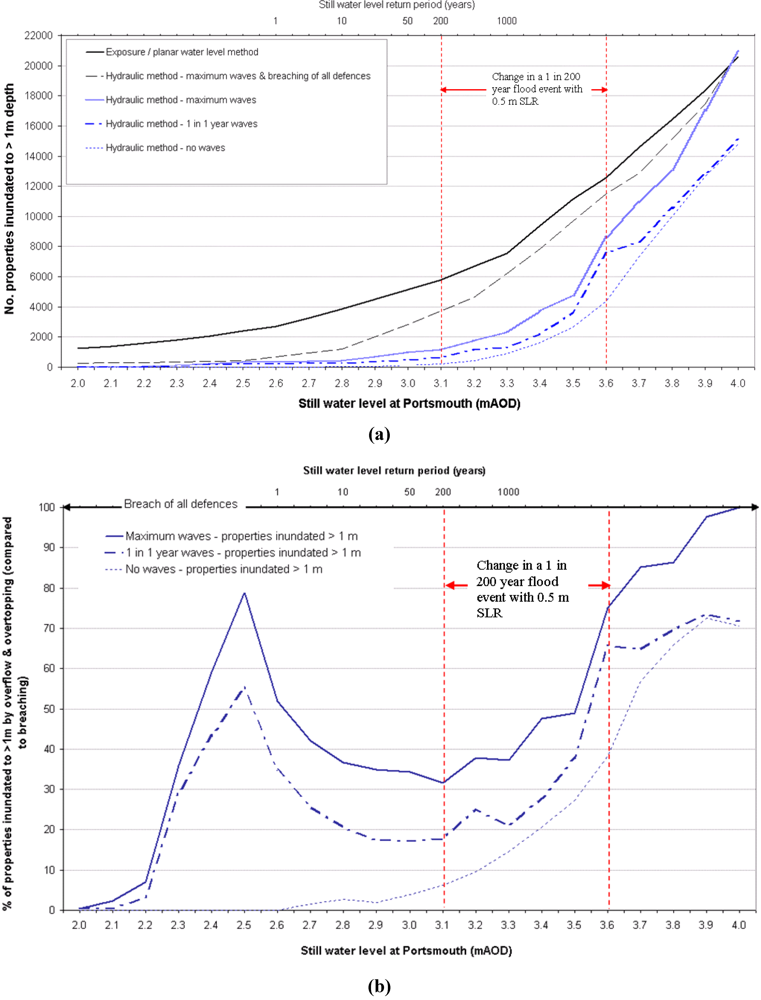
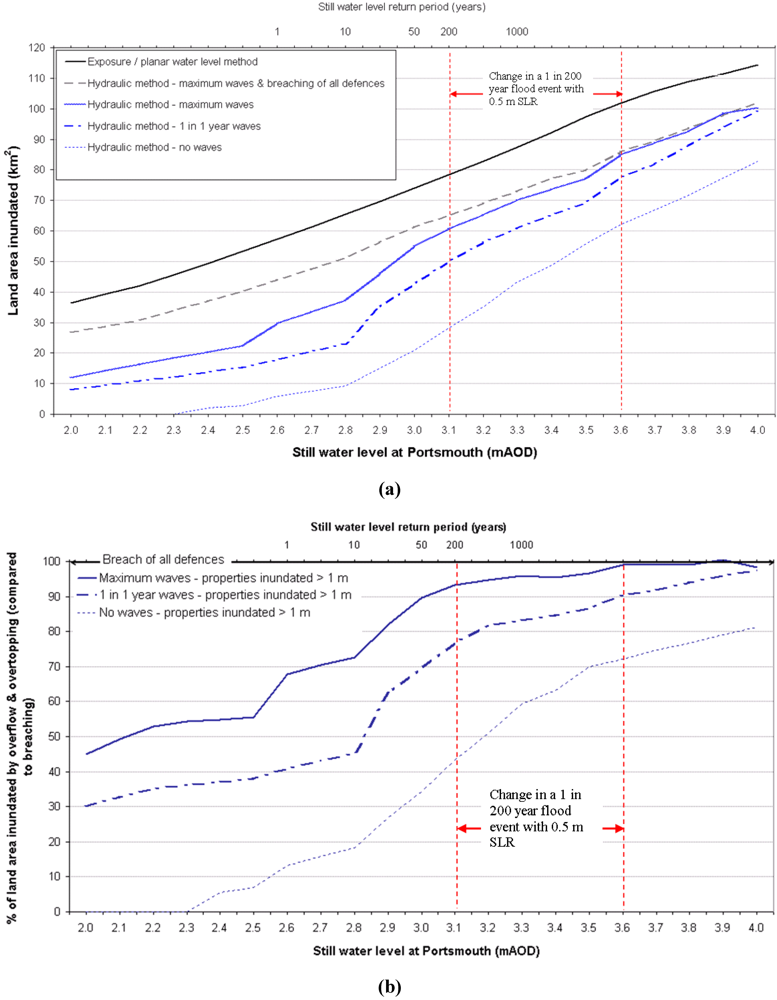
4.2. Coastal Flood Simulations Across a Range of Loadings

Flood simulation results across a range of still water level are shown in Figure 9a, Figure 10a and Figure 11a (all flood simulations assumed the present defences). Also shown for each measure of inundation, is the proportion of flooding caused by non-breach defence failures in comparison to inundation simulations where all defences were removed (Figure 9b, Figure 10b and Figure 11b). These results indicate that substantial land areas and numbers of property are threatened with flooding from frequently occurring water levels, with defences playing a crucial role in the magnitude of these consequences. The number of properties in the modelled flood outlines increases steadily with increasing boundary water levels. The difference in the total number of flooded properties and land area when comparing the hydraulically simulated floods and the planar water level (exposure) floodplain indicates that much of the wider floodplain may not be hydraulically well-connected over a single tidal cycle. At the same time, the effects of overtopping can be significant and these results show that such floods can almost match the planar water level estimates for properties flooded to greater than 1 m depth (Figure 10a). These results show that for some individual flood compartments the number of properties inundated by the non-breach defence failure mechanisms increases most distinctly within the (approximately) 10 cm band of water levels either side of the 1 in 200 year extreme (because the protective capacity of many coastal defences is exceeded in this range of loadings). Using the 1 m depth criteria shows that for the Solent as a whole, there a particularly large increase in the count of flooded properties beyond the 1 in 200 year still water level.
Figure 9b and Figure 11b show a general increase (in response to increasing still water levels) in the percentage of inundation that arises from overflow/overtopping failures in relation to breach. This is expected as defences become increasingly overwhelmed beyond their protective capacity due to rising still water level boundary conditions allowing larger and prolonged discharges during flood events. However, for the 1 m depth criteria (Figure 10b) the potential for breach to exert the greatest flood damages across the Solent is most apparent for small water levels (where breach is unlikely and significant overtopping not possible), and a wide range of present-day extremes. Beyond present-day still water level extremes, the gap between breaching and overtopping impacts is greatly diminished.
Figure 9. (a) Raw inundation modelling results for properties within modelled coastal flood outlines across the Solent–water level return period refers to annual probability of that water level for 2011; (b) Percentage of properties inundated by overflow and overtopping defence failures (compared to breach of all defences).
Water 04 00430 g009
Figure 10. (a) The number of properties in the Solent inundated to a water depth of greater than 1 m; (b) Percentage of properties inundated to greater than 1 m water depth by overflow and overtopping defence failures (compared to breach of all defences).
Water 04 00430 g010
Figure 11. (a) Coastal flood modelling results across the Solent by land area; (b) Percentage of land area inundated by overflow and overtopping defence failures (compared to breach of all defences).
Water 04 00430 g011
UKCP09 [63] global mean sea level projections derived from the IPCC Fourth Assessment Report [93] give an estimated range (5th to 95th percentile) for sea level increase of 18–59 cm between present day (assuming a 1980–1999 baseline) and 2090–2099. For simplicity the effects of a medium UKC09 scenario (of approximately 0.5 m sea-level rise) upon a 1 in 200 year water level flood event are shown in Figure 9, Figure 10, Figure 11. This approximated scenario of 21st century sea-level rise substantially increases the amount of property affected by at an extreme water level coastal flood event in the Solent. For example, in the case of a 1 in 200 year water level flood combined with an annual wave extreme, the total number of buildings in the regionally modelled flood outline increases from 10,128 to almost 24,000 (approximately 140 percent change), although there is a more dramatic 600 percent increase if considering >1 m floods and probably provides a better indication of actual impacts assuming no adaptation (Figure 10a). Even without the effects of waves, a 1 in 200 year flood event in addition to 0.5 m sea-level rise (and no defence improvements) allows nearly 4400 properties to be inundated to greater than 1 m depth.

5. Discussion

5.1. Application of the Methodology

The case study results illustrate how the described methodologies provide a regional overview of the impacts of coastal flood events; and also allow a comparison between the consequences of different types of defence failure. In the region of interest, overtopping is more important than in many previously investigated sites, such as eastern England. This shows that investigating flooding across a range of defence failure mechanisms provides useful insights.
Estimates of coastal flood exposure by the planar water level method were subject to substantial uncertainty, stemming from vertical accuracy of the DEM, compilation of property datasets, and definition of what comprised inundation (i.e., whether the interior or garden of the property is affected). Based upon ±0.15 m variation in the vertical LiDAR accuracy, the regional exposure estimate (generated by the count of buildings in the flood outline) could vary upwards by more than 30 percent, and downwards by approximately 10 percent. The reason for this asymmetry in uncertainty was because the modelled flood outline could be used to select point vectors representing property locations. The upper absolute exposure estimate was different because it also comprised adding a 20 m buffer (an approximation for the spatial footprint of properties within the dataset). Similar principles are applicable to the hydraulic modelling outputs, although accounting for defence failures, mass conservancy and hydraulic connectivity of flood spreading outweigh this effect.
The hydraulic modelling method performed well, using high quality defence and floodplain data that exists in the Solent. The greatest uncertainties in boundary condition processes and resultant inundation was for wave overtopping onto floodplains that are above the peak still water level. In these situations the irregular nature of waves transmitted over a structure and interactions with drainage may be particularly complex to model in a simplified way. The flood modelling method was computationally fast and differentiated from many existing regional approaches by the high level of spatial detail in schematisation of defences and floodplain, with wave overtopping and outflanking flood mechanisms included in all inundation simulations.

5.2. Flood Impacts in the Solent

The 1 in 200 year flood simulation demonstrates how the impacts of an extreme present day flood event could be significantly greater than impacts seen on the 10th March 2008. Under equivalent wave loadings, the approximately 30 cm increase in the boundary water levels quadruples the amount of property likely to be affected by inundation (which would increase further with larger waves). The effect of more severe and widespread defence failures (than those seen on the 10th March 2008) would also involve more prolonged , widespread and faster flowing floodplain water; with the 1 in 200 year water level potentially causing sea water to inundate between 30–65 km2 land. Flood simulations identified significant flooding in populated areas outside of the building dataset; notably at the largest holiday park in the region at Selsey which can accommodate up to 12,500 people. Areas of this site were inundated to depths between 1–2 m in both the annual and extreme overtopping scenarios for the 1 in 200 year simulations. Statistics for people per property and occupancy rates from the 2001 UK Census suggest that on average at least two people may occupy each building in the dataset; hence the population impacted by the large flood events in the region is likely to be substantial and will grow significantly with 21st century sea-level rise (although the defences at Selsey are currently being upgraded). Without changes to defences there is a large increase in the amount of property threatened by flooding when applying the 0.5 m sea-level rise example. Hydraulic modelling of the worst possible 1 in 200 year coastal flood at present-day sea level suggested that approximately 500 properties lay in areas where flood waters may reach 2 m or deeper; this number trebling with the 0.5 m sea-level rise example. Without breach (at present day sea levels) this is far less, although with 0.5 m sea-level rise this level of flooding occurs when a 1 in 200 year event combines with only an annual extremity of wave scenario (without breach failures included). Due to this, and the increasing impacts of overflow and overtopping failures with sea-level rise (shown in Figure 9b, Figure 10b and Figure 11b) the importance of future defence improvements is apparent, or a significant increase in flood consequences is inevitable.
Of the ninety-nine flood compartments in the Solent (Section 3.2), twelve are (at present day sea levels) likely to experience significantly greater flood event impacts due to breaching failures (in comparison to severe overtopping events). These compartments are quite large, and account for 40 percent of the land area that is at risk of flooding in the Solent. However, it is apparent that other failure mechanisms are currently significant to flood impacts of both frequently occurring and extreme events in this region.

5.3. Directions for Further Research

This methodology would be complimented if used alongside more spatially descriptive data of regional coastal flood sources, and receptors. The former would be possible by applying nearshore hydrodynamic modelling and the latter by supplementing existing datasets with spatial distributions of population, vulnerability and key infrastructure. The defence and floodplain datasets in the region could be used for higher resolution modelling. Inundation modelling using a coarsened, interpolated DEM has been observed in other studies to overestimate flood extent and underestimate flood depth [49], and modelling of urban inundation benefits significantly from finer discretisation of space [49,70]. This may only be feasible or offer significant benefits at some locations in the region; the most obvious choices being the region’s two cities (Portsmouth and Southampton), and low-lying flood compartments where breaching is a threat.
The fast run-time of the regional model and easy integration with GIS could have other applications. For example, within operational real-time coastal flood forecasting systems [94] the modelling of flood pathways (defence failures and inundation mapping) could be better integrated to benefit real-time flood management [31,95,96,97], e.g., by enabling more efficient and strategic flood warning dissemination, improved visual information (to communicate flood event outcomes), and more quantitative appraisal of warning system performance.
The development of practical methods for the application of wave overtopping to the boundaries of coastal inundation models is an important area of future research, for which limited guidance is currently available. Uncertainty analysis is also recognised as crucial to numerical modelling studies [98] and could be more formally integrated for a more comprehensive analysis of present and future flood impacts e.g., [51]. Better calibration is recommended; with compilation of flood data when available to improve models and their interpretation. The 10th March 2008 data (Section 3.4.1) indicated lack of damage to property to flooding below certain water depths, although this also demonstrated the difficulty of using counts of flooded properties to validate models. However, this information probably helped to generate a more realistic interpretation of flood impacts from the synthetic flood event simulations.

6. Conclusions

A method for regional analysis of coastal flooding has been demonstrated, using the Solent, UK as a case study. It integrates a number of existing approaches for modelling defence response and floodplain inundation. This allowed individual, synthetic and real, coastal flood events to be simulated, providing a simple evaluation of regional coastal flood impacts. By modelling across different water levels, an overview of the uncertainty relating to boundary condition variations is available. This also showed how overtopping and overflow mechanisms contribute a large present day flood threat across the Solent. Breaching has the potential to generate significant impacts across a range of present day still water levels; although across the range of still water levels expected with 21st century sea-level rise the effects of overflow and overtopping are similar to the effects of broad-scale breaching.
This research offers benefits for the understanding of coastal flooding in a region that has undergone less analysis than the east and west coasts of the UK. This research was also produced in recognition that there is an increasing need to establish methods which improve the understanding of coastal flood events. The run-time for flood event simulations is rapid, allowing multiple uses; such as (1) flood warning; (2) defence prioritisation; (3) floodplain mapping and land-use planning; and (4) operational coastal management. Furthermore outputs are simple and flexible enough to communicate flood impacts to non-scientific audiences. It is recommended that these approaches be further explored, particularly for Portsmouth and Southampton where the majority of coastal population and infrastructure reside, as well as areas where breaching is a threat. Risks and management approaches could change differently for Portsmouth and Southampton over the coming century. For the former, risk is already high and investments in defences already exist with the need for upgrade recognised. Southampton is at present mostly undefended, therefore adaptation will represent a bigger change from current practice, although the needs for a response are increasingly recognised. Globally there are many coasts such as the Solent where surges are not large and flood risk is currently not a major issue; but sea-level rise will significantly exacerbate flood risks. The transferability of this modelling to other coastal regions is in principle quite simple. However, flood predictions were sensitive to small variations in crest height; whilst high resolution and recent datasets (e.g., for defences, floodplains, and extreme sea level analysis) is not available everywhere.

Acknowledgments

This research was part of a Ph.D funded by the Engineering and Physical Sciences Research Council (EEPSRC) and the ‘SemSorGrid4Env’ (SG4E) EU research project (http://www.semsorgrid4env.eu/home.jsp). Data was provided by the Channel Coastal Observatory (http:www.channelcoast.org), the Environment Agency Southern Region and the Havant Borough Council/Portsmouth City Council Coastal Defence Partnership. Paul Bates, Jeff Neal and Tim Fewtrell from the University of Bristol provided LISFLOOD-FP and expert guidance.

References

  1. Van Koningsveld, M.; Mulder, J.P.M.; Stive, M.J.F.; van der Valk, L.; van der Weck, A.W. Living with sea-level rise and climate change: A case study of the netherlands. J. Coast. Res. 2008, 24, 367–379. [Google Scholar]
  2. Dawson, R.J.; Ball, T.; Werritty, J.; Werritty, A.; Hall, J.W.; Roche, N. Assessing the effectiveness of non-structural flood management measures in the thames estuary under conditions of socio-economic and environmental change. Glob. Environ. Change 2011, 21, 628–646. [Google Scholar]
  3. Gerritsen, H. What happened in 1953? The big flood in the netherlands in retrospect. Philos. Trans. R. Soc. A Math. Phys. Eng. Sci. 2005, 363, 1271–1291. [Google Scholar]
  4. Baxter, P.J. The east coast big flood, 31 January–1 February 1953: A summary of the human disaster. Philos. Trans. R. Soc. A Math. Phys. Eng. Sci. 2005, 363, 1293–1312. [Google Scholar]
  5. McRobie, A.; Spencer, T.; Gerritsen, H. The big flood: North sea storm surge. Philos. Trans. R. Soc. A Math. Phys. Eng. Sci. 2005, 363, 1263–1270. [Google Scholar]
  6. Bütow, H. Die große flut in Hamburg: Eine Chronik der Katastrophe vom Februar 1962; Verlag: Hansestadt, German, 1963. [Google Scholar]
  7. Von Storch, H.; Woth, K.; Gönnert, G. Storm surges—The case of Hamburg, Germany. ESSP OSC Panel Session on “GEC, Natural Disasters, and Their Implications for Human Security in Coastal Urban Areas”. Available online: http://www.safecoast.nl/editor/databank/File/hamburg-storms.pdf (accessed on 26 January 2012).
  8. Battjes, J.; Gerritsen, H. Coastal modelling for flood defence. Philos. Trans. R. Soc. Lond. Ser. A Math. Phys. Eng. Sci. 2002, 360, 1461–1475. [Google Scholar]
  9. Bates, P.D.; Dawson, R.J.; Hall, J.W.; Horritt, M.S.; Nicholls, R.J.; Wicks, J.; Mohamed Ahmed Ali Mohamed, H. Simplified two-dimensional numerical modelling of coastal flooding and example applications. Coast. Eng. 2005, 52, 793–810. [Google Scholar]
  10. Brown, J.D.; Spencer, T.; Moeller, I. Modeling storm surge flooding of an urban area with particular reference to modeling uncertainties: A case study of Canvey Island, United Kingdom. Water Resour. Res. 2007, 43, W06402. [Google Scholar] [CrossRef]
  11. Gallien, T.W.; Schubert, J.E.; Sanders, B.F. Predicting tidal flooding of urbanized embayments: A modeling framework and data requirements. Coast. Eng. 2011, 58, 567–577. [Google Scholar]
  12. Smith, R.A.E.; Bates, P.D.; Hayes, C. Evaluation of a coastal flood inundation model using hard and soft data. Environ. Model. Softw. 2012, 30, 35–46. [Google Scholar]
  13. Narayan, S.; Hanson, S.; Nicholls, R.J.; Clarke, D.; Willems, P.; Ntegaka, V.; Monbaliu, J. A holistic assessment of coastal flood systems using system diagrams and the source-pathway-receptor (spr) concept. J. Nat. Hazards Earth Syst. Sci. 2012, in press. [Google Scholar]
  14. Dawson, R.; Peppe, R.; Wang, M. An agent-based model for risk-based flood incident management. Nat. Hazards 2011, 59, 167–189. [Google Scholar]
  15. RMS. Hurricane Katrina: Profile of a Super Cat, Lessons and Implications for Catastrophe, Risk Management Solutions; Risk Management Solutions; Risk Management Solutions, Inc.: Newark, CA, USA, 2005. Available online: http://www.Rms.Com (accessed on 14 June 2011).
  16. Hanson, S.; Nicholls, R.; Ranger, N.; Hallegatte, S.; Corfee-Morlot, J.; Herweijer, C.; Chateau, J. A global ranking of port cities with high exposure to climate extremes. Clim. Change 2011, 104, 89–111. [Google Scholar]
  17. Lumbroso, D.M.; Vinet, F. A comparison of the causes, effects and aftermaths of the coastal flooding of england in 1953 and france in 2010. Nat. Hazards Earth Syst. Sci. 2011, 11, 2321–2333. [Google Scholar]
  18. Kolen, B.; Slomp, R.; van Balen, W.; Terpstra, T.; Bottema, M.; Nieuwenhuis, S. Learning from French Experiences with Storm Xynthia–Damages after a Flood; ©HKV LIJN IN WATER: Waterdienst, The Netherlands, 2010. [Google Scholar]
  19. Muir Wood, R.; Bateman, W. Uncertainties and constraints on breaching and their implications for flood loss estimation. Philos. Trans. R. Soc. A. Math. Phys. Eng. Sci. 2005, 363, 1423–1430. [Google Scholar]
  20. Haigh, I.; Nicholls, R.; Wells, N. Rising sea levels in the English Channel 1900 to 2100. Proc. ICE Maritime Engineer. 2011, 164, 81–92. [Google Scholar]
  21. Menéndez, M.; Woodworth, P.L. Changes in extreme high water levels based on a quasi-global tide-gauge data set. J. Geophys. Res. 2010, 115, C10011. [Google Scholar] [CrossRef]
  22. Wahl, T.; Jensen, J.; Frank, T.; Haigh, I. Improved estimates of mean sea level changes in the german bight over the last 166 years. Ocean Dyn. 2011, 61, 701–715. [Google Scholar]
  23. De Moel, H.; van Alphen, J.; Aerts, J.C.J.H. Flood maps in Europe—Methods, availability and use. Nat. Hazards Earth Syst. Sci. 2009, 9, 289–301. [Google Scholar]
  24. Reeve, D.E.; Burgess, K.A. A method for the assesment of coastal flood risk. IMA J. Manag. Math. 1993, 5, 197–209. [Google Scholar]
  25. Hall, J.; Dawson, R.J.; Sayers, P.B.; Rosu, C.; Chatterton, J.B.; Deakin, R.A. A methodology for national-scale flood risk assessment. Water Marit. Eng. ICE 2003, 156, 235–247. [Google Scholar]
  26. Dawson, R.; Hall, J. Adaptive importance sampling for risk analysis of complex infrastructure systems. Proc. R. Soc. A Math. Phys. Eng. Sci. 2006, 462, 3343–3362. [Google Scholar]
  27. Gouldby, B.; Sayers, P.; Mulet-Marti, J.; Hassan, M.; Benwell, D. A methodology for regional-scale flood risk assessment. Water Manag. 2008, 161, 169–182. [Google Scholar]
  28. EA. Flooding in England: A National Assessment of Flood Risk; Environment Agency: Rotherham, UK, 2009. Available online: http://publications.Environment-agency.Gov.Uk/pdf/geho0609bqds-e-e.Pdf (accessed on 23 April 2012).
  29. Defra. Shoreline Management Plan Guidance Volume 1: Aims and Requirements; DEFRA: London, UK, 2006. Available online: http://www.Defra.Gov.Uk/publications/files/pb11726-smpg-vol1–060308.Pdf (accessed on 25 January 2012).
  30. Motyka, J.M.; Brampton, A.H. Coastal Management: Mapping of Littoral Cells Ref: SR328; HR Wallingford: Oxfordshire, UK, 1993. [Google Scholar]
  31. DEFRA; Environment Agency, Best Practice in Coastal Flood Forecasting: R&d Technical Report FD2206/TR1; HR Wallingford Report TR 132; DEFRA: London, UK, 2004.
  32. Bradbury, A.; Kidd, R. Hurst spit stabilisation scheme: Design and construction of beach recharge. In 33rd MAFF Conference of River and Coastal Engineers, Keele University, Staffordshire, UK, 1–3 July 1998.
  33. Haigh, I.; Butcher, P.; Harris, J.M.; Cooper, N.J.; Trip, I. Developing an improved understanding of storm surges in the solent. In Proceedings of the39th DEFRA Flood and Coastal Management Conference, York, UK, 29 June–1 July 2004.
  34. Law, C.R. Storm surges in the English Channel. Hydrogr. J. 1975, 2, 30–34. [Google Scholar]
  35. Haigh, I. Extreme Sea Levels in the English Channel. Ph.D Dissertation, University of Southampton, Hampshire, UK, 2009. [Google Scholar]
  36. Ruocco, A.; Nicholls, R.; Haigh, I.; Wadey, M. Reconstructing coastal flood occurrence combining sea level and media sources: A case study of the Solent, UK since 1935. Nat. Hazards 2011, 59, 1773–1796. [Google Scholar]
  37. Pugh, D.T. Tides, surges and mean sea-level. In A Handbook for Engineers and Scientists; Wiley: Chichester, UK; Volume 1987.
  38. Wells, N.C.; Baldwin, D.J.; Wang, J.Y.; Collins, M.B. Modelling of extreme storm surge events in the English Channel for the period 14–18 December 1989. Glob. Atmos. Ocean Syst. 2001, 7, 275–294. [Google Scholar]
  39. Mason, T.; Bradbury, A.; Poate, T.; Newman, R. Nearshore wave climate of the English Channel—Evidence for bi-modal seas. In 31st International Conference on Coastal Engineering, Hamburg, Germany, 31 Auguest–5 September 2008; Jane, M.S., Ed.; World Scientific: Singapore; Hamburg, Germany, 2009; pp. 605–616. [Google Scholar]
  40. Evans, E. Foresight: Scientific Summary. Volume ii, Managing Future Risks; Office of Science and Technology: London, UK, 2004. [Google Scholar]
  41. NFDC. Cabinet 06/07/09 Report A: North Solent Shoreline Management Plan; New Forest District Council: Hampshire, UK, 6 July 2009. Available online: http://www.Newforest.Gov.Uk/committeedocs/cab/cdr05054.Pdf (accessed on 15 December 2011).
  42. Portsmouth City Council (PCC). Portsmouth City Local Plan, First Review 2001–2011. Supplementary Planning Guidance: Flood Protection. Approved by the Executive Member for Planning, Regeneration, Economic Development and Property 6th February 2004; Portsmouth City Council: Wales, UK, 2004. Available online: http://www.portsmouth.gov.uk/media/Flood_Protection_SPG.pdf (accessed on 26 August 2009).
  43. RIBA; ICE. Facing up to Rising Sea-Levels: Retreat? Defend? Attack? The Future of Our Coastal and Estuarine Cities; Royal Institute for British Architects; Institute of Civil Engineers: London, UK, 2009. Available online: http://www.buildingfutures.org.uk/assets/downloads/Facing_Up_To_Rising_Sea_Levels.pdf (accessed on 31 January 2010).
  44. Atkins. Strategic Flood Risk Assessment for the Partnership for Urban South Hampshire; Document Number: 5049258/72/DG/048; Atkins limited: London, UK, 2007. Available online: http://www.environment-agency.gov.uk/static/documents/Research/PUSH_SFRA.pdf (accessed on 24 April 2012).
  45. OS. Ordnance Survey Land-Form Profile™ User Guide; V4.0–5/2001© Crown Copyright; Ordnance Survey: Southampton, UK, 2001. Available online: http://www.ordnancesurvey.co.uk (Accessed on 6 July 2011).
  46. CCO. Strategic Regional Coastal Monitoring Programmes; Channel Coastal Observatory: Southampton, UK, 2011. Available online: http://www.channelcoast.org (accessed on 23 April 2012).
  47. Xharde, R.; Long, B.; Forbes, D. Accuracy and limitations of AIrborne Lidar surveys in coastal environment. In Proceedings of theGeoscience and Remote Sensing Symposium, 2006; IGARSS 2006. IEEE International Conference, Denver, CO, USA, 31 July–4 August 2006; pp. 2412–2415, ISBN: 0-7803-9510-7.
  48. Webster, T.L.; Forbes, D.L.; MacKinnon, E.; Roberts, D. Flood-risk mapping for storm-surge events and sea-level rise using lidar for southeast new brunswick. Can. J. Remote Sens. 2006, 32, 194–211. [Google Scholar]
  49. Fewtrell, T.J.; Bates, P.D.; Horritt, M.; Hunter, N.M. Evaluating the effect of scale in flood inundation modelling in urban environments. Hydrol. Process. 2008, 22, 5107–5118. [Google Scholar]
  50. De Mers, M.N. Fundamentals of Geographic Information Systems, 4th ed; John Wiley Sons Inc.: New York, NY, USA, 2009. [Google Scholar]
  51. Purvis, M.J.; Bates, P.D.; Hayes, C.M. A probabilistic methodology to estimate future coastal flood risk due to sea level rise. Coast. Eng. 2008, 55, 1062–1073. [Google Scholar]
  52. Dixon, M.J.; Tawn, J.A. Extreme Sea-Levels at the UK a-Class Sites: Site-by-Site Analysis; Pol Internal Document Number 65; Proudman Oceanographic Laboratory: Liverpool, UK, 1994. Available online: http://www.pol.ac.uk/ntslf/pdf/id65.pdf (accessed on 23 April 2012).
  53. Dixon, M.J.; Tawn, J.A. Extreme Sea-Levels at the UK a-Class Sites: Optimal Site-Bysite Analysis and Spatial Analyses for the East Coast; Pol Internal Document Number 72; Proudman Oceanographic Laboratory: Liverpool, UK, 1995; p. 298. [Google Scholar]
  54. Dixon, M.J.; Tawn, J.A. Estimates of Extreme Sea Conditions—Final Report, Spatial Analysis for the UK Coast; Pol Internal Document Number 112; Proudman Oceanographic Laboratory: Liverpool, UK, 1997; p. 217. [Google Scholar]
  55. Haigh, I.D.; Nicholls, R.; Wells, N. A comparison of the main methods for estimating probabilities of extreme still water levels. Coast. Eng. 2010, 57, 838–849. [Google Scholar]
  56. Flood Risk Mapping and Data Management Team, Environment Agency Extreme Water Levels: Bournemouth to Littlehampton; EA: Rotherham, UK, 2007.
  57. EA, Coastal Flood Boundary Conditions for UK Mainland and Islands; Project: Sc060064/tr2: Design sea Levels; EA: Bristol, UK, 2011; p. 142.
  58. Haigh, I. Quantification of sea-level rise at the Southampton and Portsmouth tide gauges. Personal Communication.
  59. NFDC. North Solent Shoreline Management Plan, Appendix c Baseline Process Understanding, c.1 Assessment of Shoreline Dynamics; New Forest District Council: Hampshire, UK, 2010. Available online: http://www.newforest.gov.uk/media/adobe/o/s/C1_Coastal_Processes _Literature_Review_%28final_draft%29.pdf (accessed on 30 June 2011).
  60. CERC, Coastal Engineering Research Center 1984: Shore Protection Manual; Department of the Army, Waterways Experiment Station, Corps of Engineers, Coastal Engineering Research Center, Vicksburg, United States Government Printing Office: Washington, DC, USA, 1984; p. 652.
  61. Dawson, R.; Hall, J. Probabilistic condition characterisation of coastal structures using imprecise information. In Proceedings of the 28th International Conference Coastal Engineering Cardiff, UK, 8–12 July 2002; McKee-Smith, J., Ed.; World Scientific: Hackensack, NJ, USA; Cardiff, UK, 2003; pp. 2348–2359. [Google Scholar]
  62. Flikweert, J.; Simm, J. Improving performance targets for flood defence assets. J. Flood Risk Manag. 2008, 1, 201–212. [Google Scholar]
  63. Lowe, J.A.; Howard, T.; Pardaens, A.; Tinker, J.; Holt, J.; Wakelin, S.; Glenn, M.; Leake, J.; Wolf, J.; Horsburgh, K.; et al. UK Climate Projections Science Report: Marine and Coastal Projections; Met Office Hadley Centre: Exeter, UK, 2009; p. 99. [Google Scholar]
  64. Bates, P.D.; Horritt, M.S.; Fewtrell, T.J. A simple inertial formulation of the shallow water equations for efficient two-dimensional flood inundation modelling. J. Hydrol. 2010, 387, 33–45. [Google Scholar]
  65. Bates, P.D.; de Roo, A.P.J. A simple raster-based model for flood inundation simulation. J. Hydrol. 2000, 236, 54–77. [Google Scholar]
  66. Hunter, N.M.; Horritt, M.S.; Bates, P.D.; Wilson, M.D.; Werner, M.G.F. An adaptive time step solution for raster-based storage cell modelling of floodplain inundation. Adv. Water Resour. 2005, 28, 975–991. [Google Scholar]
  67. Dawson, R.J.; Hall, J.W.; Bates, P.D.; Nicholls, R.J. Quantified analysis of the probability of flooding in the thames estuary under imaginable worst-case sea level rise scenarios. Int. J. Water Resour. Dev. 2005, 21, 577–591. [Google Scholar]
  68. Hunter, N.M.; Bates, P.D.; Horritt, M.S.; Wilson, M.D. Simple spatially-distributed models for predicting flood inundation: A review. Geomorphology 2007, 90, 208–225. [Google Scholar]
  69. Fewtrell, T.J.; Duncan, A.; Sampson, C.C.; Neal, J.C.; Bates, P.D. Benchmarking urban flood models of varying complexity and scale using high resolution terrestrial lidar data. Phys. Chem. Earth Parts A/B/C 2011, 36, 281–291. [Google Scholar] [CrossRef]
  70. Hunter, N.M.; Bates, P.D.; Neelz, S.; Pender, G.; Villanueva, I.; Wright, N.G.; Liang, D.; Falconer, R.A.; Lin, B.; Waller, S.; et al. Benchmarking 2D hydraulic models for urban flooding. Proc. Inst. Civil Engineers Water Manag. 2008, 161, 13–30. [Google Scholar] [Green Version]
  71. Pullen, T.; Allsop, N.W.H.; Bruce, T.; Kortenhaus, A.; Schuttrumpf, H.; van der Meer, J. Eurotop, Wave Overtopping of Sea Defences and Related Structures—Assessment Manual. 2007. Available online: www.overtopping-manual.com (accessed on 24 April 2012).
  72. Owen, M.W. Design of Seawalls Allowing for Wave Overtopping; Report Ex 924; HR Wallingford: Oxfordshire, UK, 1980. [Google Scholar]
  73. TAWTechnical Report—Wave Run-Up and Wave Overtopping at Dikes; Technical advisory committee for flood defence in the Netherlands (TAW)TAW: Delft, The Netherlands, 2002.
  74. Gouldby, B.; Kingston, G.; Wills, M.; Van Gelder, P.; Buijis, F.; Kortenhaus, A. Flood Defence Reliability Calculator: Reliable User Manual; Floodsite Report Number: T07–10–08; January 2008.
  75. Allsop, W.; Kortenhaus, A.; Morris, M. Failure Mechanisms for Flood Defence Structures; Floodsite Report Number: T04–06–01; HR Wallingford Ltd.: Oxfordshire, UK, 2007. [Google Scholar]
  76. Vrouwenvelder, A.C.W.M.; Steenbergen, H.M.G.M.; Slijkhuis, K.A.H. Theoretical Manual of Pc-Ring, Part B: Statistical Models (in dutch); No. 98-con-r1431. Delft, The Netherland, 2001. [Google Scholar]
  77. Terzaghi, K.; Peck, R.B. Soil Mechanics in Engineering Practice; John Wiley & Sons: New York, NY, USA, 1967; p. 729. [Google Scholar]
  78. Powell, K.A. Predicting the Short Term Profile Response for Shingle Beaches; Hydraulics Research Report sr219; HR Wallingford: Oxfordshire, UK, 1990. [Google Scholar]
  79. DEFRA; EA, Performance and Reliability of Flood and Coastal Defences; R&d Technical Report Fd2318/tr 2; Buijis, F.; Simm, J.; Wallis, M.; Sayers, P. (Eds.) DEFRA: London, UK, 2005.
  80. Morris, M.; Hassan, M.; Kortenhaus, A.; Visser, P. Breaching Processes: A State of the Art Review; Floodsite Report Number t06–06–03, Revision Number 5_2_p01; FLOODsite Consortium: Oxfordshire, UK, 2009. [Google Scholar]
  81. Morris, M.; Hanson, G.; Hassan, M. Improving the accuracy of breach modelling: Why are we not progressing faster? J. Flood Risk Manag. 2008, 1, 150–161. [Google Scholar] [CrossRef]
  82. Wadey, M.; Nicholls, R.J.; Haigh, I.; Hutton, C. Creating a coastal flood event dataset for the solent region-the 10th March 2008 storm surge event. 2012; in preparation. [Google Scholar]
  83. Cope, S. Details of the breach of the medmerry/selsey shingle barrier during the storm on 10 March 2008. Personal Communication, New Forest District Council/Channel Coastal Observatory: Southampton, UK.
  84. EA, Solent & South Downs Area Report 10 March Tidal Flooding Event, Hampshire & Isle of Wight: A report of events, Consequences and Conclusions, Environment Agency: Rotherham, UK, 2010; Version 2.
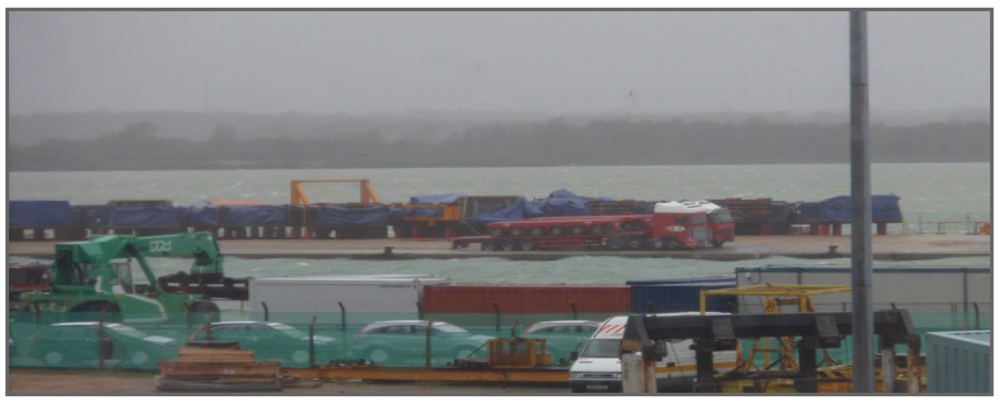
  85. Wadey, M.P. Photograph taken by Matthew Wadey from the Channel Coastal Observatory overlooking Southampton Docks. National Oceanography Centre, Southampton, UK, 2:05PM, 10 March 2008.
  86. Evacuations as waves flood park. BBC World News. 10 March 2008. Available online: http://news.bbc.co.uk/1/hi/england/sussex/7287880.stm (accessed on 25 January 2012).
  87. Emsworth Residents Association. Flooding in Emsworth, Borough of Havant, during a Storm Surge in March 2008; Emsworth_Flood_2008_1.jpg. 10 March 2008. Available online: http://www.floods.emsworthhants.org.uk/ (accessed on 24 April 2012).
  88. NRA, Lymington/Pennington Flood Investigation–Interim Report; Report for National Rivers Authority Southern Region; Ea Report Reference Number: IMP/sch/008/5054, Southern Projects Ltd.: Jersey, UK, 1990.
  89. Stripling, S.; Bradbury, A.P.; Cope, S.N.; Brampton, A.H. Understanding Barrier Beaches; R&D Technical Report Fd1925/Tr; JOINT Defra/ea Flood and Coastal Erosion Risk Management R&D Programme: London, UK, 2008. Available online: http://sciencesearch.defra.gov.uk (accessed on 24 April 2012).
  90. Nicholls, R. The Stability of the Shingle Beaches in the Eastern Half of Christchurch Bay. Ph.D Dissertation, University of Southampton, Hampshire, UK, 1985. [Google Scholar]
  91. Nicholls, R.J.; Webber, N.B. The past, present and future evolution of hurst castle spit, Hampshir. Prog. Oceanogr. 1987, 18, 119–137. [Google Scholar]
  92. Jonkman, S.N.; Penning-Rowsell, E. Human instability in flood flows. JAWRA J. Am. Water Resour. Assoc. 2008, 44, 1208–1218. [Google Scholar]
  93. Pachauri, R.K.; Reisinger, A. (Eds.) Contribution of Working Groups I, II and III to the Fourth Assessment Report of the Intergovernmental Panel on Climate Change; IPCC, Climate Change 2007: Synthesis Report; IPCC: IPCC, Geneva, Switzerland, 2007. Available online: http://www.ipcc.ch/publications_and_data/ar4/syr/en/contents.html (accessed on 24 April 2012).
  94. Flather, R.A. Existing operational oceanography. Coast. Eng. 2000, 41, 13–40. [Google Scholar]
  95. Ray, J.; Coulling, E.; Evans, S.Y.; Spink, K. Developing a practical tool for coastal flood forecasting and warning. ICE Coastal Management: Innovative Coastal Zone Management.Sustainable Engineering for a Dynamic Coast, Belfast, UK, 2011. [Google Scholar]
  96. Wadey, M.; Nicholls, R.; Hutton, C. Threat of coastal inundation in the solent: Real-time forecasting. ICE Coastal Management: Innovative Coastal Zone Management. Sustainable Engineering for a Dynamic Coast, Belfast, UK, 2011. [Google Scholar]
  97. DEFRA; EA, Improving Flood Warnings: Final Report: Improving Institutional and Social Responses to Flooding; Science Report: Sc060019-Work Package 1a; Twigger-ross, C.; Fernández-bilbao, A.; Tapsell, S.; Walker, G.; Watson, N.; Collaborators, C.; Rose, P.; Dade, H.; Deeming, E. (Eds.) DEFRA: London, UK, 2009; p. 67, ISBN: 978-1-84911-058-7.
  98. Pappenberger, F.; Beven, K.J. Ignorance is bliss: Or seven reasons not to use uncertainty analysis. Water Resour. Res. 2006, 42, W05302. [Google Scholar] [CrossRef]

