
Understanding Groundwater Storage Changes and Recharge in Rajasthan, India through Remote Sensing

Abstract
:1. Introduction

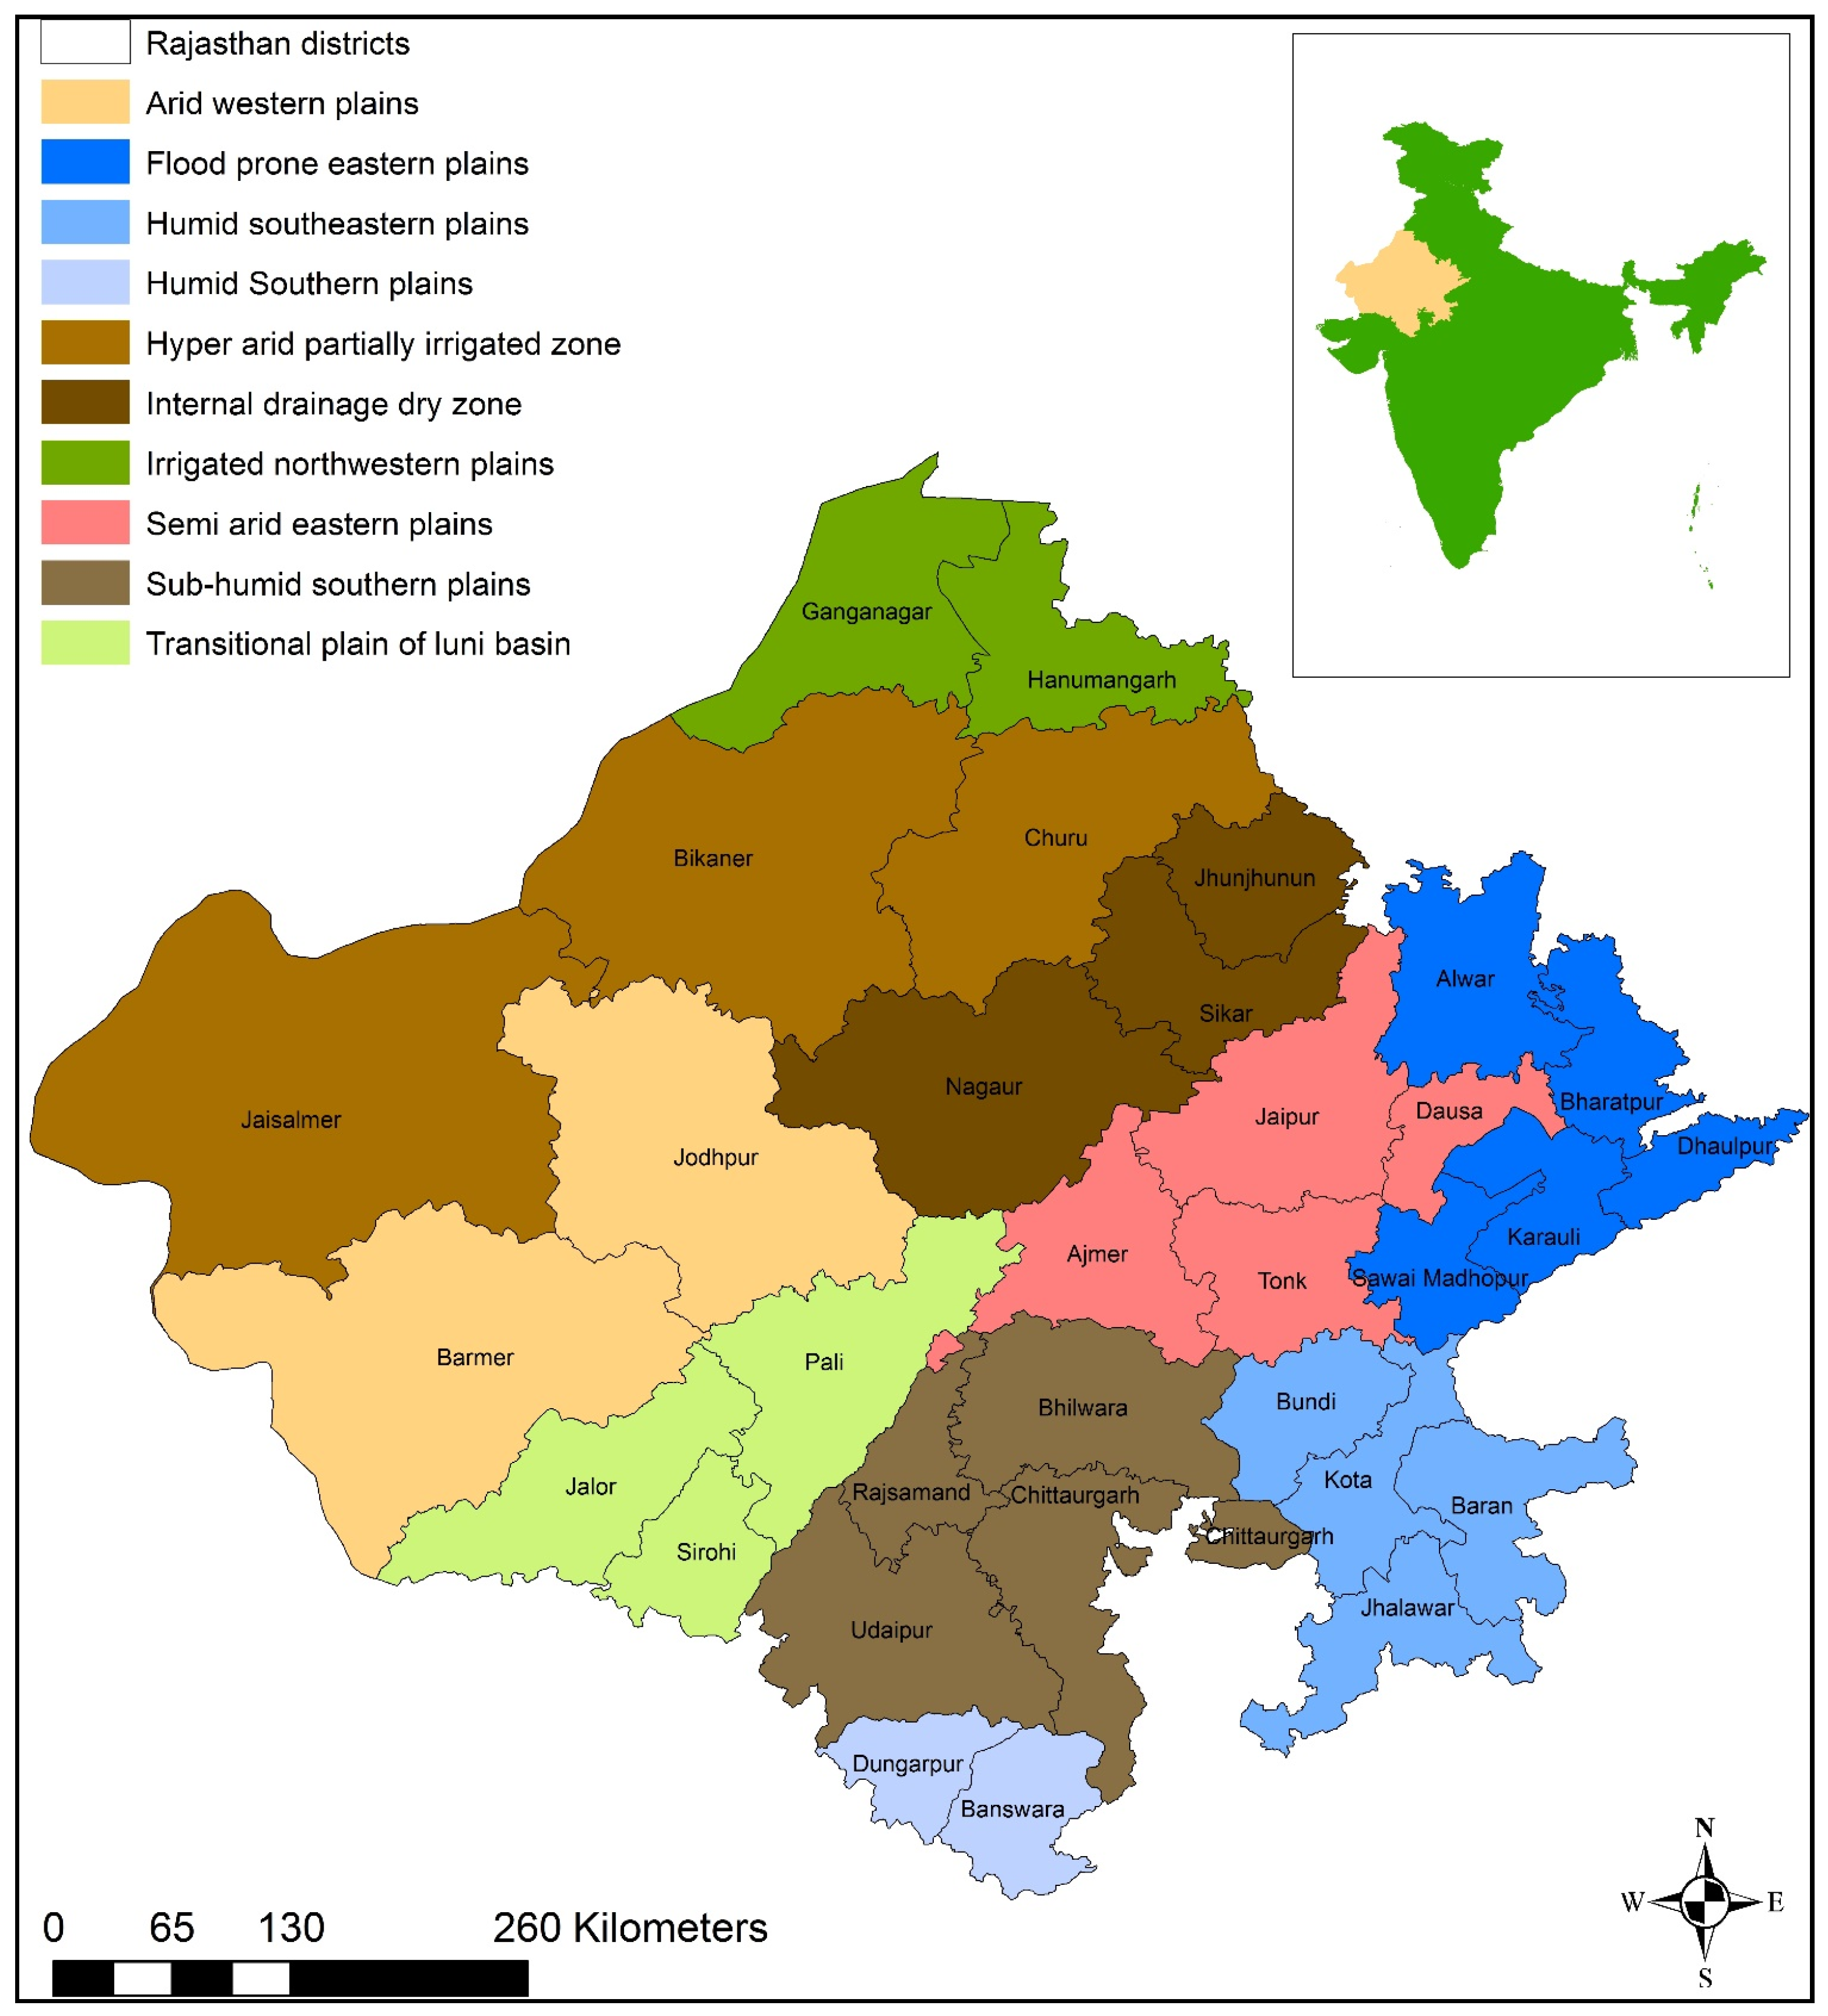
| Agroclimatic Zone | Area (km2) |
|---|---|
| Arid western plains | 51,237 |
| Flood prone eastern Plains | 26,560 |
| Humid southern plains | 8808 |
| Humid south eastern Plains | 24,170 |
| Hyper-arid partially Irrigated zone | 82,475 |
| Internal drainage dry | 25,450 |
| irrigated north western plains | 20,660 |
| Semi-arid eastern plains | 30,256 |
| Sub-humid southern Plains | 42,706 |
| Transitional plain of Luni basin | 51,013 |
2. The Study Area

3. Data Collection and Analysis
3.1. Rainfall Data
3.2. Terrestrial Water Storage (TWS) Data—Gravity Recovery and Climate Experiment (GRACE)
3.3. Soil Moisture (SM) Data—Global Land Data Assimilations System (GLDAS)
3.4. Groundwater Storage (GW)
4. Results and Discussion
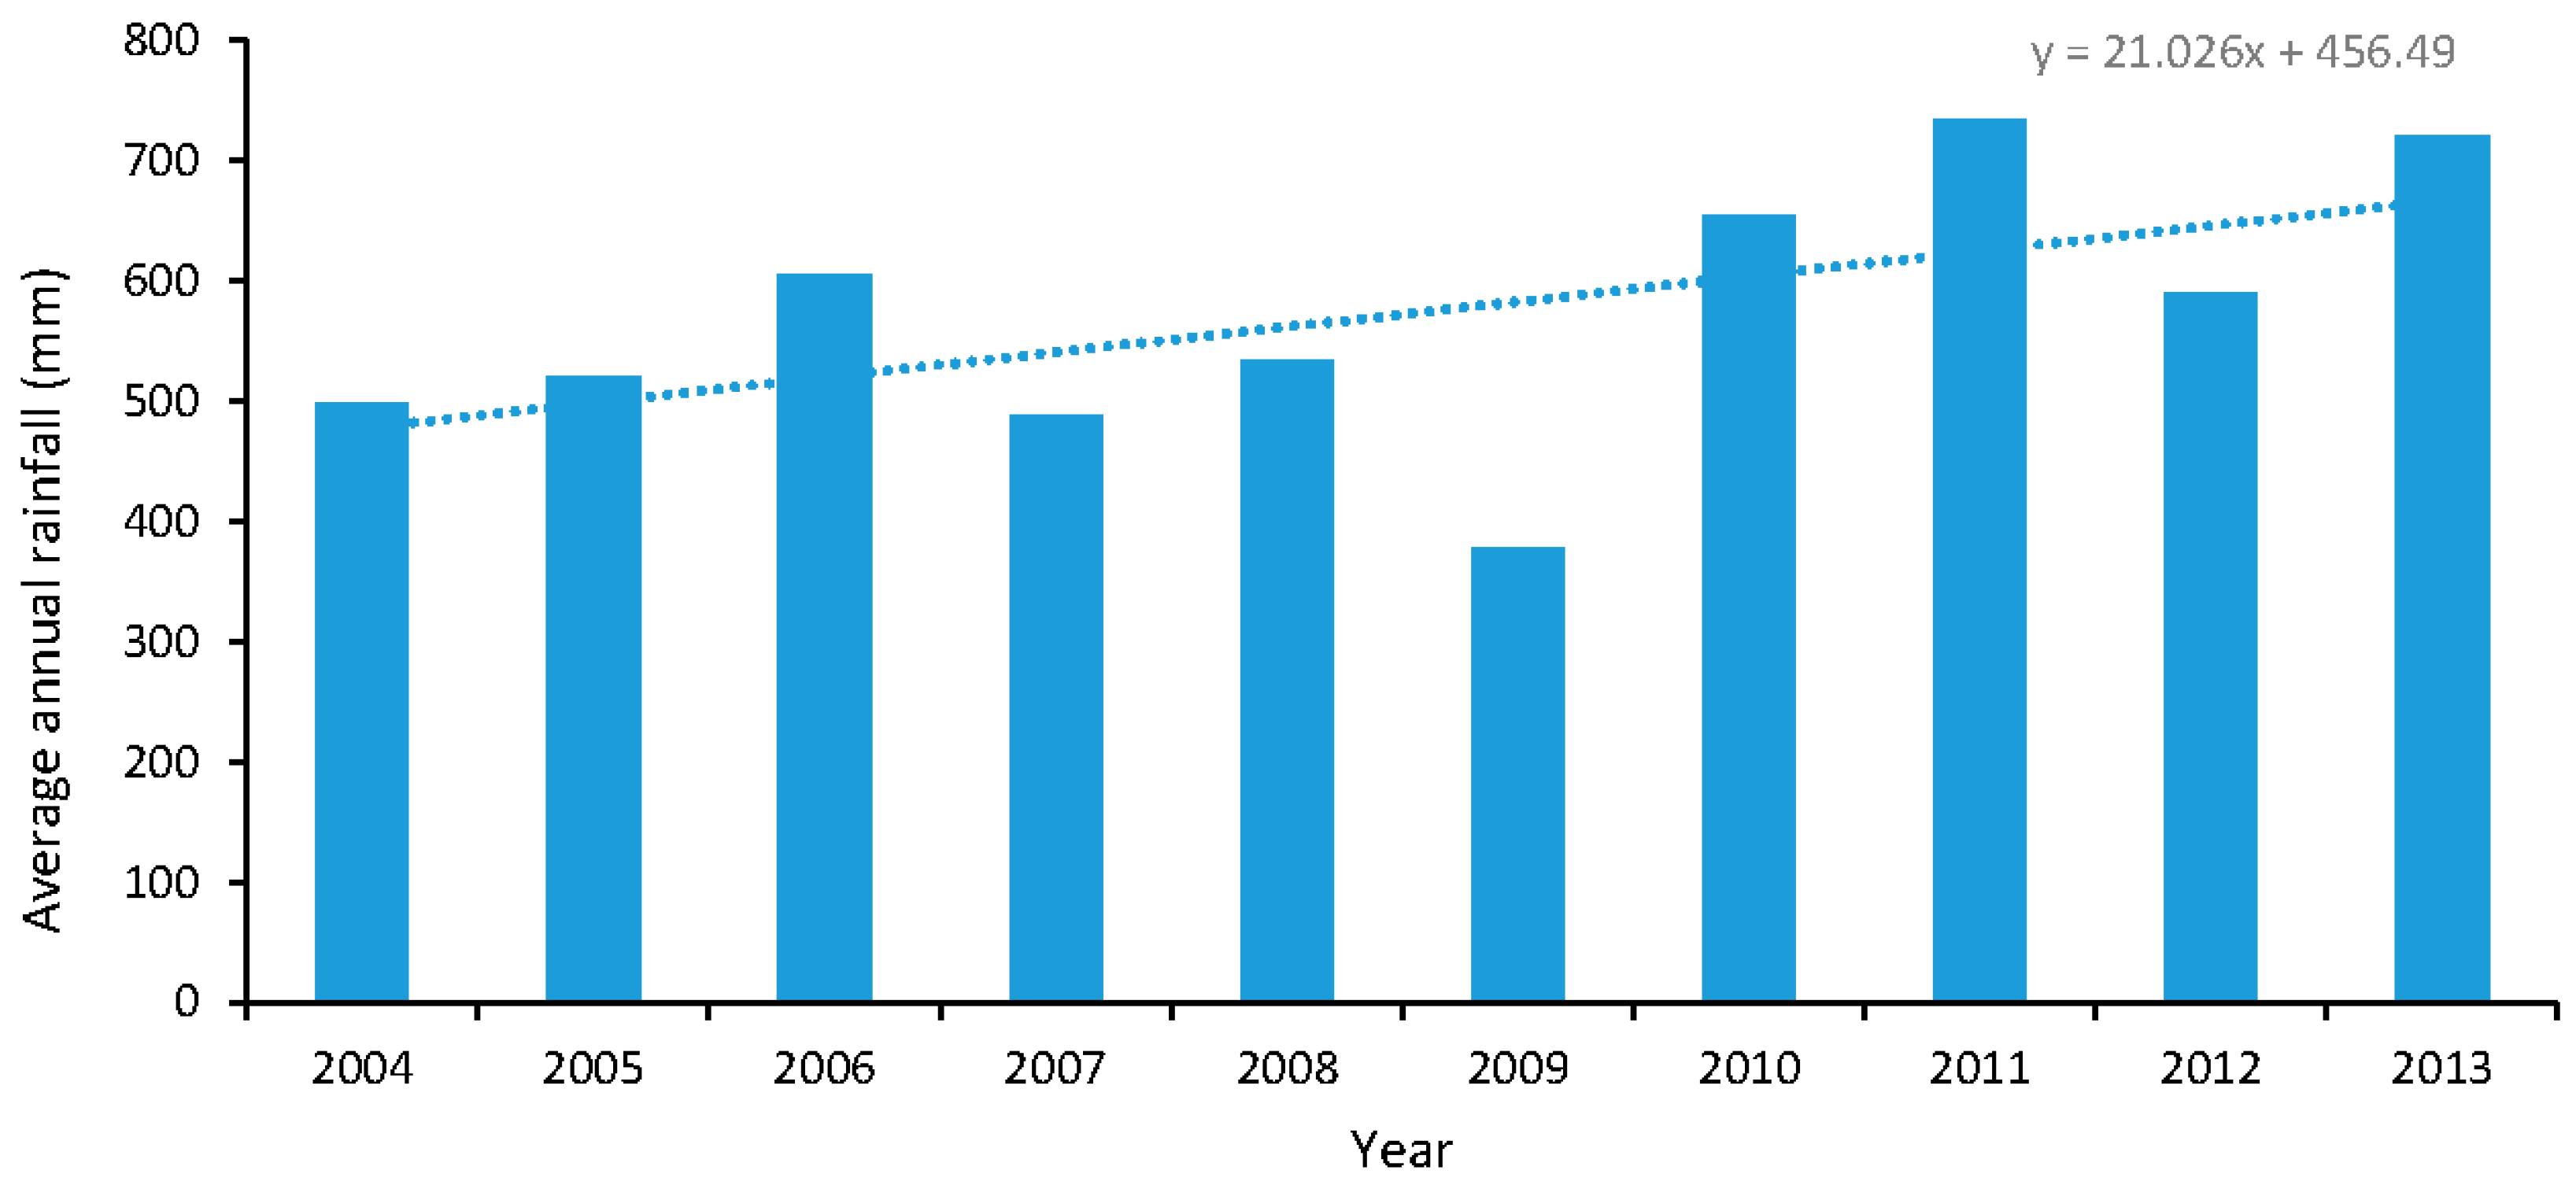
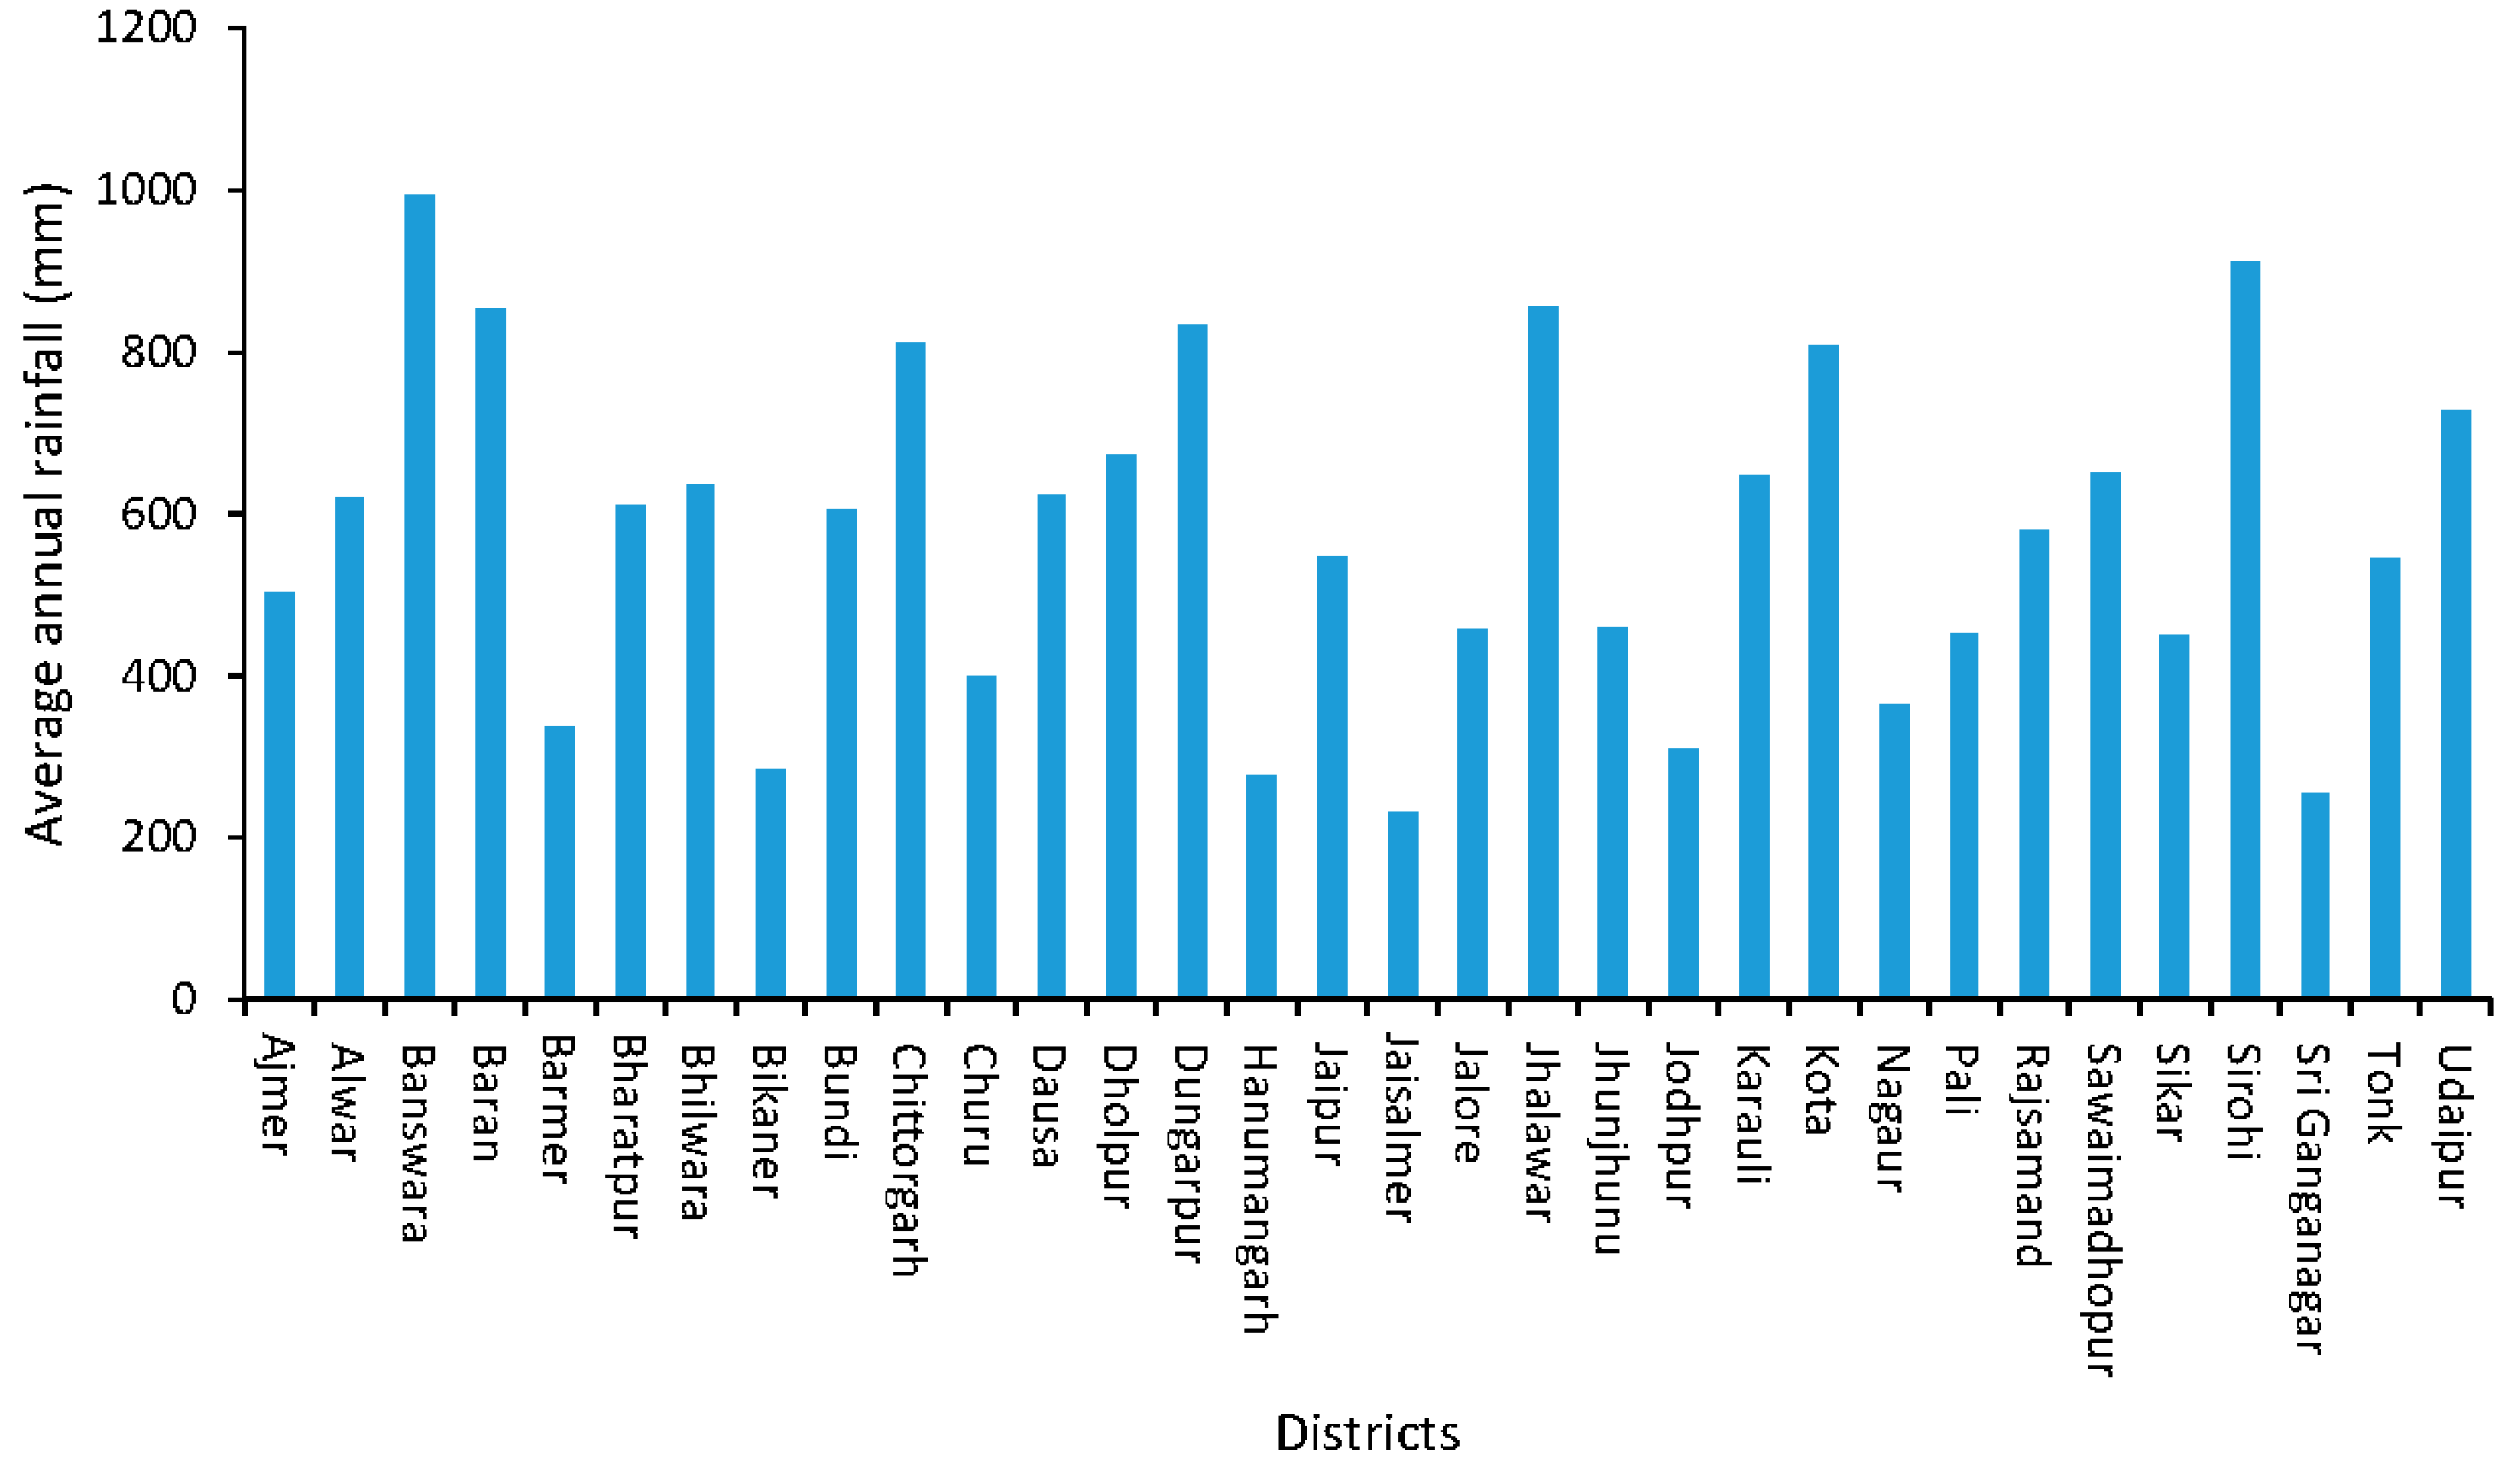
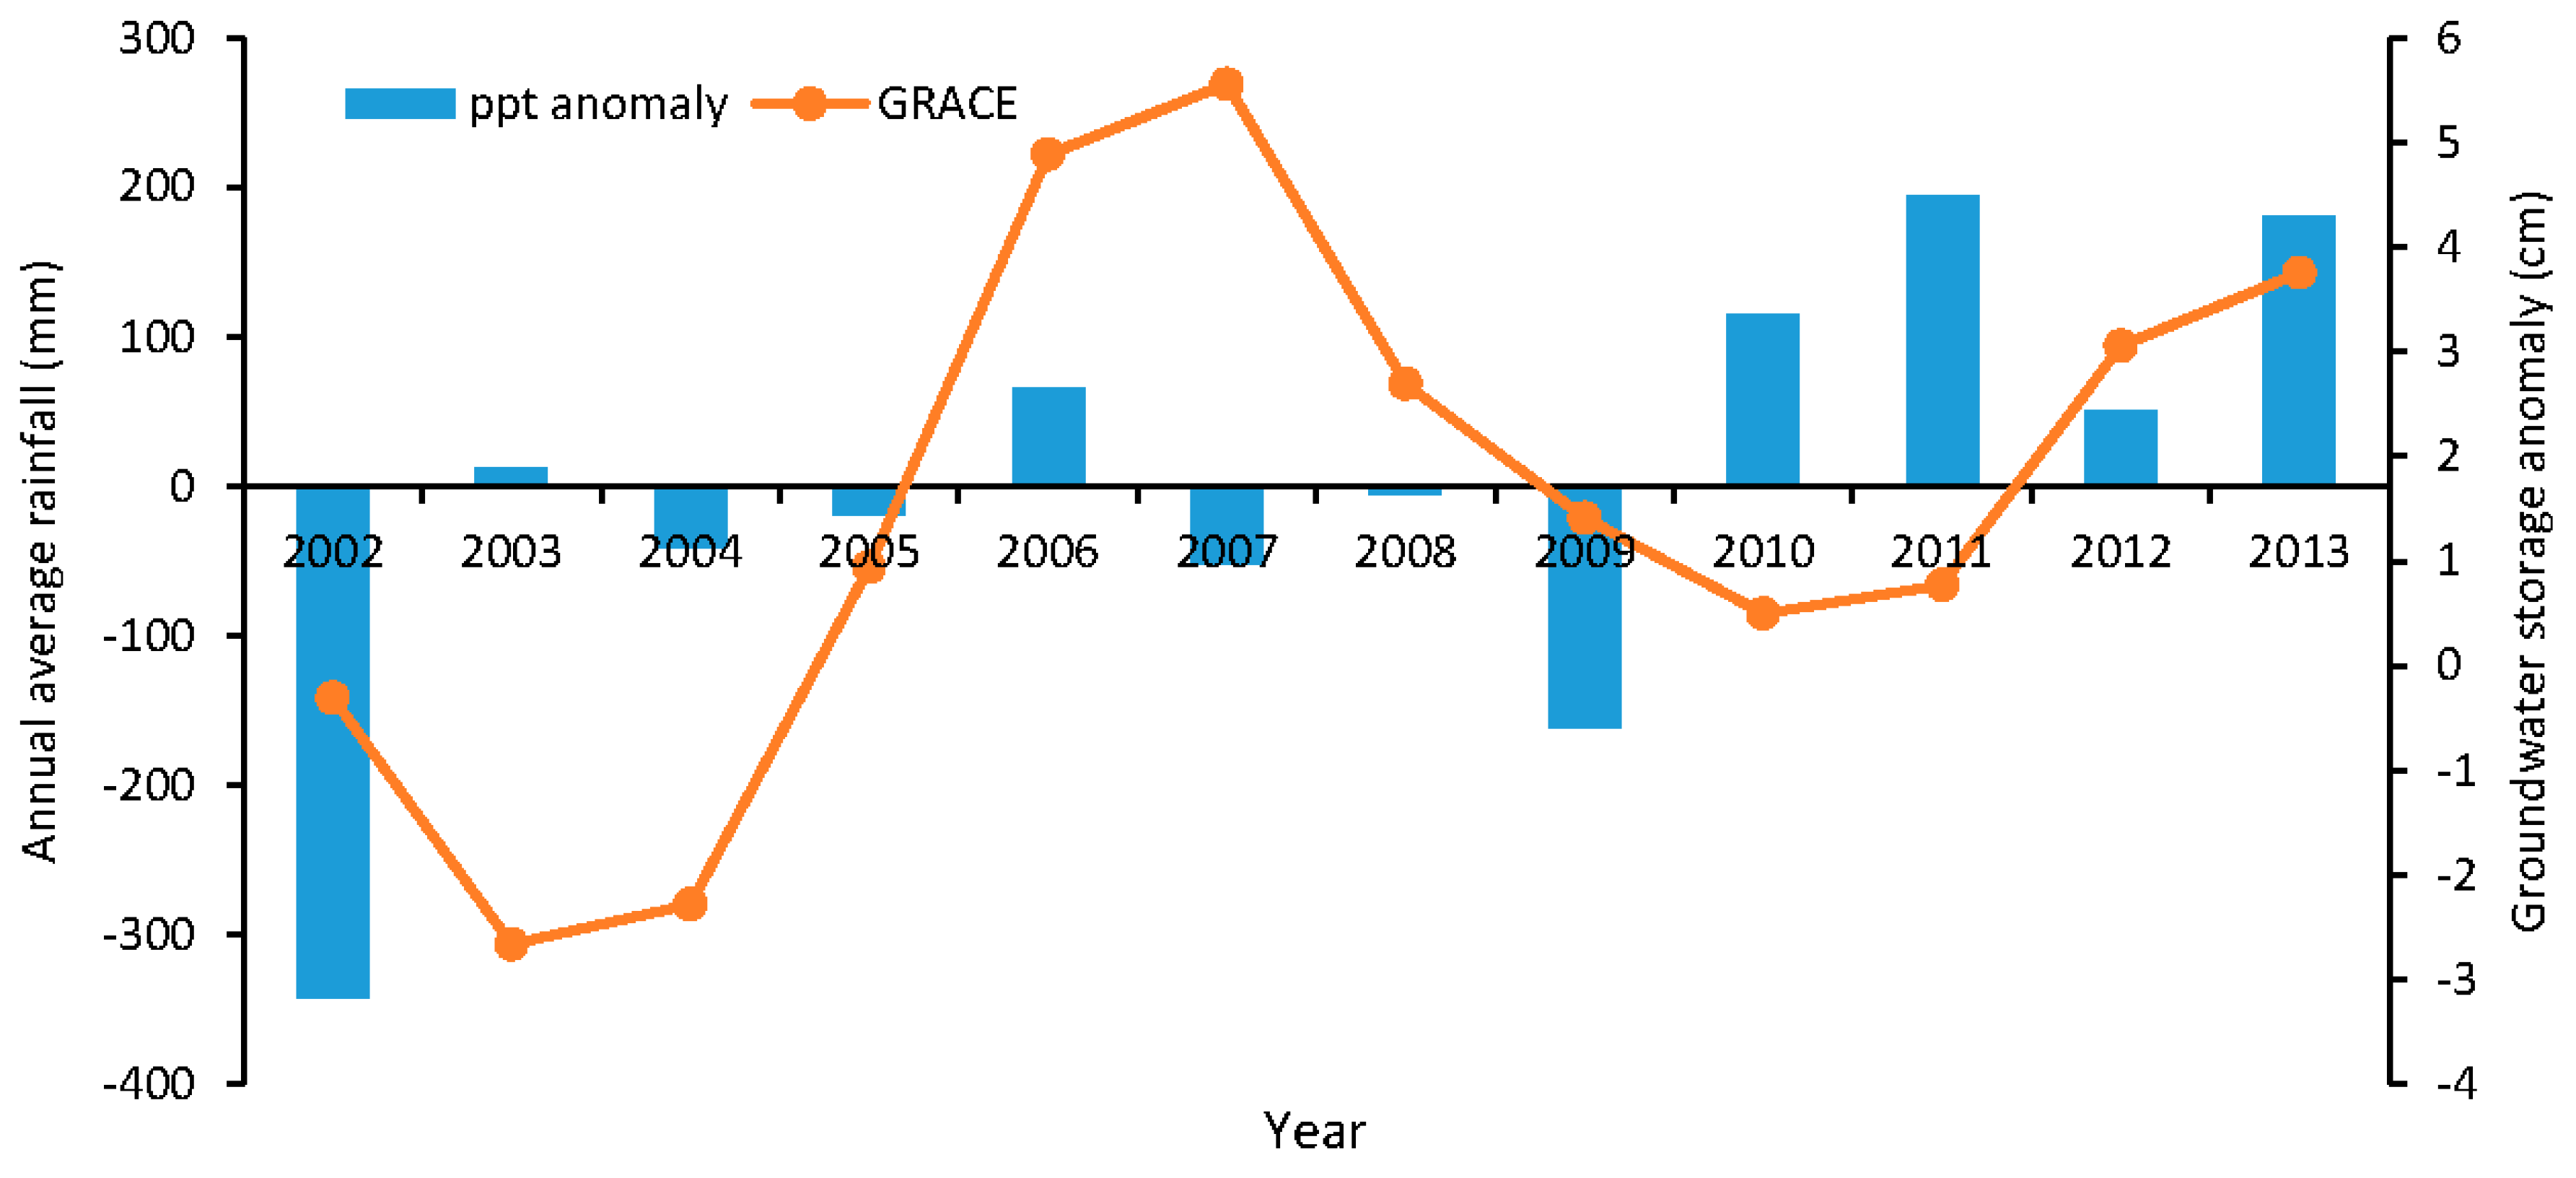
4.1. Rainfall Trends


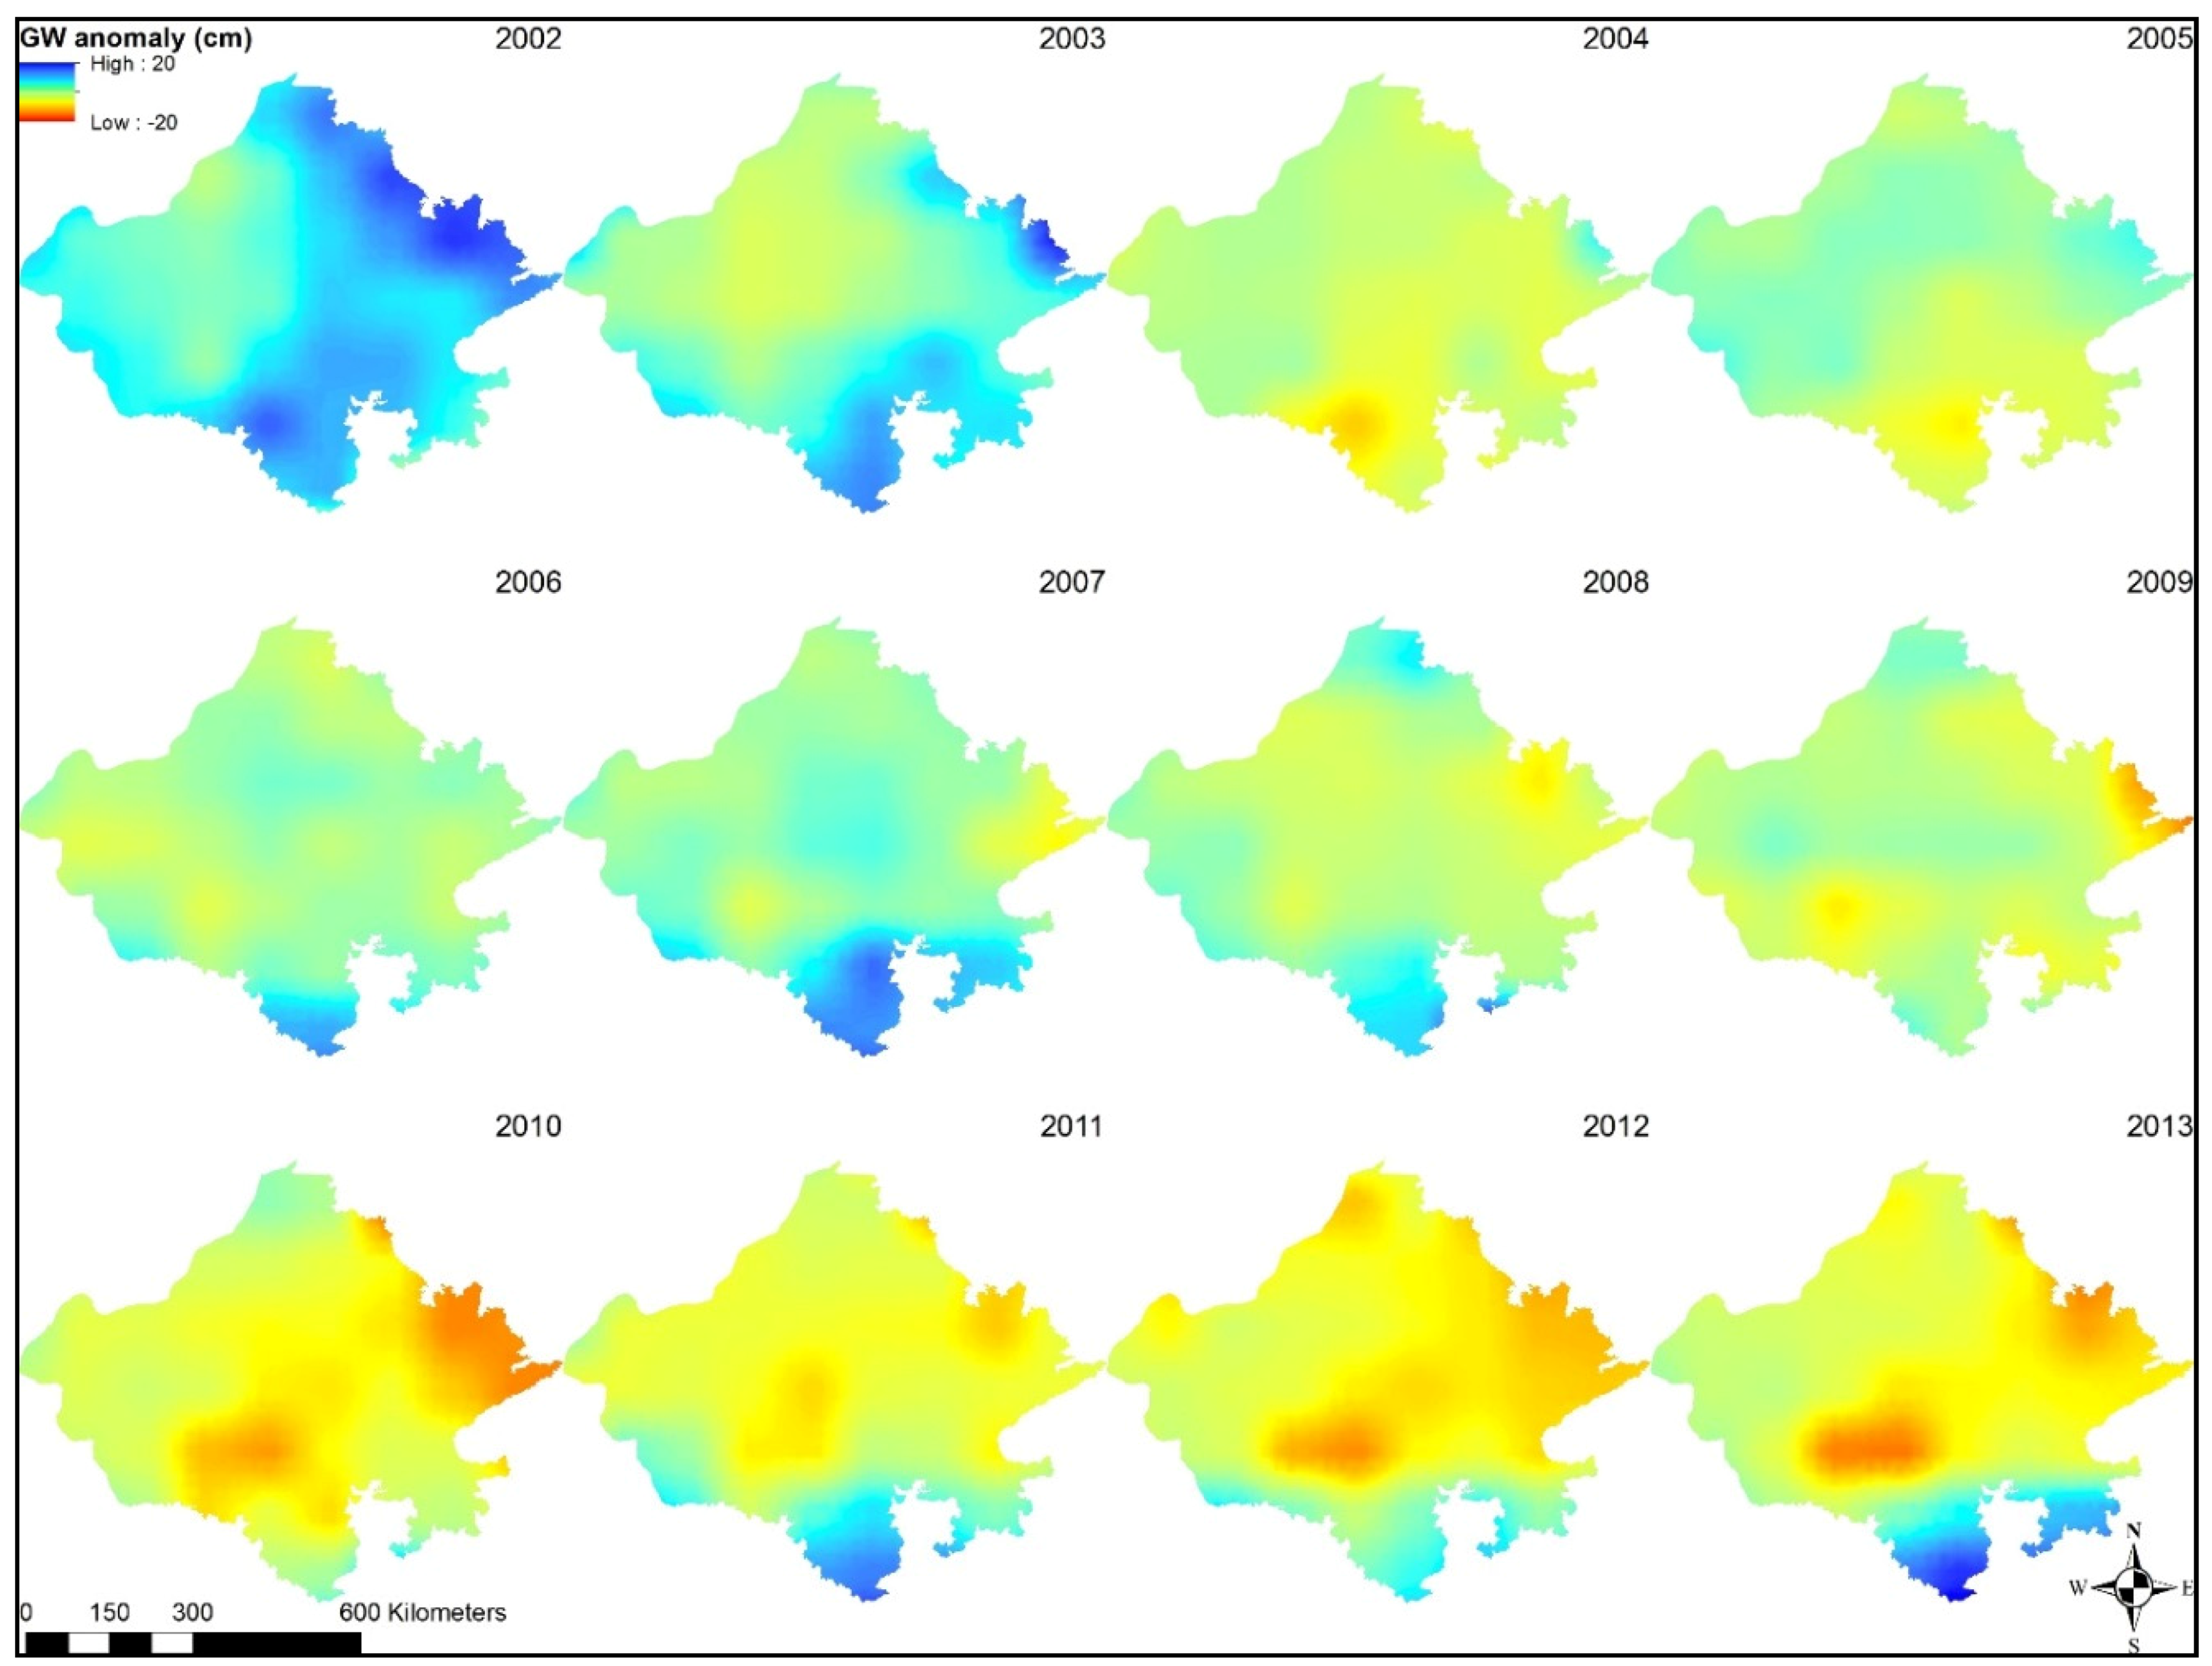
4.2. State Level Groundwater Storage Anomalies

4.3. Effects of Rainfall Amounts on Groundwater Storage Change


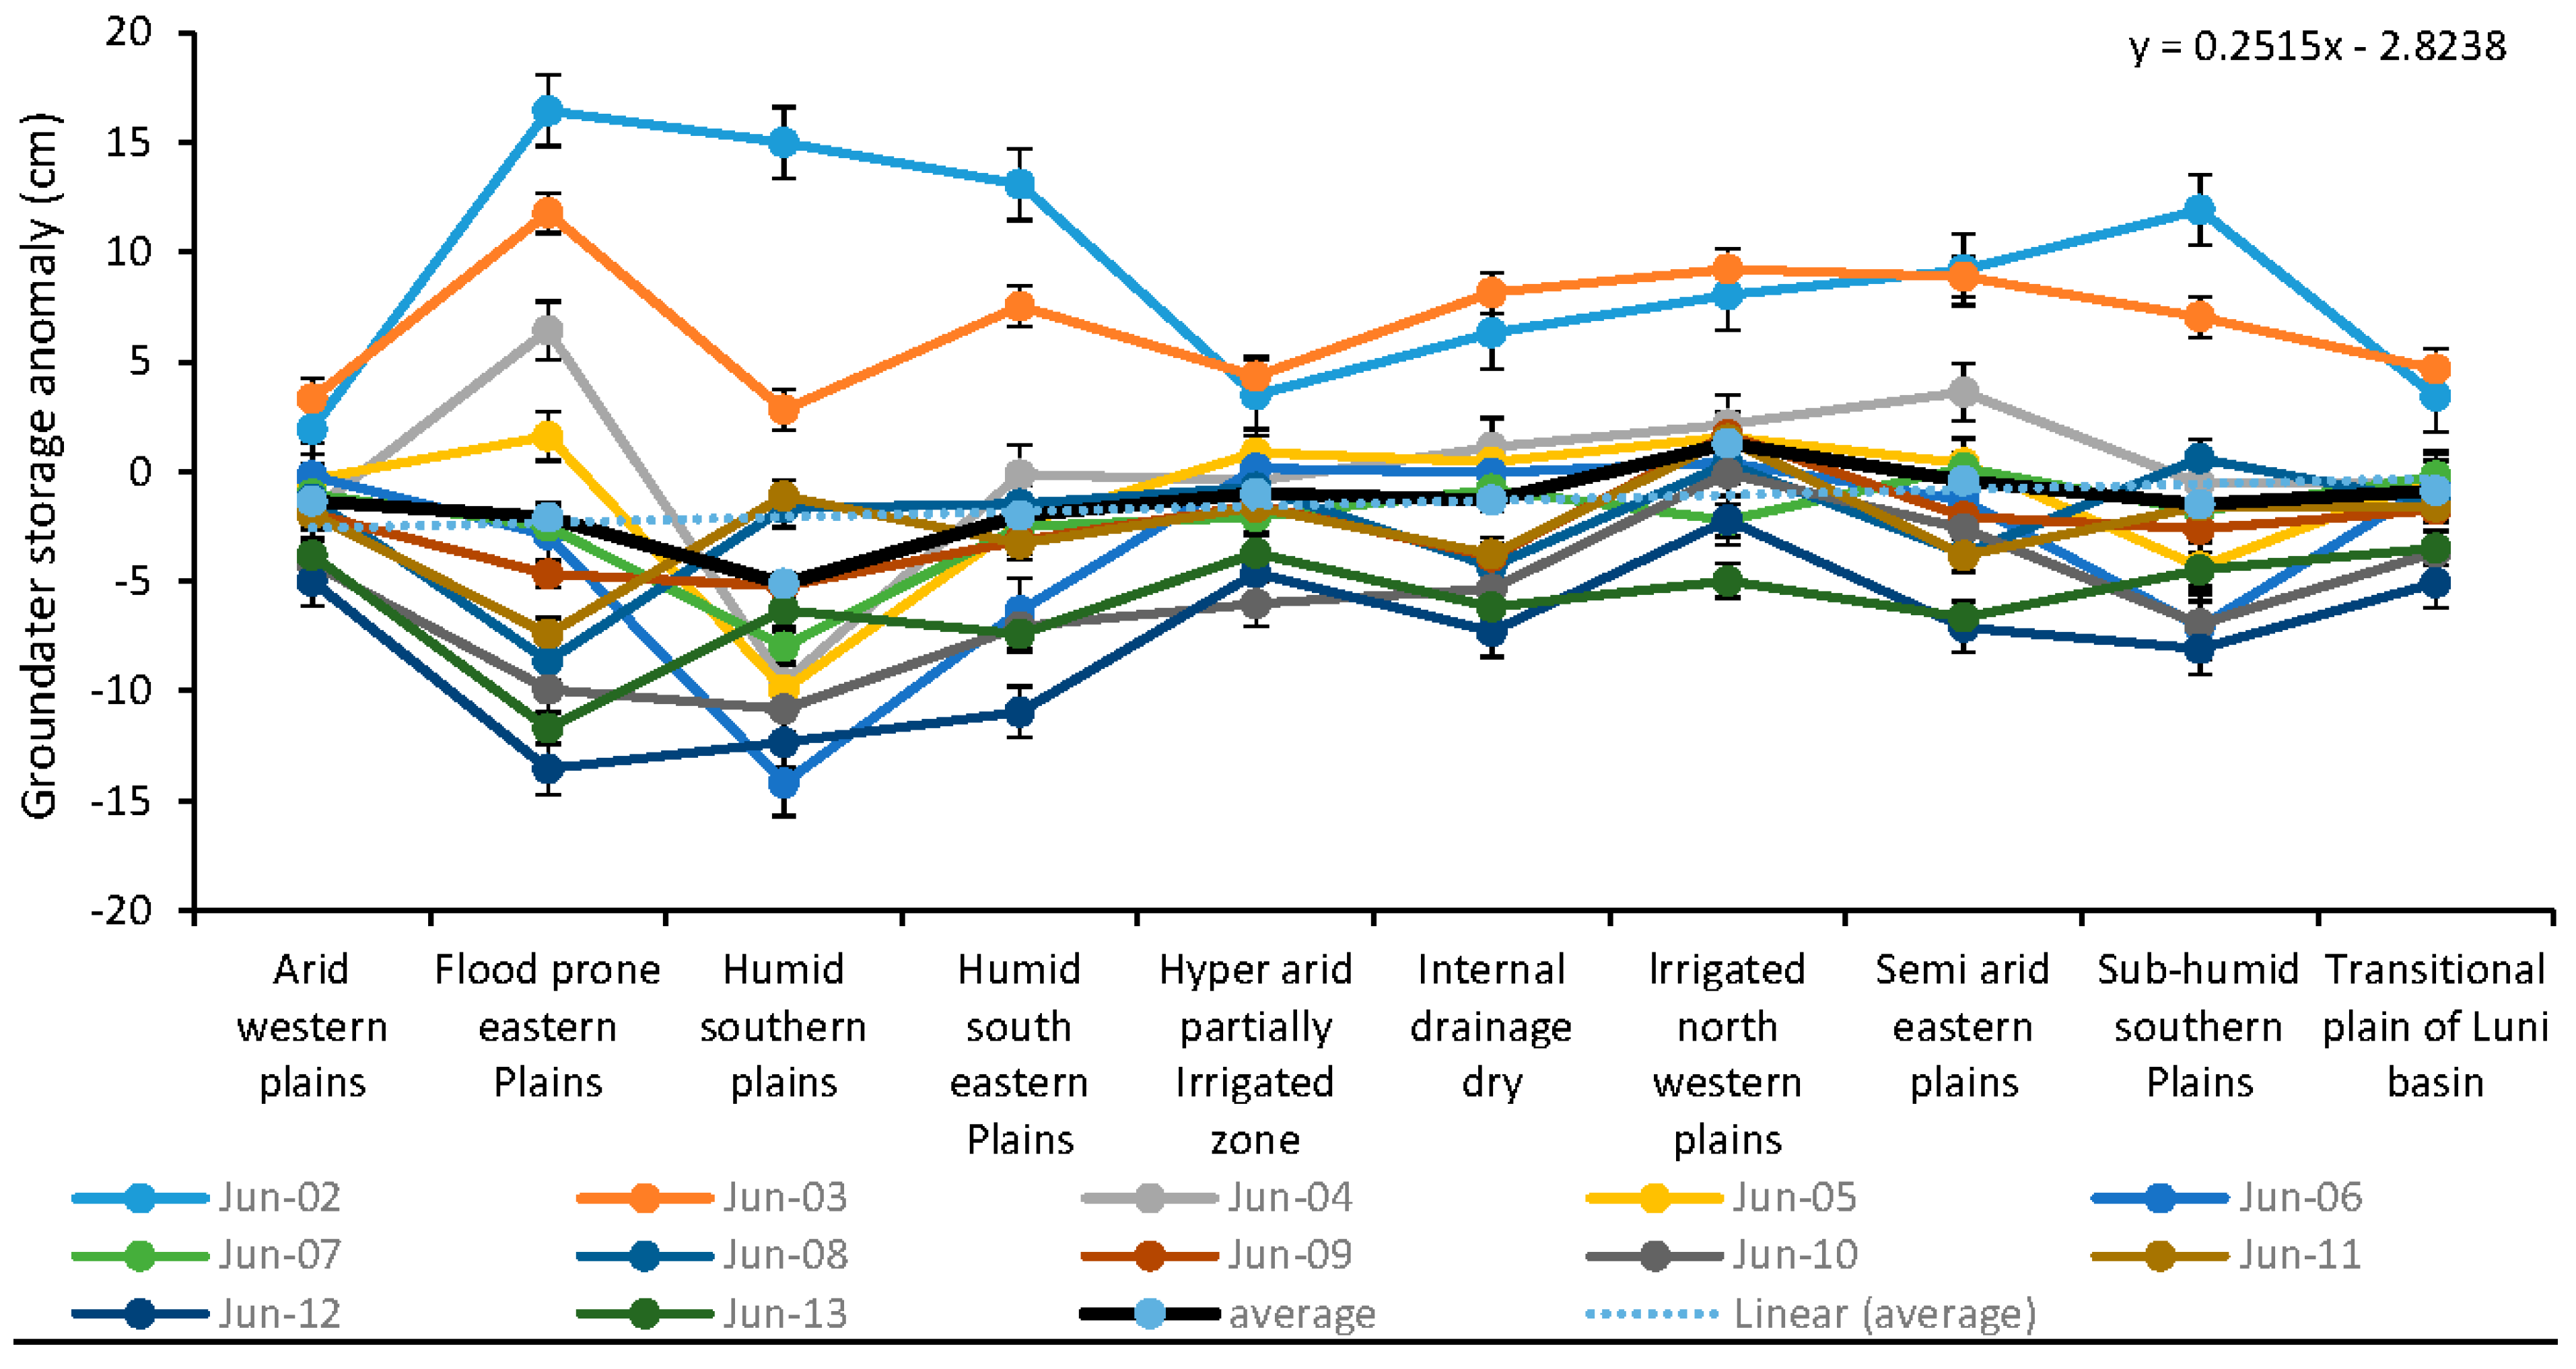
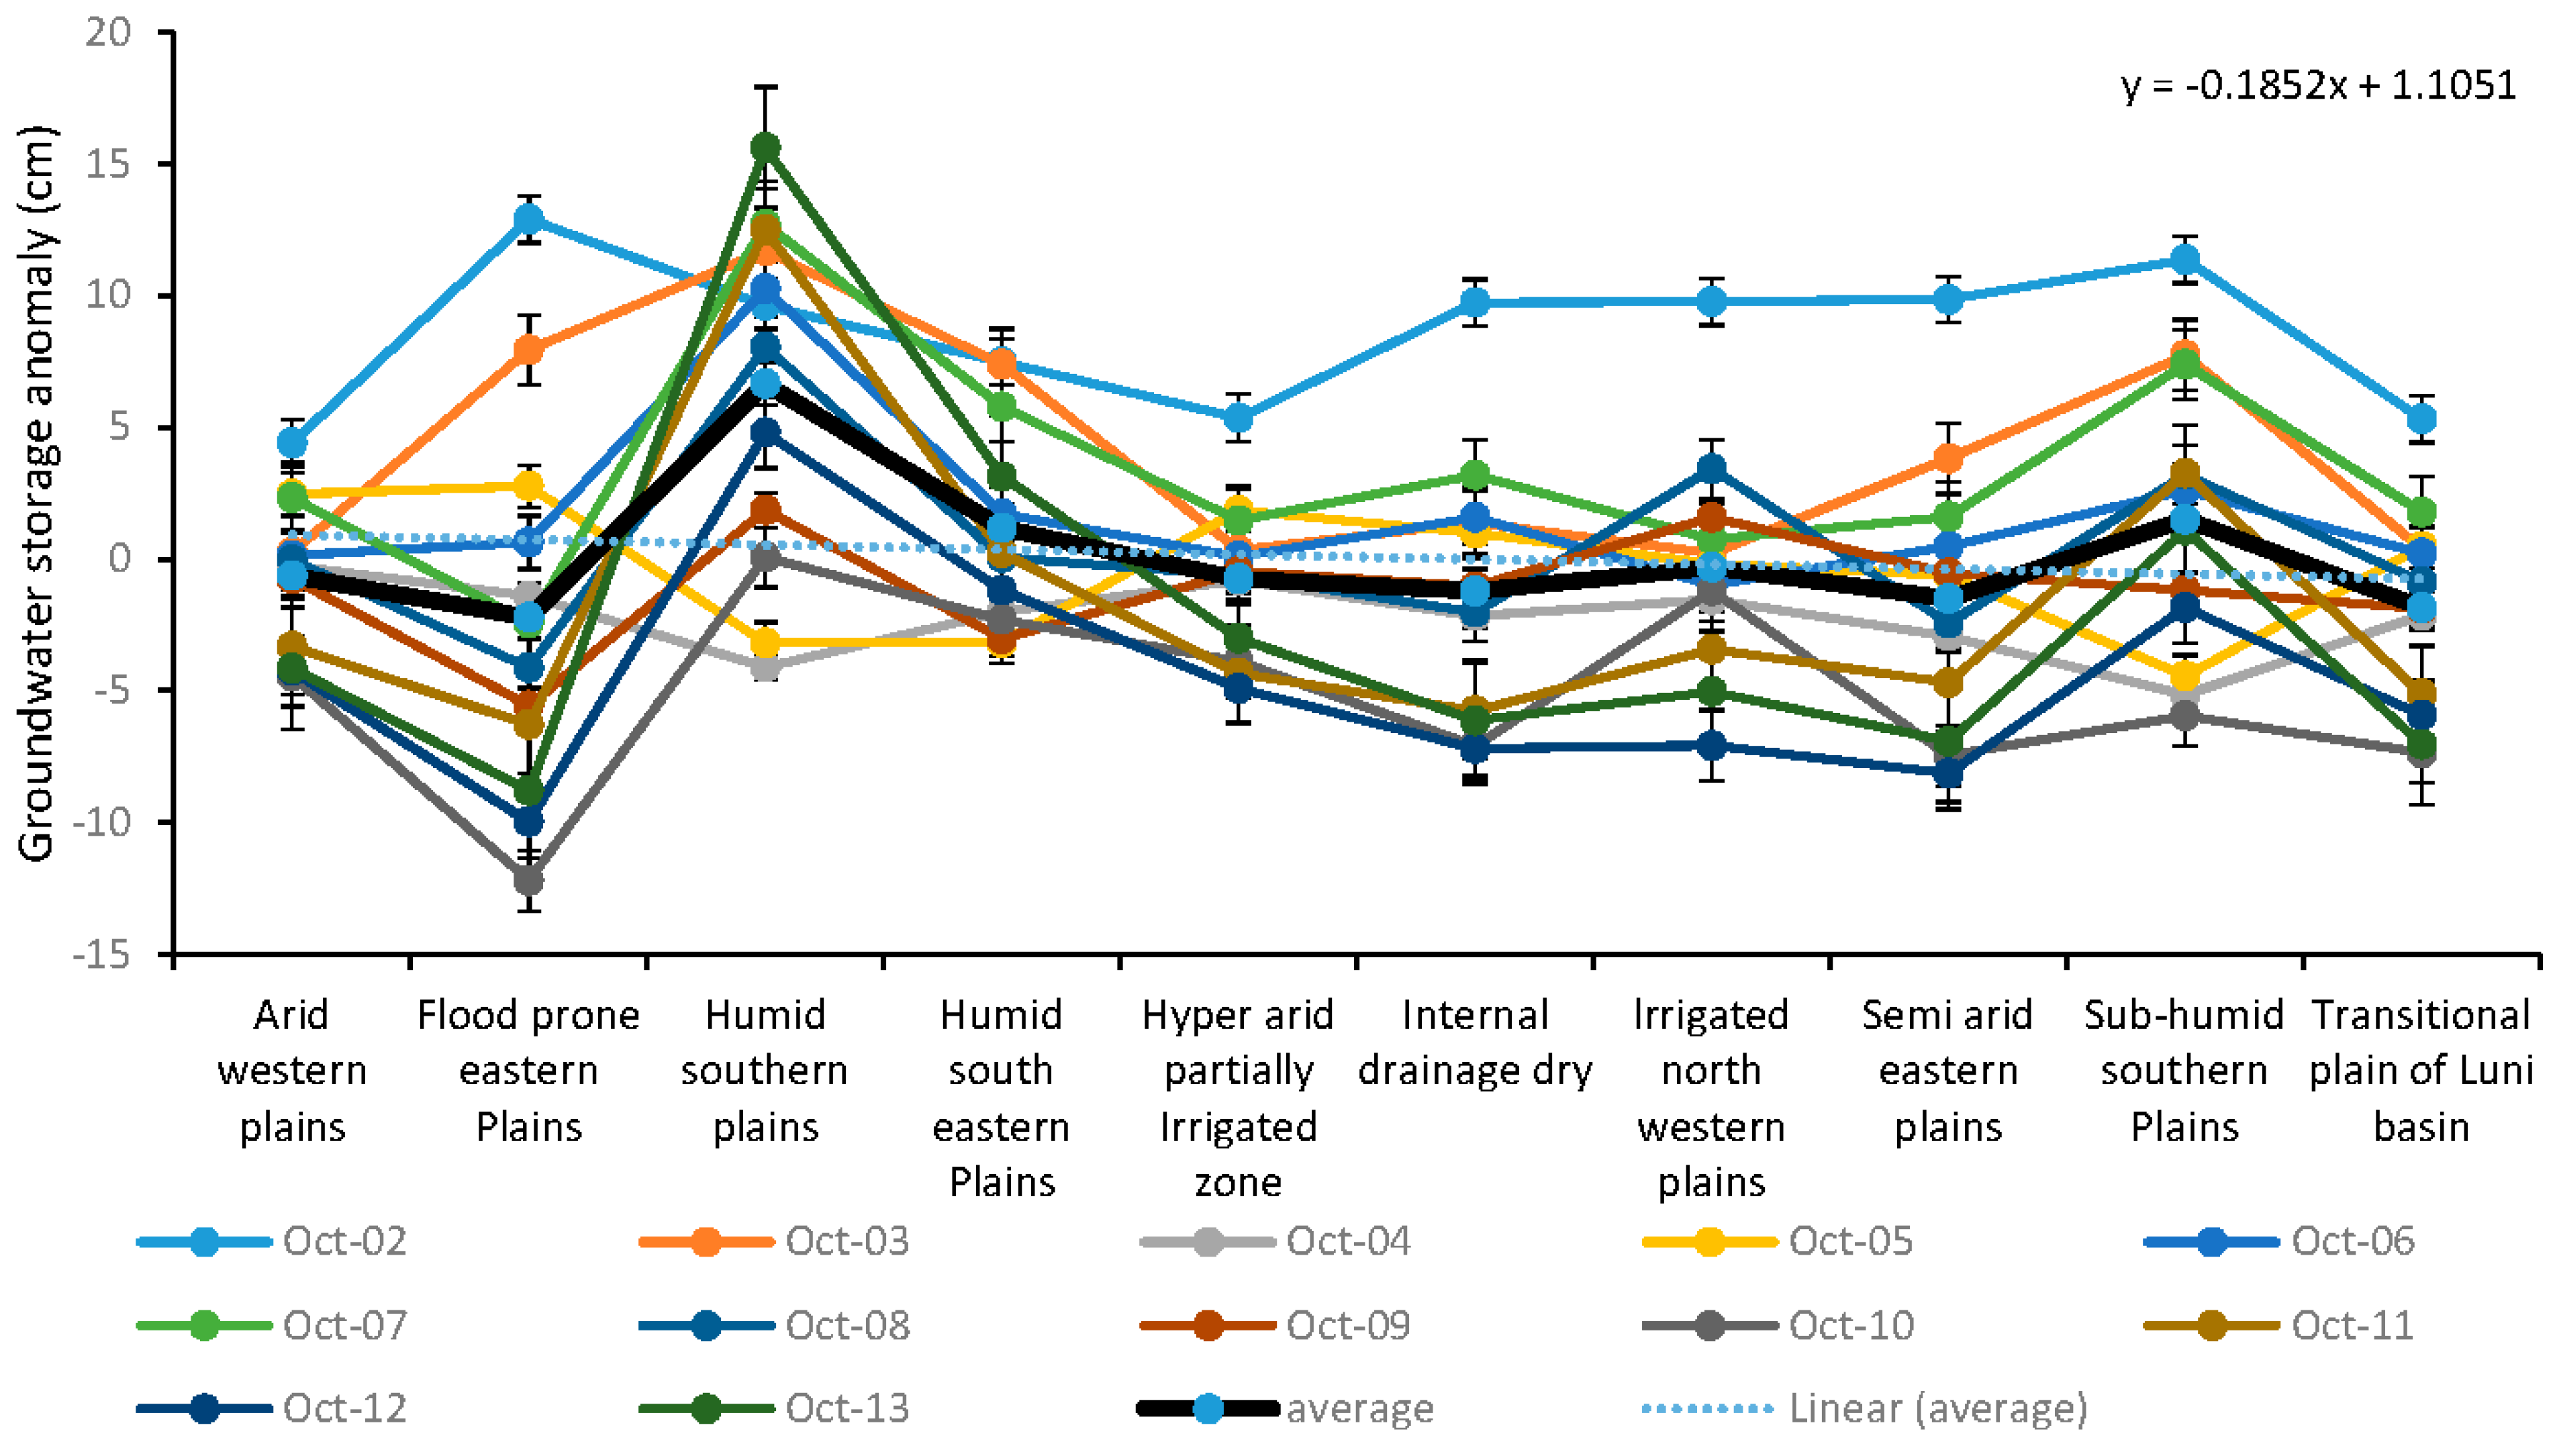
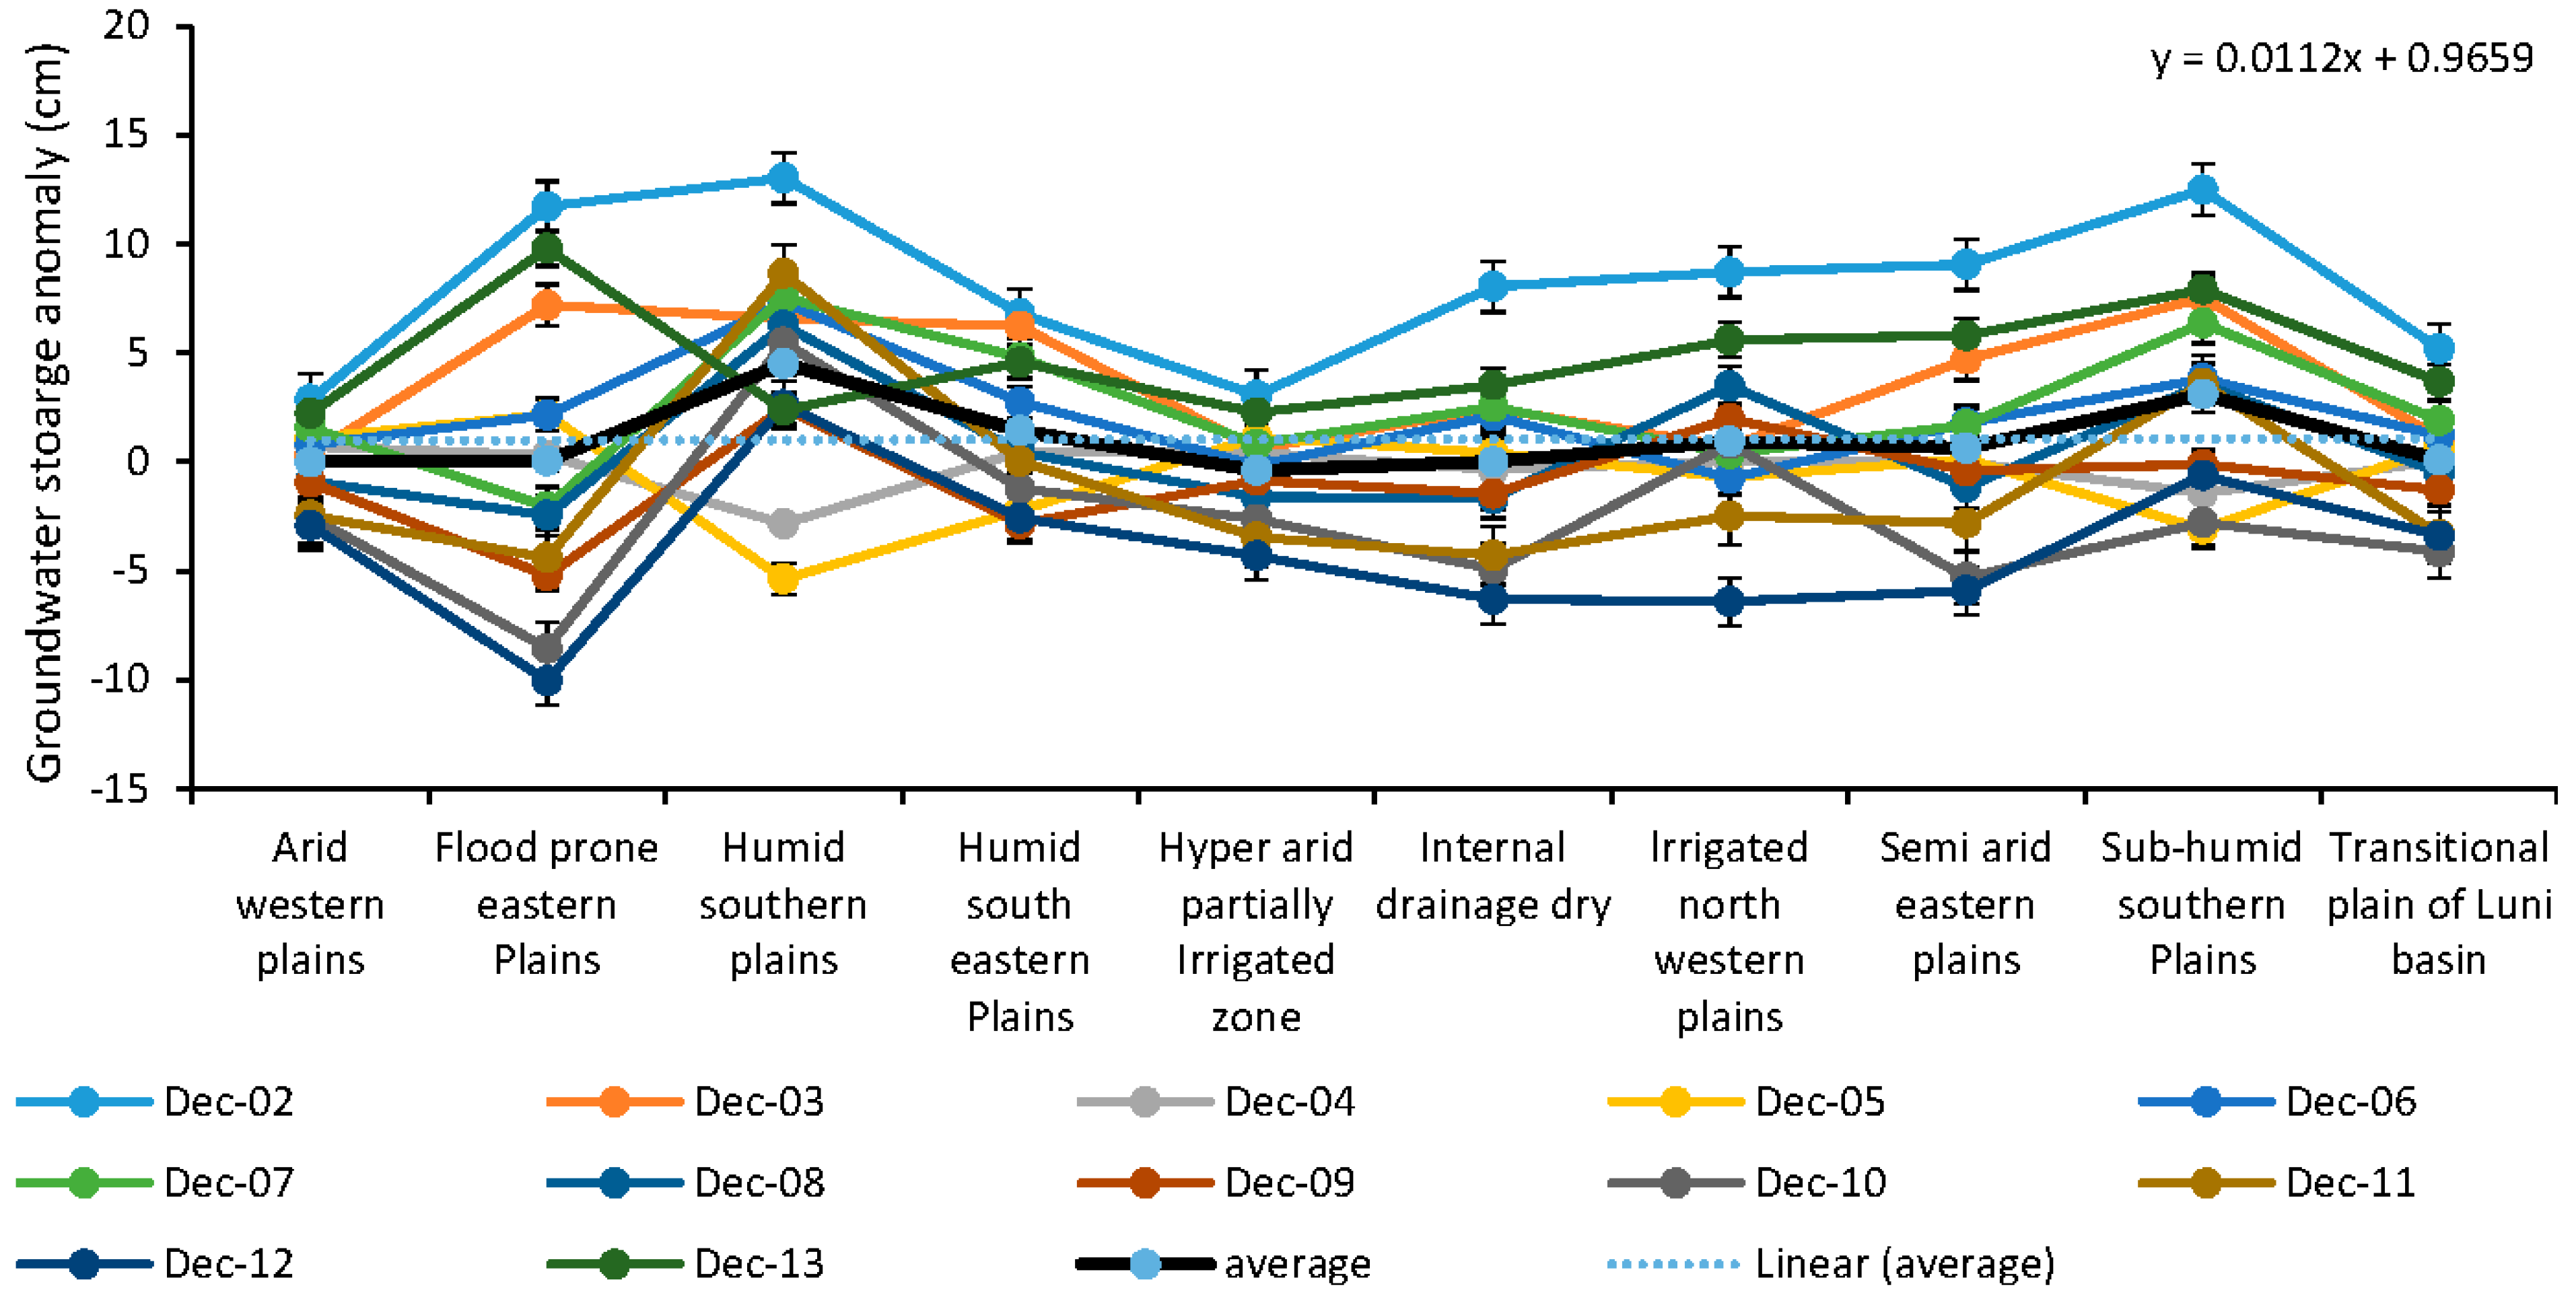
4.4. Effects of Agroclimatic Zones
4.4.1. Groundwater Storage Changes


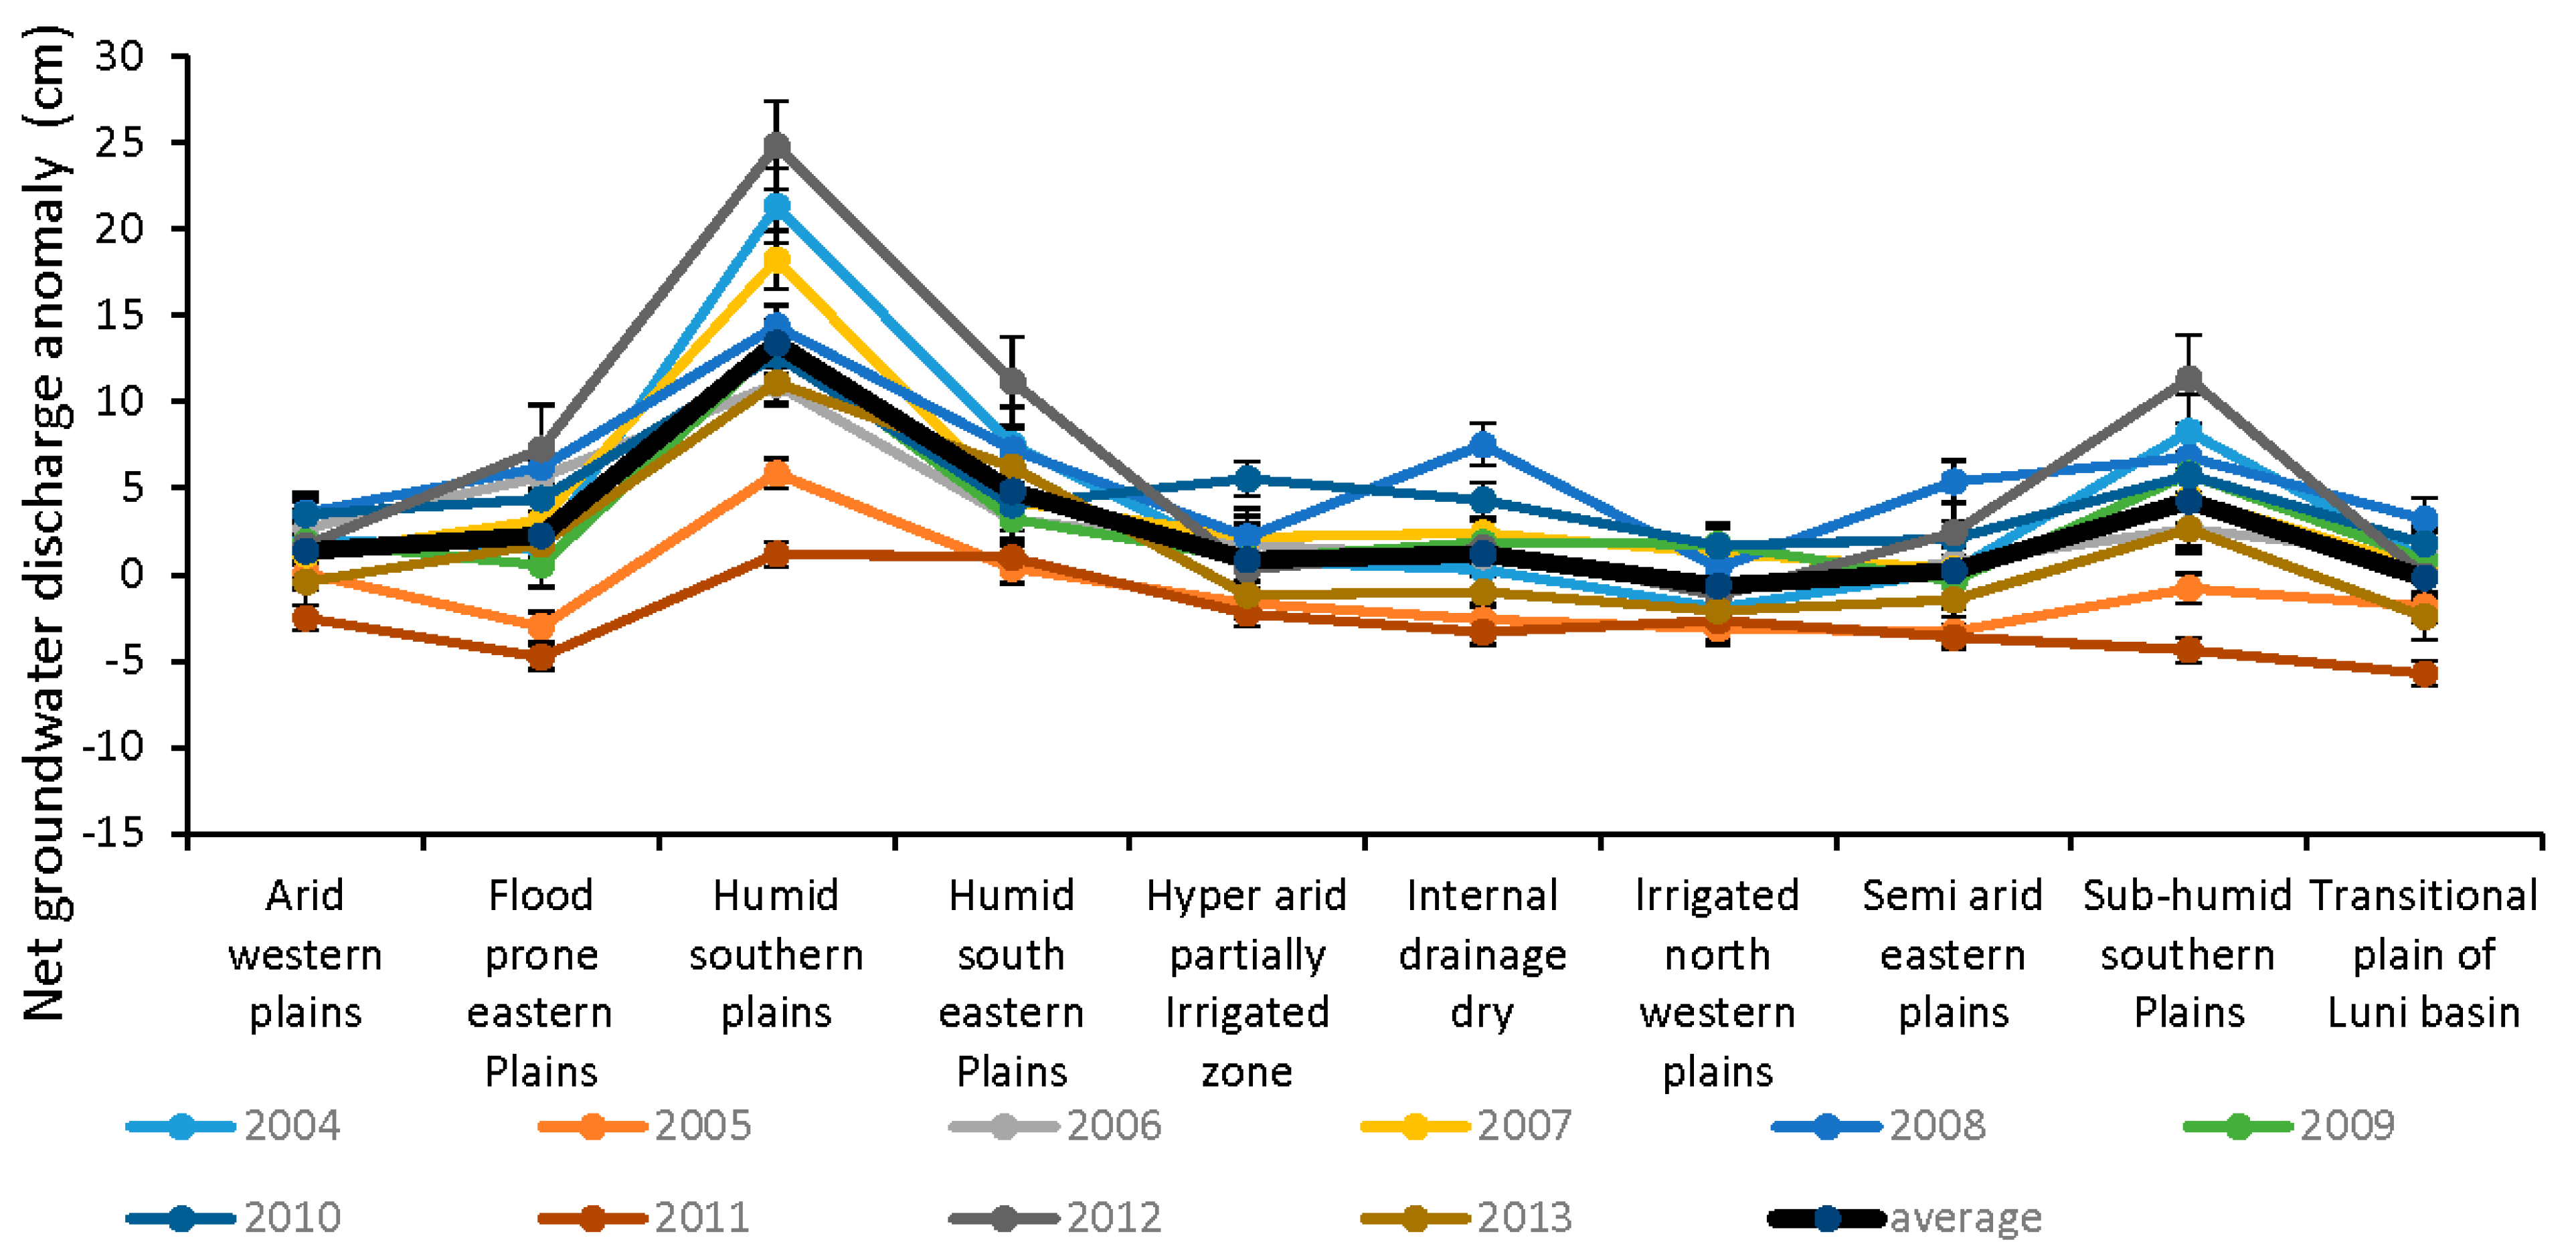
4.4.2. Groundwater Net Recharge and Net Discharge

| Agroclimatic Zones of Rajasthan | Rainfall Groundwater Recharge (BCM) | Net Groundwater Recharge (BCM) | Net Groundwater Withdrawal (BCM) |
|---|---|---|---|
| Arid western plains | 1.2 | 0.37 | 0.70 |
| Flood prone eastern Plains | 0.6 | −0.03 | 0.60 |
| Humid southern plains | 0.2 | 1.04 | 1.18 |
| Humid south eastern Plains | 0.6 | 0.77 | 1.17 |
| Hyper-arid partially Irrigated zone | 2.0 | 0.21 | 0.70 |
| Internal drainage dry | 0.6 | 0.02 | 0.31 |
| Irrigated north western plains | 0.5 | −0.33 | −0.13 |
| Semi-arid eastern plains | 0.7 | −0.32 | 0.07 |
| Sub-humid southern Plains | 1.0 | 1.28 | 1.82 |
| Transitional plain of Luni basin | 1.2 | −0.50 | −0.09 |
| Total | 8.8 | 2.5 | 6.3 |
4.5. Groundwater Management and Gravity Recovery and Climate Experiment (GRACE)
5. Conclusions
Acknowledgments
Author Contributions
Conflicts of Interest
References
- Singh, S.; James, A.J.; Ratna Reddy, V.; Marothia Janet, D.K. European Union State Partnership Programme Special Studies Series Rajasthan Study 2 IWRM and Local Level Planning in Rajasthan; Institute of Development Studies: Jaipur, India, 2012; p. 60. [Google Scholar]
- Kerr, J. Watershed Management: Lessons from Common Property Theory. Int. J. Commons 2007, 1, 89–109. [Google Scholar]
- Rathore, M.S. State Level Analysis of Drought Policies and Impacts in Rajasthan, India; Working paper 93: Drought Series Paper No. 6; IWMI: Colombo, Sri Lanka, 2005; p. 40. [Google Scholar]
- Rathore, M.S. Groundwater Exploration and Augmentation Efforts in Rajasthan—A Review; Institute of Development Studies: Jaipur, India, 2005; p. 33. [Google Scholar]
- Ratna Reddy, V.; Rout, S.K.; Chiranjeevi, T. Impact Assessment of Watershed Development Projects in Rajasthan; Livelihoods and Natural Resource Management Institute: Hyderabad, India, 2010; p. 151. [Google Scholar]
- Department of Agriculture, Government of Rajasthan. Rajasthan Agriculture Competitiveness Project; Social Assessment and Management Framework; Government of Rajasthan: Jaipur, India, 2012; p. 218.
- Gupta, S. Worlds apart? Challenges of multi-agency partnership in participatory watershed development in Rajasthan, India. Dev. Stud. Res.: Open Access J. 2014, 1, 100–112. [Google Scholar] [CrossRef]
- Chinnasamy, P.; Hubbart, J.A.; Agoramoorthy, G. Using Remote Sensing Data to Improve Groundwater Supply Estimations in Gujarat, India. Earth Interact. 2013, 17, 1–17. [Google Scholar] [CrossRef]
- Rodell, M.; Velicogna, I.; Famiglietti, J.S. Satellite-based estimates of groundwater depletion in India. Nature 2009, 460, 999–1002. [Google Scholar] [CrossRef] [PubMed]
- Yeh, P.J.-F.; Swenson, S.C.; Famiglietti, J.S.; Rodell, M. Remote sensing of groundwater storage changes in Illinois using the Gravity Recovery and Climate Experiment (GRACE). Water Resour. Res. 2006, 42. [Google Scholar] [CrossRef]
- Chinnasamy, P.; Agoramoorthy, G. Groundwater storage and depletion trends in Tamil Nadu State, India. Water Resour. Manag. 2015, 29, 2139–2152. [Google Scholar] [CrossRef]
- Tregoning, P.; McClusky, S.; van Dijk, A.I.J.M.; Crosbie, R.S.; Peña-Arancibia, J.L. Assessment of GRACE Satellites for Groundwater Estimation in Australia; Waterlines report; National Water Commission: Canberra, Australia, 2012; p. 82. [Google Scholar]
- GRACE Data. Available online: ftp://podaac-ftp.jpl.nasa.gov/allData/tellus/L3/land_mass/RL05 (accessed on 25 December 2014).
- Landerer, F.; Swenson, S. Accuracy of scaled GRACE terrestrial water storage estimates. Water Resour. Res 2012, 48. [Google Scholar] [CrossRef]
- Tiwari, V.; Wahr, J.; Swenson, S.; Rao, A.; Singh, B.; Sudarshan, G. Land water storage variation over Southern India from space gravimetry. Curr. Sci. 2011, 101, 536–540. [Google Scholar]
- Huang, Z.; Pan, Y.; Gong, H.; Yeh, P.J.-F.; Li, X.; Zhou, D.; Zhao, W. Subregional-scale groundwater depletion detected by GRACE for both shallow and deep aquifers in North China Plain. Geophys. Res. Lett. 2015, 42, 1791–1799. [Google Scholar] [CrossRef]
- Billah, M.M.; Goodall, J.L.; Narayan, U.; Reager, J.T.; Lakshmi, V.; Famiglietti, J.S. A methodology for evaluating evapotranspiration estimates at the watershed-scale using GRACE. J. Hydrol. 2015, 523, 574–586. [Google Scholar] [CrossRef]
- Cheng, M.; Tapley, B.D. Variations in the Earth’s oblateness during the past 28 years. J. Geophys. Res.: Solid Earth (1978–2012) 2004, 109. [Google Scholar] [CrossRef]
- Swenson, S.; Chambers, D.; Wahr, J. Estimating geocenter variations from a combination of GRACE and ocean model output. J. Geophys. Res.: Solid Earth (1978–2012) 2008, 113. [Google Scholar] [CrossRef]
- Geruo, A.; Wahr, J.; Zhong, S. Computations of the viscoelastic response of a 3-D compressible Earth to surface loading: An application to Glacial Isostatic Adjustment in Antarctica and Canada. Geophys. J. Int. 2013, 192, 557–572. [Google Scholar]
- Rodell, M.; Chen, J.; Kato, H.; Famiglietti, J.S.; Nigro, J.; Wilson, C.R. Estimating groundwater storage changes in the Mississippi River basin (USA) using GRACE. Hydrogeol. J. 2007, 15, 159–166. [Google Scholar] [CrossRef]
- Rodell, M.; Famiglietti, J. The potential for satellite-based monitoring of groundwater storage changes using GRACE: The High Plains aquifer, Central US. J. Hydrol. 2002, 263, 245–256. [Google Scholar] [CrossRef]
- Rodell, M.; Houser, P.R.; Jambor, U.; Gottschalck, J.; Mitchell, K.; Meng, C.-J.; Arsenault, K.; Cosgrove, B.; Radakovich, J.; Bosilovich, M. The global land data assimilation system. Bull. Am. Meteorol. Soc. 2004, 85. [Google Scholar] [CrossRef]
- GLDAS Data. Available online: http://ldas.gsfc.nasa.gov/gldas (accessed on 25 December 2014).
- Chinnasamy, P.; Sunde, M.G. Improving spatiotemporal groundwater estimates after natural disasters using remotely sensed data—A case study of the Indian Ocean Tsunami. Earth Sci. Inf. 2015, 2015. [Google Scholar] [CrossRef]
- Chinnasamy, P.; Misra, G.; Shah, T.; Maheshwari, B.; Prathapar, S. Evaluating the effectiveness of water infrastructures for increasing groundwater recharge and agricultural production—A case study of Gujarat, India. Agric. Water Manag. 2015, 158, 179–188. [Google Scholar] [CrossRef]
- Cai, L.; Prathapar, S.A.; Beecher, G. Modelling leaching and recharge in a bare transitional red brown earth ponded with low salinity water in summer. Aust. J. Exp. Agric. 1994, 34, 1085–1092. [Google Scholar] [CrossRef]
- Bhat, G.S. The Indian drought of 2002—A sub-seasonal phenomenon? Q. J. R. Meteorol. Soc. 2006, 132, 2583–2602. [Google Scholar] [CrossRef]
- Central Ground Water Board (CGWB). Ground Water Year Book; Report from the Ministry of Water Resources; Government of India: Delhi, India, 2014.
- Groundwater Estimation Committee (GEC). Groundwater Resource Estimation Methodology; Report of Groundwater Resource Estimation Committee, Ministry of Water Resources; Government of India: New Delhi, India, 1997; p. 107.
- Groundwater Resource Estimation Committee (GEC). Ground Water Resource Estimation Methodology; India Ministry of Water Resources Report; India Ministry of Water Resources: Delhi, India, 2009; p. 107.
- Maheshwari, B.; Varua, M.; Ward, J.; Packham, R.; Chinnasamy, P.; Dashora, Y.; Dave, S.; Soni, P.; Dillon, P.; Purohit, R.; et al. The Role of Transdisciplinary Approach and Community Participation in Village Scale Groundwater Management: Insights from Gujarat and Rajasthan, India. Water 2014, 6, 3386–3408. [Google Scholar] [CrossRef]
- Wahr, J.; Swenson, S.; Velicogna, I. Accuracy of GRACE mass estimates. Geophys. Res. Lett. 2006, 33. [Google Scholar] [CrossRef]
© 2015 by the authors; licensee MDPI, Basel, Switzerland. This article is an open access article distributed under the terms and conditions of the Creative Commons Attribution license (http://creativecommons.org/licenses/by/4.0/).
Share and Cite
Chinnasamy, P.; Maheshwari, B.; Prathapar, S. Understanding Groundwater Storage Changes and Recharge in Rajasthan, India through Remote Sensing. Water 2015, 7, 5547-5565. https://doi.org/10.3390/w7105547
Chinnasamy P, Maheshwari B, Prathapar S. Understanding Groundwater Storage Changes and Recharge in Rajasthan, India through Remote Sensing. Water. 2015; 7(10):5547-5565. https://doi.org/10.3390/w7105547
Chicago/Turabian StyleChinnasamy, Pennan, Basant Maheshwari, and Sanmugam Prathapar. 2015. "Understanding Groundwater Storage Changes and Recharge in Rajasthan, India through Remote Sensing" Water 7, no. 10: 5547-5565. https://doi.org/10.3390/w7105547