
Investigation of Residence and Travel Times in a Large Floodplain Lake with Complex Lake-River Interactions: Poyang Lake (China)

Abstract
:1. Introduction
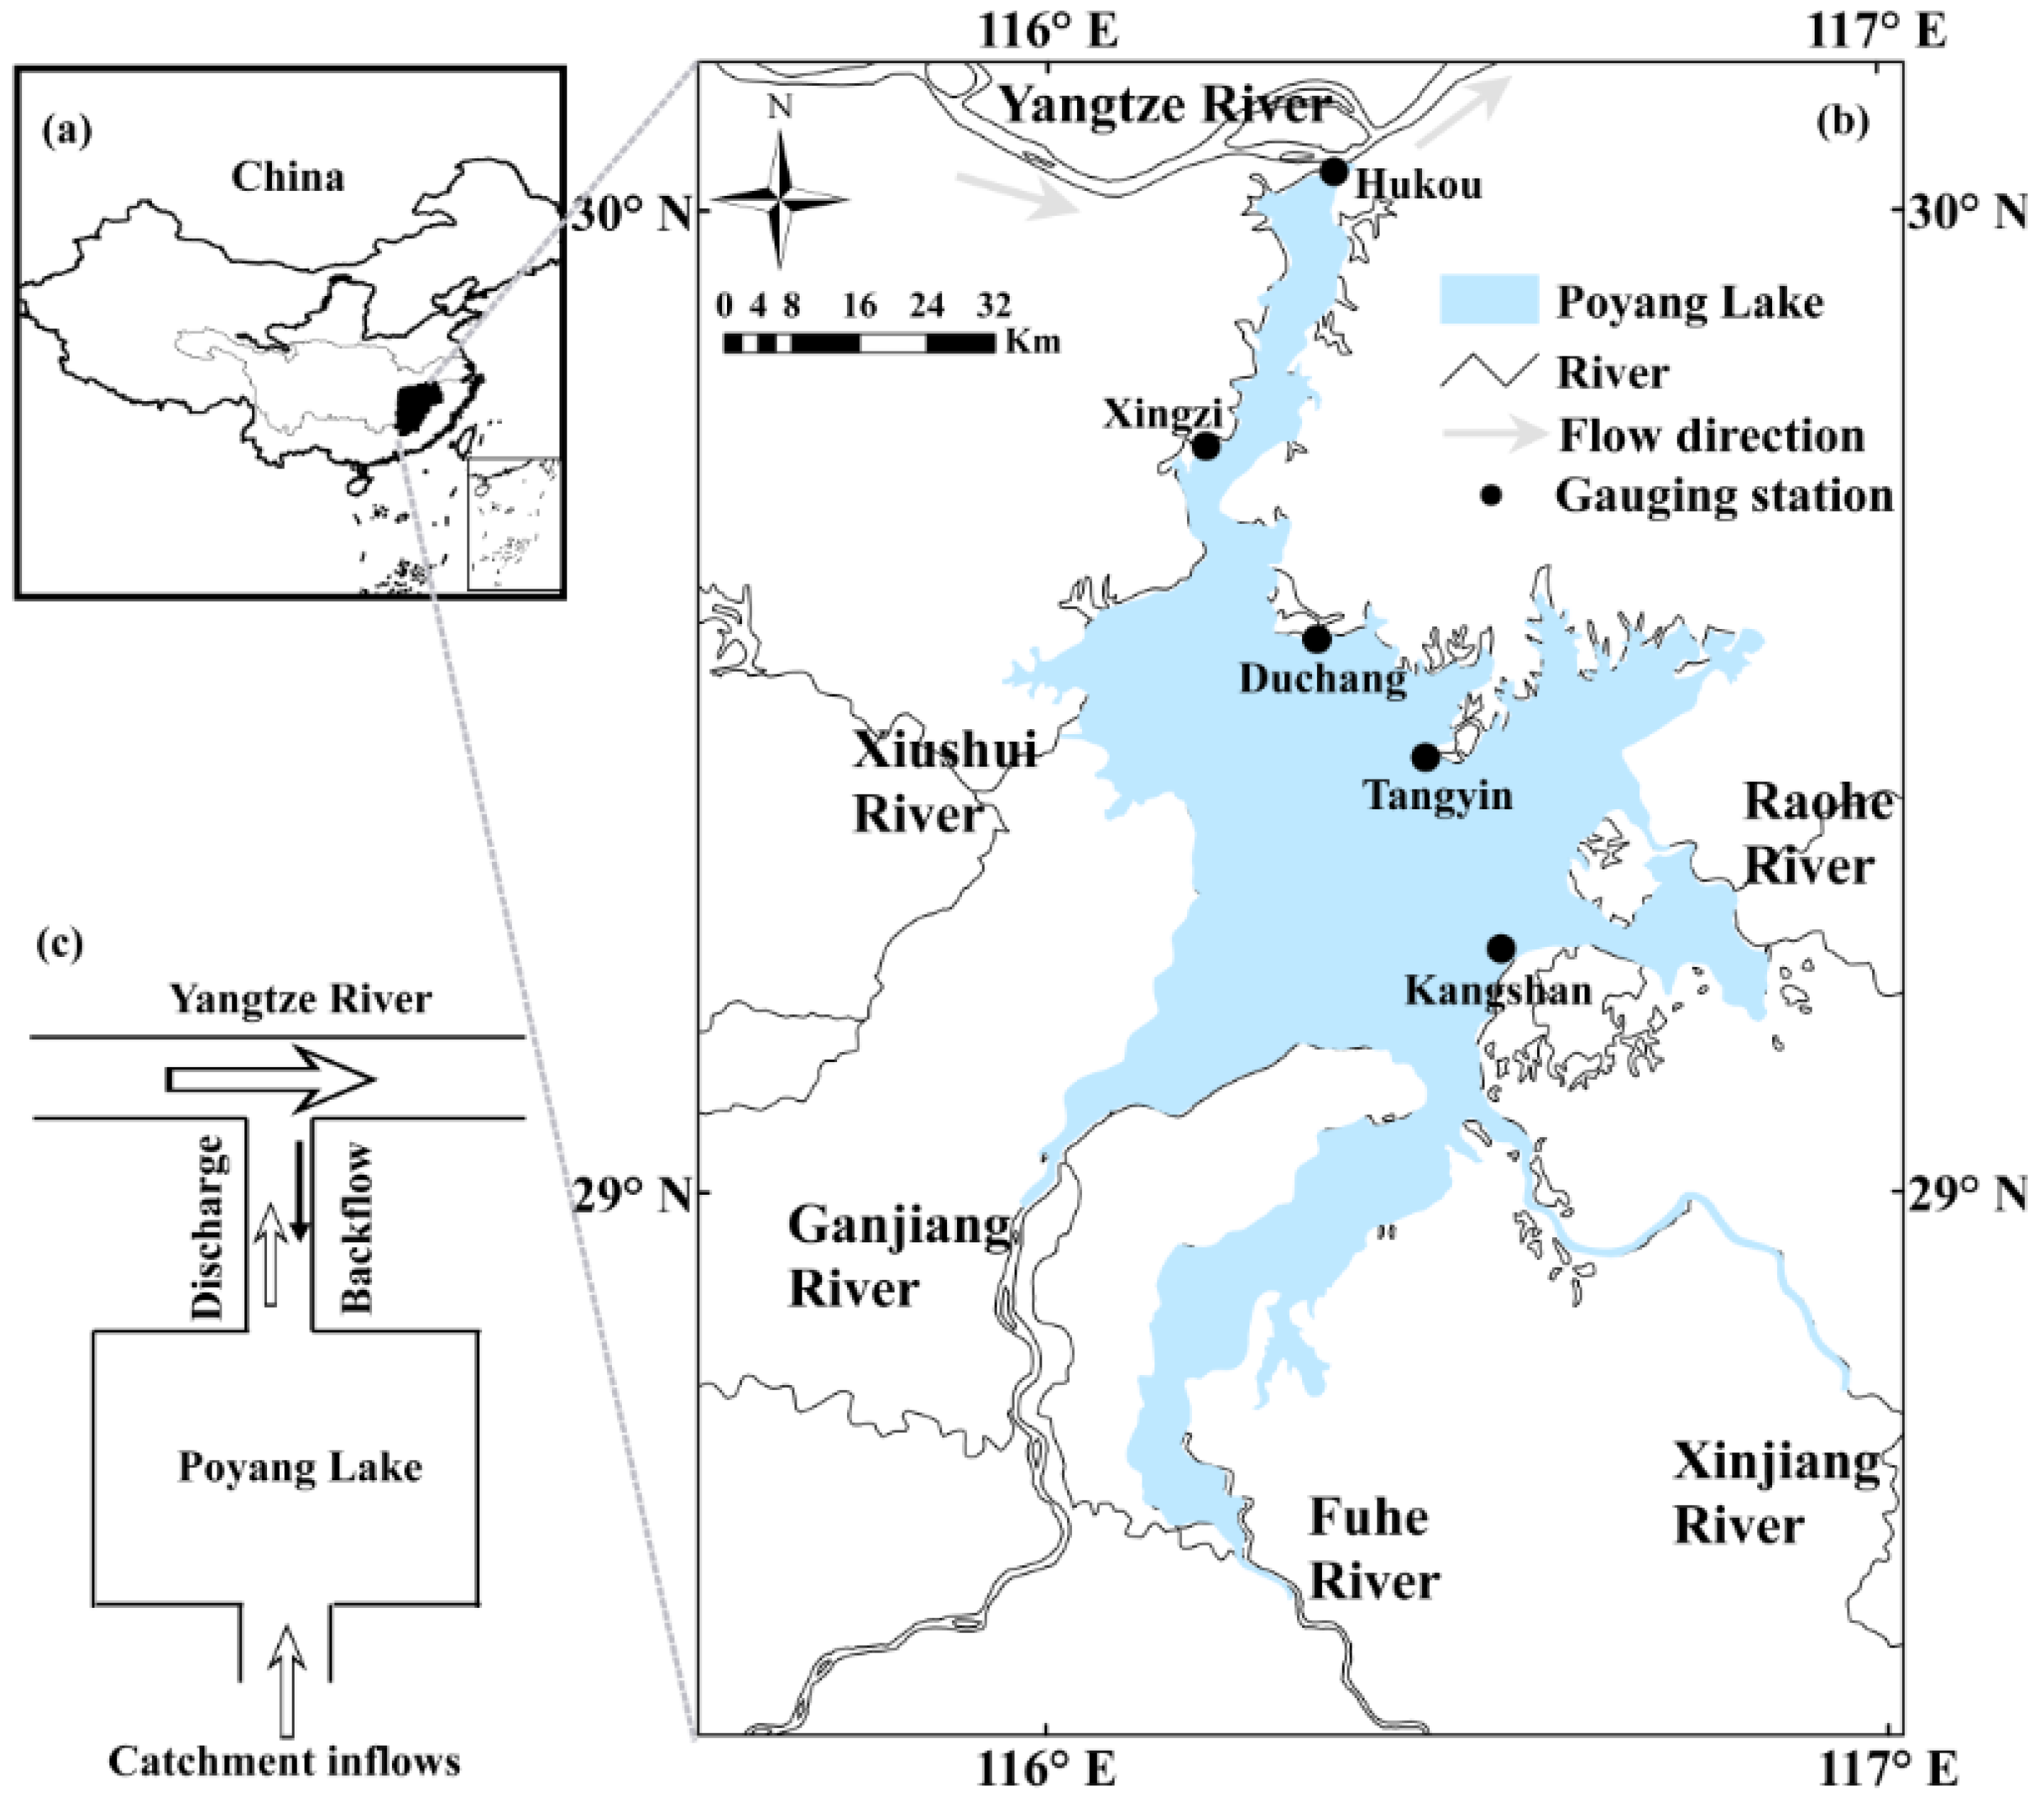
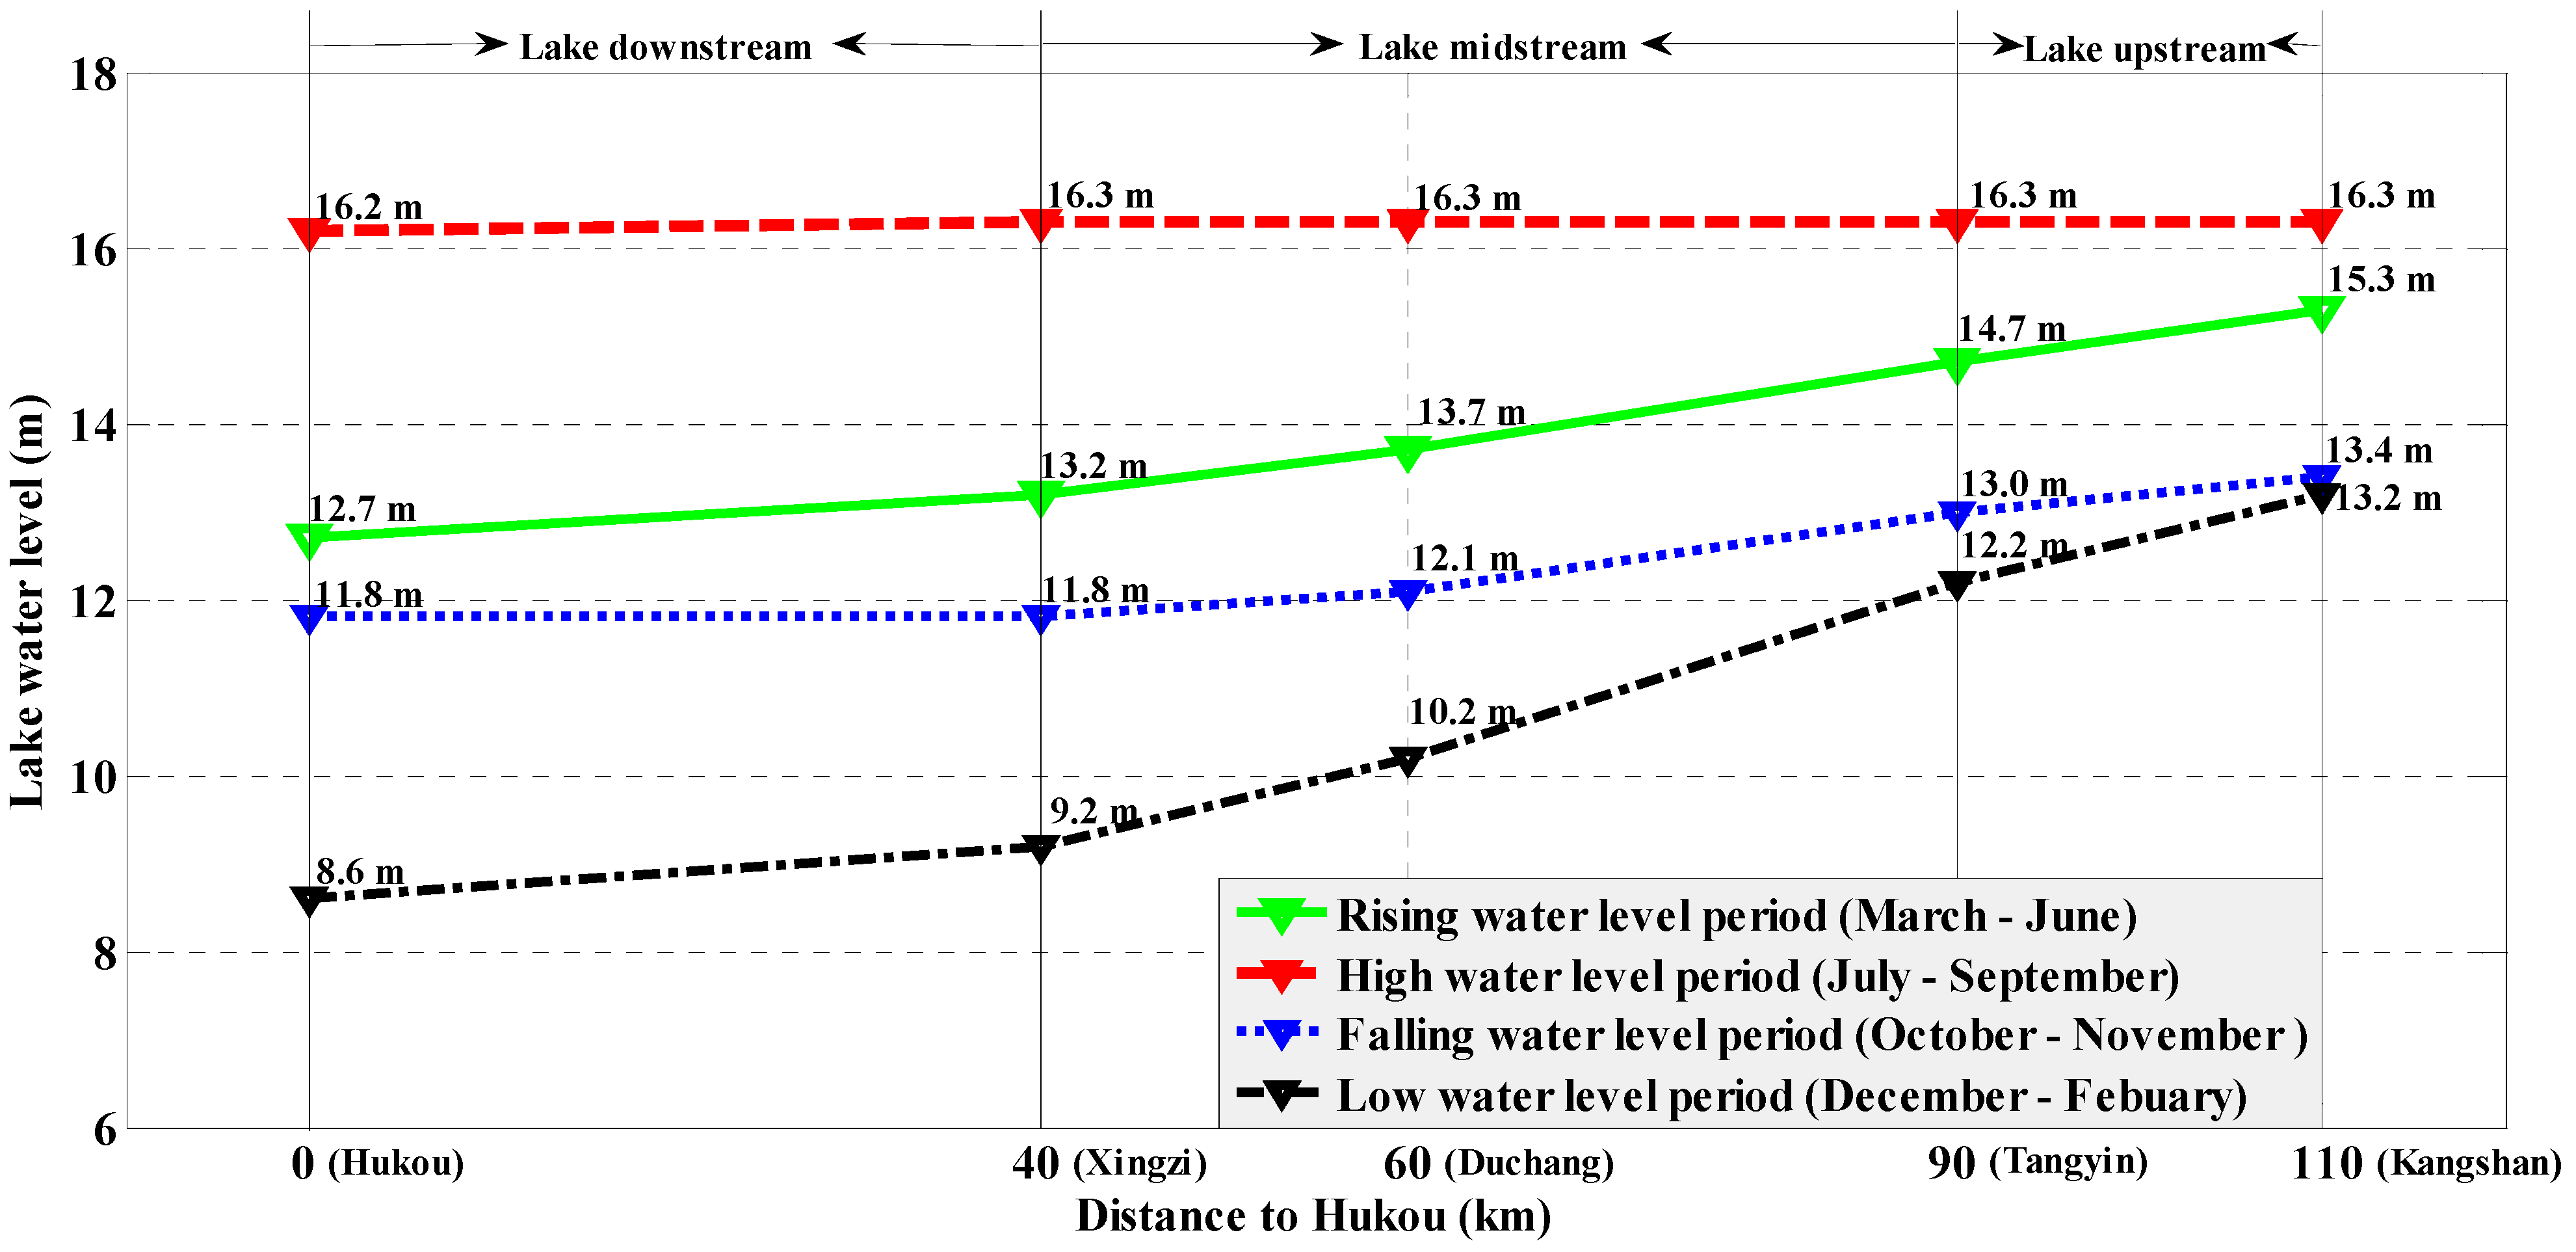
2. Study Site


3. Methodology
3.1. Hydrodynamic Model


3.2. Physical Setting of the Simulation Scenarios
4. Results and Discussion
4.1. Spatial Distribution of the Residence Time and Physical Interpretation


4.2. Frequency Distribution Curves

4.3. Travel Time for the Potential Pollution Sources and Physical Interpretation

5. Summary and Conclusions
- (1)
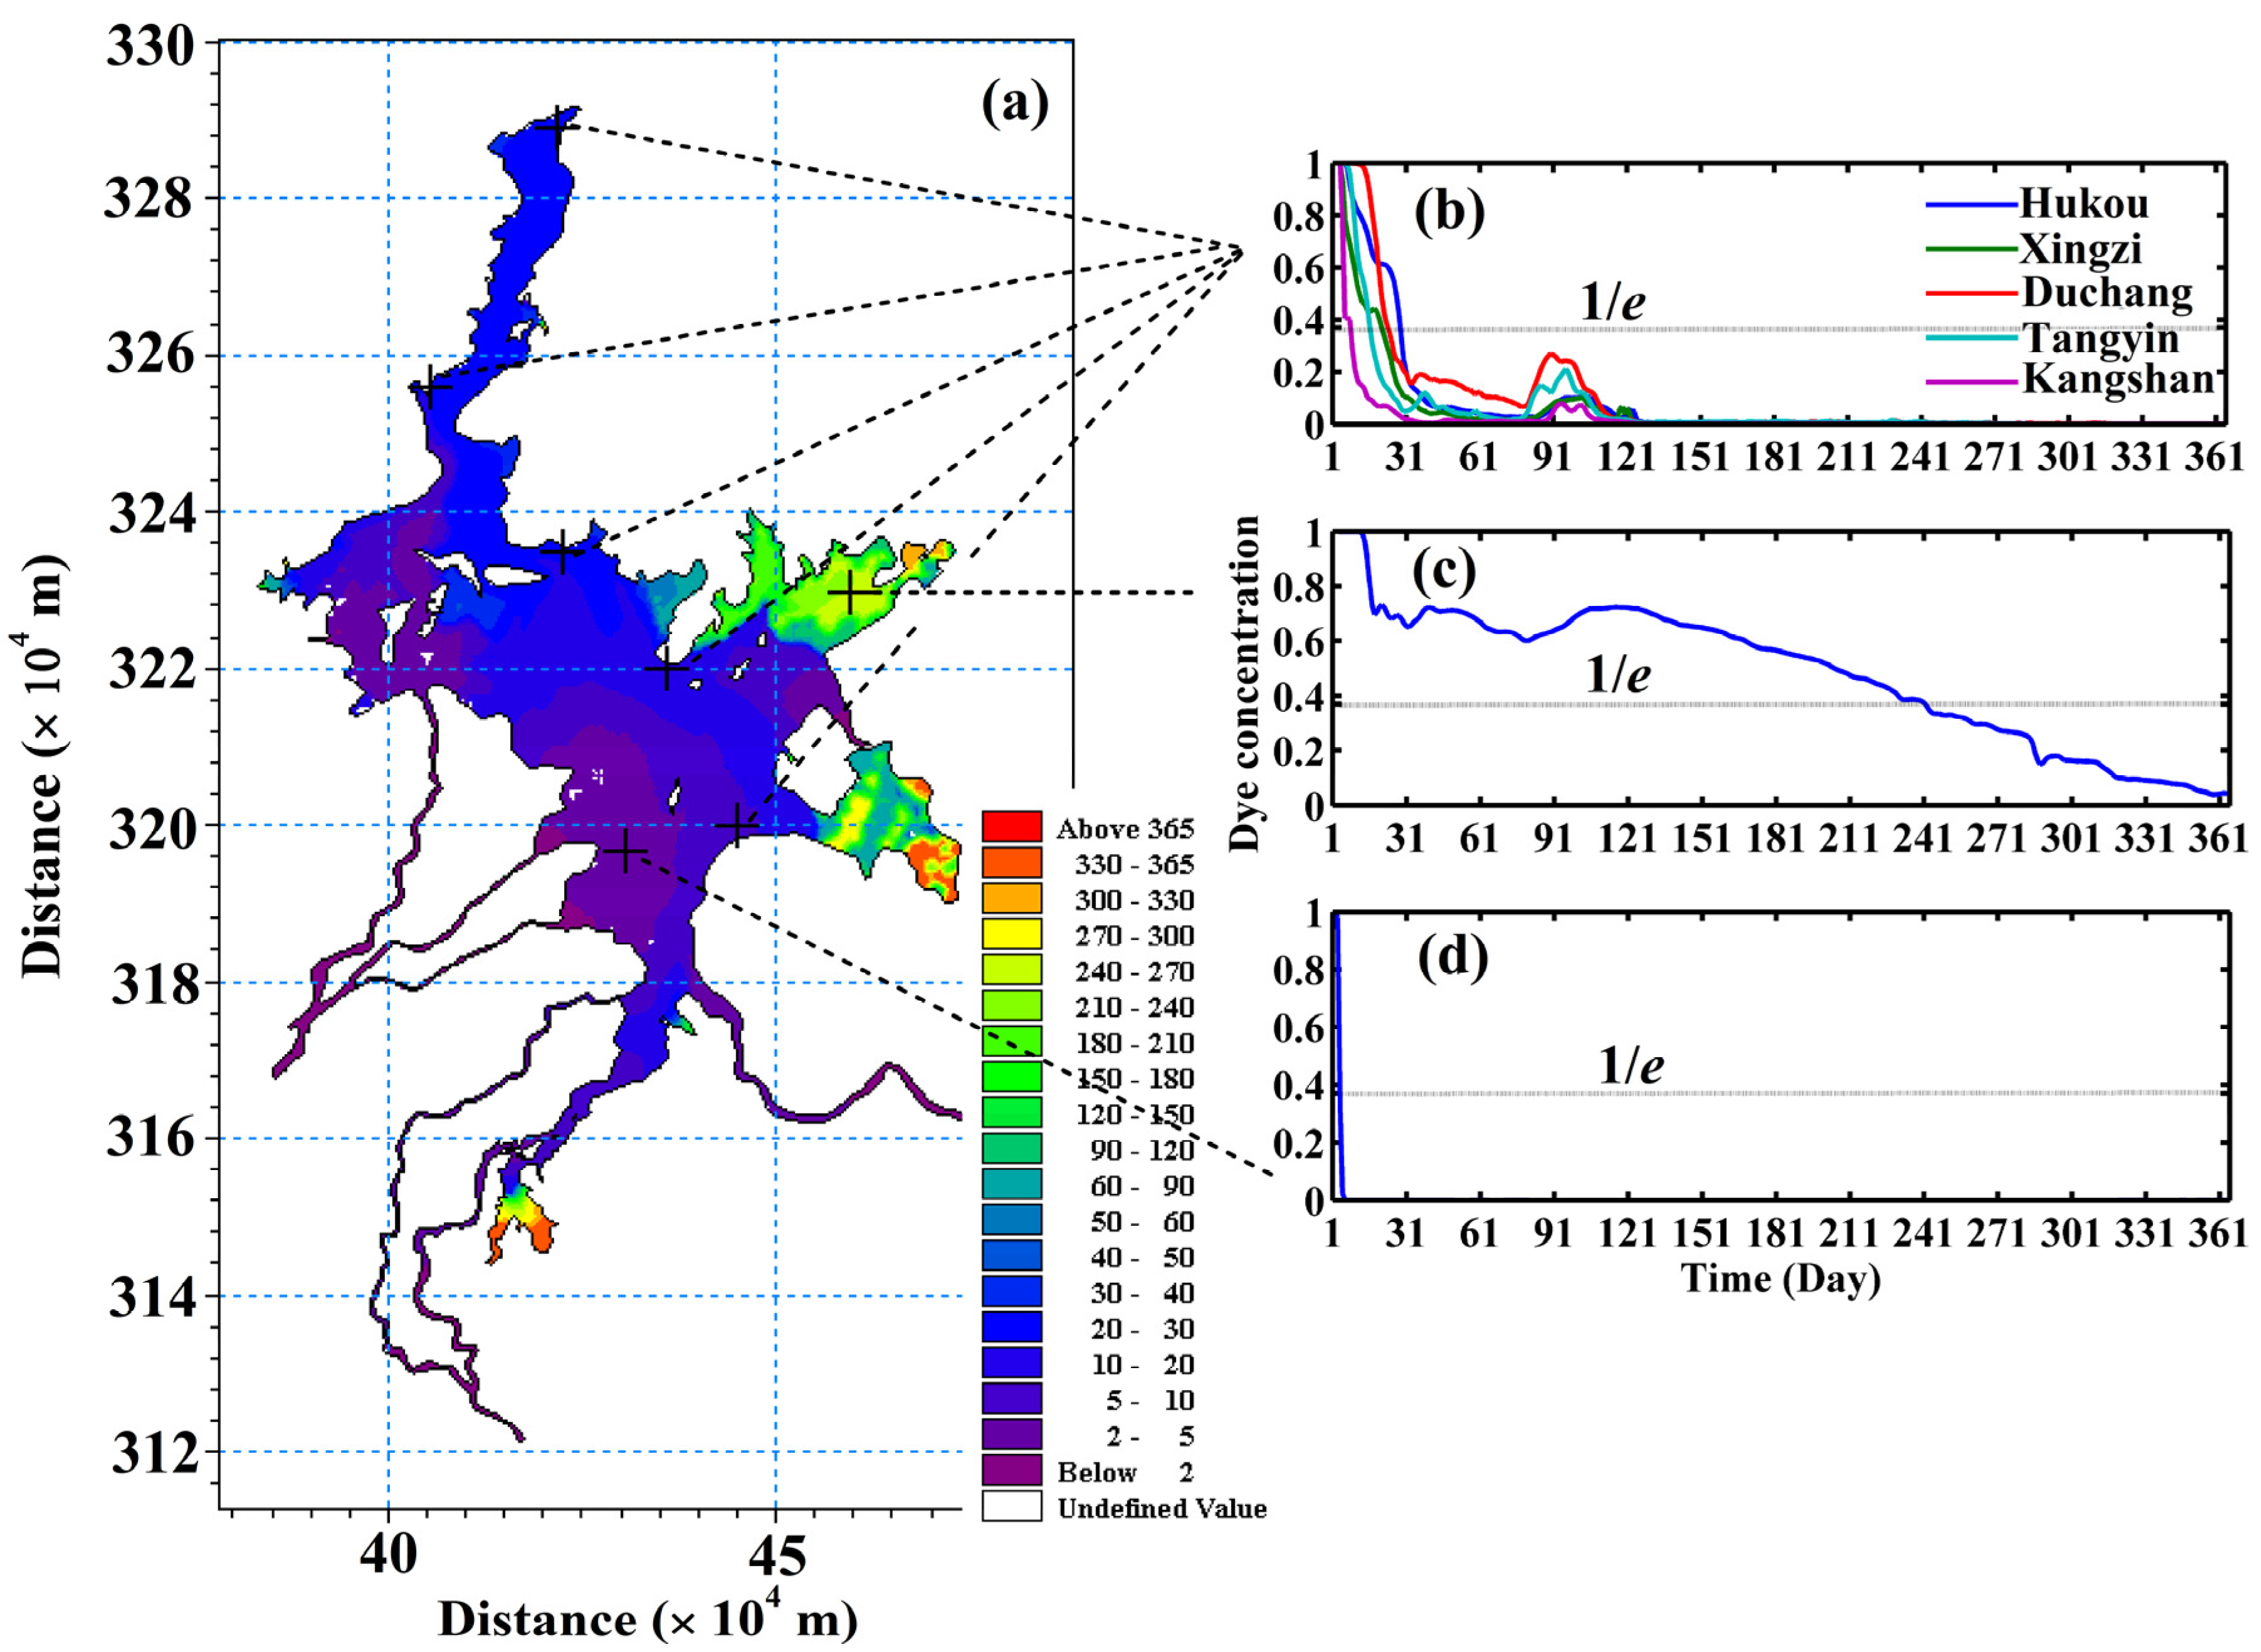
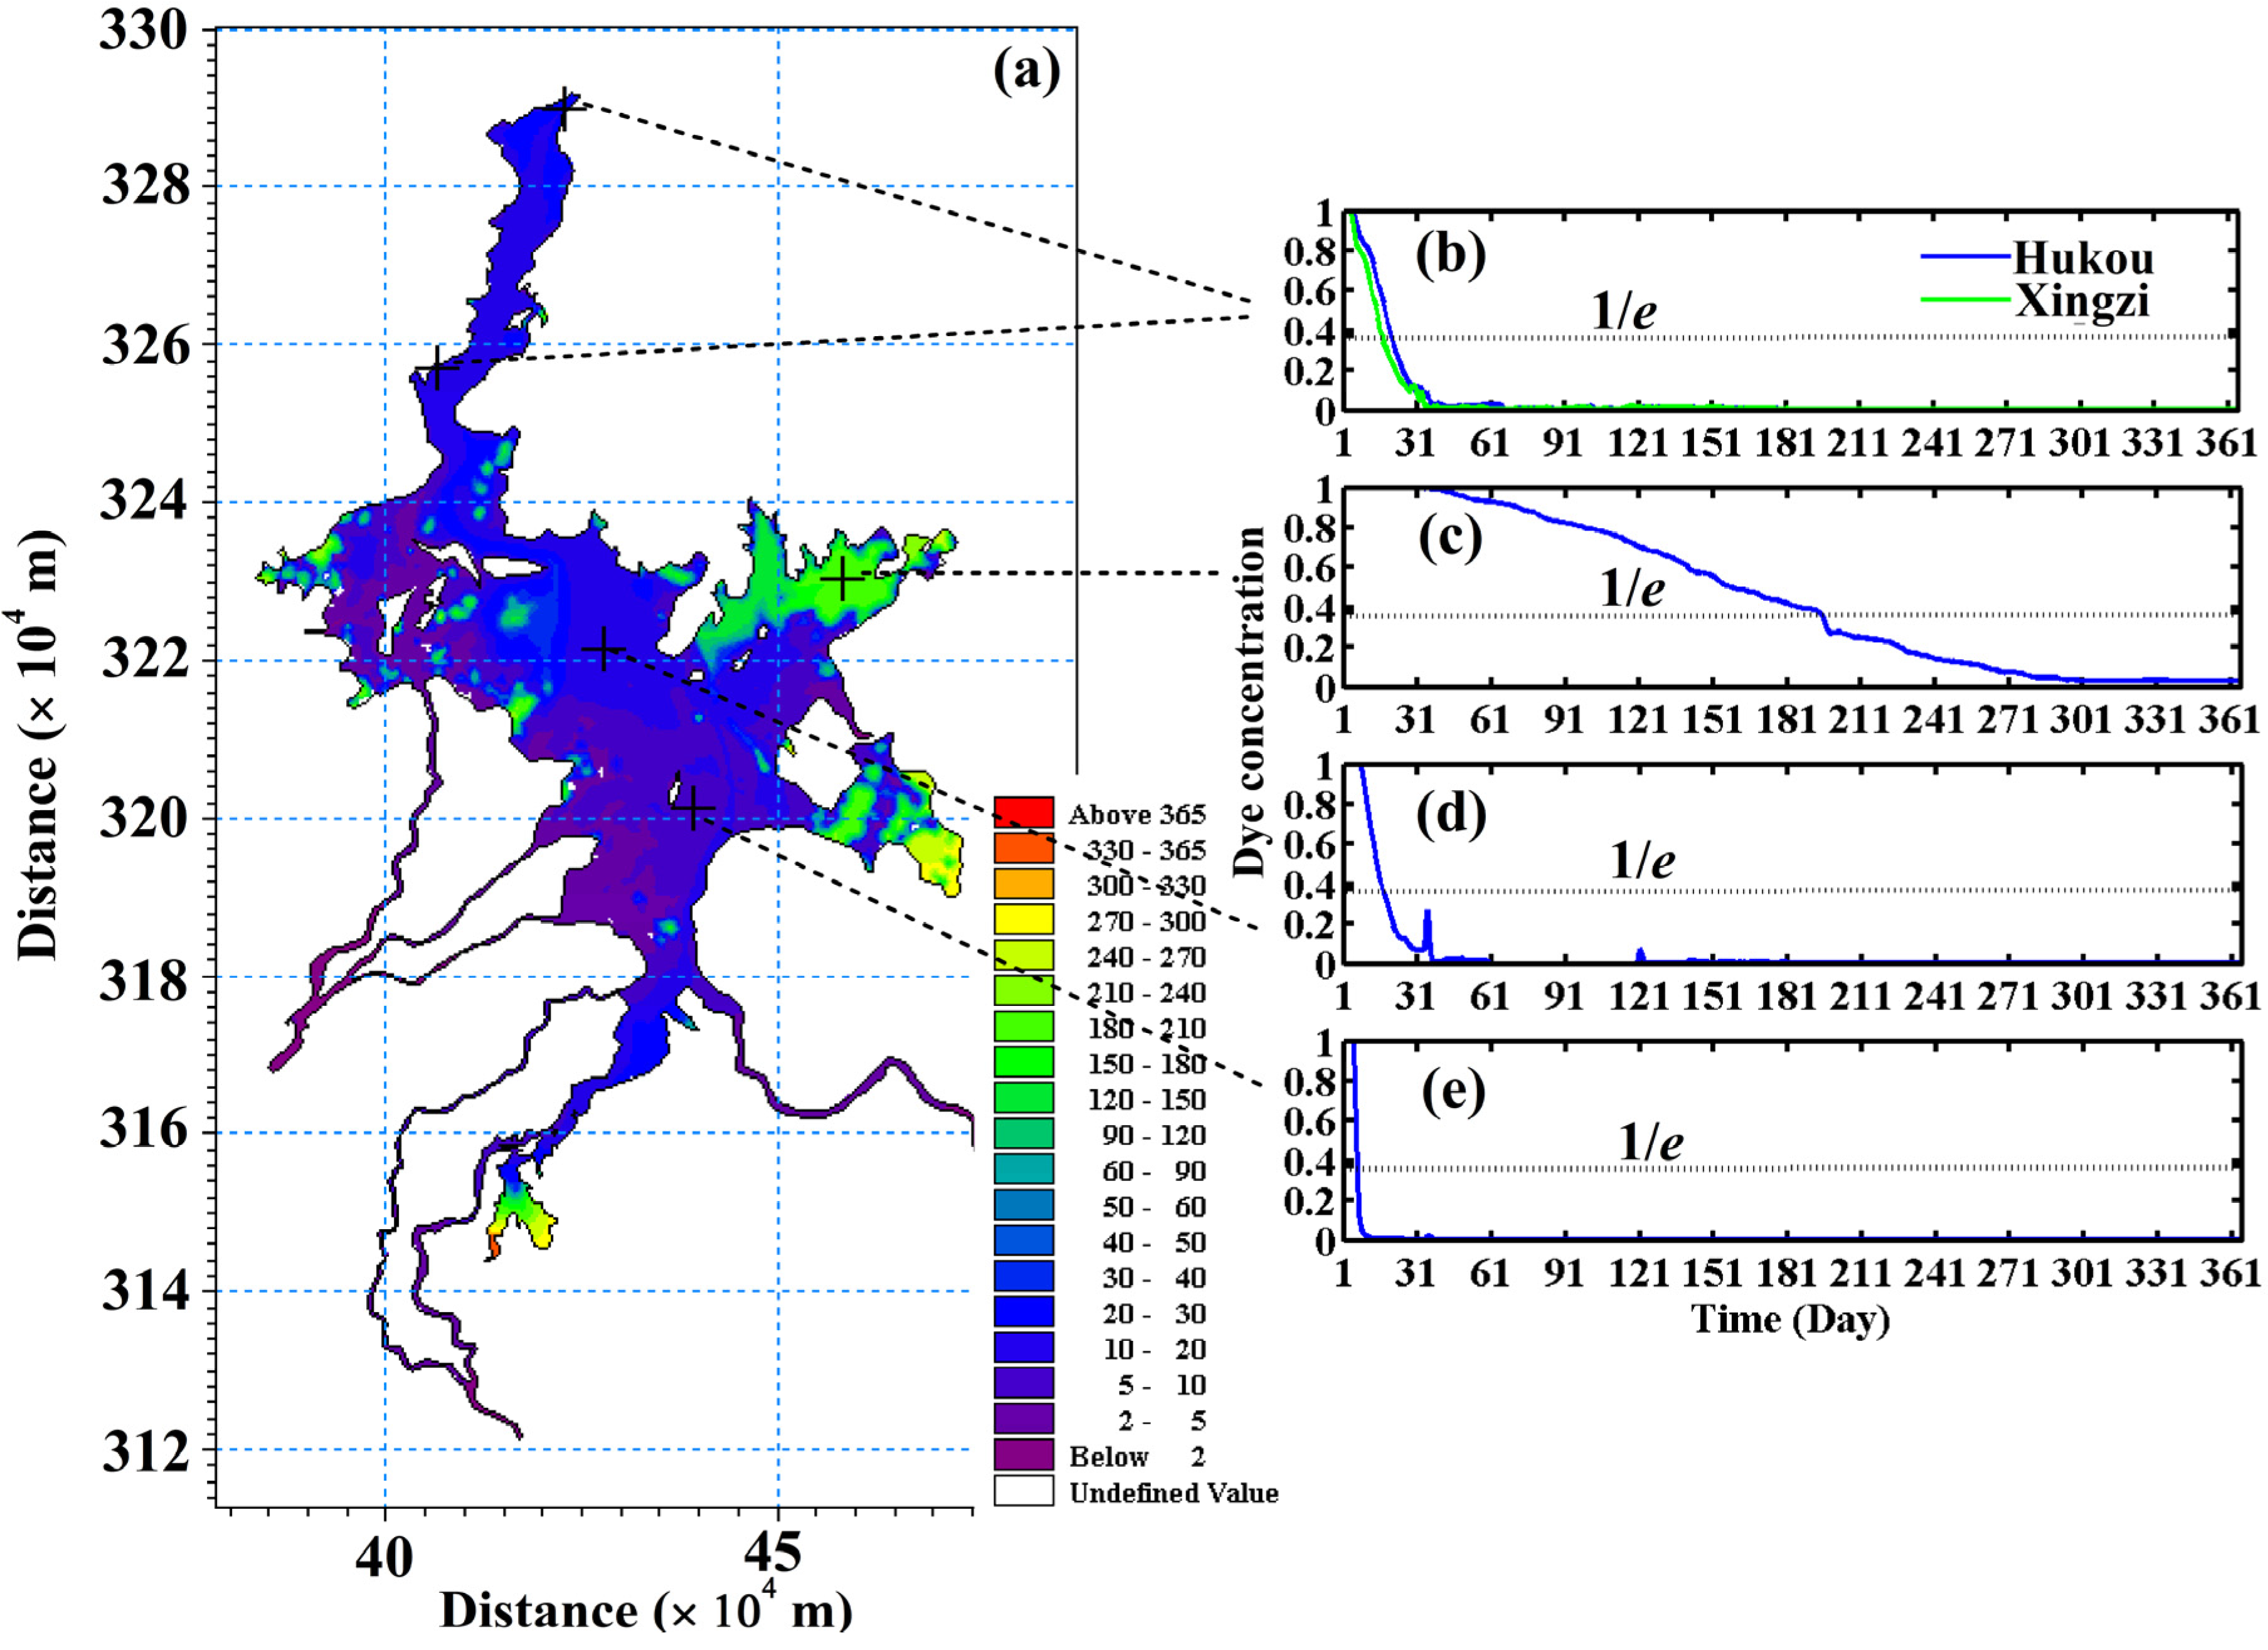
- The residence times with highly spatial variability that differed in hydrographically sub-regions within Poyang Lake, which varies roughly from less than 10 days along the lake channels to 365 days in some bays adjacent to the lake shorelines. Relatively large spatial residence time variations between the periods of high (falling) and low (rising) water levels were observed in the lake depending on the seasonal water level regimes as a result of the combined effects of catchment rivers and the Yangtze River. Generally, the results indicate that Poyang Lake exhibits strong but spatially heterogeneous residence times that vary with its highly seasonal water level dynamics.
- (2)
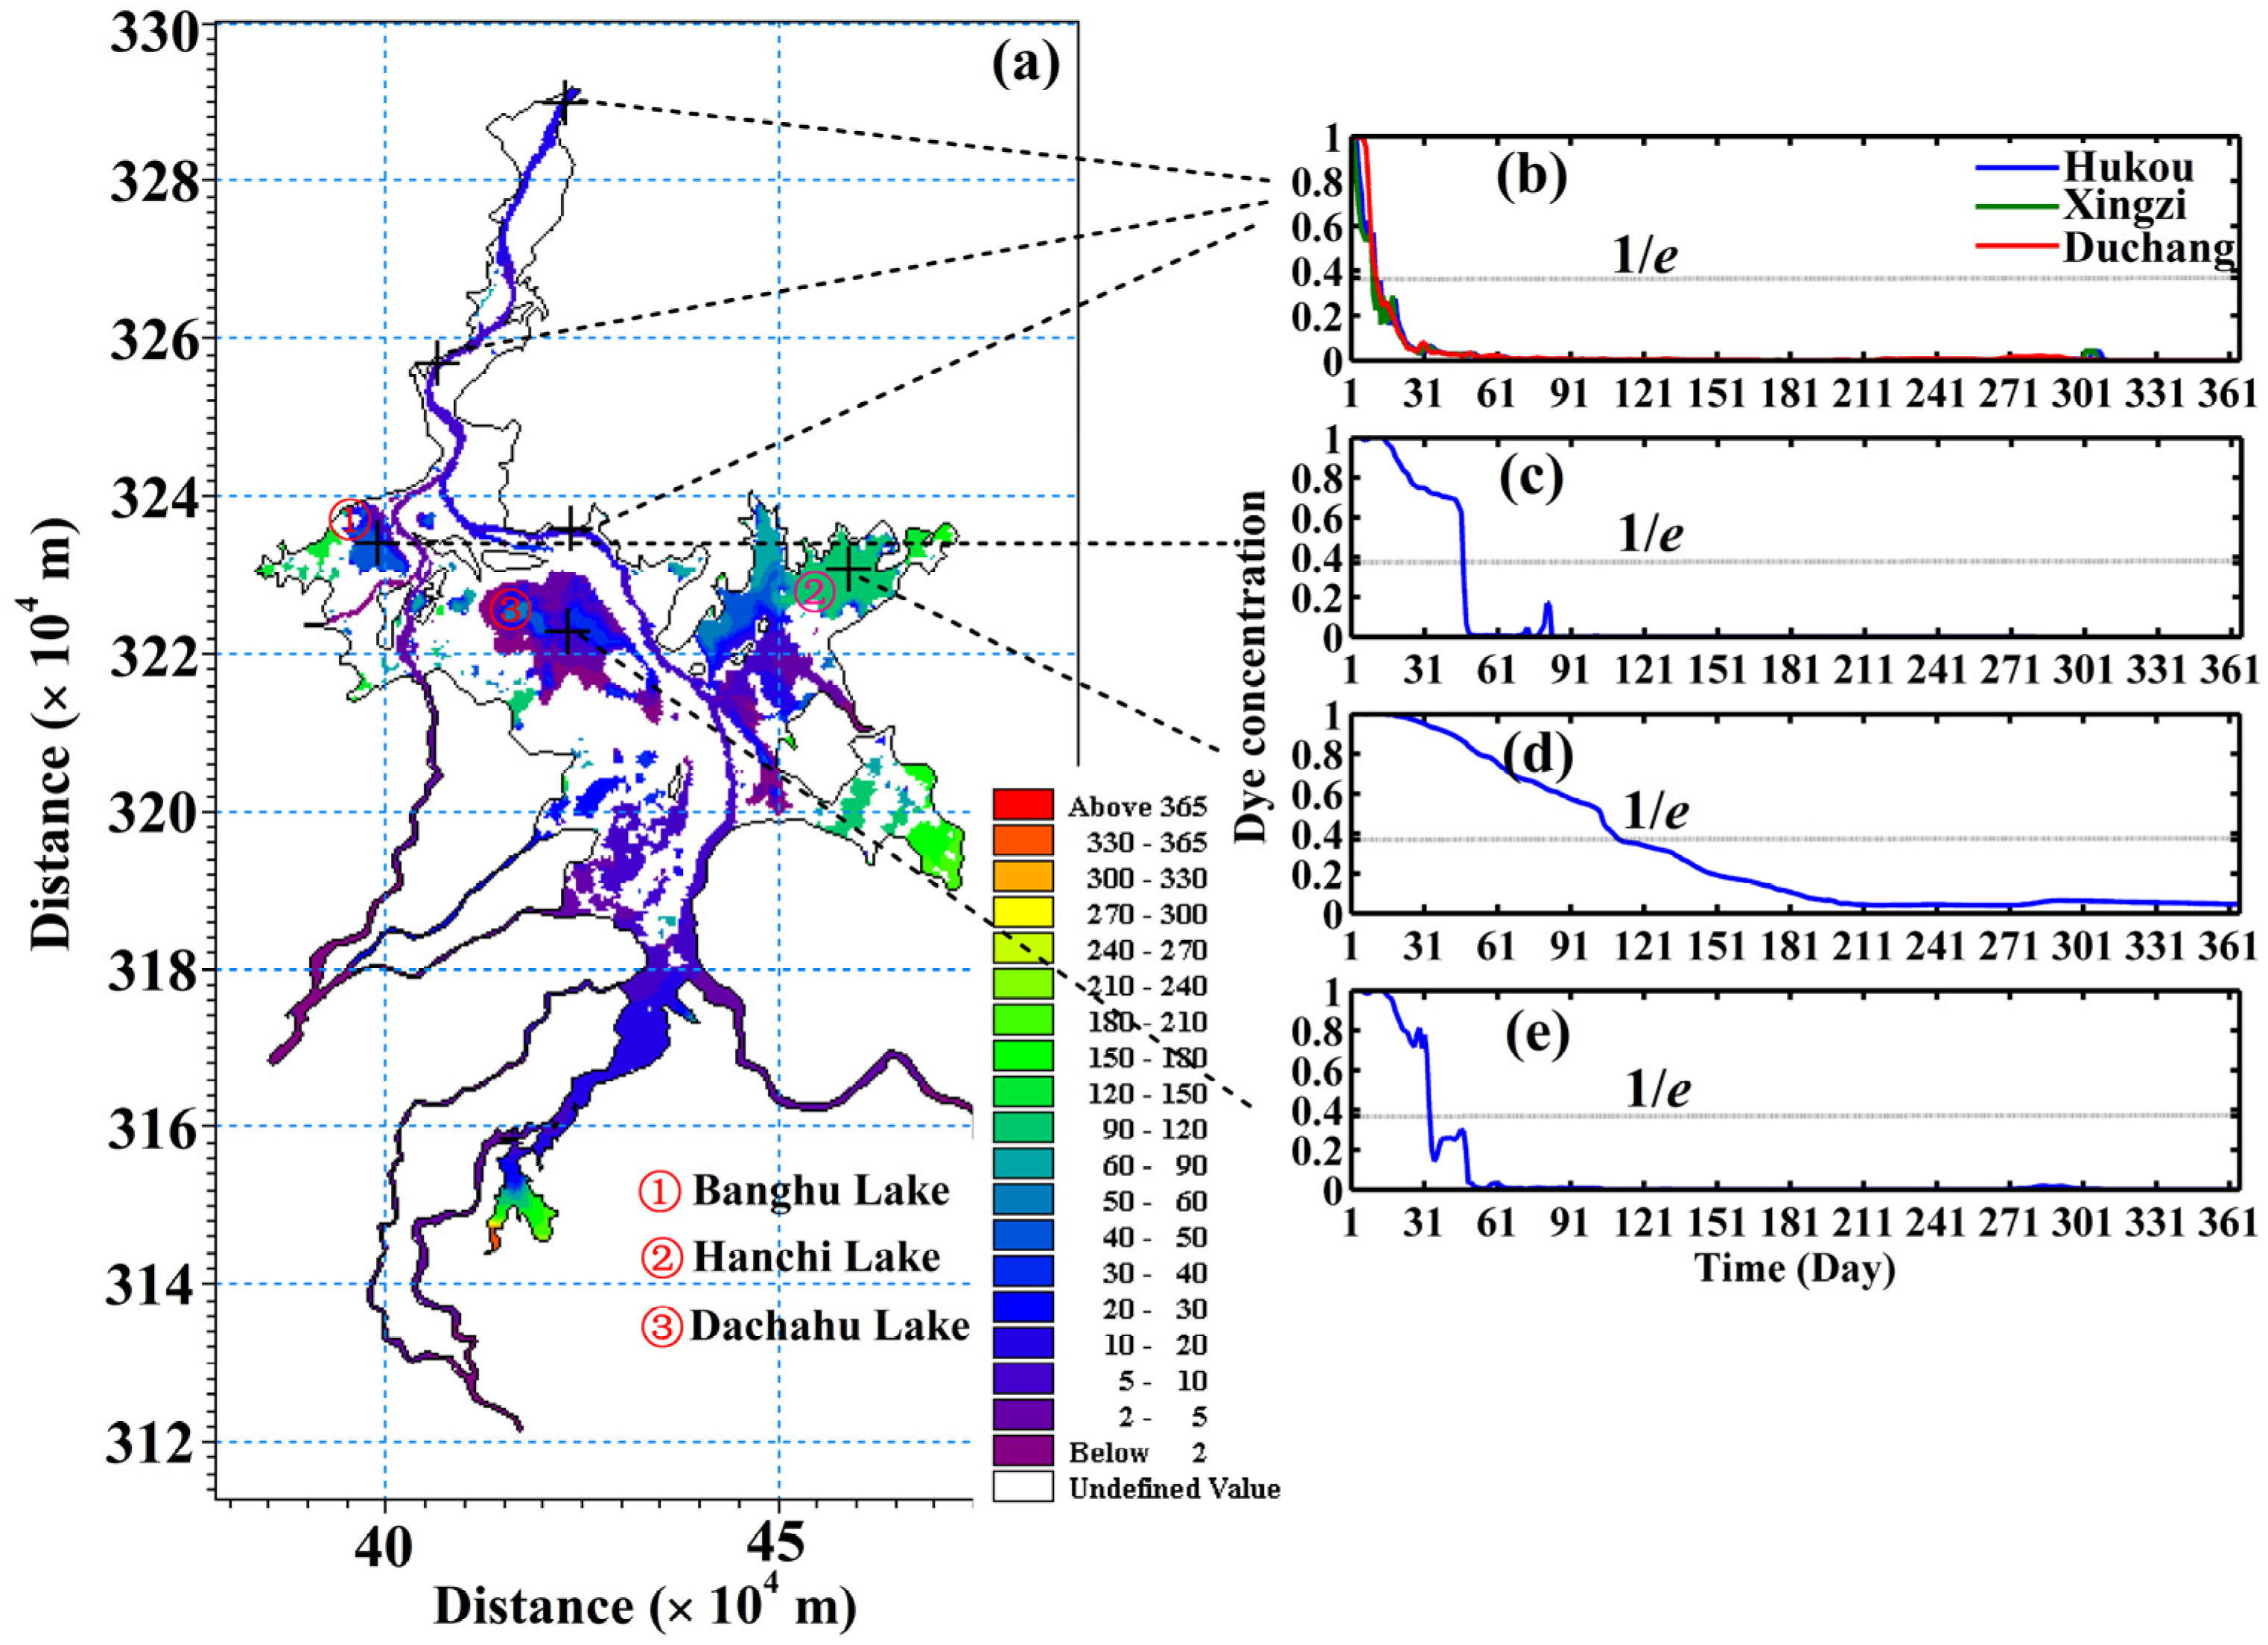
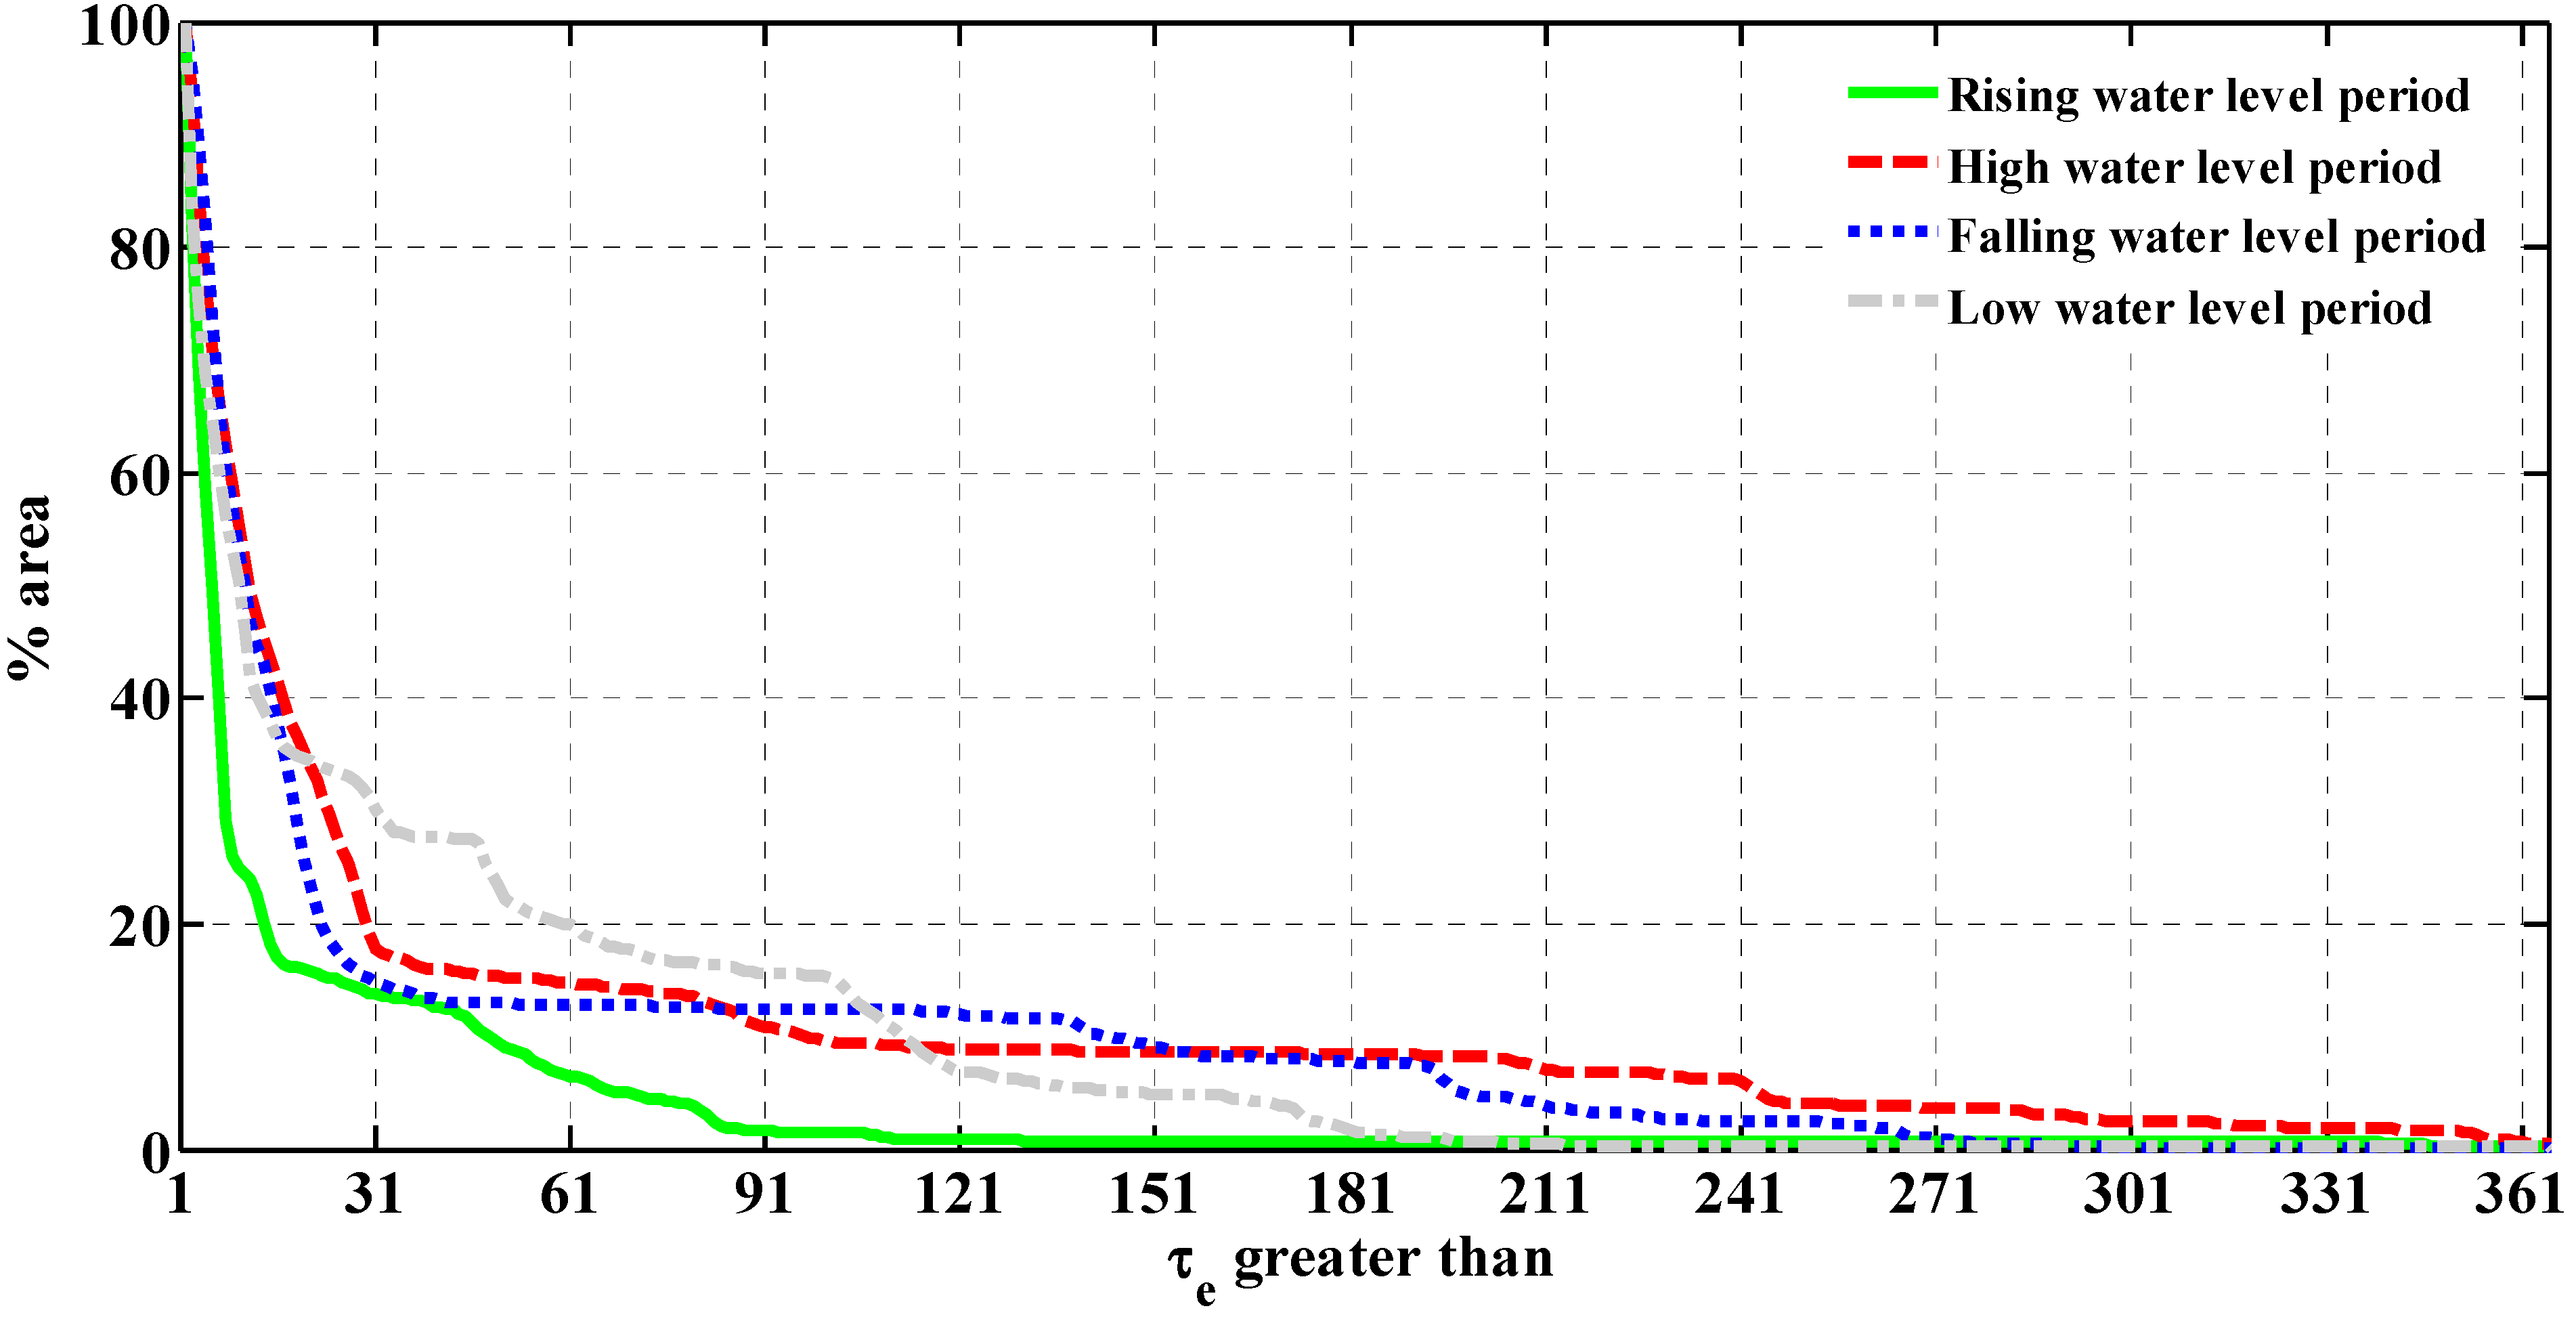
- The frequency distribution curve of the lake’s residence time provides useful generic information regarding the degree of variation in flushing across the lake domain. The curves of the shallow gradients for Poyang Lake indicated higher spatial variability in residence times. Additionally, the characteristic ‘step’ of the frequency distribution curve demonstrates that the Poyang Lake domain is divided into fast (the main flow channels of the lake) and slow (some bays adjacent to the lake shorelines) flushing systems.
- (3)
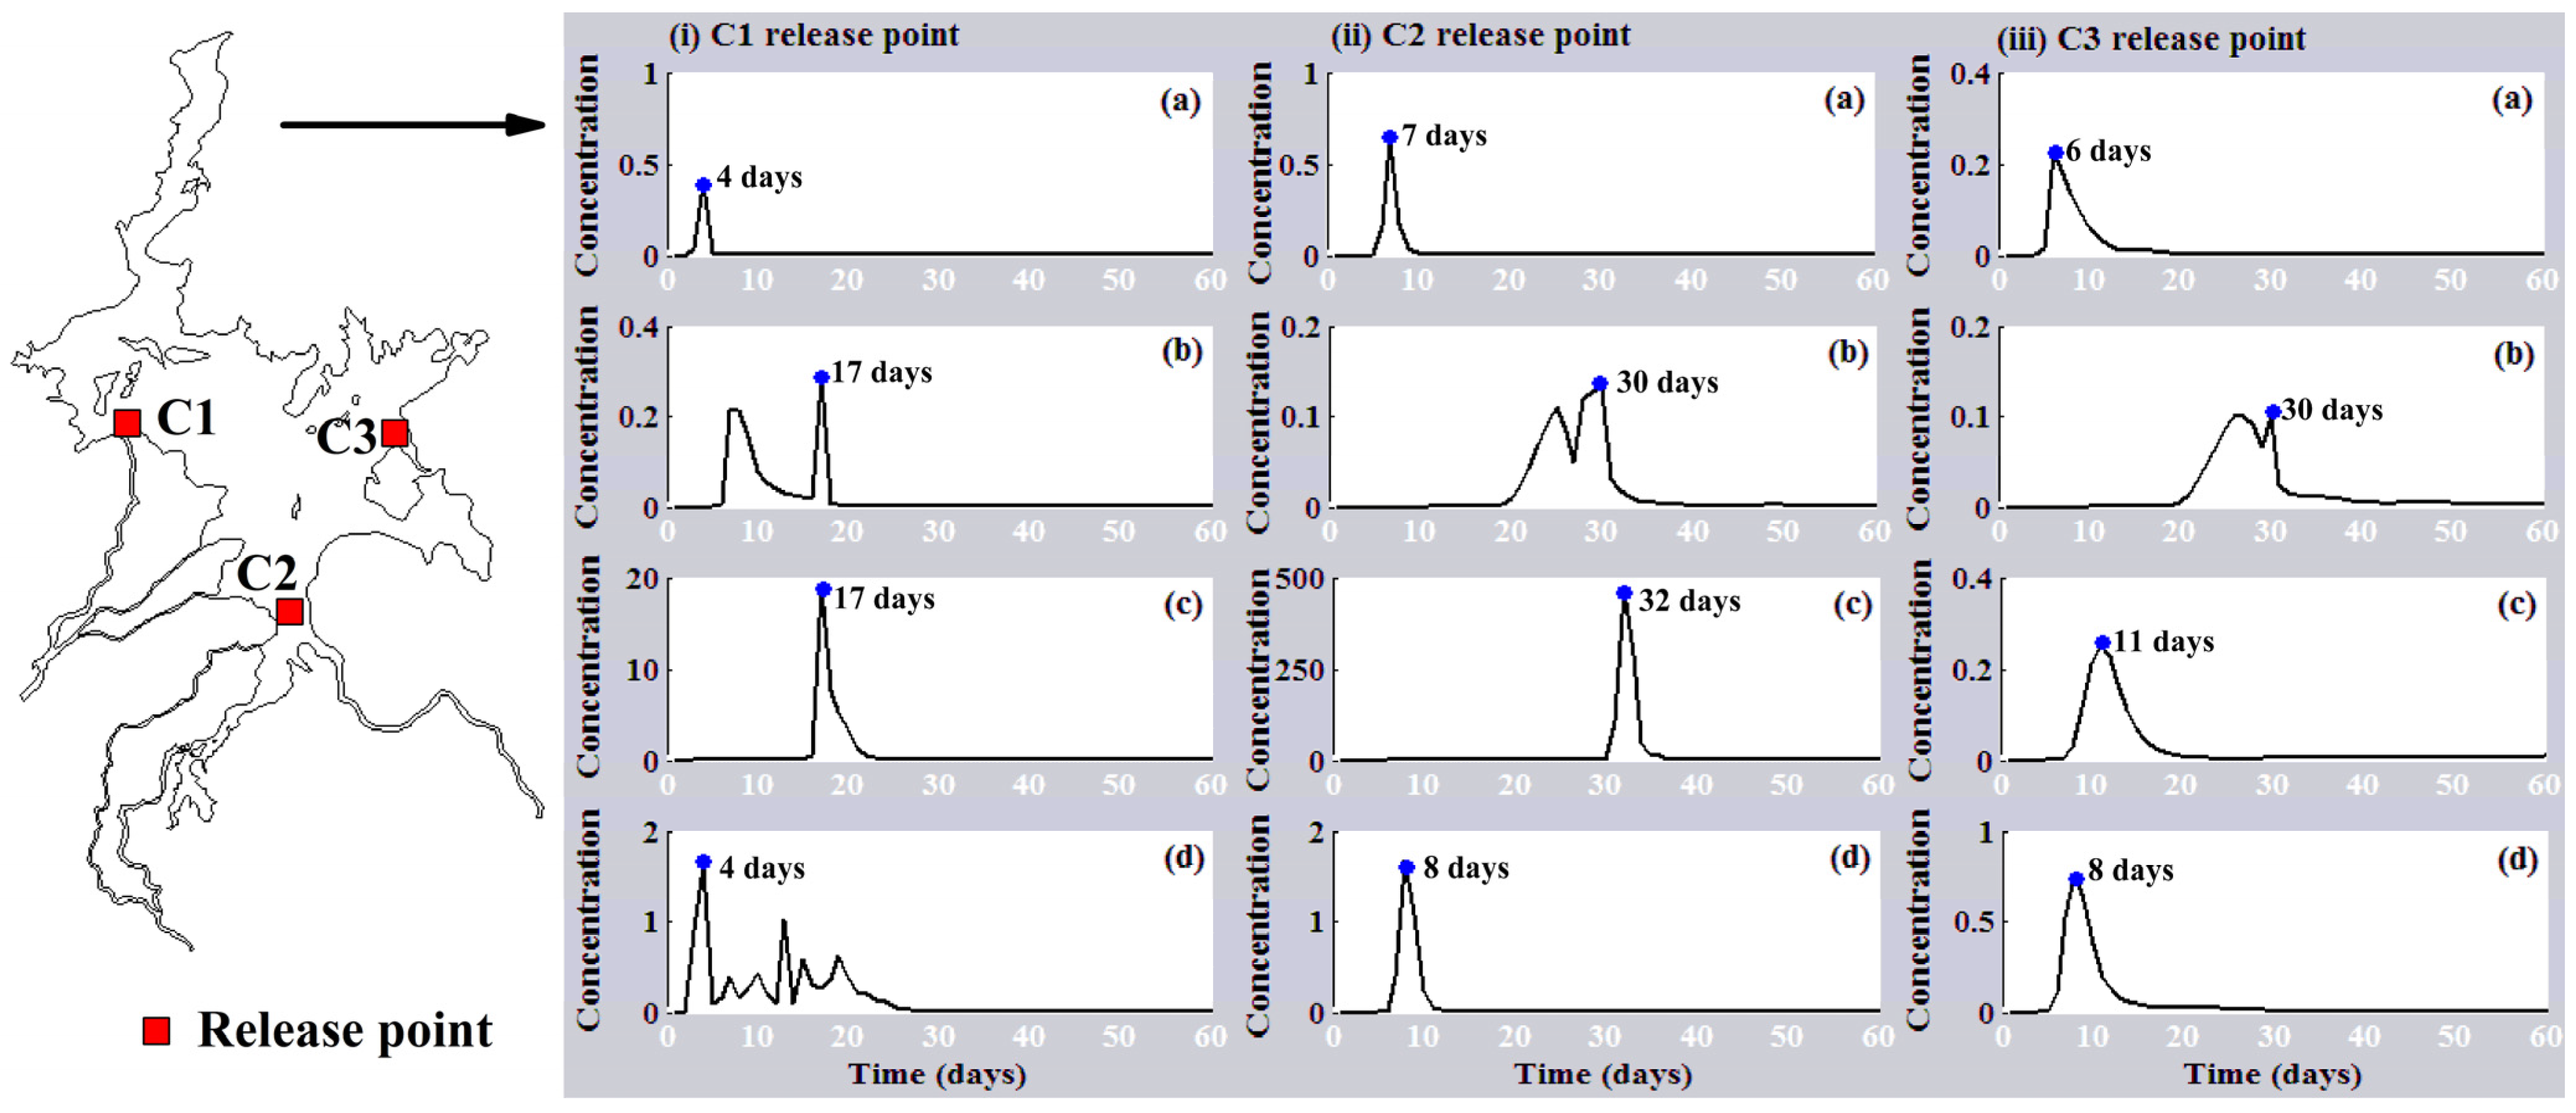
- The results indicated that the travel times from the potential pollution sources to the lake outlet varied seasonally. Nearly identical travel times occurred during the periods of high and falling water levels (up to 32 days), and these were four times longer than the travel times observed during the periods of low and rising water levels (less than 8 days), which is attributed to the advection-dispersion processes of the lake dependent on changes in the seasonal water level regime.
Acknowledgments
Author Contributions
Conflicts of Interest
References
- Lehner, B.; Döll, P. Development and validation of a global database of lakes, reservoirs and wetlands. J. Hydrol. 2004, 296, 1–22. [Google Scholar] [CrossRef]
- Pilotti, M.; Simoncelli, S.; Valerio, G. A simple approach to the evaluation of the actual water renewal time of natural stratified lakes. Water Resour. Res. 2014, 50, 2830–2849. [Google Scholar] [CrossRef]
- Dabrowski, T.; Hartnett, M.; Olbert, A.I. Determination of flushing characteristics of the Irish Sea: A spatial approach. Comput. Geosci. 2012, 45, 250–260. [Google Scholar] [CrossRef]
- Nguyen, T.; Thupaki, P.; Anderson, E.J.; Phanikumar, M.S. Summer circulation and exchange in the Saginaw Bay-Lake Huron system. J. Geophys. Res. 2014, 119. [Google Scholar] [CrossRef]
- Monsen, N.E.; Cloern, J.E.; Lucas, L.V.; Monismith, S.G. A comment on the use of flushing time, residence time, and age as transport time scales. Limnol. Oceanogr. 2002, 47, 1545–1553. [Google Scholar] [CrossRef]
- Takeoka, H. Fundamental concepts of exchange and transport time scales in a coastal sea. Cont. Shelf Res. 1984, 3, 311–326. [Google Scholar] [CrossRef]
- Dyer, K.R. Estuaries: A Physical Introduction; John Wiley and Sons Ltd.: London, UK, 1997; pp. 1–210. [Google Scholar]
- Cucco, A.; Umgiesser, G. Modeling the Venice Lagoon residence time. Ecol. Model. 2006, 193, 34–51. [Google Scholar] [CrossRef]
- Nyberg, L.; Rodhe, A.; Bishop, K. Water transit times and flow paths from two line injections of 3H and 36Cl in a micro-catchment at Gardsjon, Sweden. Hydrol. Process. 1999, 13, 1557–1575. [Google Scholar] [CrossRef]
- Botter, G.; Bertuzzo, E.; Rinaldo, A. Catchment residence and travel time distributions: The master equation. Geophys. Res. Lett. 2011, 38. [Google Scholar] [CrossRef]
- Razmi, A.M.; Barry, D.A.; Lemmin, U.; Bonvin, F.; Kohn, T.; Bakhtyar, R. Direct effects of dominant winds on residence and travel times in the wide and open lacustrine embayment: Vidy Bay (Lake Geneva, Switzerland). Aquat. Sci. 2014, 76, 59–71. [Google Scholar] [CrossRef]
- Morales, T.; Valderrama, I.F.; Uriarte, J.A.; Antiguedad, I.; Olazar, M. Predicting travel times and transport characterization in karst conduits by analyzing tracer-breakthrough curves. J. Hydrol. 2007, 334, 183–198. [Google Scholar] [CrossRef]
- Dabrowski, T.; Hartnett, M. Modelling travel and residence times in the eastern Irish Sea. Mar. Pollut. Bull. 2008, 57, 41–46. [Google Scholar] [CrossRef] [PubMed]
- Shankman, D.; Heim, B.D.; Song, J. Flood frequency in China’s Poyang Lake region: Trends and teleconnections. Int. J. Climatol. 2006, 26, 1255–1266. [Google Scholar] [CrossRef]
- Gao, J.; Jia, J.; Kettner, A.J.; Xing, F.; Wang, Y.P.; Xu, X.N.; Yang, Y.; Zou, X.Q.; Gao, S.; Qi, S.; et al. Changes in water and sediment exchange between the Changjiang River and Poyang Lake under nature and anthropogenic conditions, China. Sci. Total Environ. 2014, 481, 542–553. [Google Scholar] [CrossRef] [PubMed]
- Hu, Q.; Feng, S.; Guo, H.; Chen, G.Y.; Jiang, T. Interactions of the Yangtze River flow and hydrologic processes of the Poyang Lake, China. J. Hydrol. 2007, 347, 90–100. [Google Scholar] [CrossRef]
- Cui, L.; Wu, G.; Liu, Y. Monitoring the impact of backflow and dredging on water clarity using MODIS images of Poyang Lake, China. Hydrol. Process. 2009, 23, 342–350. [Google Scholar] [CrossRef]
- Guo, H.; Hu, Q.; Zhang, Q.; Feng, S. Effects of the Three Gorges Dam on Yangtze River flow and river interaction with Poyang Lake, China: 2003–2008. J. Hydrol. 2012, 416, 19–27. [Google Scholar] [CrossRef]
- Zhang, Q.; Ye, X.C.; Werner, A.D.; Li, Y.L.; Yao, J.; Li, X.H.; Xu, C.Y. An investigation of enhanced recessions in Poyang Lake: Comparison of Yangtze River and local catchment impacts. J. Hydrol. 2014, 517, 425–434. [Google Scholar] [CrossRef]
- Zhen, L.; Li, F.; Huang, H.; Dilly, O.; Liu, J.; Wei, Y.; Yang, L.; Cao, X. Households’ willingness to reduce pollution threats in the Poyang Lake region, southern China. J. Geochem. Explor. 2011, 110, 15–22. [Google Scholar] [CrossRef]
- Wang, M.L.; Zhou, W.B.; Hu, C.M. Status of nitrogen and phosphorus in waters of Lake Poyang Basin. J. Lake Sci. 2008, 20, 334–338. [Google Scholar]
- Wu, L.; Li, M.; Guo, Y.; Yang, X. Influence of Three Gorges Project on water quality of Poyang Lake. Procedia Environ. Sci. 2011, 10, 1496–1501. [Google Scholar] [CrossRef]
- Zhang, D.W.; Wei, Y.H.; Zhang, L.; Lin, G.G.; Chen, Y.W.; Tu, T.T. Distribution of heavy metals in water, suspended particulate matter and sediment of Poyang lake, China. Fresenius Environ. Bull. 2012, 21, 1910–1919. [Google Scholar]
- Wei, Y.; Zhang, J.; Zhang, D.; Tu, T.; Luo, L. Metal concentrations in various fish organs of different fish species from Poyang Lake, China. Ecotoxicol. Environ. Saf. 2014, 104, 182–188. [Google Scholar] [CrossRef] [PubMed]
- Deng, X.; Zhao, Y.; Wu, F.; Lin, Y.; Lu, Q.; Dai, J. Analysis of the trade-off between economic growth and the reduction of nitrogen and phosphorus emissions in the Poyang Lake Watershed, China. Ecol. Model. 2011, 222, 330–336. [Google Scholar] [CrossRef]
- Wu, Z.; Lai, X.; Zhang, L.; Cai, Y.; Chen, Y. Phytoplankton chlorophyll a in Lake Poyang and its tributaries during dry, mid-dry and wet seasons: A 4-year study. Knowl. Manag. Aquat. Ecosyst. 2014, 412, 1–13. [Google Scholar]
- Zhu, H.; Zhang, B. The Poyang Lake; University of Science & Technology of China Press: Hefei, China, 1997; pp. 1–349. (In Chinese) [Google Scholar]
- Wang, S.; Dou, H. Chinese Lakes; Science Press: Beijing, China, 1998; pp. 1–580. (In Chinese) [Google Scholar]
- Cheng, X.; Li, S. The typical lake eutrophication evolving process and its characteristic analysis in the middle and lower reaches of the Changjiang River. Chin. Sci. Bull. 2006, 51, 848–855. (In Chinese) [Google Scholar] [CrossRef]
- Rueda, F.; Moreno-Ostos, E.; Armengol, J. The residence time of river water in reservoirs. Ecol. Model. 2006, 191, 260–274. [Google Scholar] [CrossRef]
- Shaha, D.C.; Cho, Y.K.; Seo, G.H.; Kim, C.S.; Jung, K.T. Using flushing rate to investigate spring-neap and spatial variations of gravitational circulation and tidal exchanges in an estuary. Hydrol. Earth Syst. Sci. 2010, 14, 1465–1476. [Google Scholar] [CrossRef] [Green Version]
- Wan, Y.; Qiu, C.; Doering, P.; Ashton, M.; Sun, D.; Coley, T. Modeling residence time with a three-dimensional hydrodynamic model: Linkage with chlorophyll a in a subtropical estuary. Ecol. Model. 2013, 268, 93–102. [Google Scholar] [CrossRef]
- Shen, J.; Haas, L. Calculating age and residence time in the tidal York River using three-dimensional model experiments. Estuar. Coast. Shelf Sci. 2004, 61, 449–461. [Google Scholar] [CrossRef]
- Dargahi, B.; Stegn, S.G. Combined 3D hydrodynamic and watershed modeling of Lake Tana, Ethiopia. J. Hydrol. 2011, 398, 44–64. [Google Scholar] [CrossRef]
- Umgiesser, G.; Ferrarin, C.; Cucco, A.; Pascalis, F.D.; Bellafiore, D.; Ghezzo, M.; Bajo, M. Comparative hydrodynamics of 10 Mediterranean lagoons by means of numerical modeling. J. Geophys. Res. 2014, 119, 2212–2226. [Google Scholar] [CrossRef]
- Kanai, Y.; Ueta, M.; Germogenov, N.; Nagendran, M.; Mita, N.; Higuchi, H. Migration routes and important resting areas of Siberian cranes (Grus leucogeranus) between northeastern Siberia and China as revealed by satellite tracking. Biol. Conserv. 2002, 106, 339–346. [Google Scholar] [CrossRef]
- Li, Y.L.; Zhang, Q.; Yao, J.; Werner, A.D.; Li, X.H. Hydrodynamic and hydrological modeling of Poyang Lake-catchment system in China. J. Hydrol. Eng. 2014, 19, 607–616. [Google Scholar] [CrossRef]
- Feng, L.; Hu, C.; Chen, X.; Cai, X.; Tian, L.; Gan, W. Assessment of inundation changes of Poyang Lake using MODIS observation between 2000 and 2010. Remote Sens. Environ. 2012, 121, 80–92. [Google Scholar] [CrossRef]
- Danish Hydraulic Institute (DHI). MIKE 21 Flow Model: Hydrodynamic Module User Guide; DHI Water and Environment: Hørsholm, Denmark, 2007; pp. 1–90. [Google Scholar]
- Barua, D.K.; Allyn, N.F.; Quick, M.C. Modeling tsunami and resonance response of Alberni inlet, British Columbia. In Proceedings of the 30th International Conference on Coastal Engineering, San Diego, CA, USA, 2–8 September 2006; pp. 1590–1602.
- Martinelli, L.; Zanuttigh, B.; Corbau, C. Assessment of coastal flooding hazard along the Emilia Romagna littoral, IT. Coast. Eng. 2010, 57, 1042–1058. [Google Scholar] [CrossRef]
- Patgaonkar, R.S.; Vethamony, P.; Lokesh, K.S.; Babu, M.T. Residence time of pollutants discharged in the Gulf of Kachchh, northwestern Arabian Sea. Mar. Pollut. Bull. 2012, 64, 1659–1666. [Google Scholar] [CrossRef] [PubMed]
- Schoen, J.; Stretch, D.; Tirok, K. Wind-driven circulation patterns in a shallow estuarine lake: St Lucia, South Africa. Estuar. Coast. Shelf Sci. 2014, 146, 49–59. [Google Scholar] [CrossRef]
- Jin, G.; Xie, D.; Deng, H.; Yan, Y.; Liu, M.; Wang, Y. On seasonal hydrographic variety and environmental capacity of Poyang Lake. Acta Agric. Univ. Jiangxiensis 2011, 33, 388–393. (In Chinese) [Google Scholar]
- Tang, C.; Xiong, X.; Zhang, X.; Zou, W. Simulation of the impact of the reverse flow from Yangtze River on the hydrodynamic process of Poyang Lake. J. Lake Sci. 2014, in press. [Google Scholar]
- Wu, Z.; He, H.; Cai, Y.; Zhang, L.; Chen, Y. Spatial distribution of chlorophyll a and its relationship with the environment during summer in Lake Poyang: A Yangtze-connected lake. Hydrobiologia 2014, 732, 61–70. [Google Scholar] [CrossRef]
- Gao, G.; Ruan, R.; Ouyang, Q. Water quality status and changing trend in Poyang Lake. J. Nanchang Inst. Tech. 2010, 29, 50–53. (In Chinese) [Google Scholar]
- White, A.B.; Kumar, P.; Saco, P.M.; Rhoads, B.L.; Yen, B.C. Hydrodynamic and geomorphologic dispersion: Scale effects in the Illinois River Basin. J. Hydrol. 2004, 288, 237–257. [Google Scholar] [CrossRef]
- Jia, X.; Zeng, F.; Gu, Y. Semi-analytical solutions to one-dimensional advection-diffusion equations with variable diffusion coefficient and variable flow velocity. Appl. Math. Comput. 2013, 221, 268–181. [Google Scholar] [CrossRef]
- Zeinoddini, M.; Tofighi, M.A.; Vafaee, F. Evaluation of dike-type causeway impacts on the flow and salinity regimes in Urmia Lake, Iran. J. Great Lakes Res. 2009, 35, 13–22. [Google Scholar] [CrossRef]
© 2015 by the authors; licensee MDPI, Basel, Switzerland. This article is an open access article distributed under the terms and conditions of the Creative Commons Attribution license (http://creativecommons.org/licenses/by/4.0/).
Share and Cite
Li, Y.; Zhang, Q.; Yao, J. Investigation of Residence and Travel Times in a Large Floodplain Lake with Complex Lake-River Interactions: Poyang Lake (China). Water 2015, 7, 1991-2012. https://doi.org/10.3390/w7051991
Li Y, Zhang Q, Yao J. Investigation of Residence and Travel Times in a Large Floodplain Lake with Complex Lake-River Interactions: Poyang Lake (China). Water. 2015; 7(5):1991-2012. https://doi.org/10.3390/w7051991
Chicago/Turabian StyleLi, Yunliang, Qi Zhang, and Jing Yao. 2015. "Investigation of Residence and Travel Times in a Large Floodplain Lake with Complex Lake-River Interactions: Poyang Lake (China)" Water 7, no. 5: 1991-2012. https://doi.org/10.3390/w7051991