1. Introduction
Over 70% of the human body is water. Water participates in virtually every function of life. It is essential to most biochemical reactions, a predominant constituent of bodily fluids—blood, lymph, cerebrospinal fluid, saliva and other digestive secretions, and is essential for joint lubrication, for detoxifications, and for blood pressure maintenance. More than just a solvent, water has a complex and dynamic structure that is sensitive and responsive to solutes and to its surroundings. Both water and living systems appear to be equally sensitive even to a single quantum of magnetic flux [
1]. In addition, water exhibits long-range ordering features hitherto suspected but largely undocumented.
In this report, we provide evidence for the concept that physical properties of water are the responsible time keepers for the cells’ biological clock. Other external clock interacting influences, i.e., day-night cycles, geomagnetic fields, melatonin, etc. phase, but do not necessarily drive, clock related rhythms. If physical properties of water serve as the time keeper of cellular clocks, then what are the fundamental properties of water that might be responsible? Water would be an ideal medium to serve as a universal time keeper. It permeates every region of the cell and is capable of interaction with both small and large molecules.
This universal property of water in biological time-keeping may also contribute to the maintenance of synchrony of most, if not all, physical, chemical and biological processes involving water. An application to water treatment along with implications related to human health are discussed along with evidence for synchrony with systems of contiguous water molecules as well as the physical basis for how the fundamental water energy oscillations are generated and synchronized. We will summarize evidence that the underlying phenomena for water oscillations important to cellular time keeping are the result of a largely unrecognized property of water, that of oscillations in the ratios of ortho to para spin pairs of water hydrogens.
2. Time-Keeping ENOX Proteins
A link to tie water to cellular time-keeping was the result of the discovery in our laboratory of a family of growth-related cell surface ENOX proteins with alternating NADH oxidase and protein disulfide-thiol interchange that oscillated with a period length of 24 min [
2,
3,
4]. All are located on the external surface of the plasma membrane and are shed into the circulation [
5]. Site directed mutagenesis and overexpression studies correlated changes in period lengths of the activity oscillations of the ENOX proteins directly with corresponding changes in cellular circadian rhythms [
6,
7]. More importantly, the period lengths of the activity oscillations of the ENOX proteins where water was replaced by D
2O were increased from 24 min to 30 min [
5]. Organisms grown in D
2O consistently exhibit circadian periods of about 30 h compared to the normal period length of 24 h [
8]. Further studies revealed a requirement for bound copper
II to sustain the periodicity of the ENOX proteins [
9,
10]. When examined in the absence of protein, copper
II hexahydrate in aqueous solution also revealed oscillatory changes in redox potential sufficient to catalyze the oxidation of NADH with a period length of 24 min.
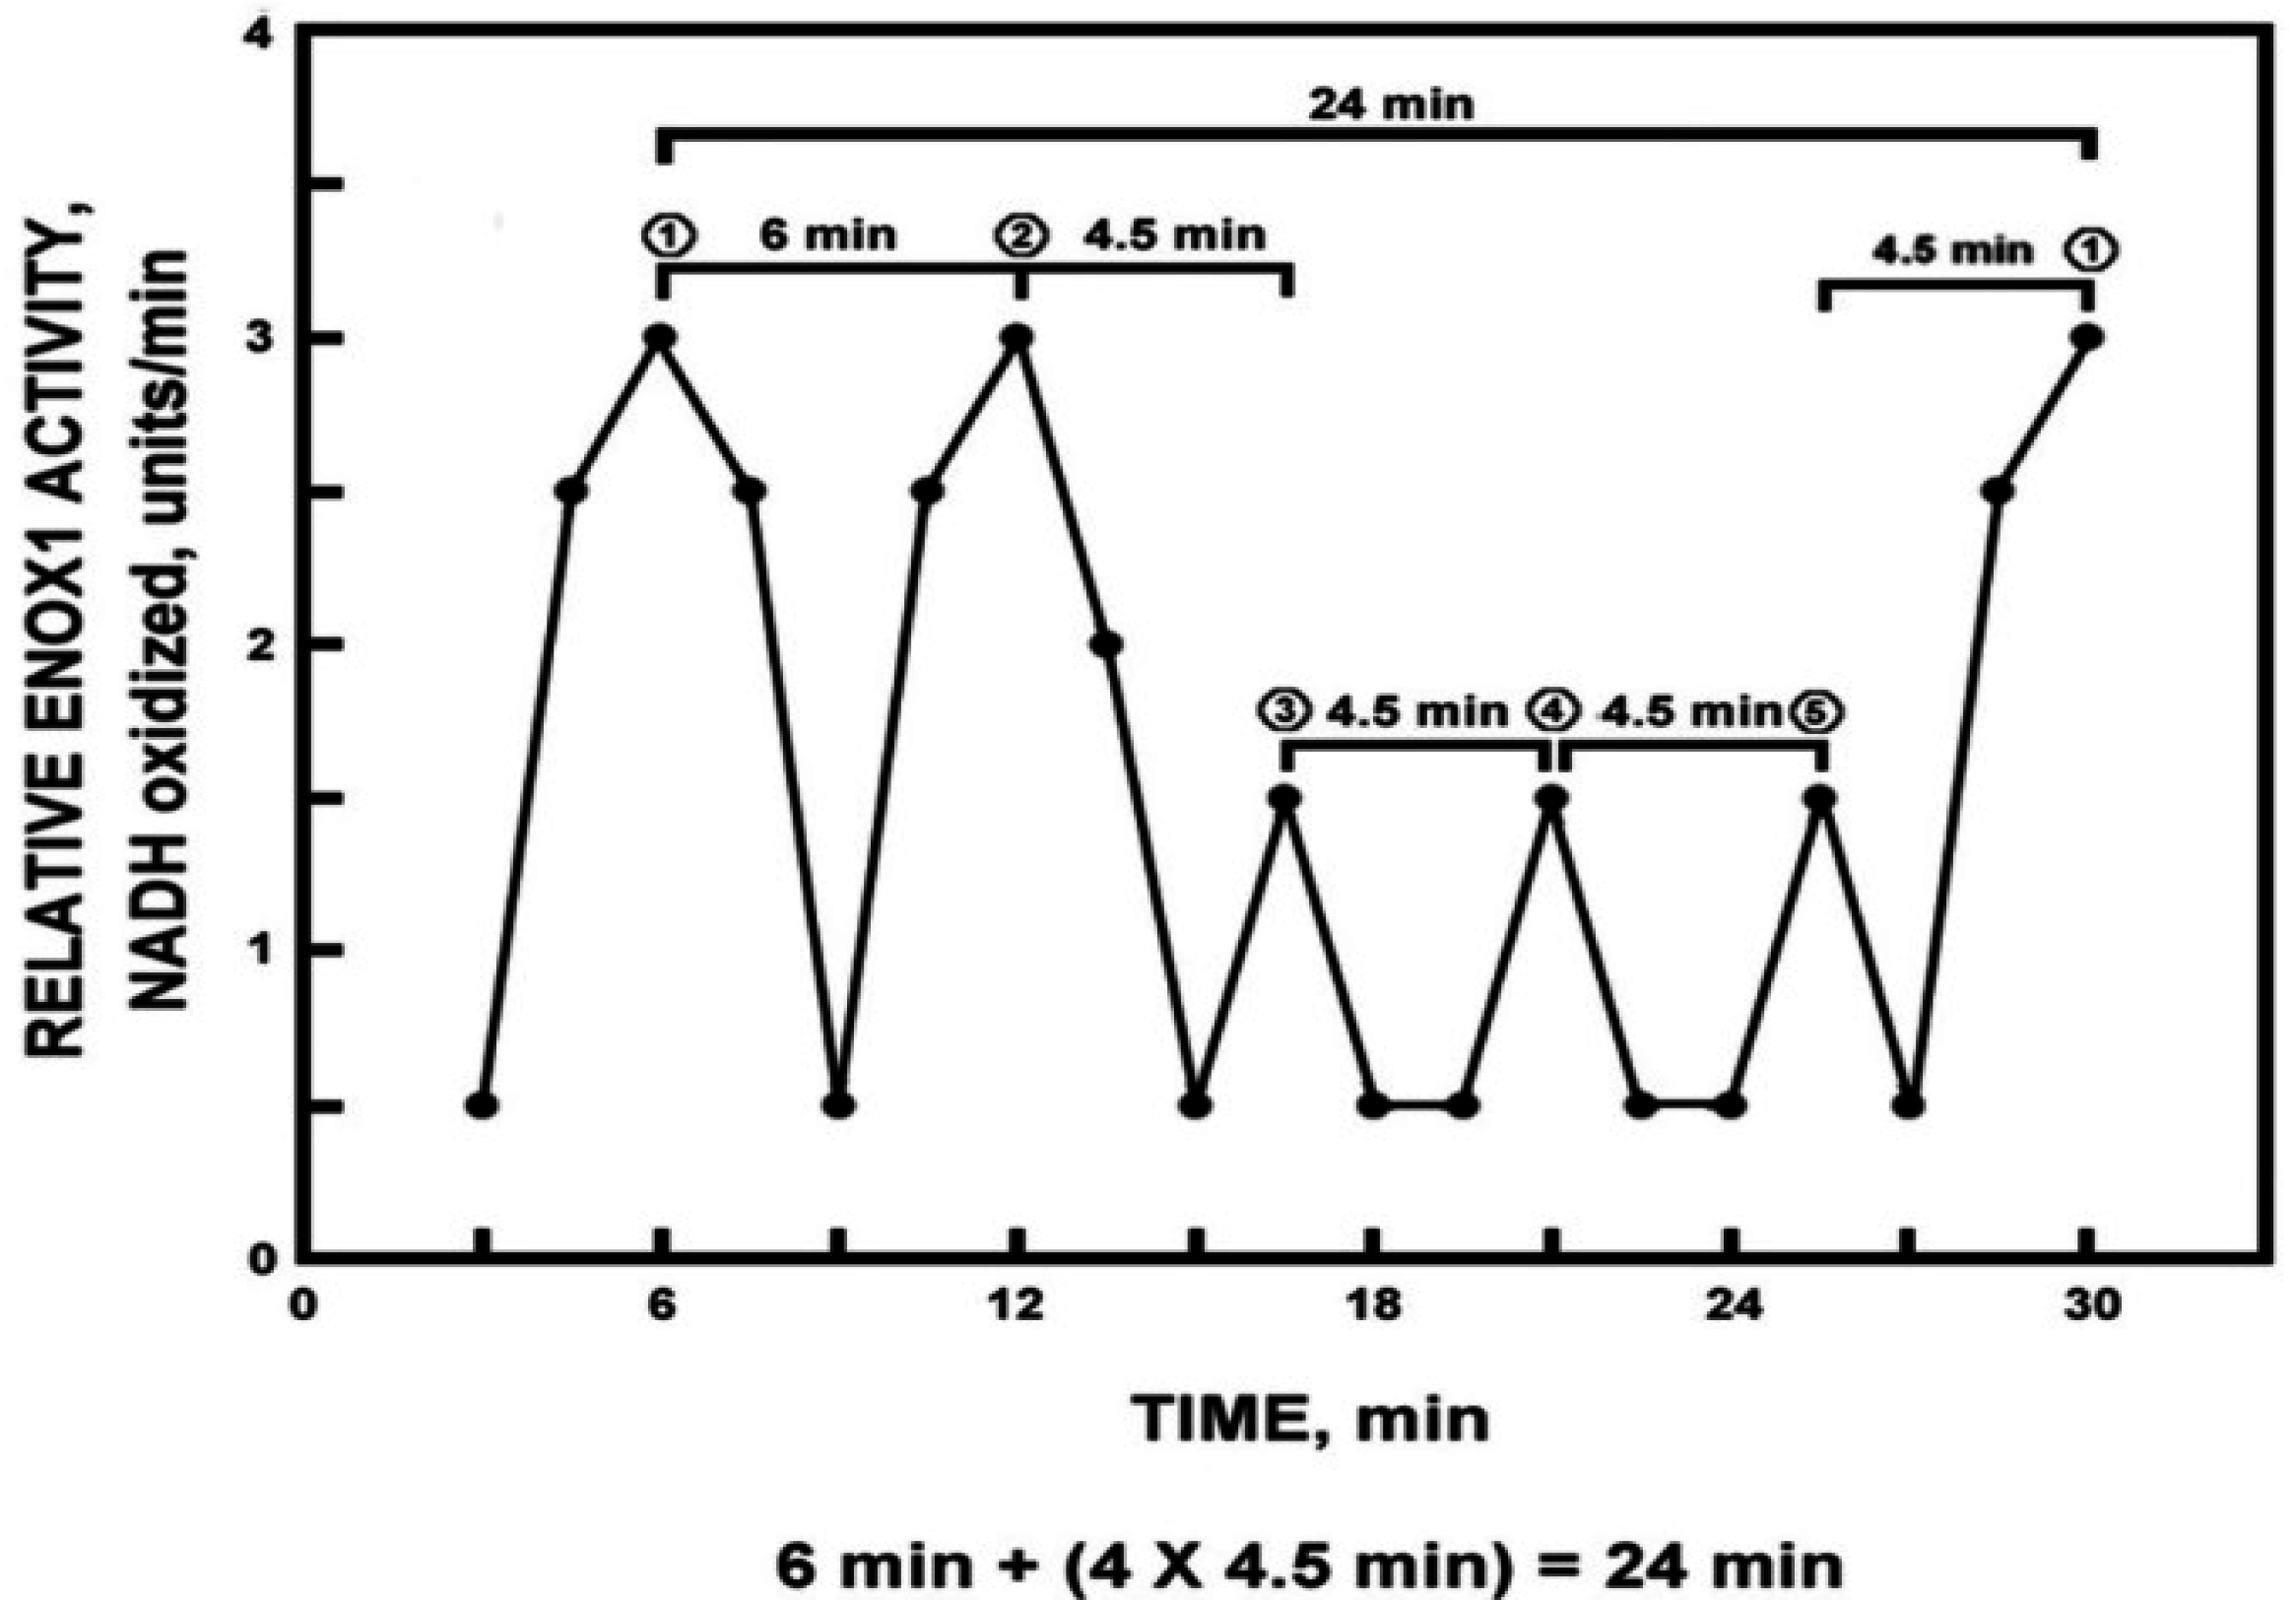
A characteristic of the oscillatory pattern of the time-keeping, clock-related ENOX proteins that distinguishes it from all other known oscillatory phenomena, has been its characteristic asymmetry (
Figure 1). Each period is defined by a series of five maxima, two of which, designated ① and ② are strictly separated by 6 min and three of which, designated by ③, ④ and ⑤ are separated from each other and from the adjacent maxima ① and ② by 4.5 min [6 min + (4 × 4.5 min) = 24 min].
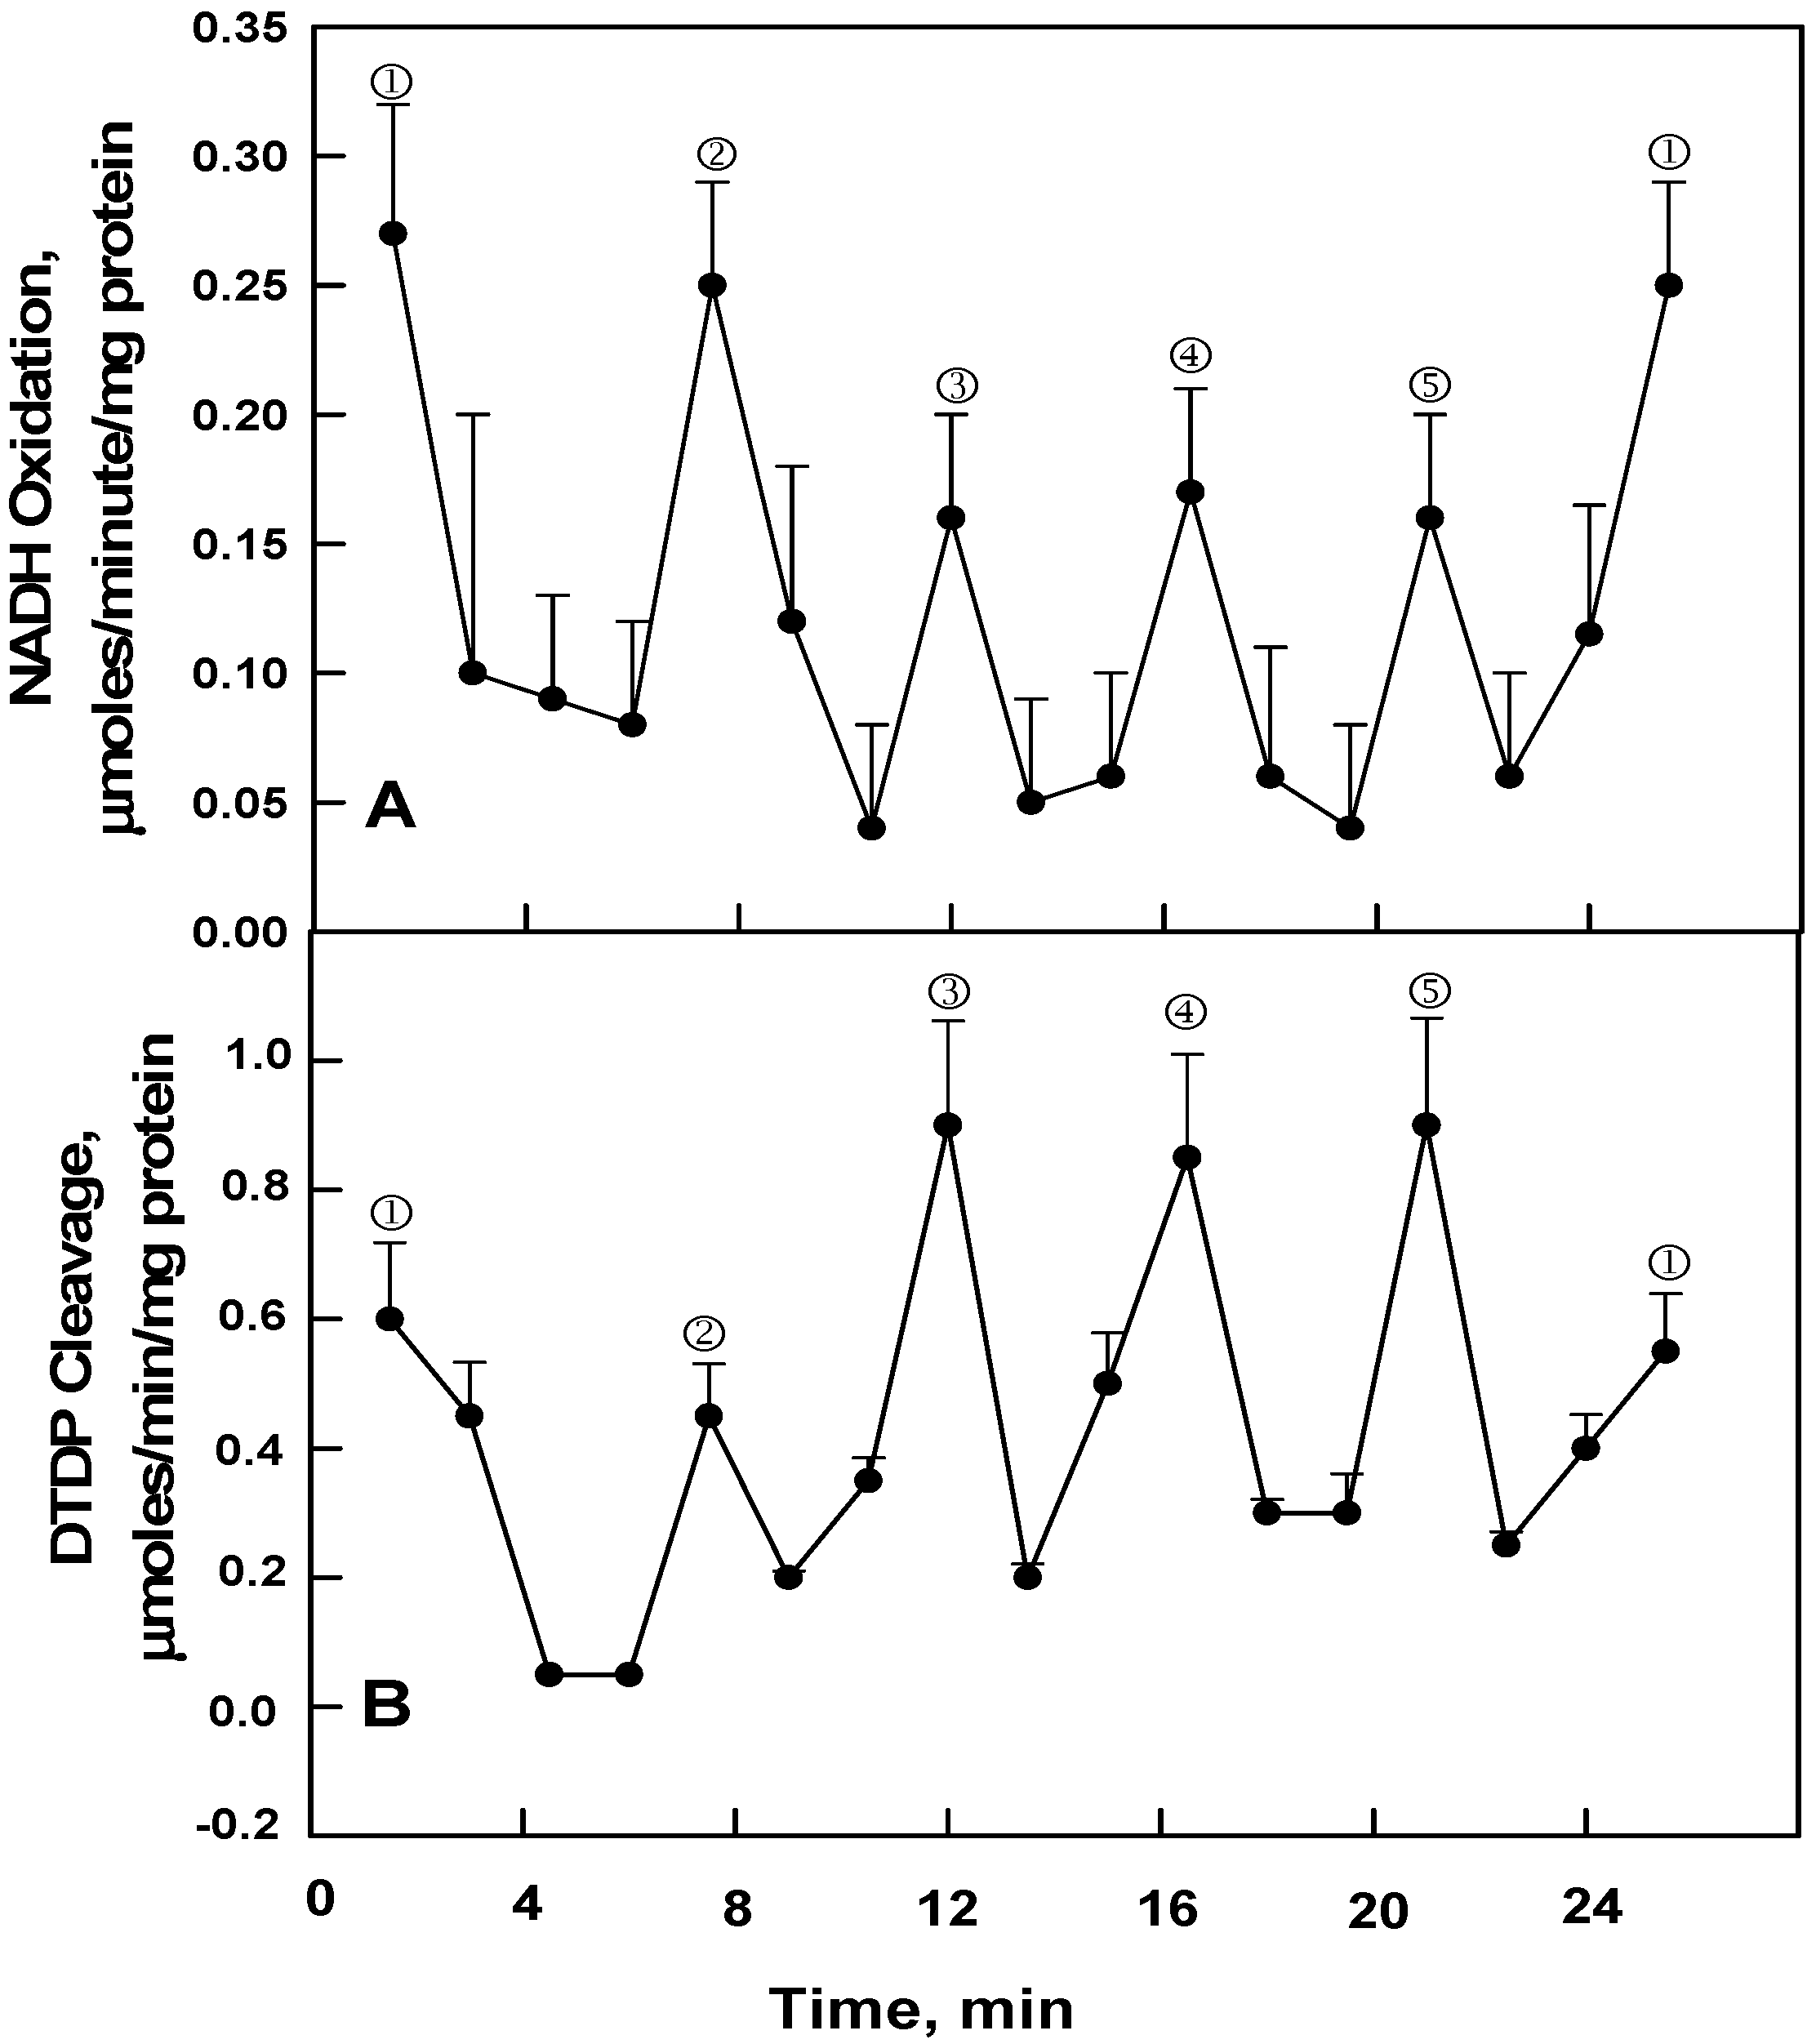
The ENOX proteins are further characterized by having two distinct biochemical activities both of which are essential to their functioning in the growth process—that of NADH or hydroquinone oxidation (
Figure 2A) and that of protein disulfide-thiol interchange (
Figure 2B). With NADH or hydroquinone oxidation, maxima ① and ② are most evident (
Figure 2A) whereas with protein disulfide-thiol interchange, assayed from the cleavage of an artificial dithiodipyridine (DTDP) substrate, maxima ③, ④ and ⑤ dominate.
Figure 2,
Figure 3 and
Figure 4 are averages of 3 to 6 decomposition fits [
11] ± standard deviations that trace the specific 2 + 3 oscillations from ENOX proteins to water as the ultimate source. For consistency, the data are generated in the same manner for each figure following the methods for measurements of NADH oxidation (
Figure 2A) where the decrease in A
340 from spectrophotometer traces averaged over exactly 1 min are taken at intervals of 1.5 min (for details see [
5]).
Figure 1.
Diagrammatic representation of the signature ENOX cycle with measurements averaged over 1 min at intervals of 1.5 min. Typically there are five maxima, two of which ① and ② are separated by 6 min and three of which ③, ④ and ⑤ are separated from each other and from ① and ② by 4.5 min. The asymmetry defines a 24 min period (6 min + (4 × 4.5 min)). Reproduced from [
4] with permission from Springer Science + Business Media.
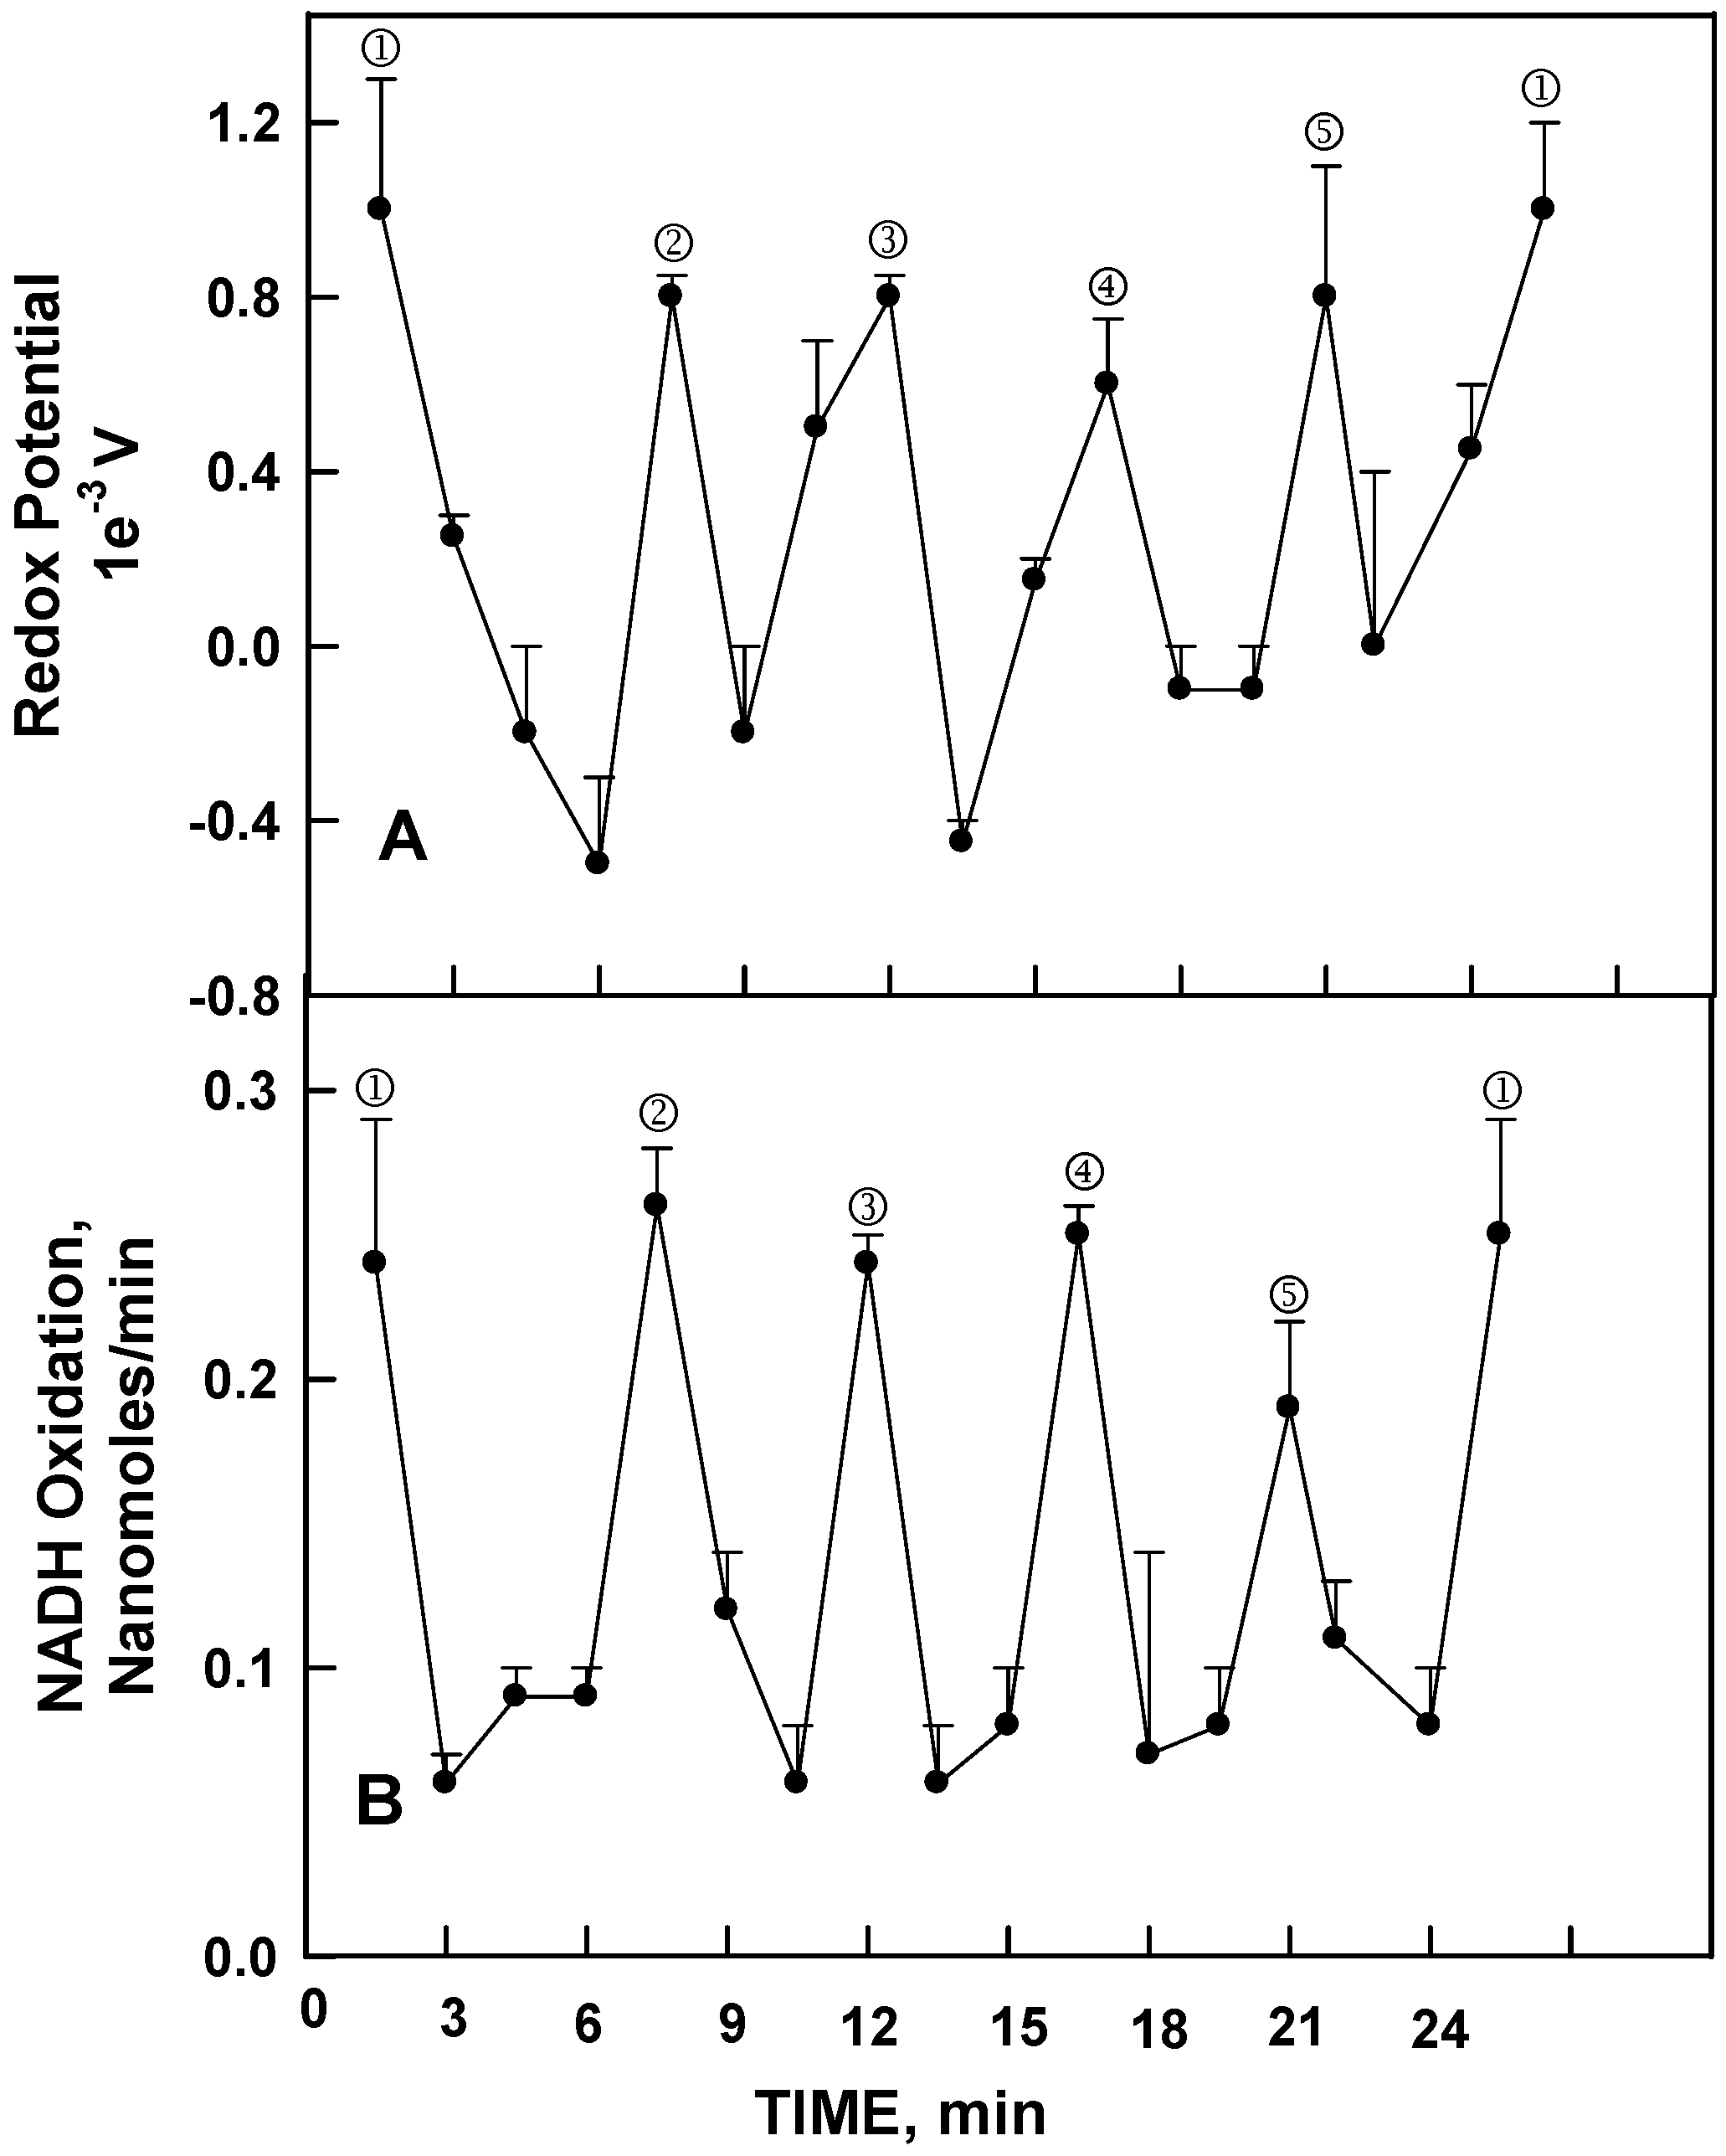
All ENOX proteins require bound Cu
II for activity [
9,
10]. Activity is lost when the ENOX proteins are unfolded in the presence of the copper chelator bathocuproine and then refolded. Unfolding and refolding in the presence of Cu
II and absence of chelator were without effect on activity. In control experiments, the oscillatory activity was recovered quantitatively with the removed Cu
II in preparations devoid of protein, as measured either as a change in redox potential sufficient to drive NADH oxidation (
Figure 3A) or by NADH oxidation per se (
Figure 3B). Both showed a similar oscillatory pattern with a precise 24 min period recapitulating the periodicity of NADH (hydroquinone) oxidation/protein disulfide-thiol exchange of the Cu
II bearing ENOX proteins (
Figure 2). The principle difference was that Cu
II alone did not catalyze protein disulfide-thiol interchange such that each of the five maxima for NADH oxidation were of nearly equal magnitude (
Figure 3B).
Thus, the copper bound to the ENOX protein, as a Cu
II hexahydrate, emerged as the driver of the protein oscillations, a conclusion supported by Extended X-ray Absorption Fine Structure Spectroscopy (EXAFS) measurements using the Advanced Photon Source of the Argonne National Laboratories [
12].
Figure 2.
Averages of 3 (B) or 4 (A) decomposition fits [
11] ± standard deviations of oscillatory patterns of human ENOX1 activity with a period length of 24 min. (
A) NADH oxidation measured as the decrease in A
340 averaged over 1 min every 1.5 min; (
B) Protein disulfide-thiol interchange activity measured from the cleavage of the artificial substrate dithiodipyridine (DTDP). Note that the two activities tend to alternate with maxima ① and ② separated by 6 min enhanced for NADH oxidation whereas maxima ③, ④ and ⑤ separated from each other and maxima ① and ② by 4.5 min are more conspicuous for DTDP cleavage.
Figure 3.
Averages of 3 (A) or 4 (B) decomposition fits [
11] ± standard deviations for changes in redox potential (
A) and rate of NADH oxidation measured as for
Figure 2A (
B) for 10 (A) or 25 (B) mM solutions of Cu
IICl
2 each with a period length of 24 min. The asymmetric oscillatory pattern of
Figure 1 and
Figure 2 are recapitulated. The major difference being that CuCl
2 solutions are unable to catalyze protein disulfide-thiol interchange so that all maxima are of nearly equal magnitude.
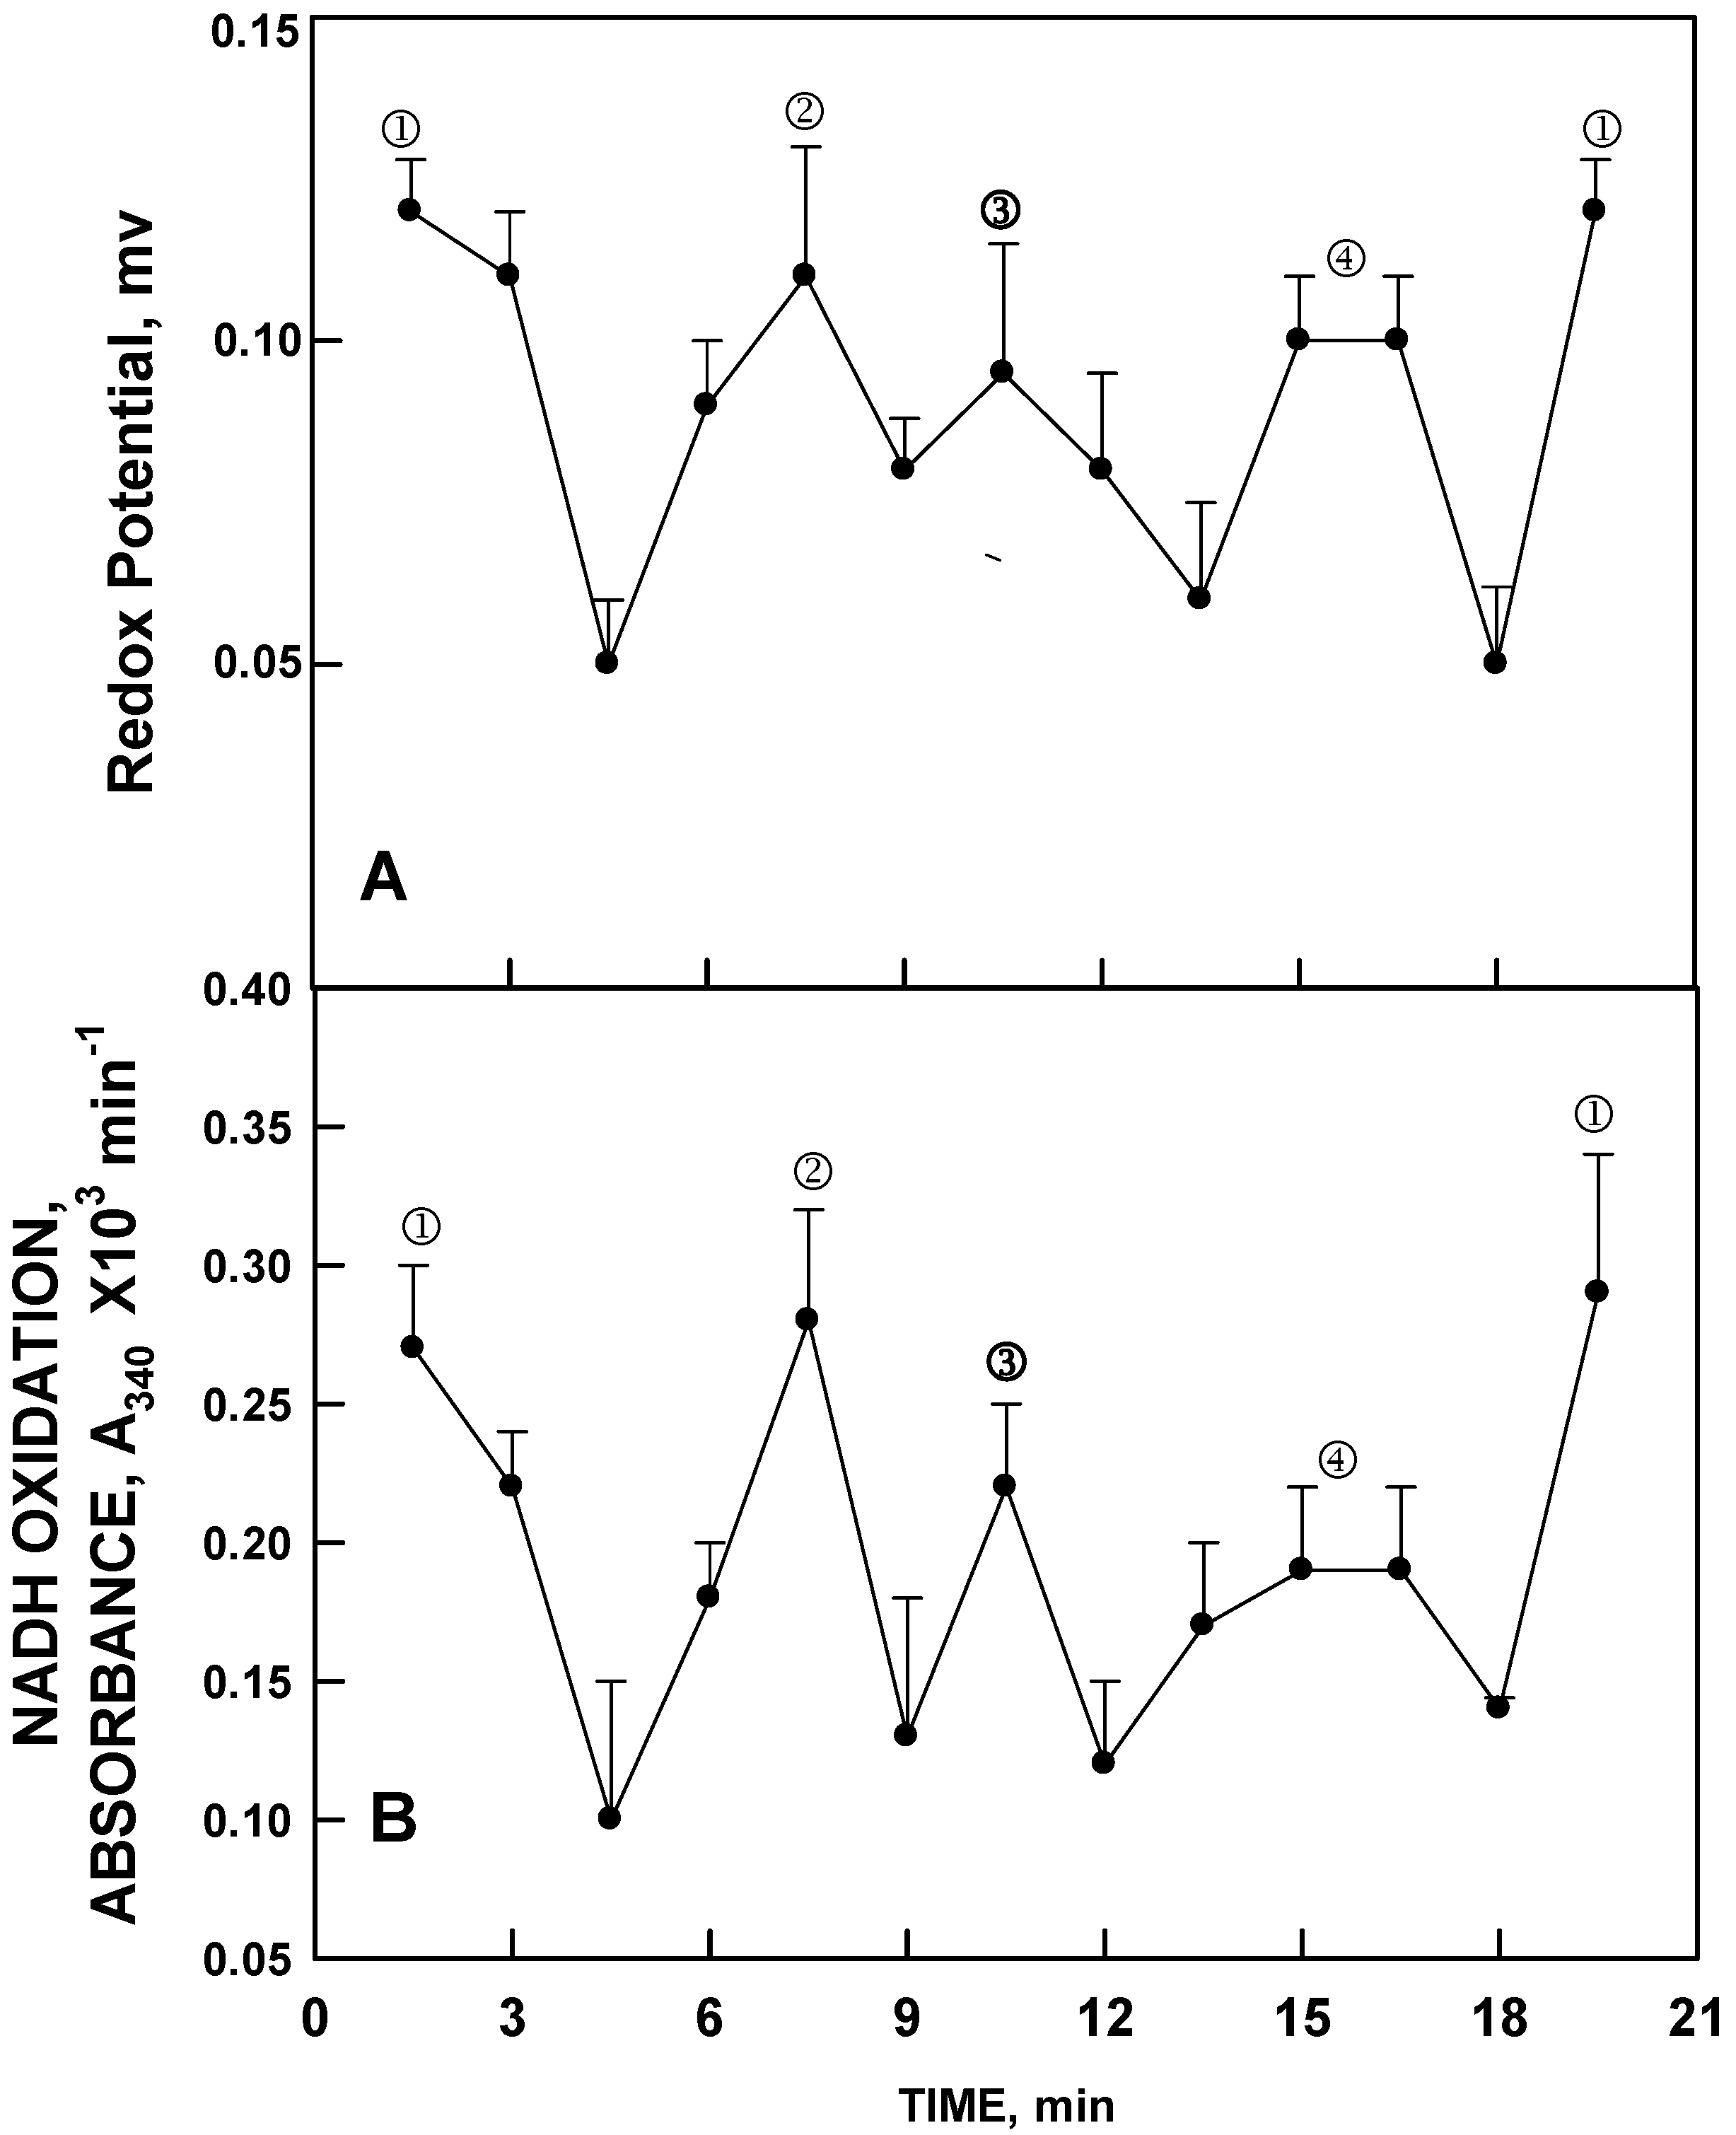
Ultimately, similar oscillations in both redox potential and in NADH oxidation were observed in pure water with a period length of about 18 min (24 min for D
2O) and also confirmed by EXAFS [
13]. Pure water (HPLC grade) essentially devoid of metal cations, exhibited a pattern of alternation in redox potential with the first two maxima separated by six min (
Figure 4A), sufficient to drive NADH oxidation (
Figure 4B). The principle feature is that the period length was about 18 to 20 min as compared to 24 min for ENOX proteins and aqueous solutions of Cu
II, with the method of rate determinations being based on averages over 1 min at intervals of 1.5 min. With this method, however, maxima ④ and ⑤are often incompletely resolved. However, continuous measurements or sequential measurements at 1 min intervals did resolve maxima ④ and ⑤ for water although not as widely separated as for the 24 min oscillations. Maxima labeled ① and ② were phased by exposure to low frequency electromagnetic fields (LFEMF) [
14] with synchrony maintained over extended periods of time. The length of the period was independent of temperature suggesting a physical rather than chemical basis as the source of the oscillations [
3].
Figure 4.
Decomposition fits (
n = 3) as in
Figure 3 except for pure water. The oscillatory pattern is similar except that in the absence of Cu
II, the period length is reduced from 24 min to about 18 min and maxima ④ and ⑤ are incompletely resolved to yield a 4 maxima pattern with (
A) maxima ① and ② separated by 6 min and (
B) maxima ③ and ④ separated from each other and from maxima ① and ② by 4 min.
3. Disequilibrium of Ortho: Para Spin States in Liquid Water that Oscillate
That the underlying mechanism of the biological clock was physical rather than chemical, provided an explanation for two characteristics universally associated with biological timing mechanisms that have been increasingly overlooked in recent years in the molecular analyses of circadian clock mechanisms. One of these, never adequately explained, is the temperature independence of the period lengths of circadian rhythms [
15]. Temperature independence implies an underlying physical rather than a chemical or a metabolic basis. The second was that heavy water, deuterium oxide, was the only substance known that consistently changed the length of the circadian day in a wide range of organisms from a 24 h day to a
ca. 30 h day [
8]. While the D
2O observations clearly implicated a role for water in biological time-keeping, at the time, there was nothing associated with the atomic structure of water sufficiently slow or well characterized to link a time-keeping function to water.
A clue emerged with the report of Tikhonov and Volkov [
16] where equilibration of pure ortho water vapor required 4 h to approach a 3:1 ratio of ortho to para water and appeared to oscillate with a period length of about 18 min in doing so.
Evidence that water vapor is a mixture to two independent fractions of ortho and para spin isomers is consistent with the existence of two independent states of liquid water with long life times and two hydrogen bond types differing in energy as reported by Pershin [
17]. Specifically, the energy of the hydrogen bond between ortho isomers of molecules which always rotate was seen to be lower than between para molecules, a part of which cannot rotate at room temperature. The conclusion was reached that this overheating—overcooling process observed by Pershin [
17] was a fundamental property of water approximated by a harmonic function without noticeable damping.
Subsequent studies have contributed evidence of ortho-para spin conversions [
13,
18,
19,
20,
21] evidence that was missing from our information prior to the report of Tikhonov and Volkov [
14].
3.1. Spectral Evidence
In our own work [
13], FTIR spectroscopic measurements of ortho-H
2O/para-H
2O interconversions were carried out in the middle infra-red spectra region above a water sample surface determined at 3801 and 2779 cm
−1 respectively in a manner similar to those for NAD(P)H oxidation and redox potential described above (
Figure 5).
The ratios of the two wave lengths exhibited a repeating pattern of oscillations which when analyzed by decomposition fits using an imposed period length of 18 min revealed the typical oscillatory pattern of the biological clock with recurrent maxima, two of which labeled ① and ②, were separated by about 6 min and either 2 or 3 additional maxima separated in time by 3–4 min. Maxima labeled ④ and ⑤ are incompletely resolved and ③ and ④ + ⑤ are separated from each other and from maxima ② by 4 min (6 min + (3 × 4 min) = 18 min) which may represent the more typical water pattern. For water, maxima are either very close together or unresolved.
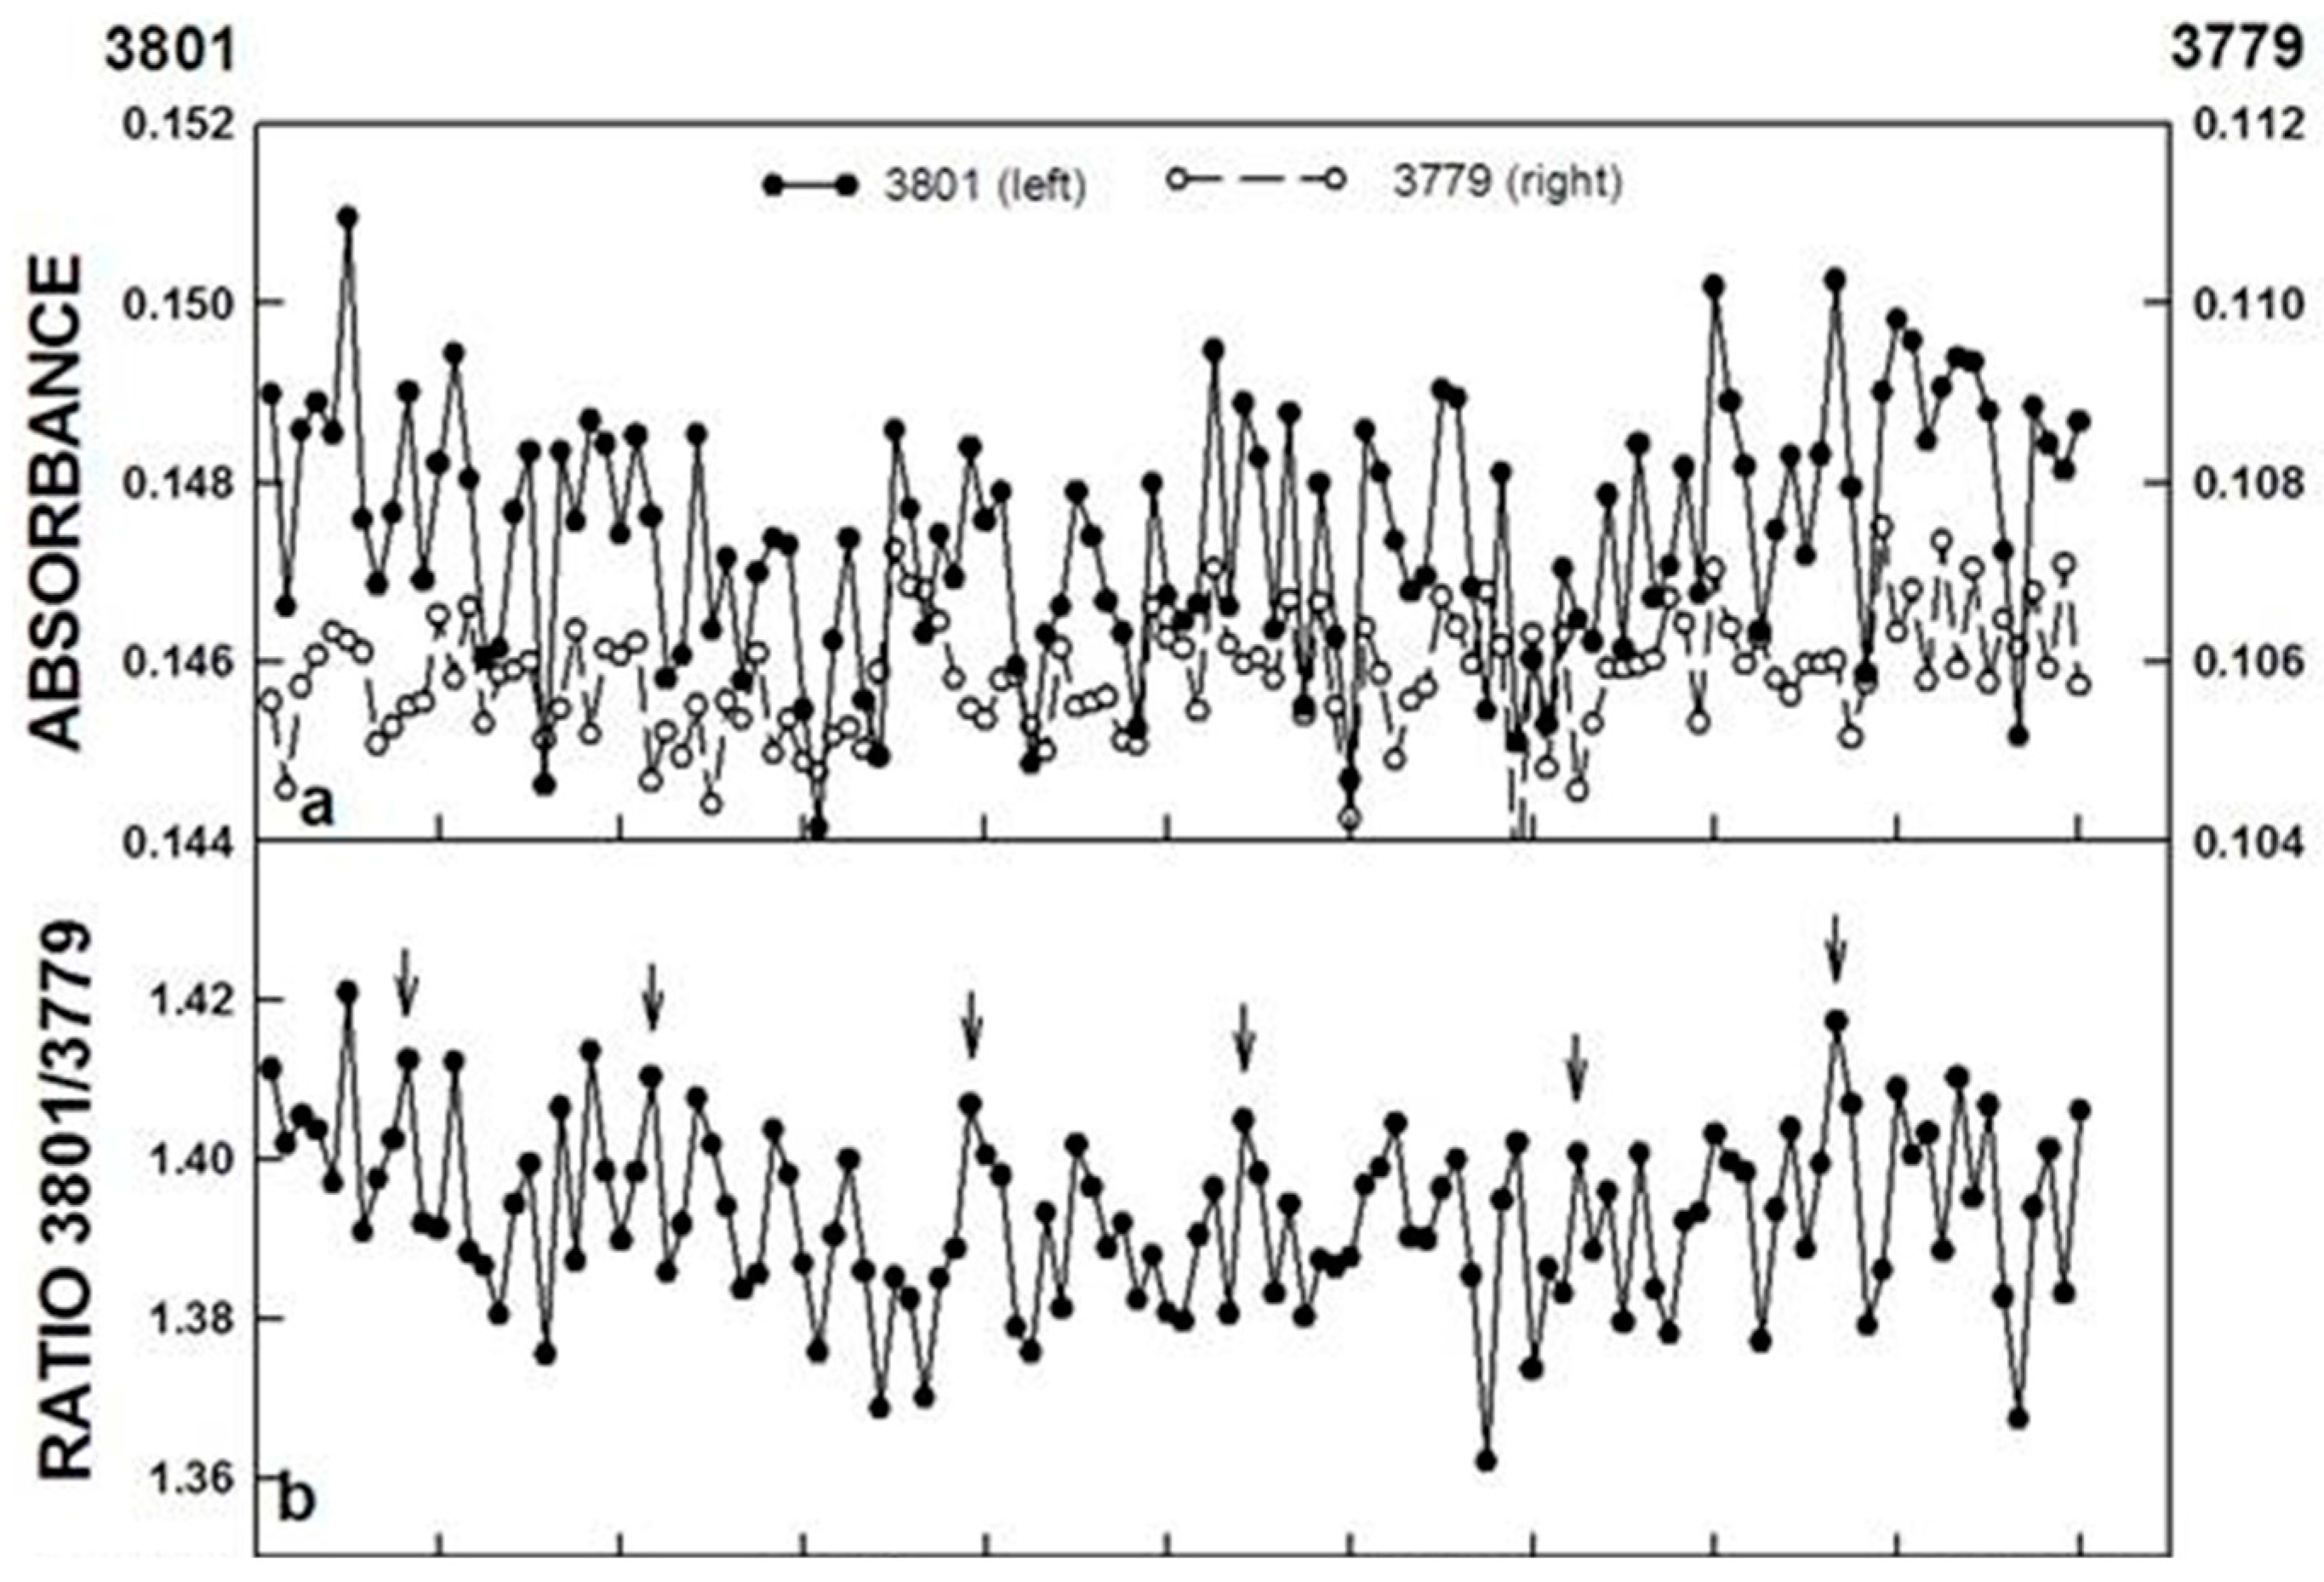
Figure 5.
FTIR spectroscopic measurement of the ratio of para-H
2O/ortho-H
2O above a water sample surface determined at 3801 and 3779 cm
−1, respectively. (
a) The ratio of the two wave lengths exhibited a repeating pattern of oscillations of five maxima at intervals of about 18 min (arrows); (
b) Decomposition fits using an imposed period length of 18 min of data collected at 3801 cm
−1; (
c) and at 3779 cm
−1 (
d), as well as the ratio of the two, revealed the oscillatory pattern typical of water with five recurrent maxima, two of which, labeled ① and ②, were separated in time by about 4.5 min and three additional maxima separated in time by 3.4 min, labeled ③, ④ and ⑤. The accuracy measures, MAPE, MAD, and MSD are indicative of a close fit between the original and the fitted data. Reproduced from [
13] with permission from Elsevier.
3.2. Water Luminescence a Result of Ortho-Para Oscillations
In the study of Gudkov
et al. [
22], air-saturated double distilled water was exposed for 5 min to low-intensity laser infrared radiation at the wavelength of the electronic transition of dissolved oxygen to the singlet state (1264 nm). After a latent period of more than 2 h, auto-oscillations of water luminescence in the blue-green region were observed over several h without indications of damping. The laser-enhanced auto-oscillations were not observed if water was irradiated beyond the oxygen absorption band or if oxygen was removed from the water. Wavelet transform analysis of the luminescence records indicated two characteristic periods of pulsations of about 300 and 1150 s. These times correspond to the oscillation periods of the concentration ratios of the ortho and para spin isomers of water molecules reported by us [
3].
The assumption that follows is that the oscillations in luminescence are the result of an alternation of the two energetic water states (ortho and para) with luminescence augmented auto-catalytically on the laser-induced steady state formation of singlet oxygen. The oscillations in the luminescence data may result from energy discharged as the synchronized paired hydrogens of the water transition from their high energy to their low energy states. Two such different energetic states would be consistent with alternation of the ratios of ortho and para nuclear spin isomers. Thus, water luminescence may represent the release of energy in the form of light as the highly synchronized ortho-para disequilibration returns from the high energy to the low energy state.
The latter supposition is supported by observations that oscillatory changes in redox potential and NADH oxidation in pure water occur in solutions purged of dissolved oxygen and occur in a manner where both amplitude and period length are independent of the concentration of dissolved oxygen and are unresponsive to infra-red irradiation..
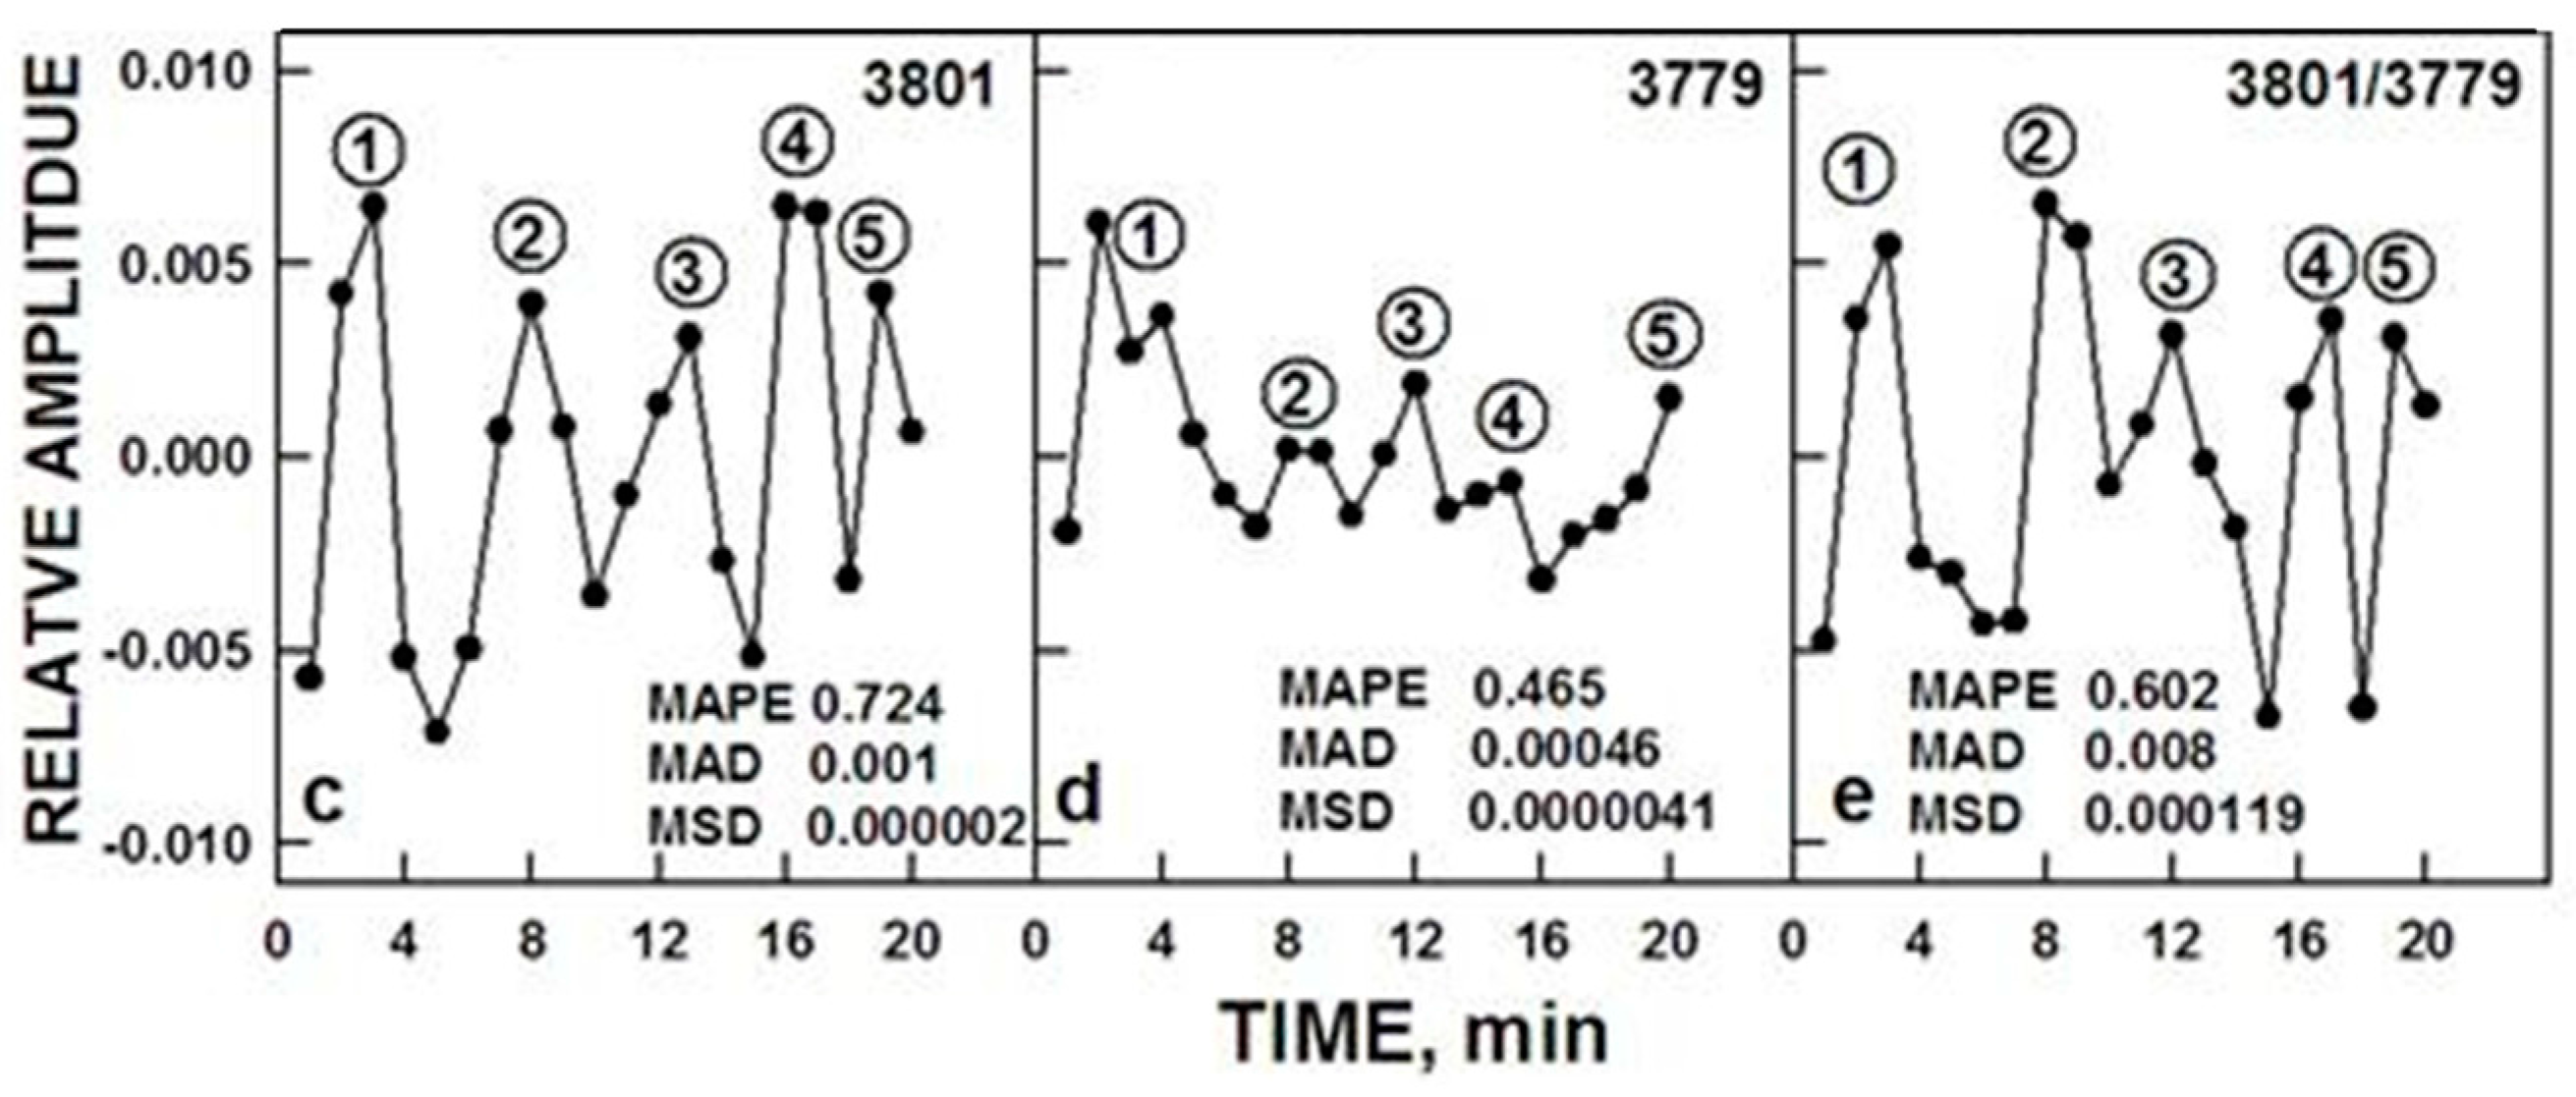
We observed a similar phenomenon in pure water in the absence of excitation by laser radiation although at an intensity
ca. 25% of that following laser excitation and presumably not requiring involvement of singlet oxygen in the excitation process (
Figure 6). Decomposition fits of those data show a clearly defined pattern of oscillations with the two of the maxima labeled ① and ② separated by an interval of 6 min. With the moving-averaged data collected at 1 s intervals of
Figure 7, the decomposition fit clearly resolved the primary data into four maxima where two of the maxima were separated by 6 min following the same pattern as described for
Figure 4.
3.3. Limit Oscillator Model
An appropriate model to provide sustained ortho-para oscillations comes from studies of limit oscillators [
5] of which control of heart beat rate is the classical example. That certain materials may preferentially adsorb para water due to non-rotational ground state [
22] implies that populations of water molecules might spontaneously form some sort of collective order whose structure subtly favor formation of para water. In the manner of limit oscillators, as para water forms, it might locally add to the field generated by the collective order which would further favor the accumulation of para water for some period of time. However, also, in keeping with the limit oscillator model, the initial conditions favoring para water formation would produce an increased potential that would be released or discharged only after some minimum threshold of activation energy was achieved. Once the minimum threshold was achieved, a discharge of potential and conditions favorable to ortho water formation would result and the process would now run for a time in the opposite direction until some threshold level of ortho water was restored and the cycle would reverse.
The conclusion was reached that this overheating-overcooling process may be a fundamental property of water, which manifests itself at any temperature and is not the result of perturbation of overcooled water by an optical pulse. Pershin’s [
17] findings show “
that such an evolution of the band center is steadily observed in water and at room temperature. Moreover, this overheating-overcooling process is approximated by a harmonic function without noticeable damping”.
Figure 6.
Decomposition fit [
11] of luminesce data of Gudkov
et al. [
23] collected at intervals of 1 sec averaged over 1 min every 1.5 min prior to infrared laser activation. Maxima labeled ① and ② are separated by 6 min as for
Figure 4.
Figure 6.
Decomposition fit [
11] of luminesce data of Gudkov
et al. [
23] collected at intervals of 1 sec averaged over 1 min every 1.5 min prior to infrared laser activation. Maxima labeled ① and ② are separated by 6 min as for
Figure 4.
The differences in energies of the different spin isomers of water are small (less than 10
−24 erg) [
24] and are much lower than the energy of thermal motion. Therefore, a spin-only interaction would not be expected to affect intermolecular interactions. On the other hand, the absorption rates of ortho and para water from water vapor to various organic and inorganic sorbents have been observed to differ markedly with the binding of the para isomer. Estimates by these authors of the energy barriers that determine rates of absorption suggest that the difference in free energy barriers may exceed the energy of spin-spin and spin-orbit interaction by many orders and raises the possibility that the spin state of water may substantially influence physical, chemical and biological phenomena in parallel to changes in redox potential.
The method of complex wavelet transforms may be the most adequate method for analysis of problems of this kind [
25]. Periods of approximately 18 and 5 min have been observed previously by the wavelet transform analysis method [
26].
Figure 7.
Decomposition fit [
11] of moving averages of luminescence data of Gudkov
et al. [
18] collected at 1 sec corresponding to a Fourier signal at 2874 s =
ca. 4.8 min revealed within each 18.8 min period consisting of four unevenly spaced maxima, two of which, labeled ① and ② were separated by six min and two of which ③ and ④ were sparated from each other and from maxima ① and ② by about 4 min (6 min + 3 (4 min) = 18 min) recapitulating the overall pattern of
Figure 4.
3.4. Oscillations in NADH Oxidation are Driven by Oscillations in Redox Potential
Rates of NADH oxidation correlated with fluctuations in continuous traces of redox potential, the latter being sufficient to drive the oxidation of NADH (
Figure 8).
Figure 8 illustrates simultaneous measurements of redox potential and NADH oxidation for a solution of copper chloride. For both, the pattern consists of five maxima two of which are separated by 6 min. The redox measurements are from a continuous trace (
Figure 8A) whereas the rates of NADH oxidation were measured in parallel over 1 min every 1.5 min to improve resolution (
Figure 8B). Two of the maxima, ① and ② in the figures are separated by 6 min. The remaining three maxima are separated from each other and from maxima ① and ② by 4.5 min. These intervals confer the characteristic asymmetry to the pattern of oscillations, and for solutions of Cu
II, repeat every 24 min.
Figure 8.
The redox potential (A) of an aqueous solution of copper chloride measured continuously showing a 2 + 3 pattern of oscillation with NADH oxidation measured over 1 min at intervals of 1.5 min (B) in parallel. The period length of both is 24 min. Results with pure water are similar except that the period length is now about 18 min.
3.5. Oscillations not Unique to Copper II
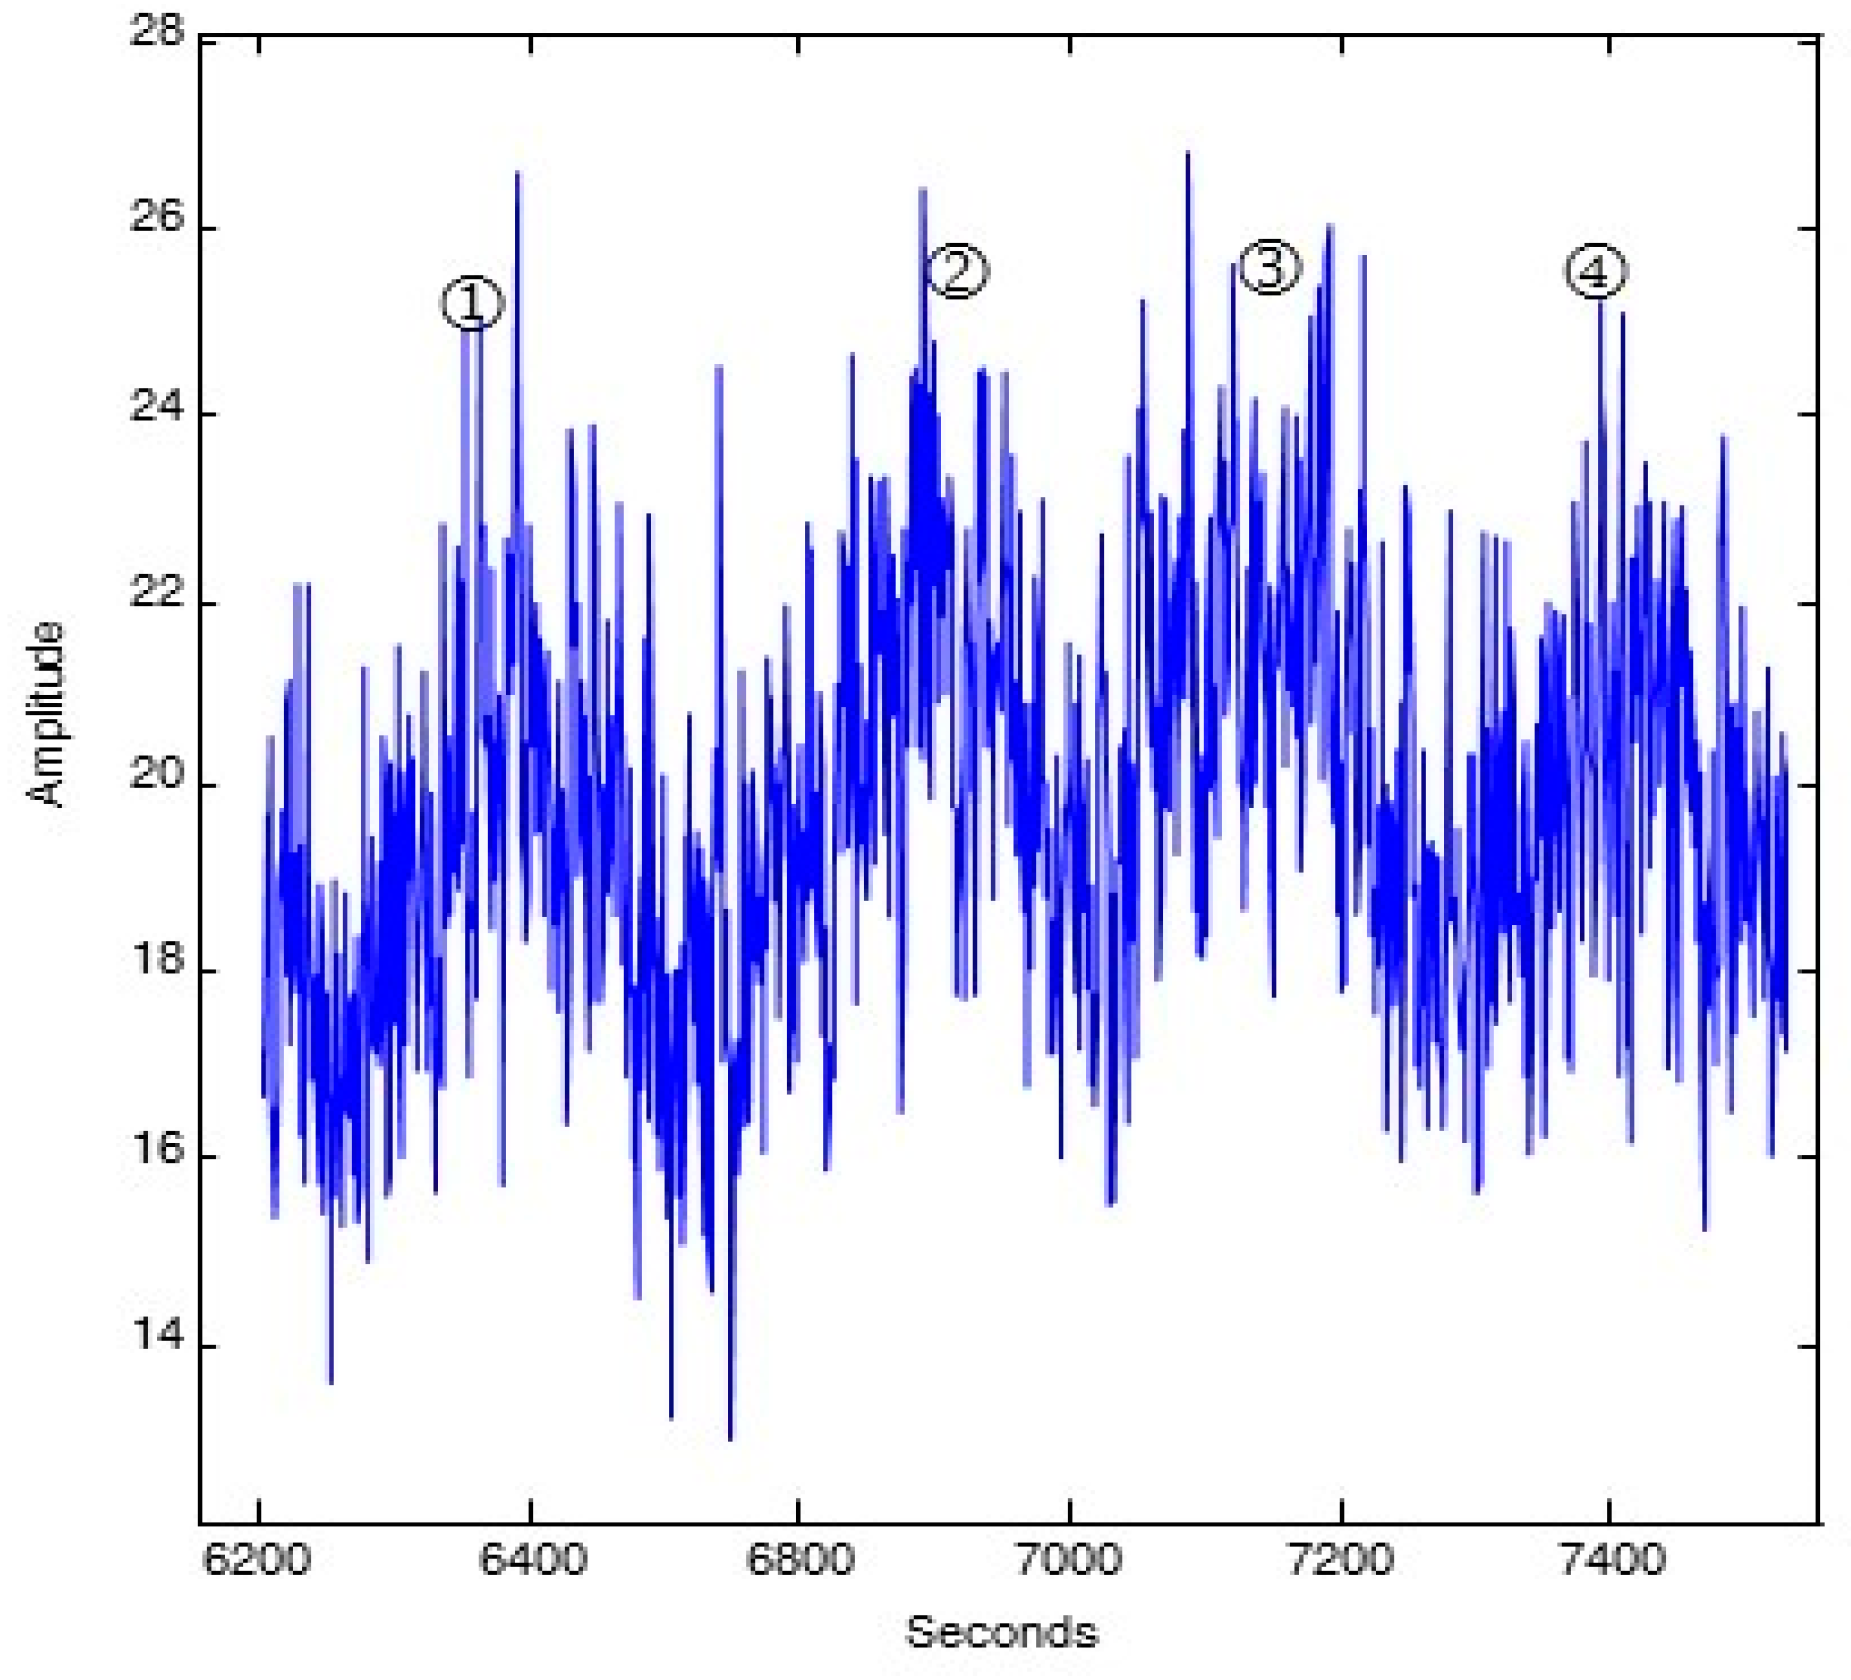
Chlorides of cations other than Cu
II in solution also exhibited oscillations but the period lengths were longer or shorter than those of Cu
II [
3]. The property of these different cations that correlated with the period length of the oscillations was ionic radii (
Figure 9). Period lengths of the oscillations of an aqueous solution were in direct proportion to the ionic radius of the cation and independent of the concentration.
Figure 9.
Period length of the oscillations of an aqueus solution is directly proportional to the ionic radius of the cation present and independent of cation concentration. All solutions were tested as the chloride at a final concentration of 10 µM. Only with Cu
2+ (replaceable by Ni
2+) was the asymmetric period length of 24 min observed. Reproduced from Morré and Morré [
3] with permission from Elsevier.
3.6. The Redox Potential and Rate of NADH Oxidation Still Oscillate even with Pure Water in the Absence of Cations
Pure water exhibits periodic oscillations in redox potential and NADH oxidation even in the absence of cations. However, the overall period length is about 18 min. As with Cu
II solutions, maxima ① and ② are separated by 6 min and the remaining maxima are truncated as discussed for
Figure 4.
3.7. Water Oscillations are Highly Synchronous
As reported by Morré and Morré [
27], synchronization of asynchronous water samples was achieved through communication through a thin plastic barrier. When two samples of HPLC grade water contained in plastic spectrophotometer cuvettes, with one sample phased using LFEMF (30 s 40 µT) in a manner to be out of phase with the original water sample, were placed adjacent to each other for only a few min, both samples began to oscillate in parallel. Thus, synchronization of asynchronous water samples was achieved by communication through the thin plastic barrier. When the two samples placed side by side were separated by a thin barrier of sheet copper sufficient to block LFEMF, the phasing of the two water samples was prevented. To test the prediction that contiguous water samples oscillate in phase through LFEMF communication, water was sampled in a shallow pond at a distance of 100 ft apart. Also, water was sampled at opposite ends of a 20 acre lake. As reported previously [
26], in both instances, the samples were synchronous in their oscillatory pattern. Two samples of West Lafayette, Indiana tap water collected simultaneously at two different locations separated by a linear distance of 5 miles (8.3 km) also were synchronous.
Water samples from a flowing stream at
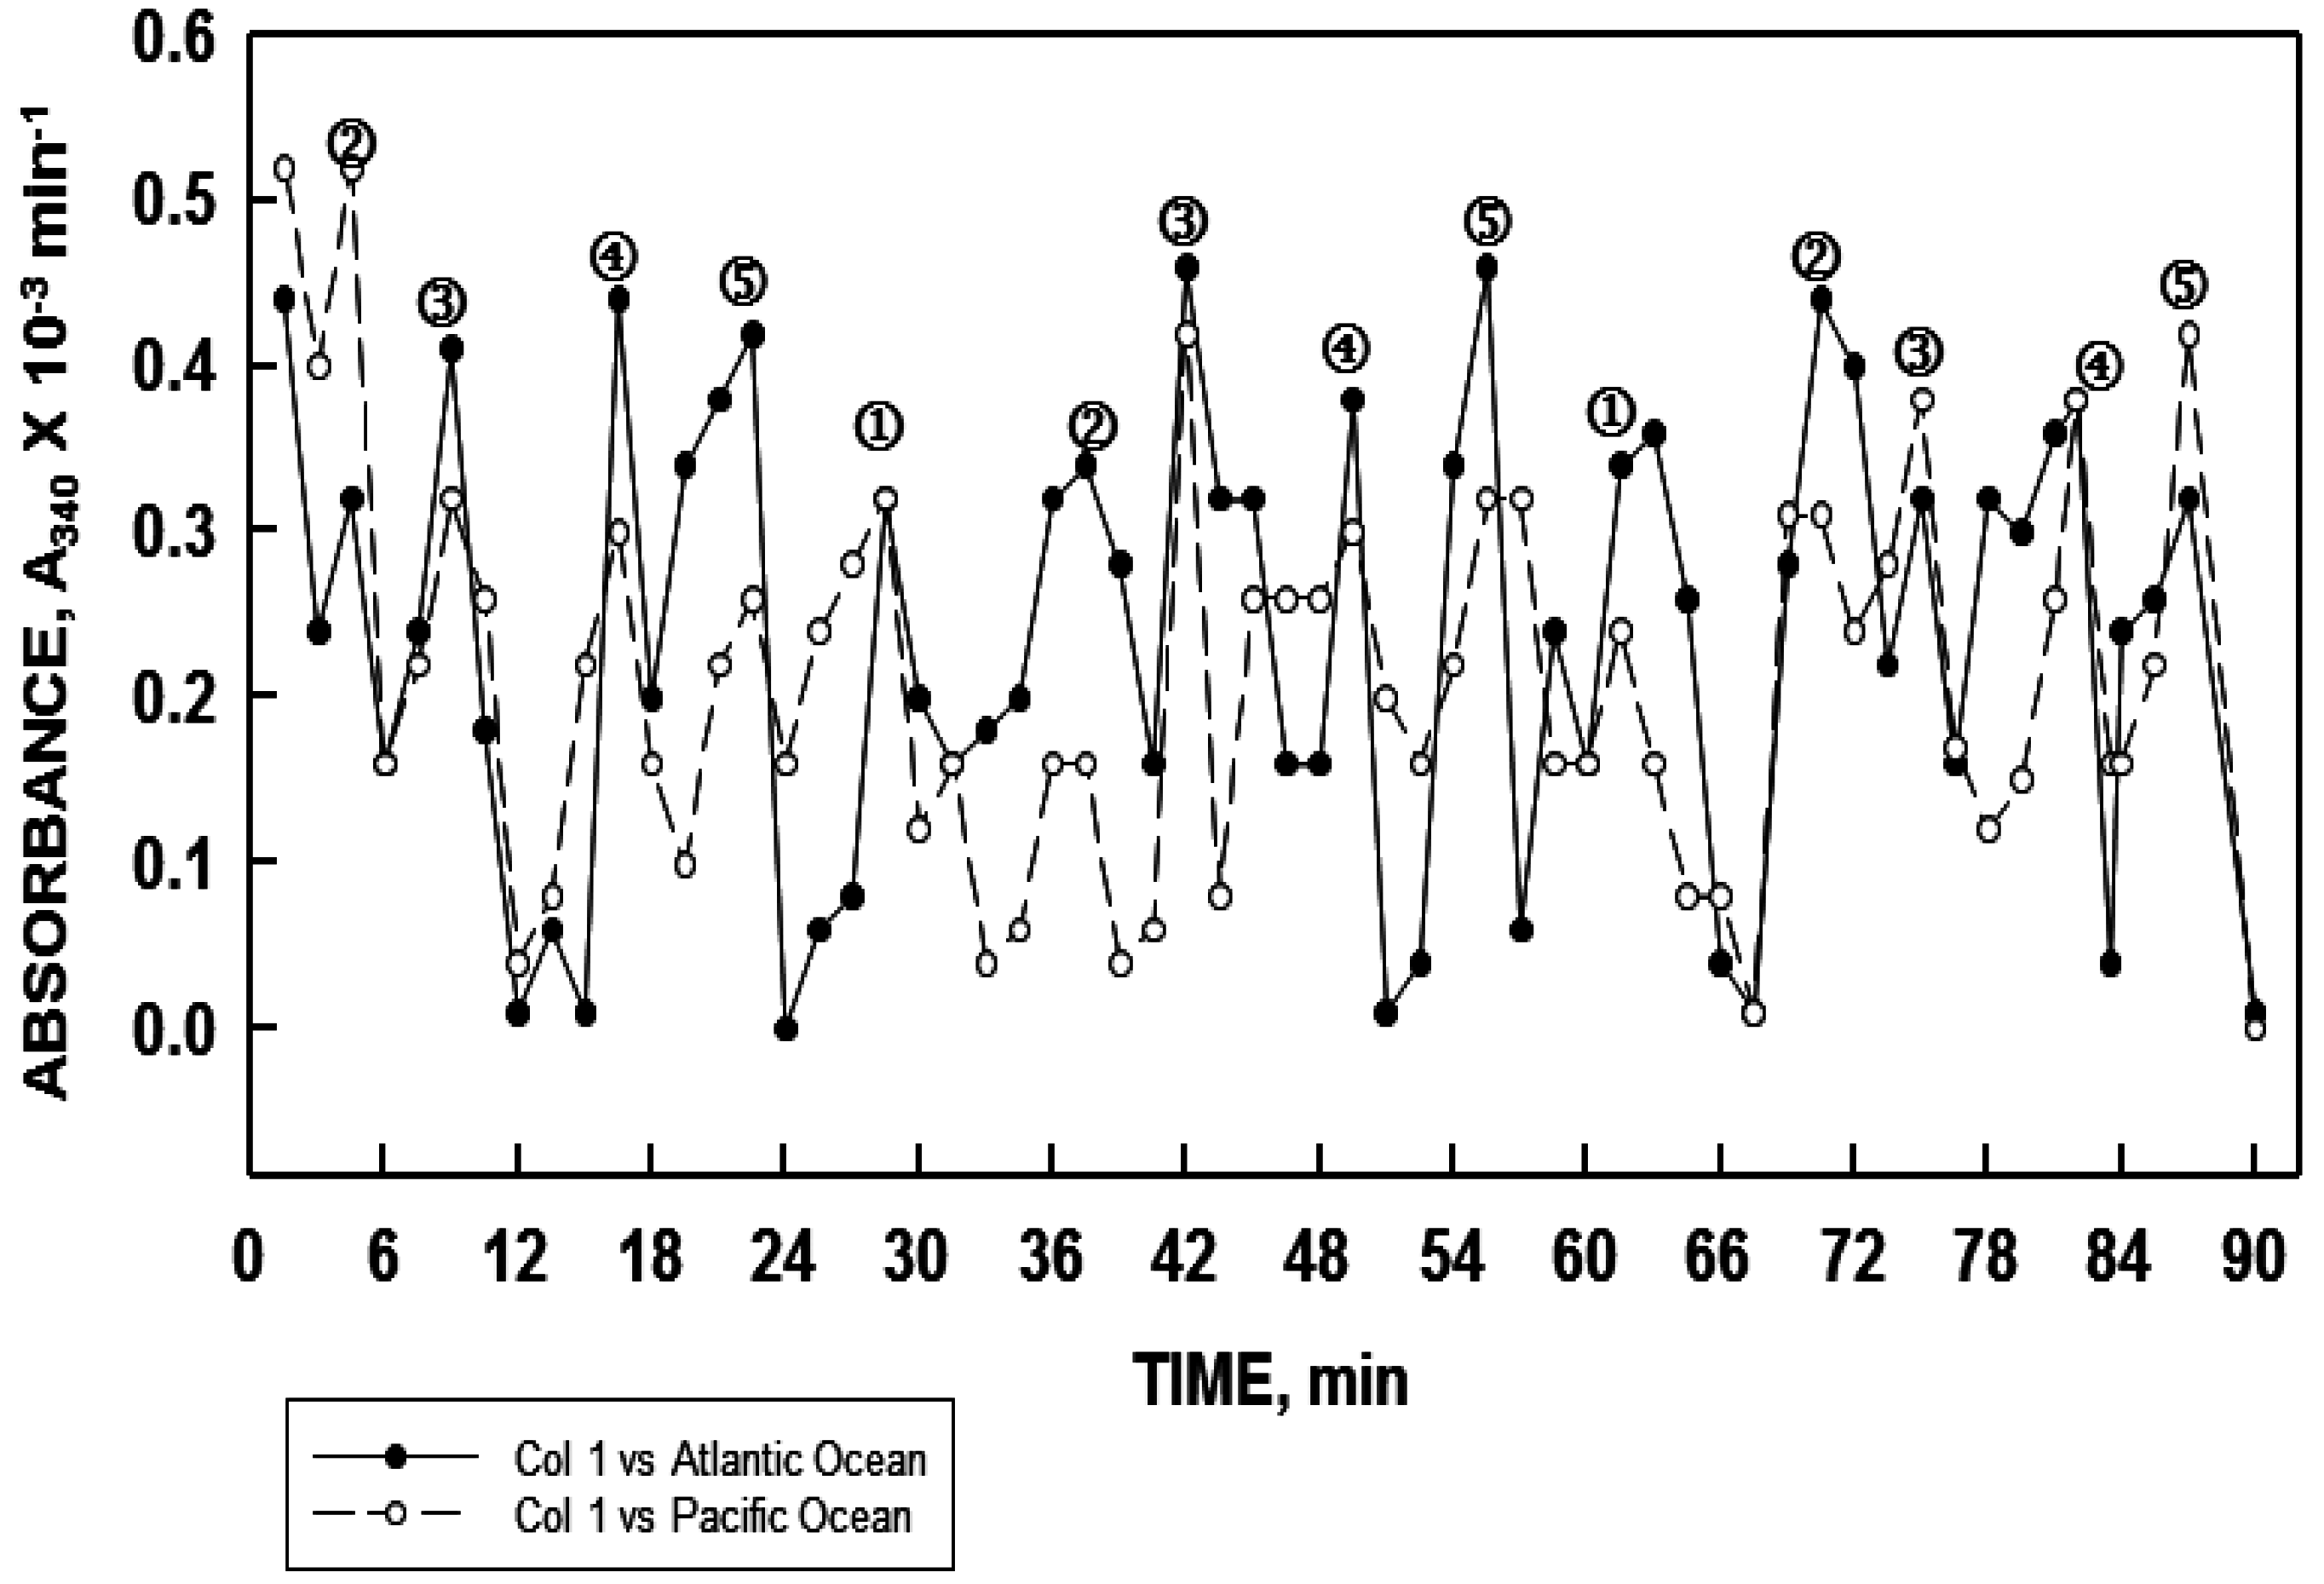
t = 0 and then 15 min later were synchronous. It was estimated that at least 500,000 gallons of water had passed the test site between sample collections. The largest bodies of fresh water samples have been from Lake Ontario and from the Niagra River with sampling points separated by approximately 20 miles for each. Samples from both were synchronous. Simultaneous sampling of water from the Pacific Ocean at San Diego, California and of the Atlantic Ocean at Ocean City, Maryland, also revealed the water at the two sampling points to be in phase with each other (
Figure 10). In these measurements, the period length was approximately 36 min reflective of sodium being the dominant cation (see
Figure 9). These findings, which were confirmed in two separate experiments several months apart, support the concept of water coherence advanced by others [
28,
29] but to an extent greater than that which may have been previously anticipated.
Frequency of the EMF associated with coherent water is estimated to be 1.2 µm in the infrared [
30]. One coherent domain “
speaks” to another domain to align the contained water molecules. The frequency of transmission might be a few kHz. However, the waves are trapped within the water (generated and absorbed by contiguous water molecules) and, for the most part, do not escape [
30]. A seeming exception is access across a plastic or glass surface where transmission apparently does take place to effect synchrony of water in an adjacent plastic or glass container.
A more puzzling exception was subsequently encountered in our attempts to understand how a unique water purification system developed by Grander Wasserbelebung of Jochburg, Austria might function.
Figure 10.
Water sampled simultaneous from the Atlantic Ocean at Ocean City, Maryland (solid line, closed symbols) and from the Pacific ocean at San Diego, California (dashed line, open symbols) exhibited similar synchronous oscillatory patterns when analyzed in parallel.
Figure 10.
Water sampled simultaneous from the Atlantic Ocean at Ocean City, Maryland (solid line, closed symbols) and from the Pacific ocean at San Diego, California (dashed line, open symbols) exhibited similar synchronous oscillatory patterns when analyzed in parallel.
4. Trans-Metal Driven Direct Contact Water Communication
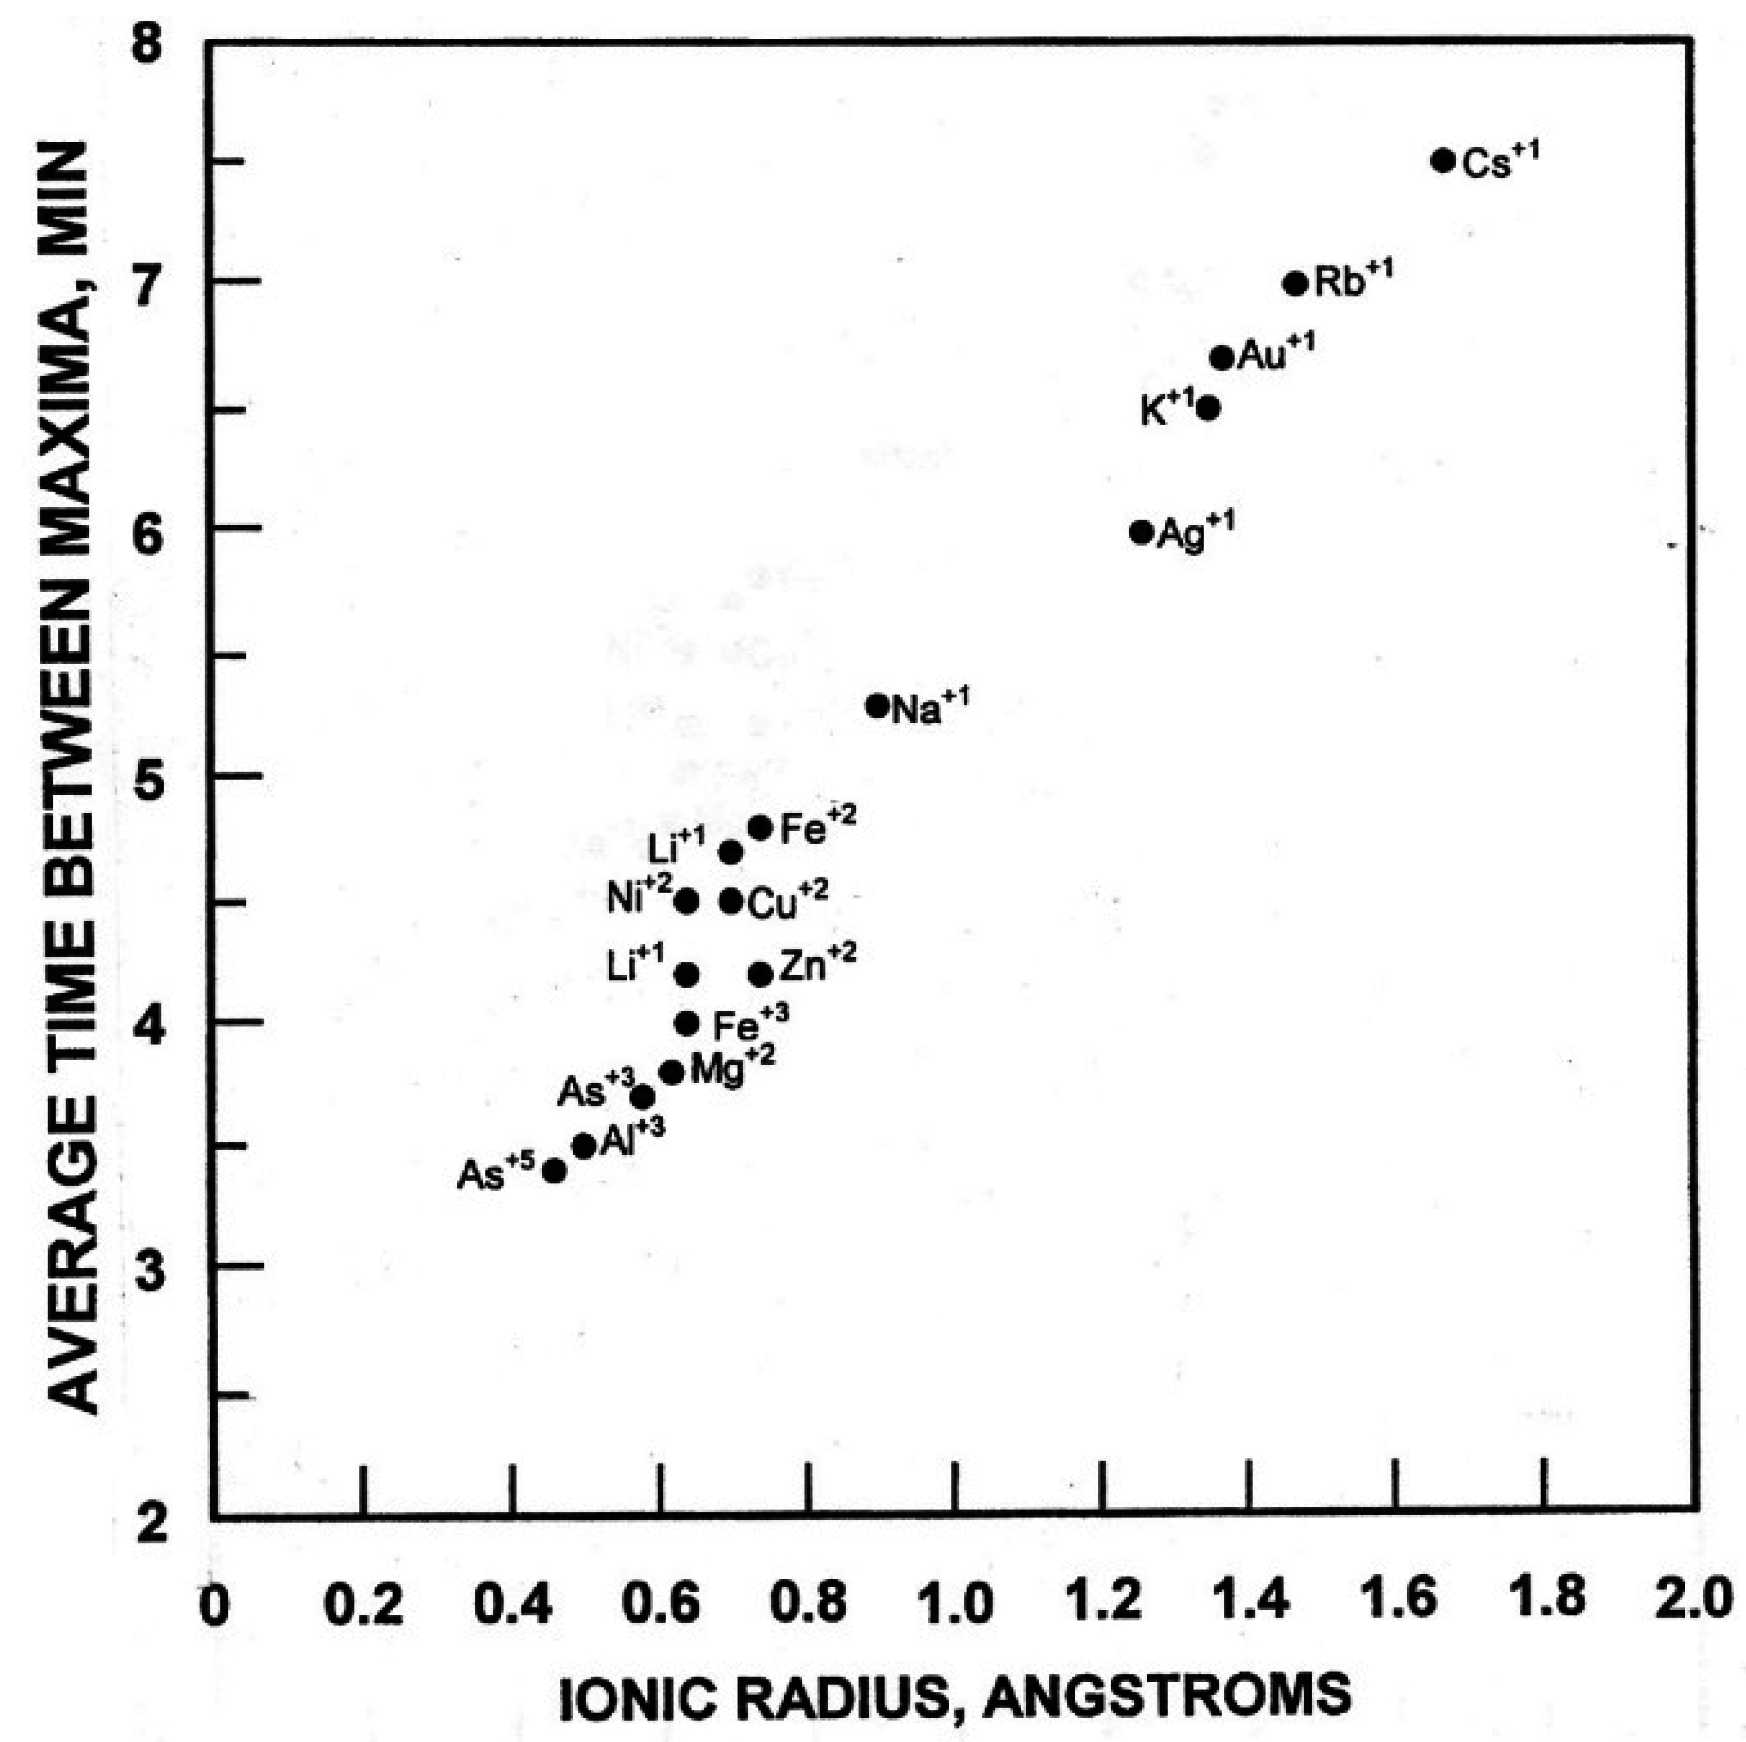
The Grander water purification device is based on the principle that water inside a metal chamber causes a fundamental alteration in the properties of the water passing though the device (
Figure 11). Industrial water passing through the device containing the pure (Grander) water on the inside of the stainless steel encased chamber exits with properties of pure water after only a few seconds of transit through the device. An alternative device is a copper coil where the pure (Grander) water is contained inside the coil and the water to be purified is placed on top of the coil in a glass or plastic container.
Figure 11.
Diagrammatic representation of the Grander water purification device constructed of stainless steel. A transit time through the device of less than 1 min is sufficient to effect the transition.
Figure 11.
Diagrammatic representation of the Grander water purification device constructed of stainless steel. A transit time through the device of less than 1 min is sufficient to effect the transition.
Some cited benefits of Grander-treated water include: More palatable to drink, bacteria will not grow, reduction in scale buildup, increased service life of equipment, reduced allergies and skin problems, use of less soap or detergents when washing clothes and elimination of the need for a water softener.
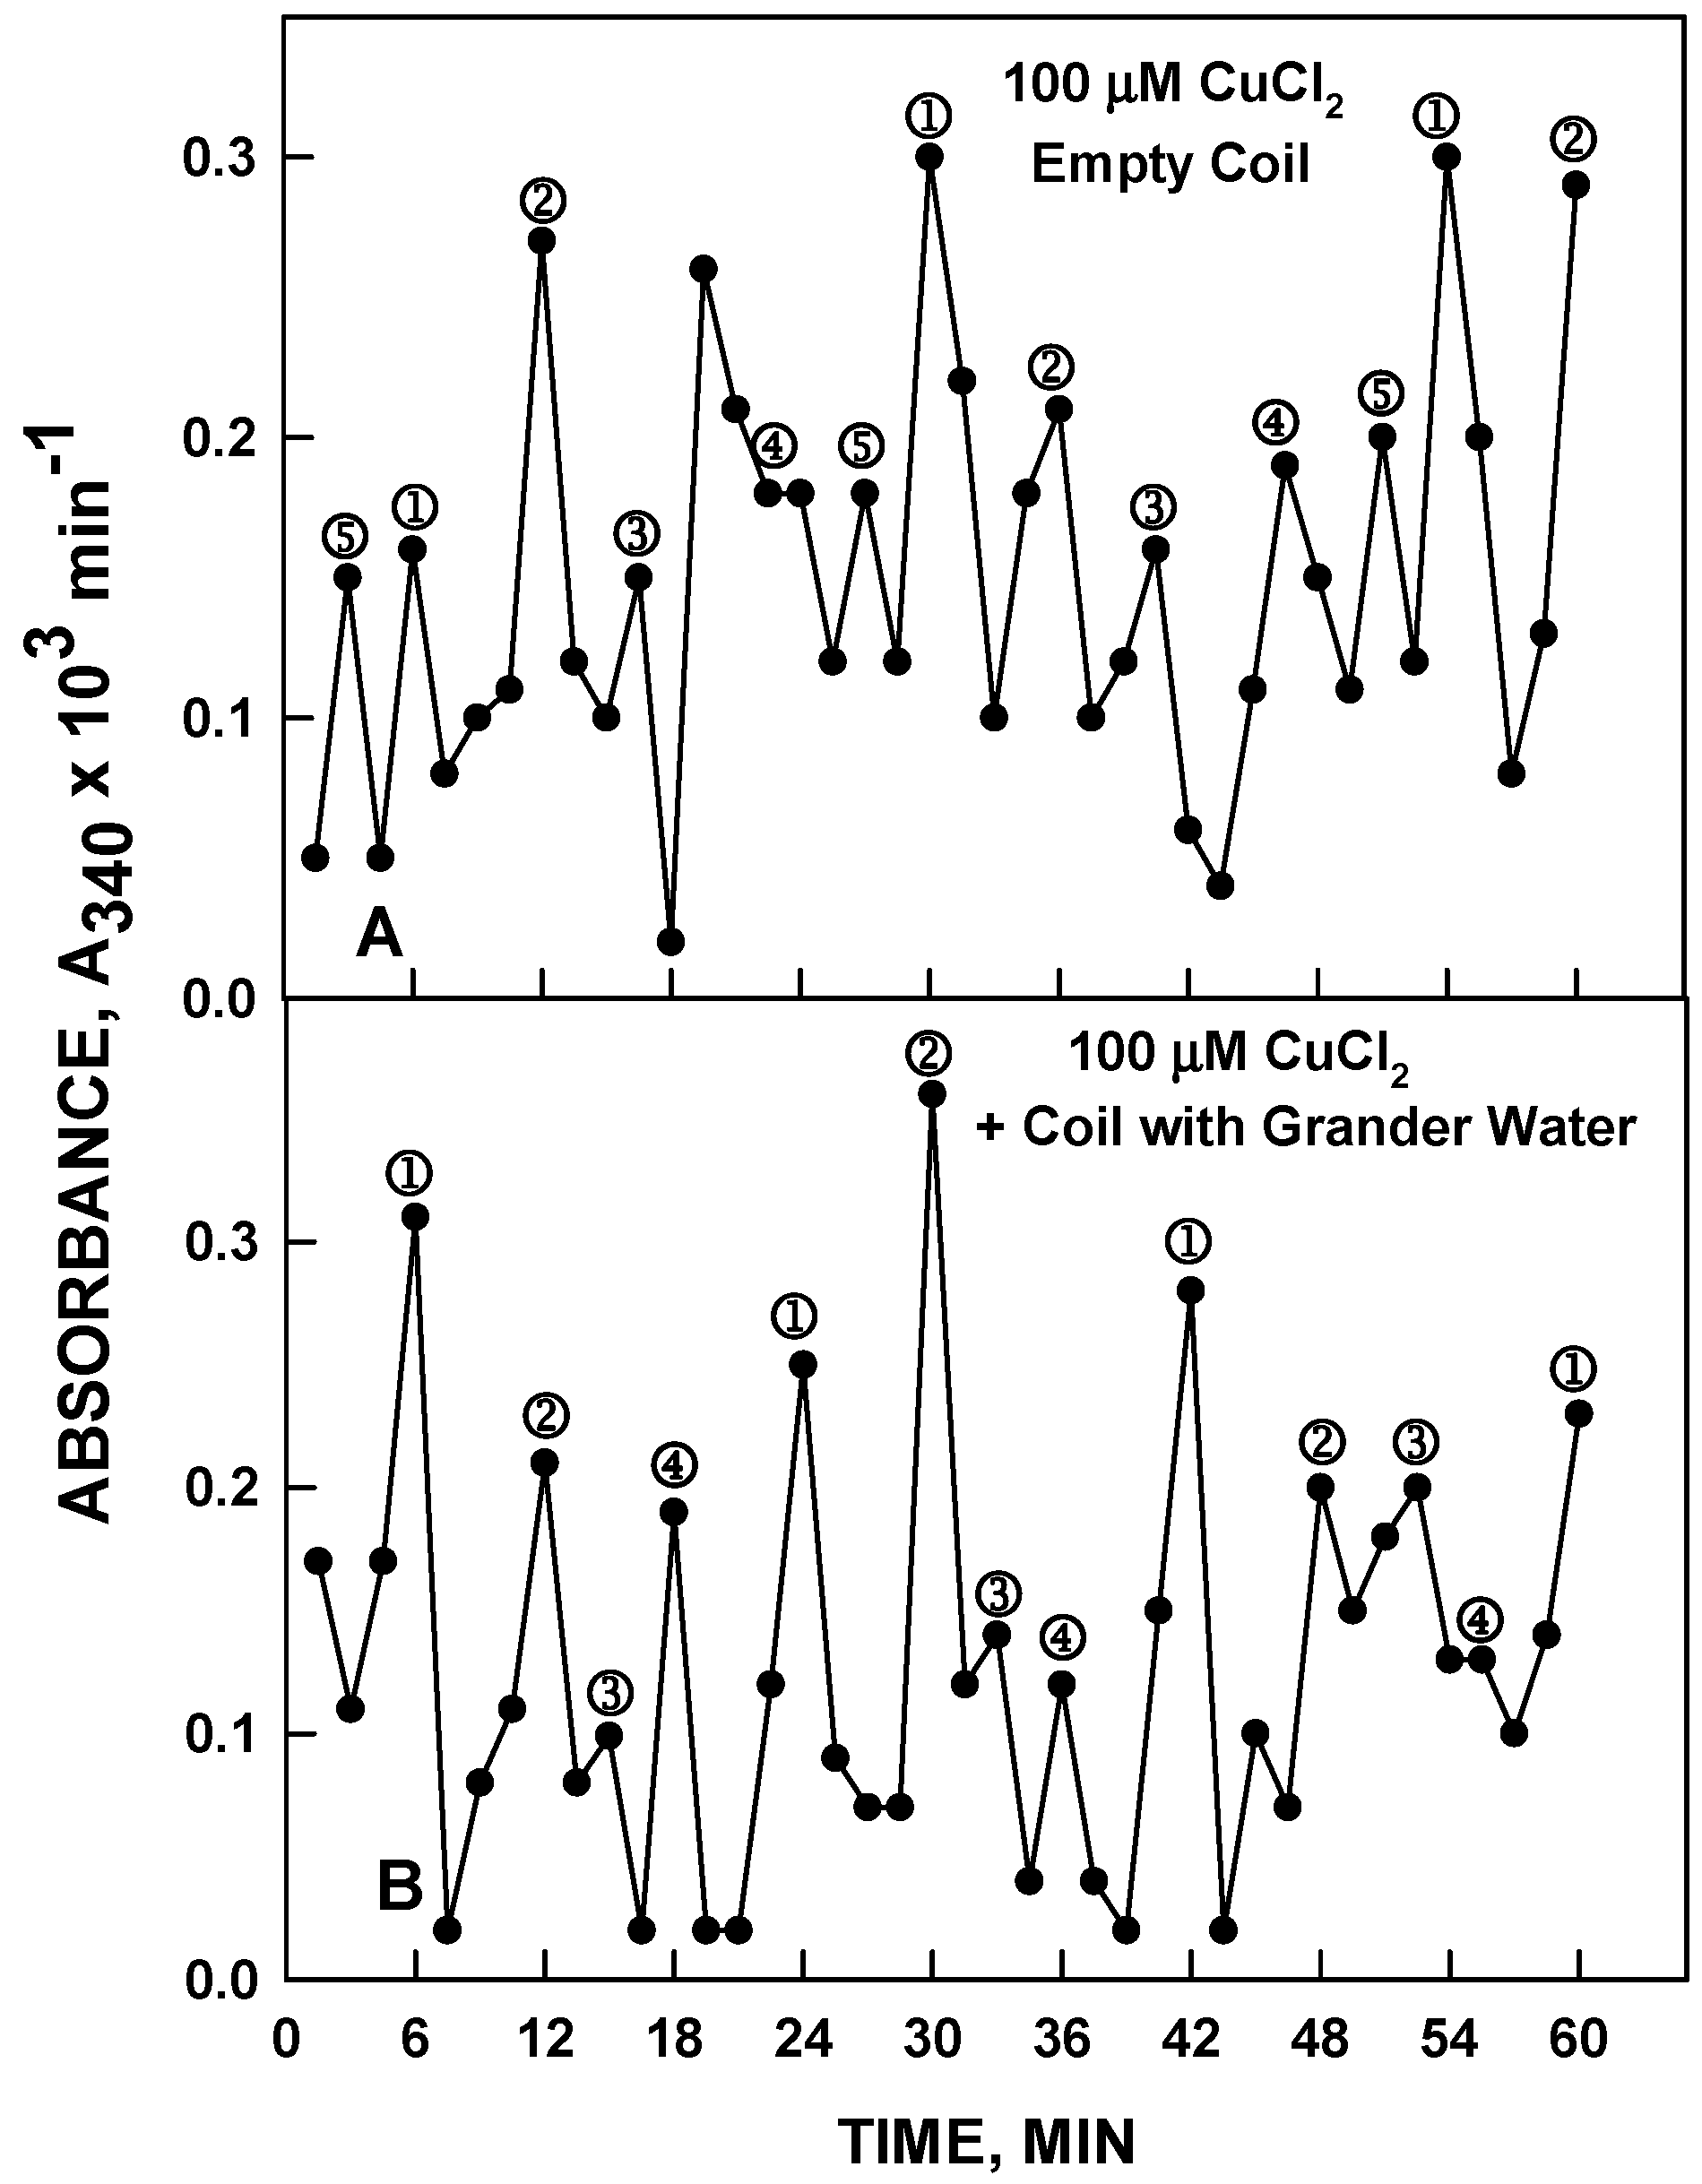
In our initial experiments, the device consisting of the copper coil was used. The test sample in a plastic container containing 120 µM NADH as the redox indicator to measure the length and phase of the period was placed over the copper coil with no liquid inside (empty) or with water or copper chloride (100 µM) inside. With a coil without liquid inside, there was no effect on the length or phase of the water in the test solution placed over the coil (
Figure 12A and
Figure 13A). When the coil contained Grander or HPLC water and the solution in the plastic container was 100 µM CuCl
2, the result was that the water in the plastic container exhibited the 4-maxima pattern with an 18 min period characteristic of pure water in the coil (
Figure 12B) and not the 5 maxima pattern with a 24 min period characteristic of CuCl
2 actually present in the container. Alternatively with a coil containing 120 µM CuCl
2 and with Grander or HPLC water placed over the coil, the Grander or HPLC water in the plastic container assumed the 5-maxima pattern and 24 min period characteristic of the CuCl
2 solutions (
Figure 13B). In all of these experiments Grander water or HPLC grade water produced indistinguishable responses. Whatever water, whether Grander or HPLC, or CuCl
2 prepared in either Grander or HPLC water, was placed in the container on top of the coil, it assumed the same frequency and phase of oscillations characteristic of the water inside the coil with no change in ionic or solute composition. Impure water, exposed to pure water inside the coil, behaved as pure water. Less than 1 min exposure was required to affect the transformation.
Figure 12.
NADH, 120 µM, was prepared in water or 100 µM CuCl2 with a standard copper coil filled with Grander water. The pattern shown in (A) was observed. The empty coil had no effect. With the coil containing Grander water, the result was the 4-peak pattern with the 18 min period of water shown in (B) and not the 5 peak pattern with a 24 in period characteristic of 100 µM CuCl2 shown in A. Results with HPLC water in the coil were equivalent.
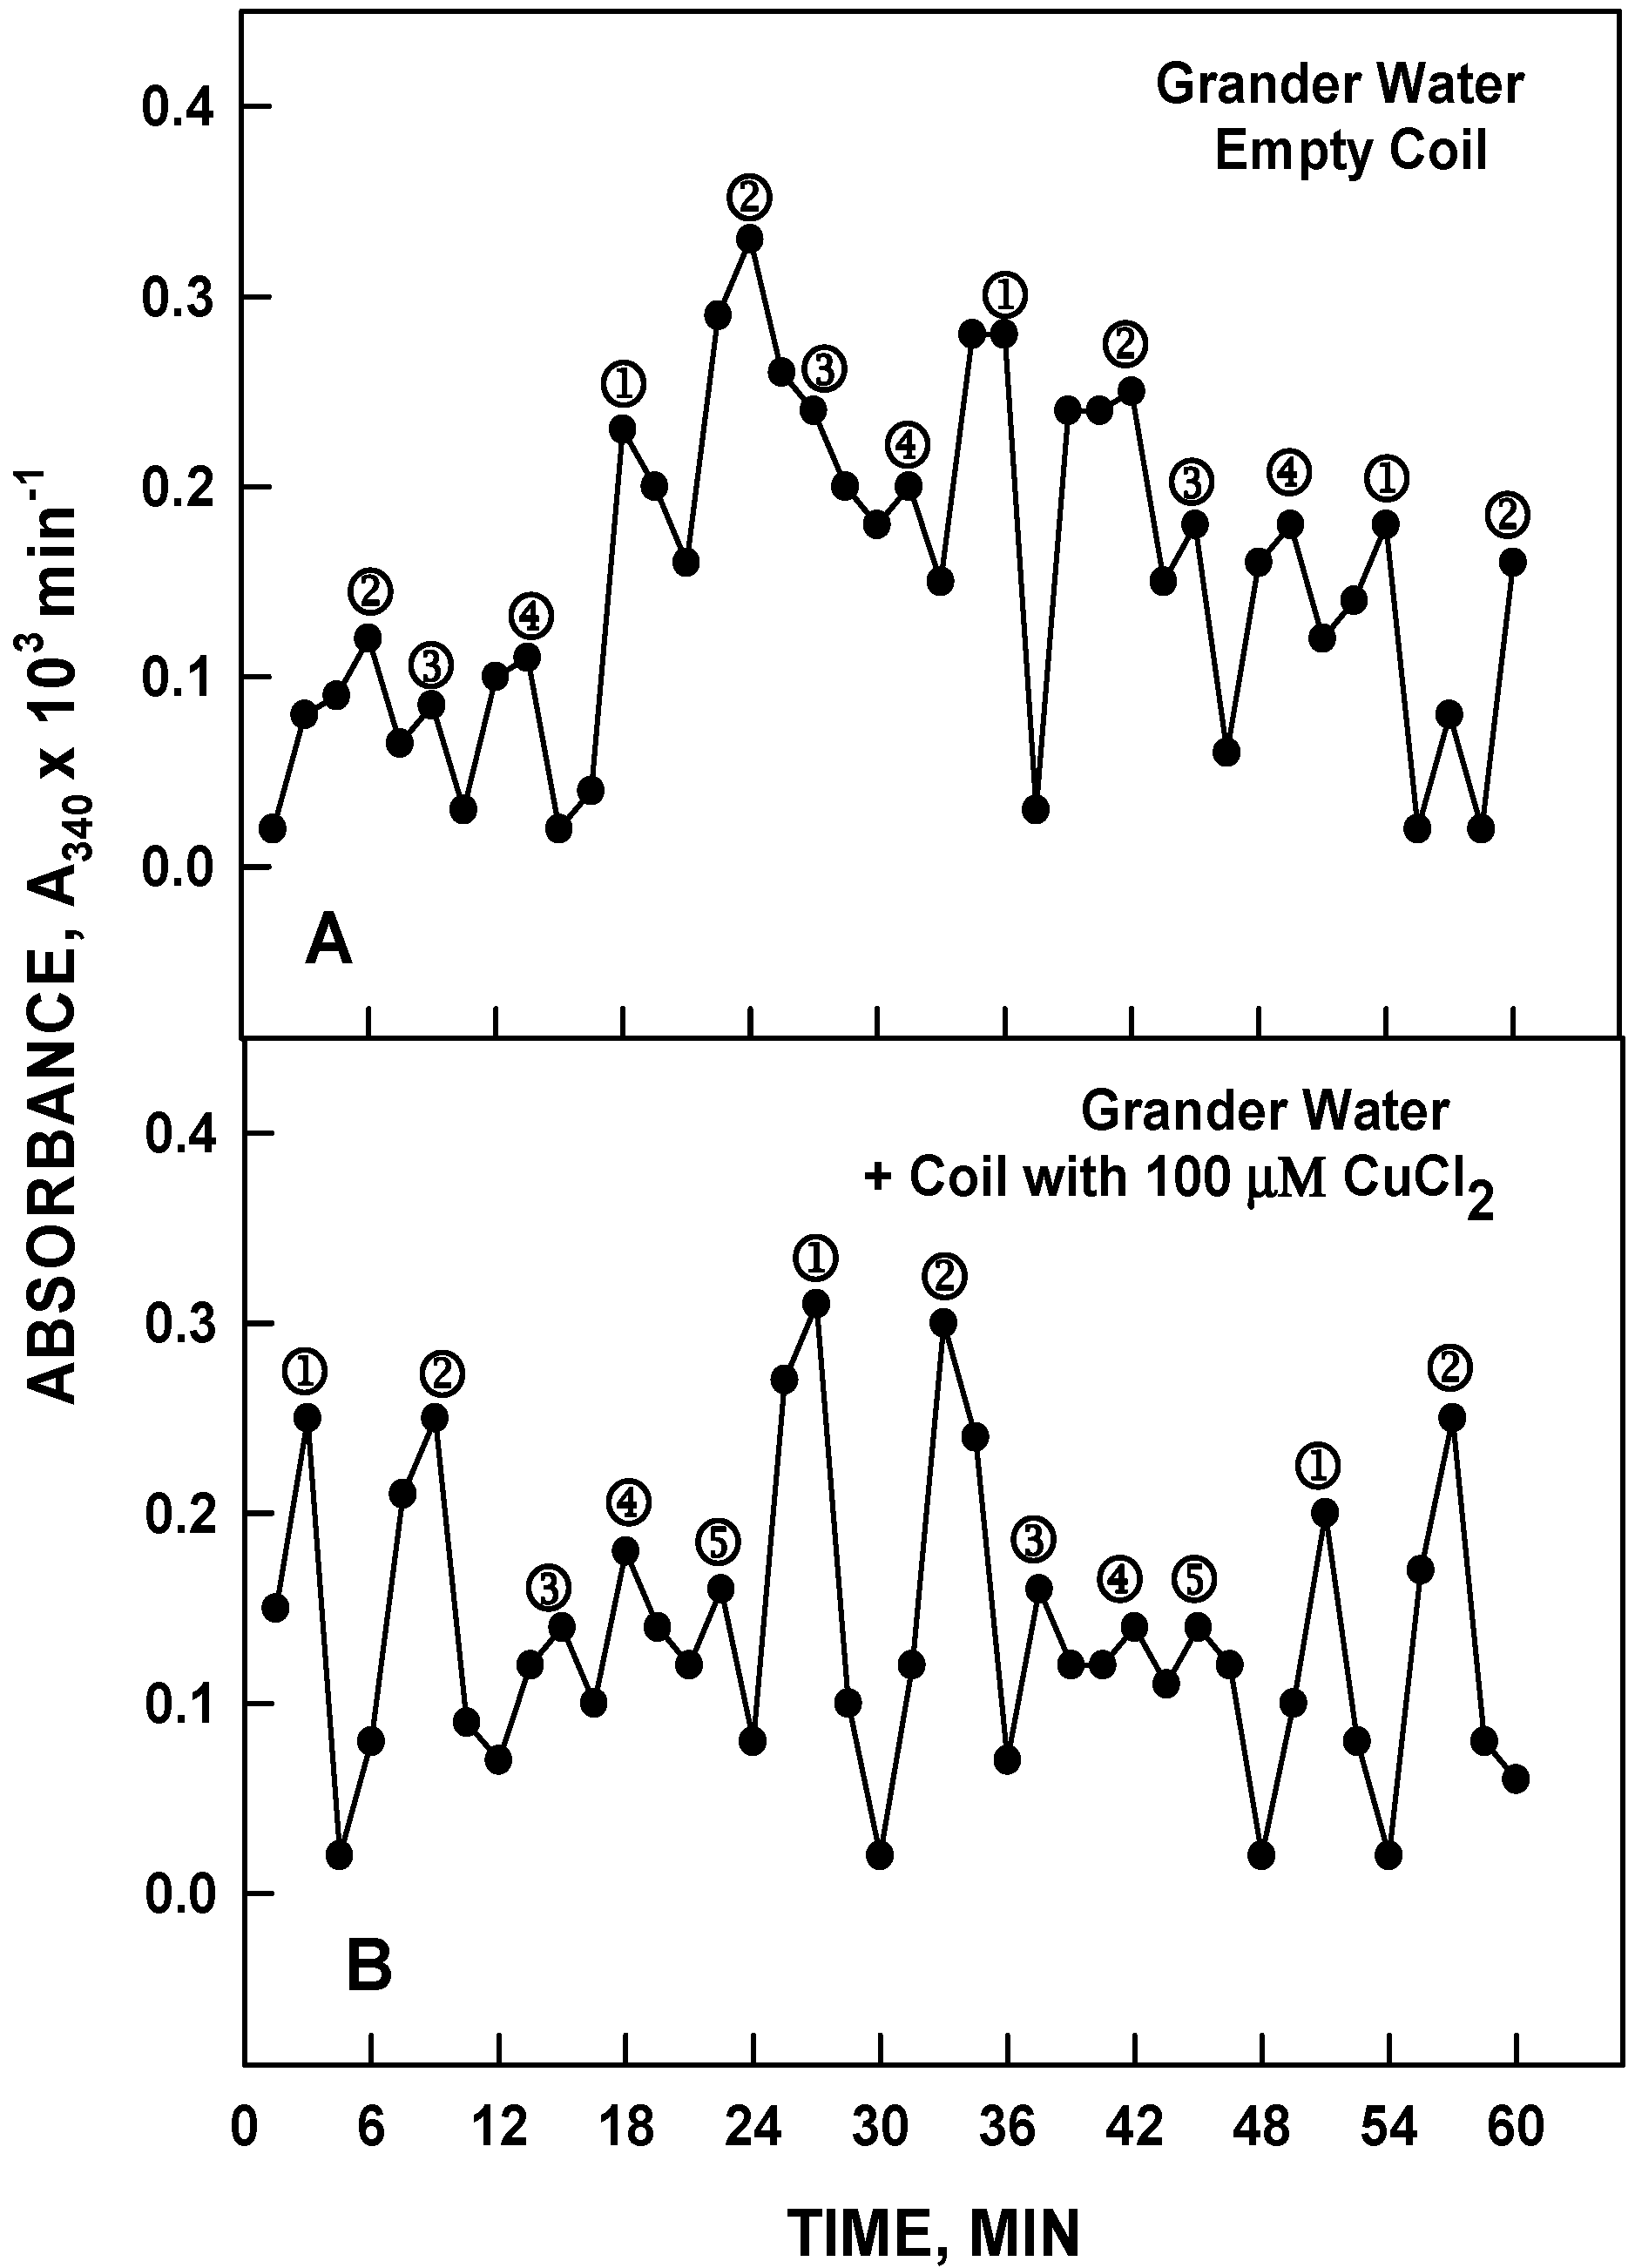
Figure 13.
The reverse experiment gave the reverse result. With HPLC water (4 maxima, 18 min period) (A) placed over the coil now filled with 100 µM CuCl2, the result was that the HPLC water now oscillated with the 5 peak 24 min period characteristic of the 100 µM CuCl2 (B).
Figure 13.
The reverse experiment gave the reverse result. With HPLC water (4 maxima, 18 min period) (A) placed over the coil now filled with 100 µM CuCl2, the result was that the HPLC water now oscillated with the 5 peak 24 min period characteristic of the 100 µM CuCl2 (B).
The metal of the chamber needed not be copper nor was it necessary for the device to be in the form of a coil. Identical results were obtained with a fluid-filled chamber of stainless steel similar to the Grander device (
Figure 14). With the CuCl
2 solution placed over the stainless steel chamber containing Grander or HPLC water, the CuCl
2 solution now oscillated with the 4 maxima pattern and 18 min period typical of HPLC or Grander water instead of the maxima pattern and 24 min period characteristic of the CuCl
2 solution (
Figure 14B). The inverse experiment with CuCl
2 inside the chamber and HPLC or Grander water placed on top resulted in the water exhibiting the oscillatory pattern of CuCl
2.
As measured with a shielded DC magnetometer, water inside the coil or chamber generated a ca. 7 milligaus LFEMF at the surface of the coil or chamber. A thin sheet of copper foil interposed between the coil or chamber and the external sample blocked the communication consistent with an LFEMF signal. It would appear that the LFEMF at the coil or chamber surface is of the same frequency and phase as the aqueous liquid inside the coil or chamber and is capable of transmitting that frequency to aqueous liquids external to the metal coil or chamber.
How does water at the surface of a metal barrier communicate with the metal of the barrier to generate the measured LFEMF at the outer barrier surface? A possible answer is that the electromagnetic carrier wave from the water in direct contact with a conducting metal surface conducts that signal via the conductor to a suitable detector in exactly the same way as do electrodermal sensors [
31].
Figure 14.
The metal need not be copper, and neither does the container need to be in the form of a coil. Identical results were obtained with a water filled chamber of stainless steel. (A) 120 µM NADH prepared in 100 µM CuCl2 yielded the 5 peak 24 min period characteristic of CuCl2; (B) With the CuCl2 solution placed over the stainless steel chamber containing Grander or HPLC water, the CuCl2 solution now oscillated with the 4 peak pattern and 18 min period typical of water.
Why is the frequency and phase of the oscillation of the aqueous solution inside the device not influenced by the frequency and phase of the aqueous solution at the outer surface of device? Perhaps the LFEMF signal at the outer barrier surface is always that of the liquid inside is equivalent to inside solution on the outside such that there is no opportunity for reverse communication of anything other than a pure water signal.
So what certain experts have said was a preposterous supposition that could not be tested scientifically has been tested scientifically. Moreover, the findings support the contentions of Benvenist and coworkers [
32] and, more recently, those of others [
33], that “
signaling of EM waves are potentially transmissible to cells and water by electromagnetic means.”
An analogous situation may account for information generated by electrodermal sensing where electrical resistance at the skin’s surface is measured. The expressed purpose of electrodermal sensing is to detect “energy” imbalance along invisible lines of the body described by acupuncturists as meridians. The device sends an electrical current, too small to be detected by the subjects, through a probe. When a second probe is touched to another part of the body, a low voltage electrical circuit is completed and a computer screen or needle on a guage reads out a number between 0 and 100 as an indication of whether the patient’s “energy” is in or out of balance.
Samples of various remedies such as homeopathic liquids and dietary or vitamin supplements may be tried as the probe is touched to the problem area. These different substances are tested until one is found that “
balances” the energy disturbance. However, what do electrodermal diagnostic instruments actually measure? Might such measurements provide an early warning system of body pathology as claimed? Until now, the connection between those skin measurements and functioning of internal organs has been obscure. The answer may lie in water generated electromagnetic fields influenced by the environment of the water following the different meridians. From a theoretical standpoint, William Tiller [
31] wrote “
one expects that cooperative cellular oscillations channel in the body, the electromagnetic radiation waves of appropriate wavelength from this generated organ spectrum will be guided away from the organ environs and out to the skin through specific acupuncture points.”
If water moving through the body provides, as it seems, a long range communication channel, the opportunities that arise are truly of potential medical importance. Not only might it be possible to obtain wellness information electrodermally but also transmit information back to the body to help correct the reported imbalance. As we have concluded earlier [
27]: “
Opportunities afforded may be not only to listen in but to talk back as well.”


