Article

Assessing Climate Change Impacts on Water Resources in the Songhua River Basin

1
Northeast Institute of Geography and Agroecology, Chinese Academy of Sciences, Changchun 130102, China
2
Key Laboratory of Groundwater Resources and Environment, Ministry of Education, College of Environment and Resources, Jilin University, Changchun 130021, China
3
School of Renewable Natural Resources, Louisiana State University Agricultural Center, Baton Rouge, LA 70803, USA
*
Author to whom correspondence should be addressed.
Water 2016, 8(10), 420; https://doi.org/10.3390/w8100420
Submission received: 30 June 2016 / Revised: 15 September 2016 / Accepted: 19 September 2016 / Published: 25 September 2016
(This article belongs to the Special Issue Tackling Complex Water Problems in China under Changing Environment)

Abstract

:
The Songhua River Basin (SRB) in Northeast China is one of the areas most sensitive to global climate change because of its high-latitude location. In this study, we conducted a modeling assessment on the potential change of water resources in this region for the coming three decades using the Soil and Water Assessment Tool (SWAT). First, we calibrated and validated the model with historical streamflow records in this basin. Then, we applied the calibrated model for the period from 2020 to 2049 with the projected and downscaled climatic data under two emission scenarios (RCP 4.5 and RCP 8.5). The study results show: (1) The SWAT model performed very well for both the calibration and validation periods in the SRB; (2) The projected temperatures showed a steady, significant increase across the SRB under both scenarios, especially in two sub-basins, the Nenjiang River Basin (NRB) and the Lower SRB (LSRB). With regard to precipitation, both scenarios showed a decreasing trend in the NRB and LSRB but an increasing trend in the Upper Songhua River Basin (USRB); and (3), generally, the hydrologic modeling suggested a decreasing trend of streamflow for 2020–2049. Compared to baseline conditions (1980–2009), the streamflow in the NRB and LSRB would decrease by 20.3%–37.8%, while streamflow in the USRB would experience an increase of 9.68%–17.7%. These findings provide relevant insights into future surface water resources, and such information can be helpful for resource managers and policymakers to develop effective eco-environment management plans and strategies in the face of climate change.

1. Introduction

The IPCC Fifth Assessment Report on Climate Change points out that over the past half century, almost all regions of the world have experienced a heating process, with global air temperatures increasing by 0.85 °C over the period of 1880–2012 [1]. Global warming is likely to have significant impacts on the hydrologic cycle [2,3,4] connecting the atmosphere, biosphere, and lithosphere. The changing hydrologic regimes induced by climate change and resulting in variations in available water resources will strongly influence not only the eco-environment and socio-economic development of the local region, but also the downstream areas [5,6,7,8]. Thus, understanding the spatiotemporal responses of water resources to the changing climate is crucial to identifying future water availability and developing sustainable management plans [9,10,11,12].
In recent years, there has been a growing realization of the importance in assessing the impacts of climate change on streamflow [13,14,15,16]. Several factors may affect surface hydrology and water availability, including rainfall, soil type, infiltration, topography, and vegetation, among which atmospheric forces are significant. A number of studies [17,18,19] have suggested that it is necessary to evaluate potential impacts of climate change on water resources in virtue of distributed hydrological models and climate projected data. For instance, García Ruiz et al. [20] illustrated the trend of streamflow decline in the Mediterranean area by modeling and analyzing river regime characteristics and reservoir inflow; Andersson et al. [21] studied the impact of climate change and development scenarios on flow patterns using a Pitman hydrological model.
In this study, the Songhua River Basin (SRB) in Northeast China, which is one of the most sensitive areas to global climate change, is selected as the study area. The SRB occupies a land area of 556,800 km2, and it is one of the country’s most important commodity grain production bases. Agriculture is intensive in the middle and lower basin areas of the SRB, where there is also a large inland wetland region in China. In this region, stream and river flows are the most relevant water sources for agricultural irrigation and water use. The river waters are also crucial for the wetlands that support diverse ecosystems and many endangered wildlife species (e.g., red crane). In the past half century, climate in the SRB has become warmer and drier [13,22], with an increasing trend in average temperature and a declining trend in precipitation for the river basin. Meanwhile, the discharge in all major tributaries of the SRB experienced a decreasing trend over the past half century due to the warmer and drier climate [13,23]. This change has raised the concern over wetland shrinkage and biodiversity loss in the river basin [24]. In addition, the Chinese government has recently been promoting the SRB to become China’s future major grain production base. In order to develop best management strategies for effective utilization and protection of the limited water resources in the SRB, it is crucial to improve our understanding of how climate will change as well as its potential impacts on streamflow across the basin.
There are several studies addressing long-term runoff changes and its response to climate change in the SRB [25,26,27]. However, previous studies have mainly focused on the changes in the past [28,29]. The potential hydrological regimes and climate change impacts in this region are still not fully understood, making it difficult to predict future available water resources.
In the above context, this present study employed the SWAT model to investigate the hydrological response to future climate change in the SRB for the near future period (2020–2049) based on the projected climate change scenarios of RCP 4.5 and RCP 8.5. The objectives of this study were to: (1) investigate the changes and trends in future temperature and precipitation across the river basin; and (2) explore the runoff response to future climate projections over the study area. The simulation results are expected serve as reference for climate change mitigation and adaptation, as well as water resource management in this vulnerable region.

2. Materials and Methods
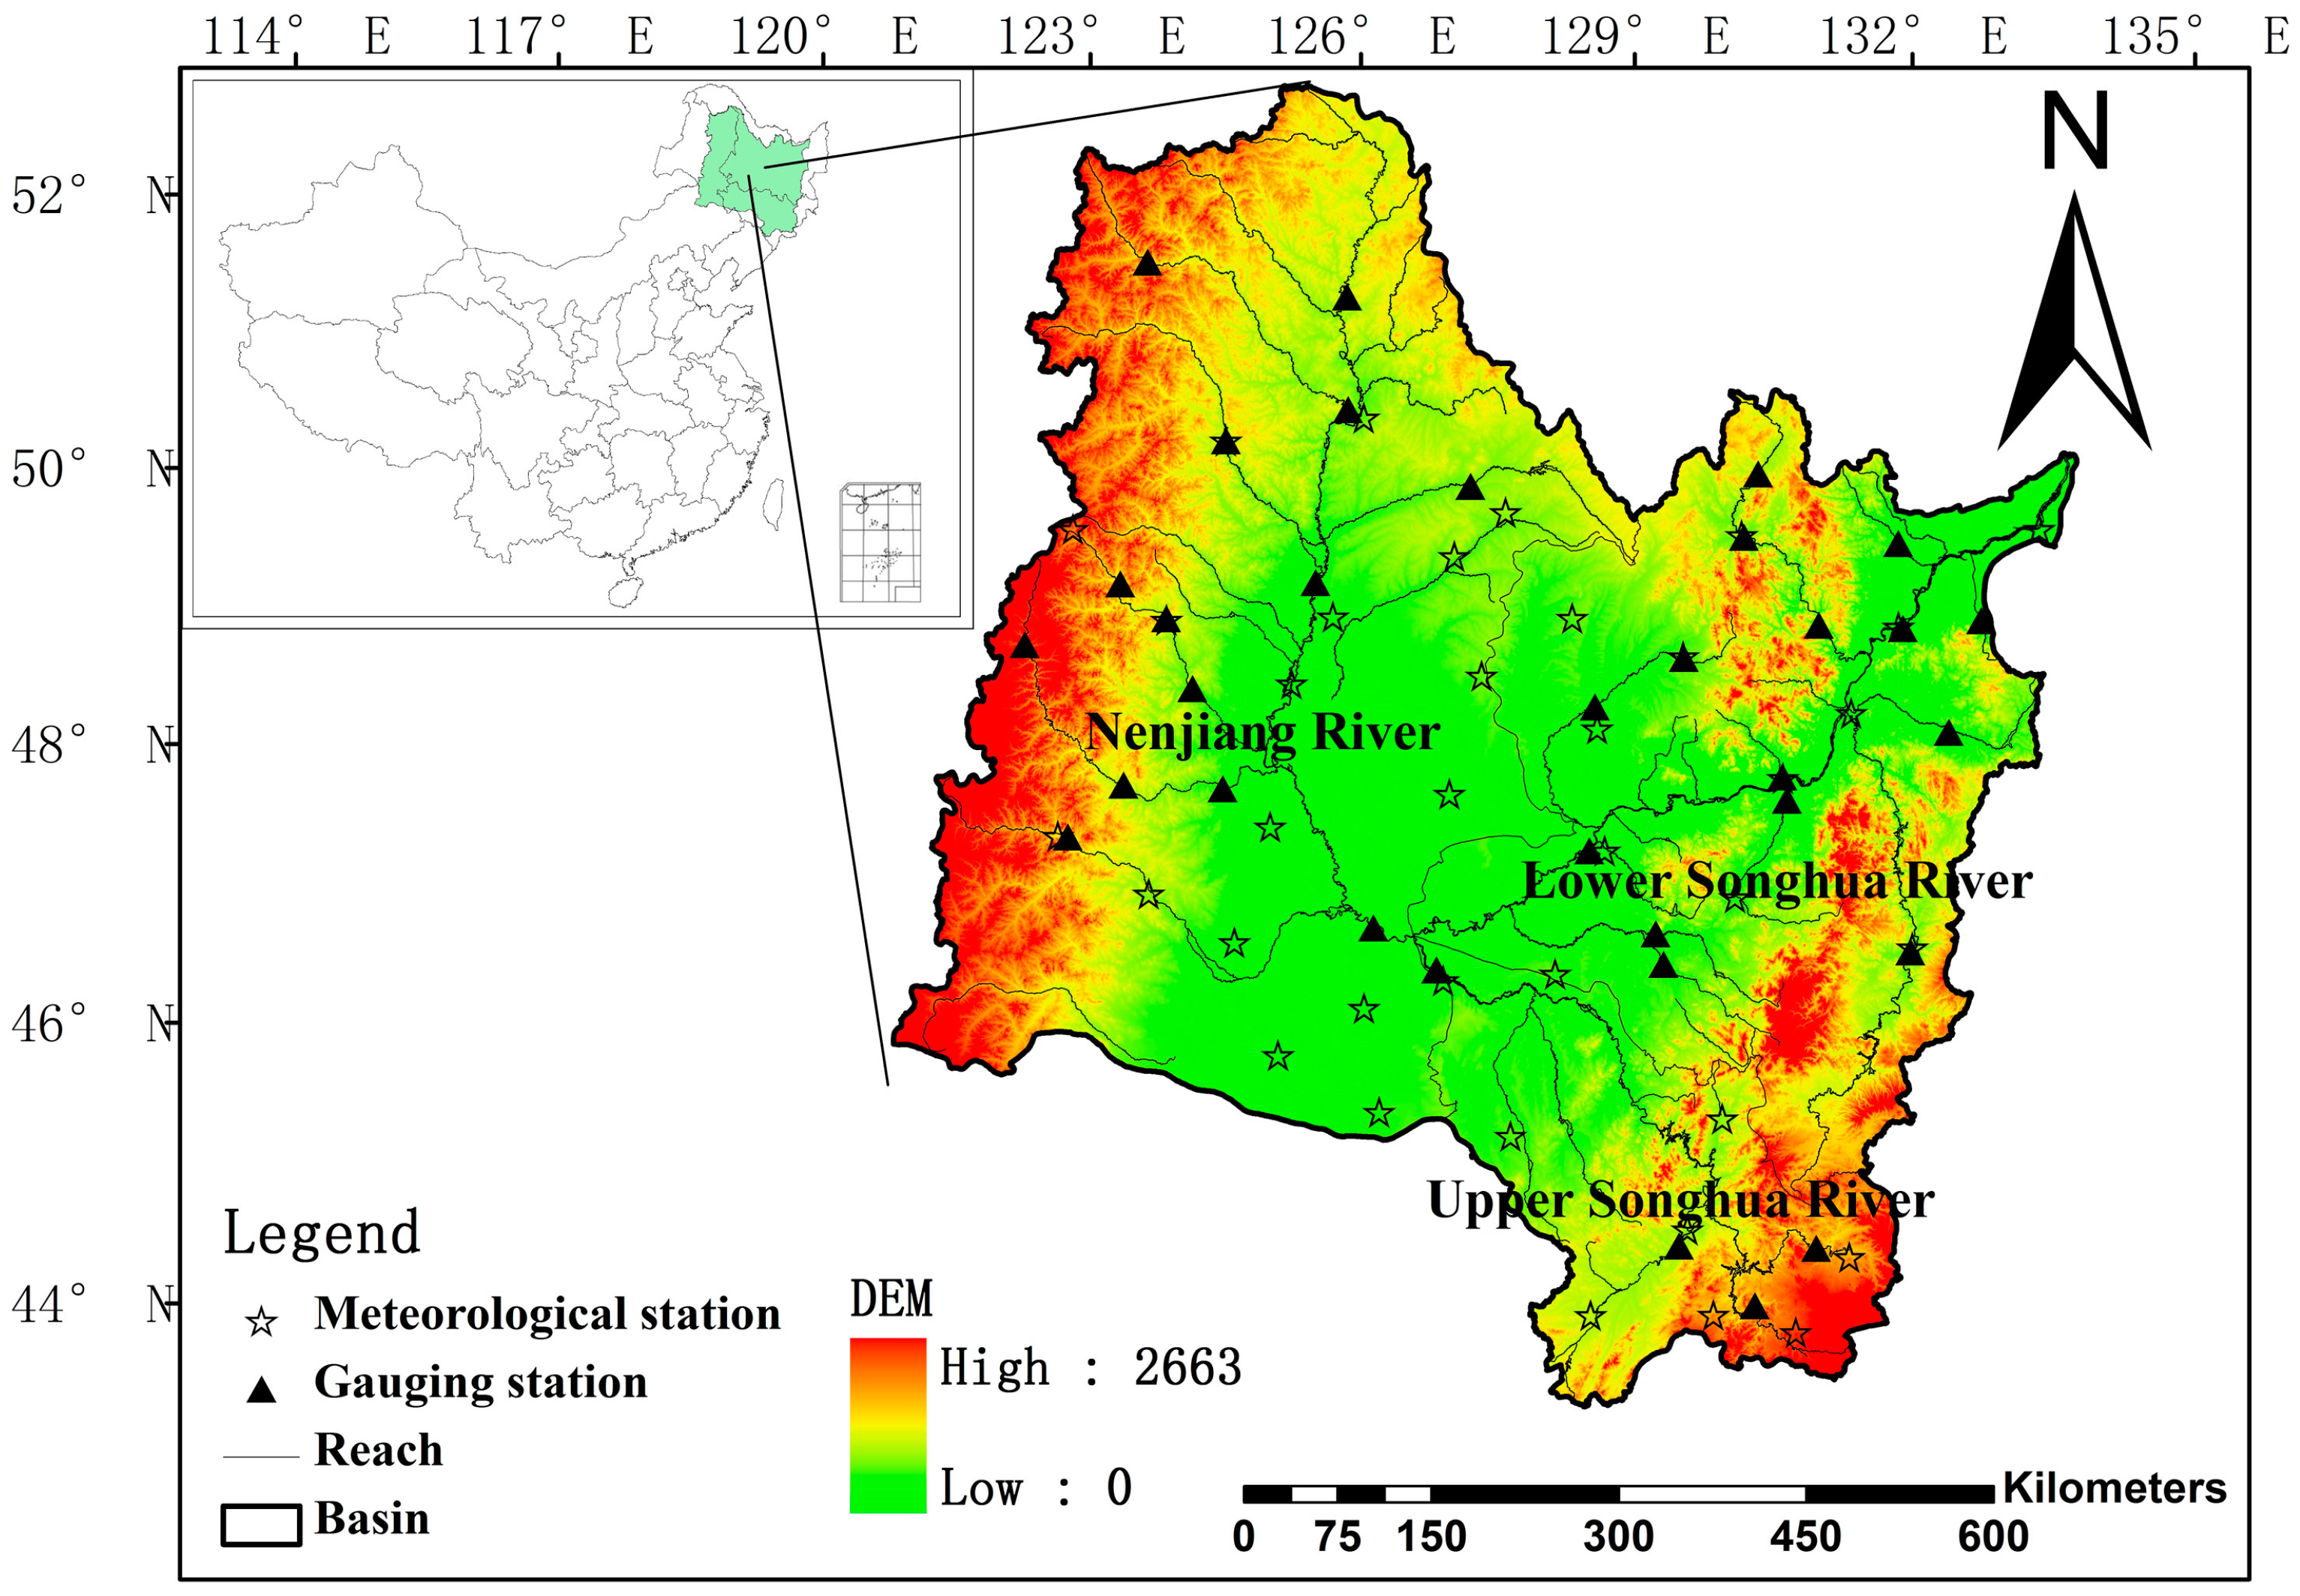
2.1. Study Area

The Songhua River Basin is located in the far northeastern region of China (119°52′–132°31′ E and 41°42′–51°38′ N, Figure 1). It is one of China’s seven major river basins, covering a total land area of 556,800 km2. The SRB is composed of three sub river basins: the Nenjiang River Basin (NRB) in the west, the Upper Songhua River Basin in the south (USRB, a.k.a., the Second Songhua River), and the Lower Songhua River Basin in the northeast (LSRB, a.k.a., the main stream of Songhua River). The Nenjiang River tributary originates from the Yilehuli Mountain in the Great Khingan Mountains, traveling 1370 km from Northwest to Southeast and draining 297,000 km2 land. The Second Songhua River originates from Tianchi Lake in the Changbai Mountain and flows 958 km from Southeast to Northwest, draining a land area of 73,400 km2. With a gentle slope and wide river channel, the Lower Songhua River carries the combined flow from the Nenjiang and Second Songhua Rivers and flows 939 km northeastward before entering the Amur River. The elevation of the SRB varies from 50 to 2700 m above sea level, with an extensive floodplain—the Songnen Plain—in the middle of the basin after the confluence of the Nenjiang and Second Songhua Rivers.

2.2. Data Collection

Daily climate data (precipitation, maximum air temperature, minimum air temperature, mean air temperature, relative humidity, sunshine hours and wind speed) from 37 meteorological stations (Figure 1) in the SRB were obtained from China Meteorological Administration (CMA). All the data were available for the time period of 1960–2009, which was considered as the basic climate condition period. The average precipitation in the river basin was calculated using the Thiessen polygon method [30].
In this study, the predicted climate data obtained by coupling the RegCM4.0 and BCC_CSM1.1 (Beijing Climate Center_Climate System Model Version 1.1) was collected from China Meteorological Administration (CMA). We selected the RCP 4.5 and RCP 8.5 scenarios in phase 5 of the Coupled Model Intercomparison Project (CMIP5) for climate change projections. Data include monthly mean temperature, maximum temperature, minimum temperature and precipitation from 1960 to 2049. These two models have a same spatial resolution of 0.5° × 0.5°. The RCP 4.5 emission scenario is in the middle of the IPCC range, with the CO2 concentration of about 650 ppm by 2100, while the RCP 8.5 scenario is in the top of the IPCC range with the CO2 concentration of about 850 ppm by 2100.
Besides climate data, SWAT also requires a great deal of geographic data such as digital elevation model, land use/cover and soil data. In this study, a national 1:1,000,000 digital elevation model is used to determine surface slope; land cover (National County Land Coverage Vector Data, resolution (1 km × 1 km)) data from the year 2000 were provided by Chinese Academy of Sciences (CAS). Soil data are obtained from the Soil Database supported by CAS (Nanjing Institute of Soil Science). A soil map is created from digital soil maps deriving soil particulate size at a scale of 1:1,000,000. In addition, monthly stream and river discharge records were collected for the same period from 33 major river gauge stations (Figure 1 and Table 1) throughout the SRB to calibrate the SWAT model simulations.

2.3. Overview of ArcSWAT Model

In this study, the SWAT model was used. It is a physically based, semi-distributed and continuous time-step hydrologic model that is used for rainfall-runoff modeling as well as for predicting the impacts of land use and land management practices, and of climate change on the hydrology and water quality of watersheds or river basins. SWAT has been successfully applied to many parts of the world and proved to adequately reproduce hydrological processes of watersheds across a range of geographical regions and climates [31,32,33]. The water cycle simulated by ArcSWAT is based on a water balance, given as:
S W t = S W 0 + i = 1 t ( P d a y Q s u r f E a W s e e p Q g w )
where SWti is the soil water content (mm) at time t; SW0 is the initial soil water content (mm); t is the simulation period (days); Pday is the amount of precipitation on the ith day(mm); Qsurf is the amount of surface runoff on the ith day(mm); Ea is the amount of evapotranspiration on the ith day(mm); Wseep is the amount of water entering the vadose zone from the soil profile on the ith day(mm); Qgw is the amount of baseflow on the ith day(mm).
The SWAT model computes hydrological processes occurring in a watershed or basin such as runoff, streamflow, sediment transport and nutrient transport at a Hydrological Response Unit (HRU) level. HRUs are simply unique combinations of a specific soil type, land cover type and slope within a sub-basin. In this study, the Songhua River Basin is comprised of 84 sub-basins which were divided into 819 HRUs that satisfactorily represent a watershed’s heterogeneity.

2.4. Calibration and Validation of ArcSWAT Model

Most influential parameters for streamflow simulation were estimated by sensitivity analysis before performing calibration of the model. Since the ArcSWAT contains a large number of hydrological parameters and not all of them contribute significantly to the model output, there is a need to identify significant input parameters for streamflow simulation. This procedure not only helps in reducing the number of parameters for calibration, but also suggests how to precisely handle a particular parameter. In this study, the model parameters were identified by using Latin Hypercube One-Factor-At-a-Time (LH-OAT) technique [34]. Generally, eleven parameters CN2, ESCO, CH_K2, SURLAG, GW_DELAY, ALPHA_BF, GWQMN, GW_REVAP, REVAPMN, SOL_AWC and SOL_K were identified as sensitive parameters by the sensitive analysis. The detail description of each parameter is listed in Table 2. Thereafter, the ArcSWAT model was calibrated using SUFI-2 optimization technique [35]. The daily observed streamflow data from 1980 to 1994 were used for model calibration, and those from 1995 to 2005 were used for model validation. The data of 1980 to 1981 were kept as a warming-up period, which allows the model to initialize and approach reasonable initial values of the state variables of the model.
The calibrated parameters of the SWAT model were then used to simulate monthly streamflow for the validation period. In this study, we chose the Nash-Suttcliffe coefficient of efficiency (Ens) [36], the coefficient of determination (R2), and the relative error (Er) to assess the accuracy of simulated values. SWAT performance can be judged according to Table 3.

3. Results

3.1. Model Performance

Figure 2 illustrates almost similar distribution of the observed and simulated streamflow hydrographs for both the calibration period (1980–1994) and validation period (1995–2009). For the calibration period, the relative error is low (7.60%) and the estimated process matches well with the observed process in terms of Ens, and R2, which are 0.67, and 0.83, respectively. In the validation period, the SWAT model also showed good performance, with Er = 9.63%, Ens = 0.72, and R2 = 0.74 (Table 4). However, there are certain differences between the simulated and observed streamflow. Overall, the simulated low flows in the cold seasons, especially in spring, are underestimated, while the simulated high flows are generally much higher than the observed ones for the calibration period. This could be attributed to the fact that lots of uncertainties are involved in the calculation of recession by the SWAT model, such as the simplification of the complex channel network and the altered outlets, as indicated by the underestimation of outflows. In addition, the limited observed data also decreased the accuracy of simulated.

3.2. Changes of Projected Temperature and Precipitation

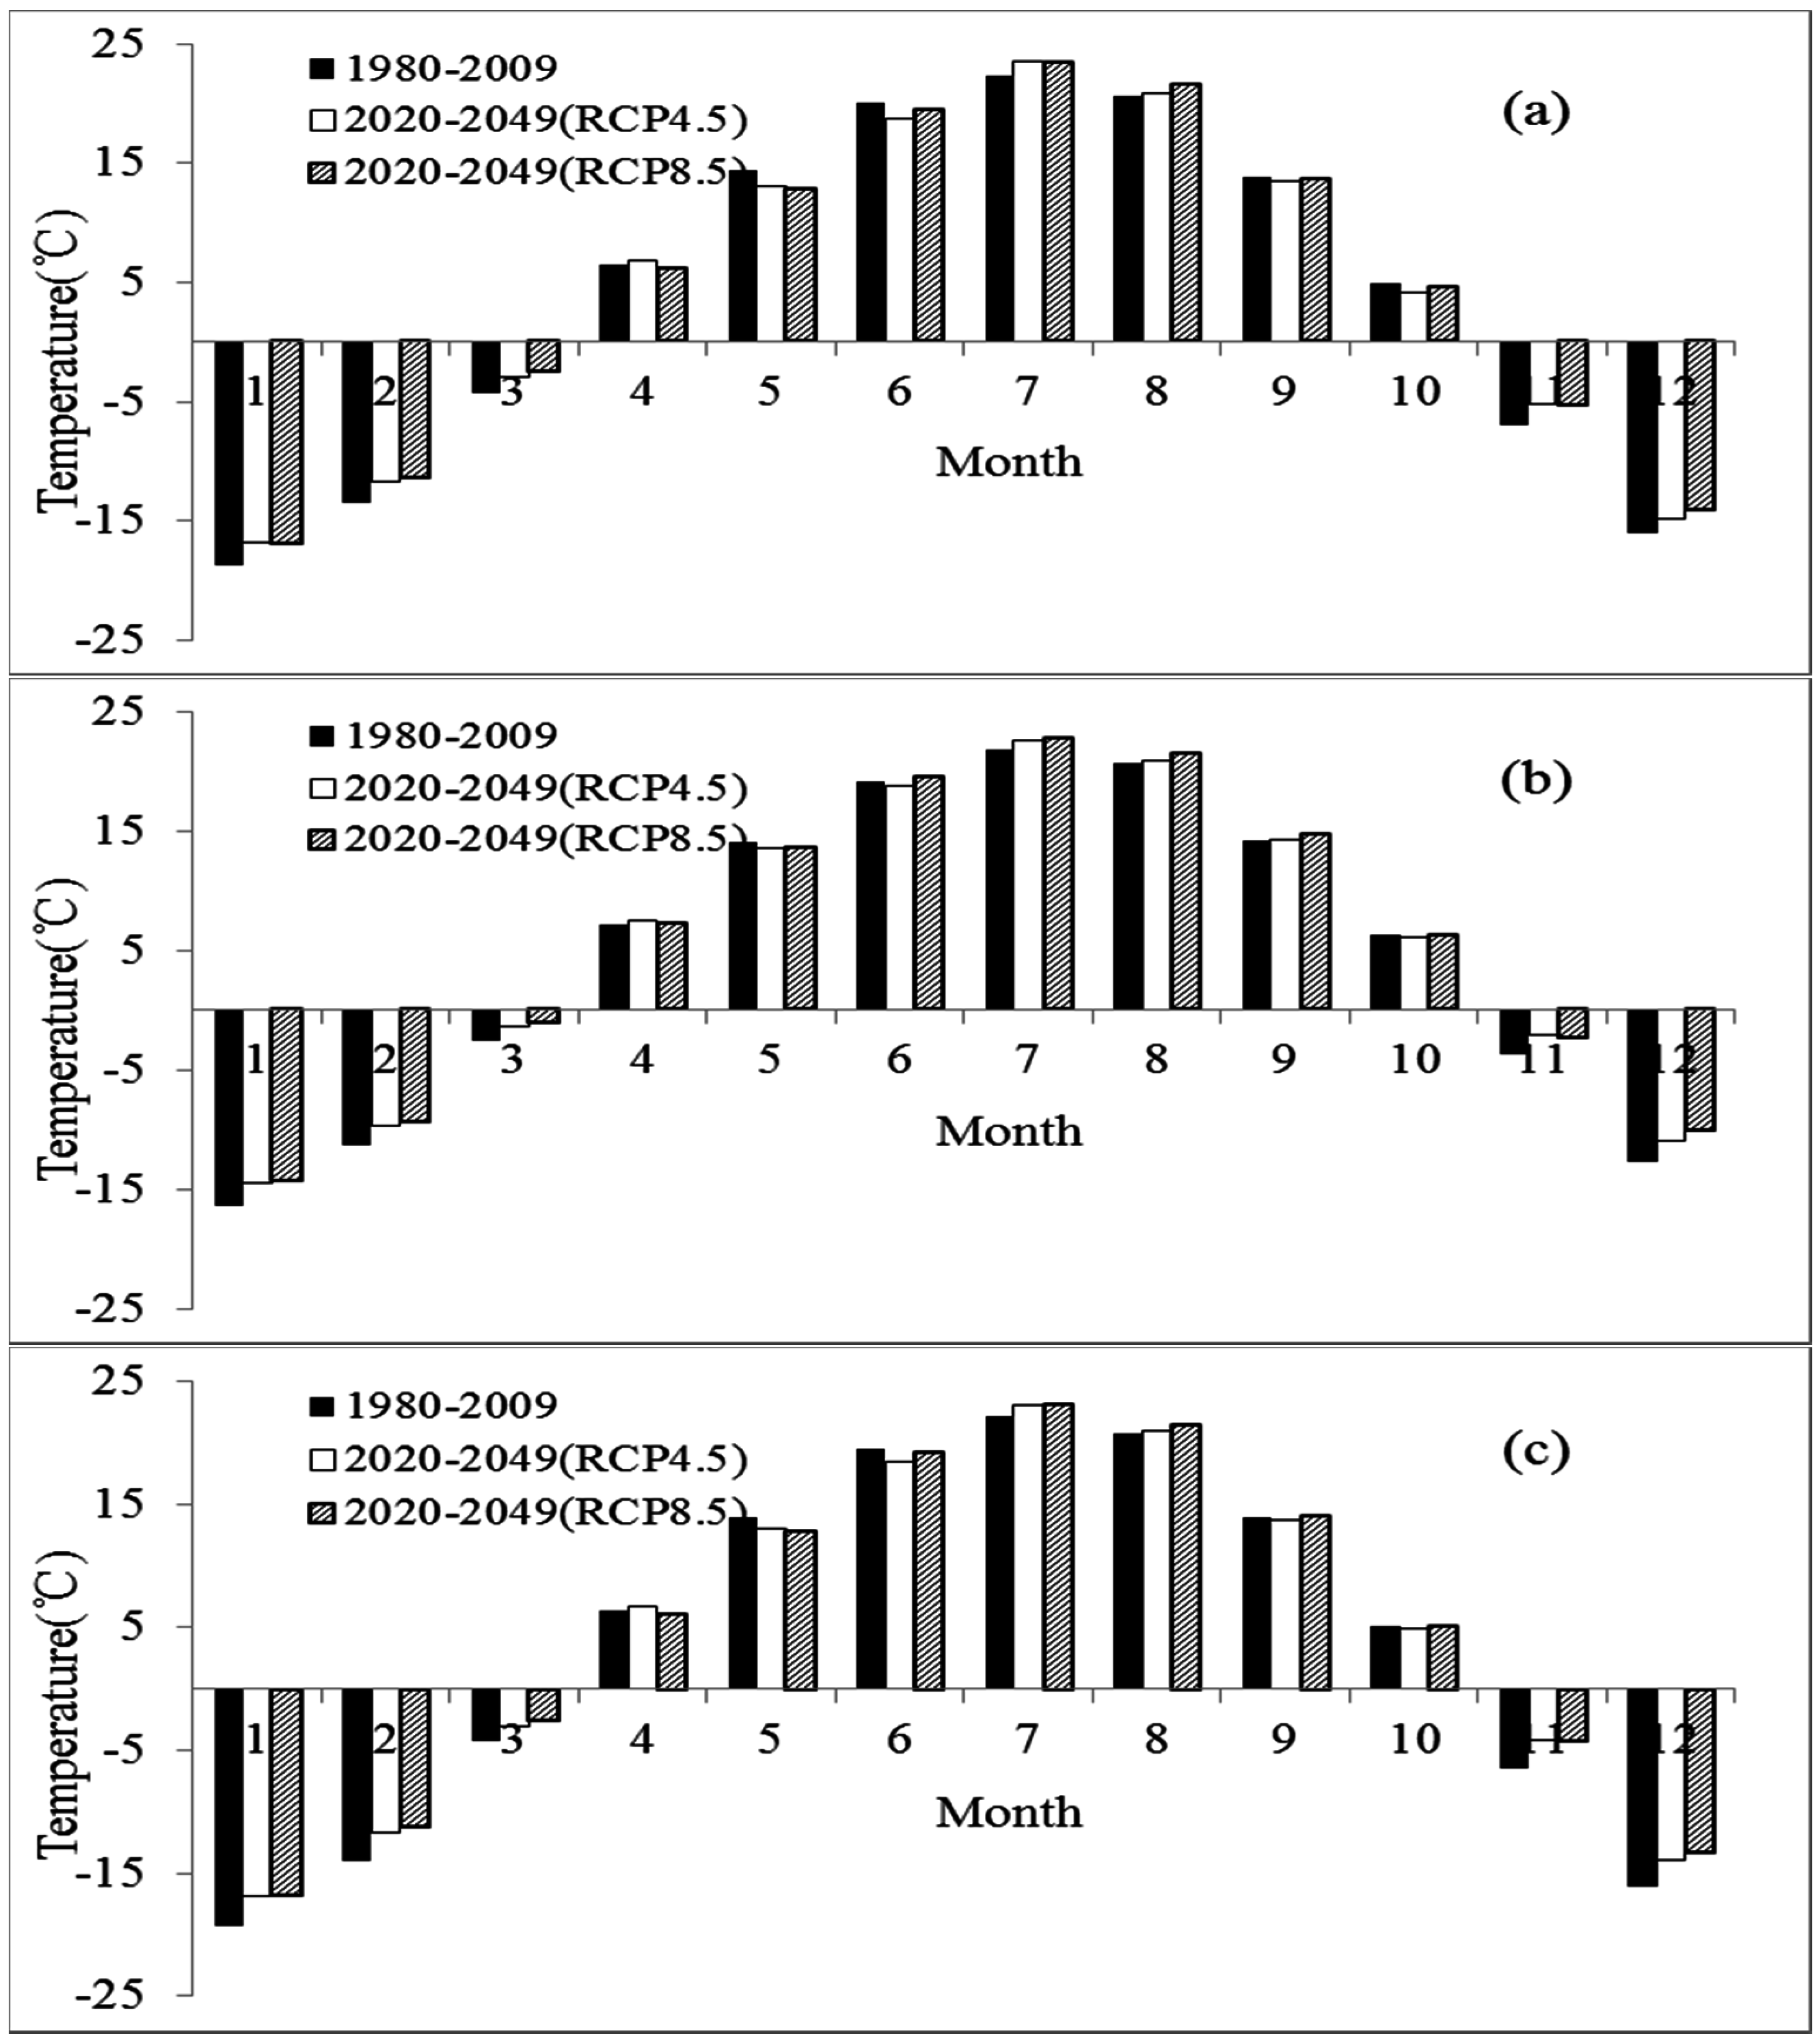
3.2.1. Changes of Projected Temperature

The projected temperature and precipitation were first statistically downscaled to the 37 local meteorological stations mentioned above (Figure 1). The average temperature during the baseline period of 1980–2009 were 3.6 °C, 4.7 °C and 3.5 °C, respectively, in the NRB, USRB and LSRB. Compared to the baseline conditions, the average temperature suggests a steady and significant increase across the SRB under both scenarios. The temperature increase across the SRB will be 0.5 °C–0.8 °C under the RCP 4.5 scenario and will be 0.7 °C–1.1 °C under the RCP 8.5 scenario. Spatially, the increase of average monthly temperature is largest in LSRB (23%–31%) and smallest in the NRB (14%–19%).
The intra-annual distribution of temperature in 2020–2049 is similar with that in 1980–2009 (Figure 3). Compared with the condition of 1980–2009, both RCP 4.5 and RCP 8.5 scenarios show a temperature increase in cold seasons from November to March; November and March display the largest amplitude with an increase of 24%–29%. Temperature increase also happens in hot summer (e.g., July to August), but the amplitude is much smaller. The increasing extent is 3.7%–5.1% in July and 1.1%–4.9% in August, respectively. In late spring and autumn, by contrast, temperature under these two scenarios will be lower than the baseline condition, and RCP 4.5 scenario exhibits a larger extent of temperature decrease than RCP 8.5. Spatially, temperature decrease in late spring and autumn months is more obvious in NRB, while temperature increase in cold months is lowest in this sub-basin. This is the main reason for the smallest increase of average monthly temperature in NRB. Overall, the temperature increase in cold months and the decrease in warmer months will directly reduce the intra-annual difference of temperature.
Both scenarios demonstrate significant upward trends in future temperature during the period from 2020 to 2049 (Figure 4). In this period, the scenario RCP 8.5 exhibits a higher average annual temperature, while the scenario RCP 4.5 exhibits a larger rate of increase. The rates of increase in the NRB, USRB and LSRB are respectively 0.51 °C/10a, 0.37 °C/10a and 0.45 °C/10a under RCP 4.5, while these rates are 0.30 °C/10a, 0.27 °C/10a and 0.27 °C/10a under RCP 8.5. Anomaly accumulation is an efficient and widely used method for trend analysis [37,38]. According to this method, variables such as temperature, precipitation, etc., have decreasing trends where the curve falls, and increasing trends where the curve rises. Figure 4 also illustrates the anomaly accumulation of future temperature. For RCP 4.5, temperature is relatively low from 2020 to 2033, and gets higher after 2033. This indicates a possible changing point in the future temperature around this year. A similar trend is also found in the RCP 8.5 scenario. Temperature is low from 2020 to 2030, approaches the average value of the entire study period in the years 2030–2040, and is higher than the average in the years 2040–2049. Therefore, 2030 may be a particularly noteworthy year.

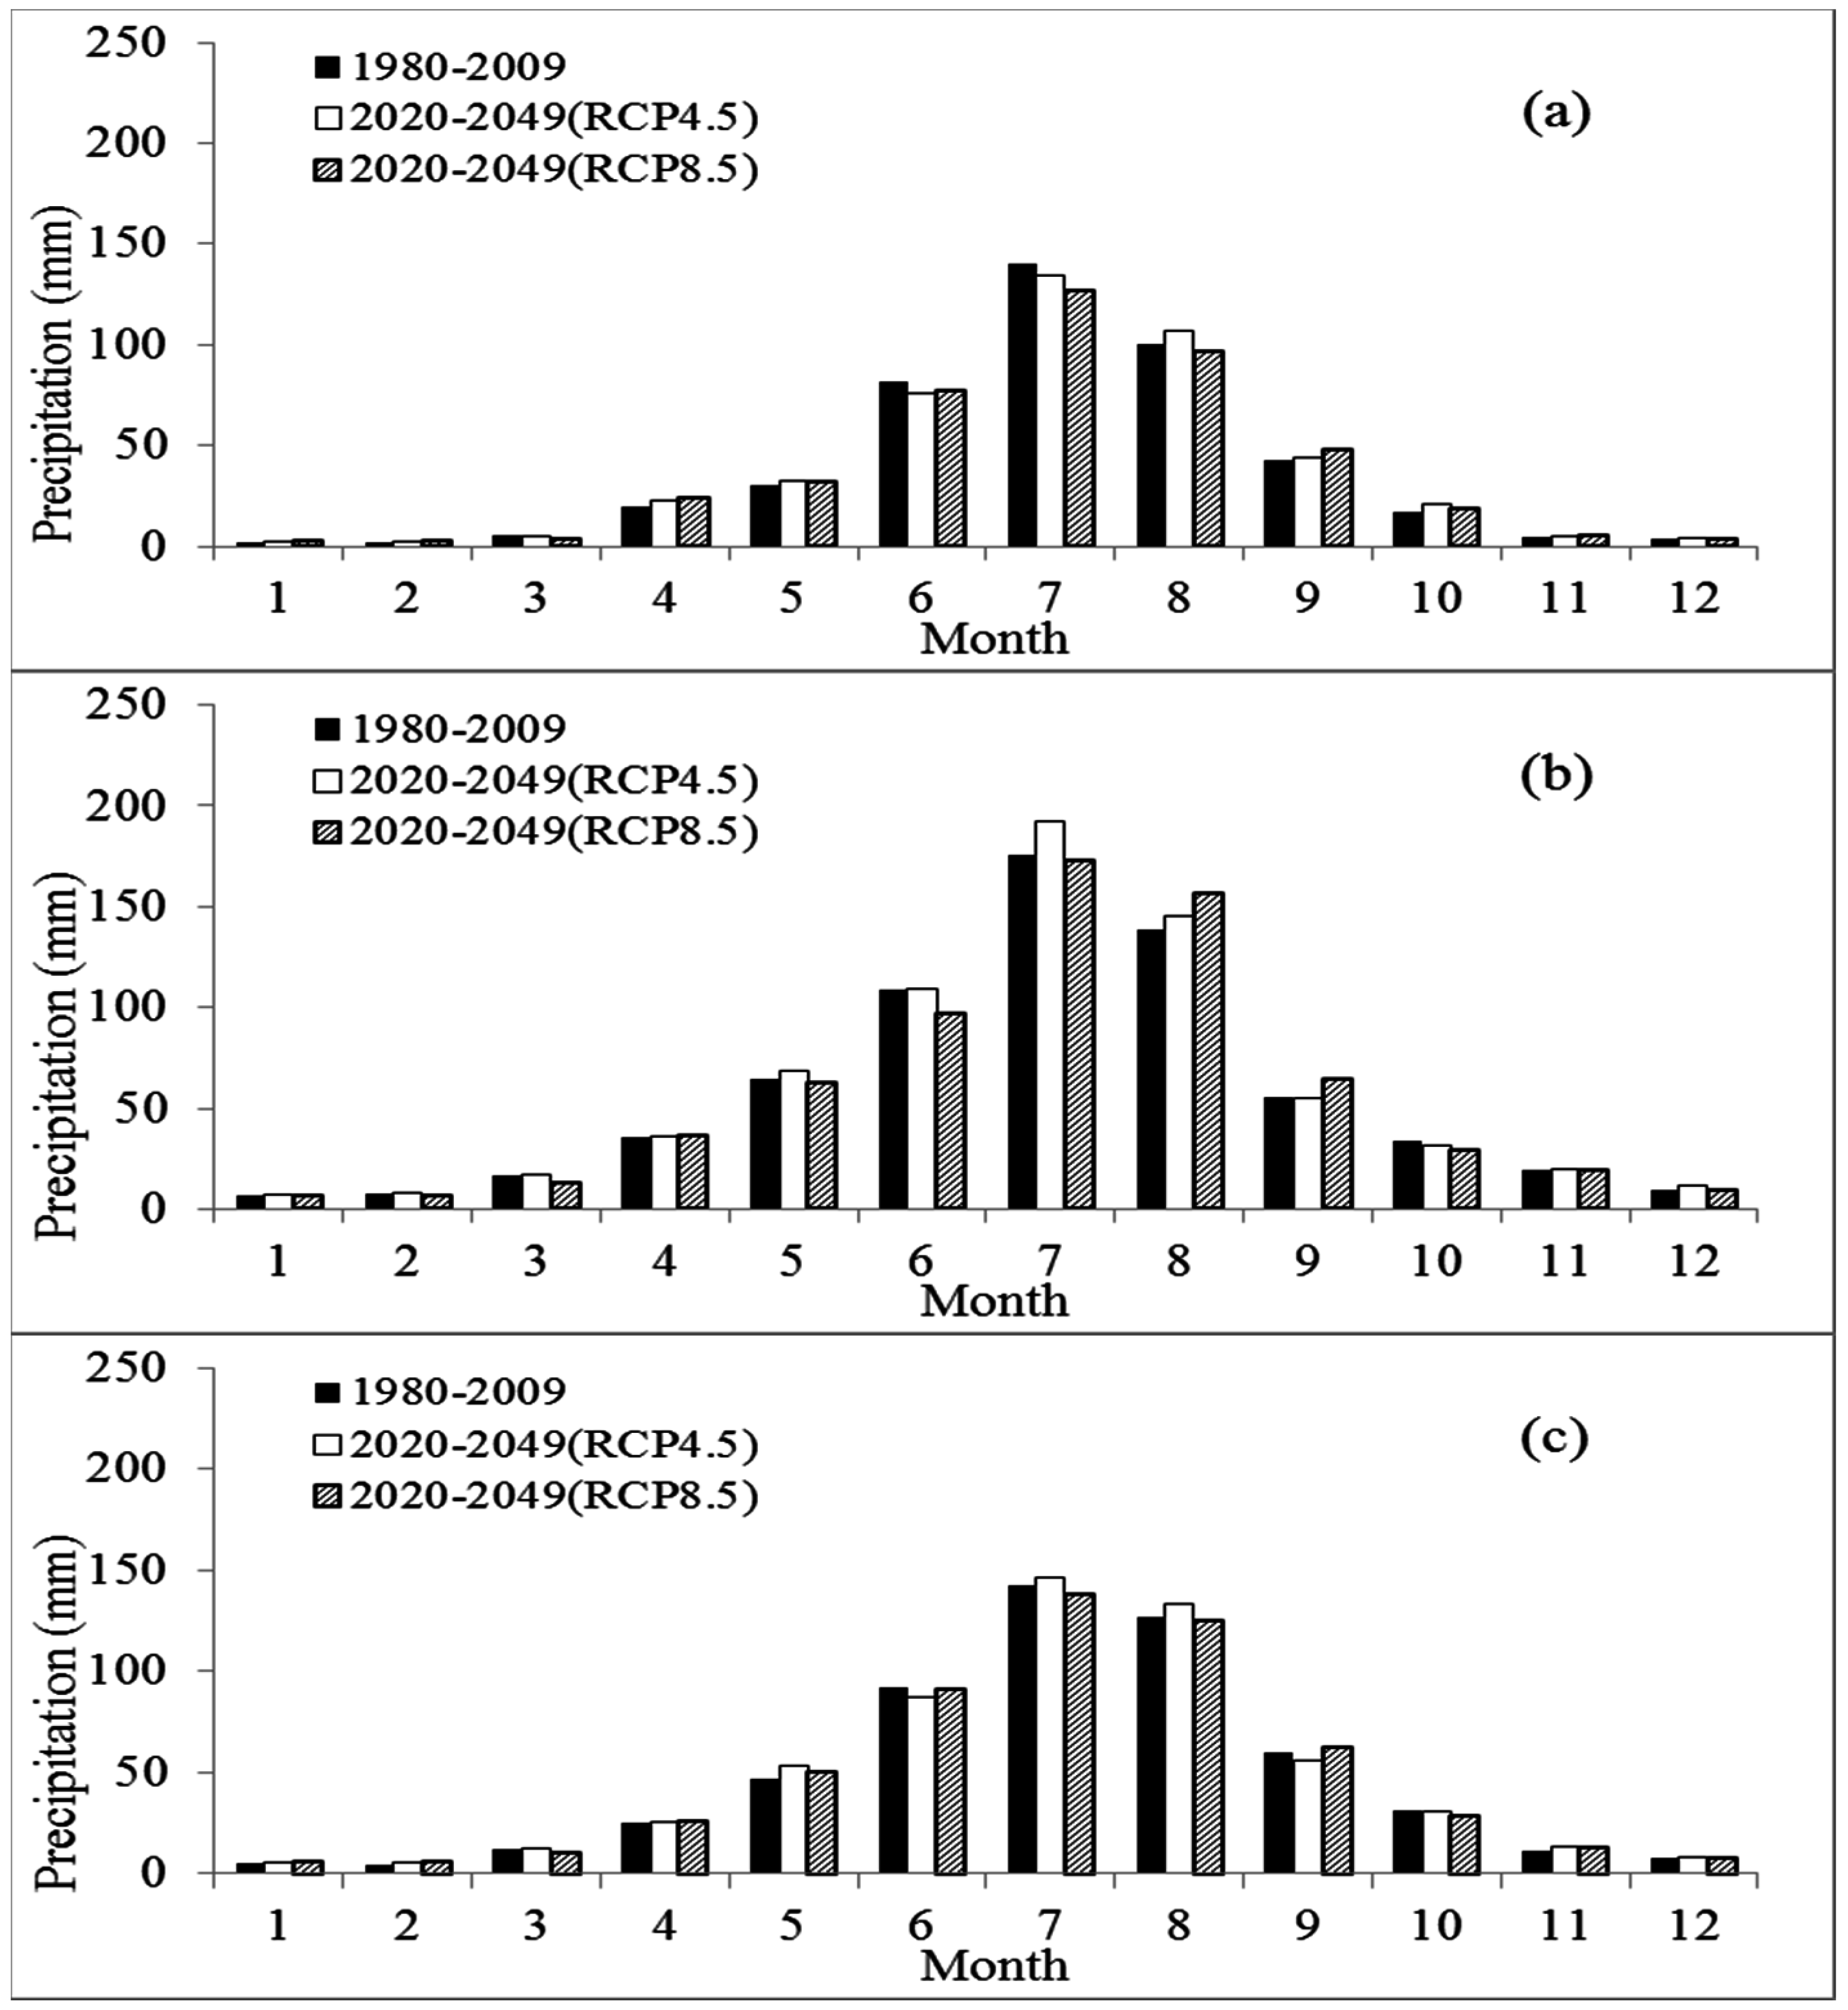
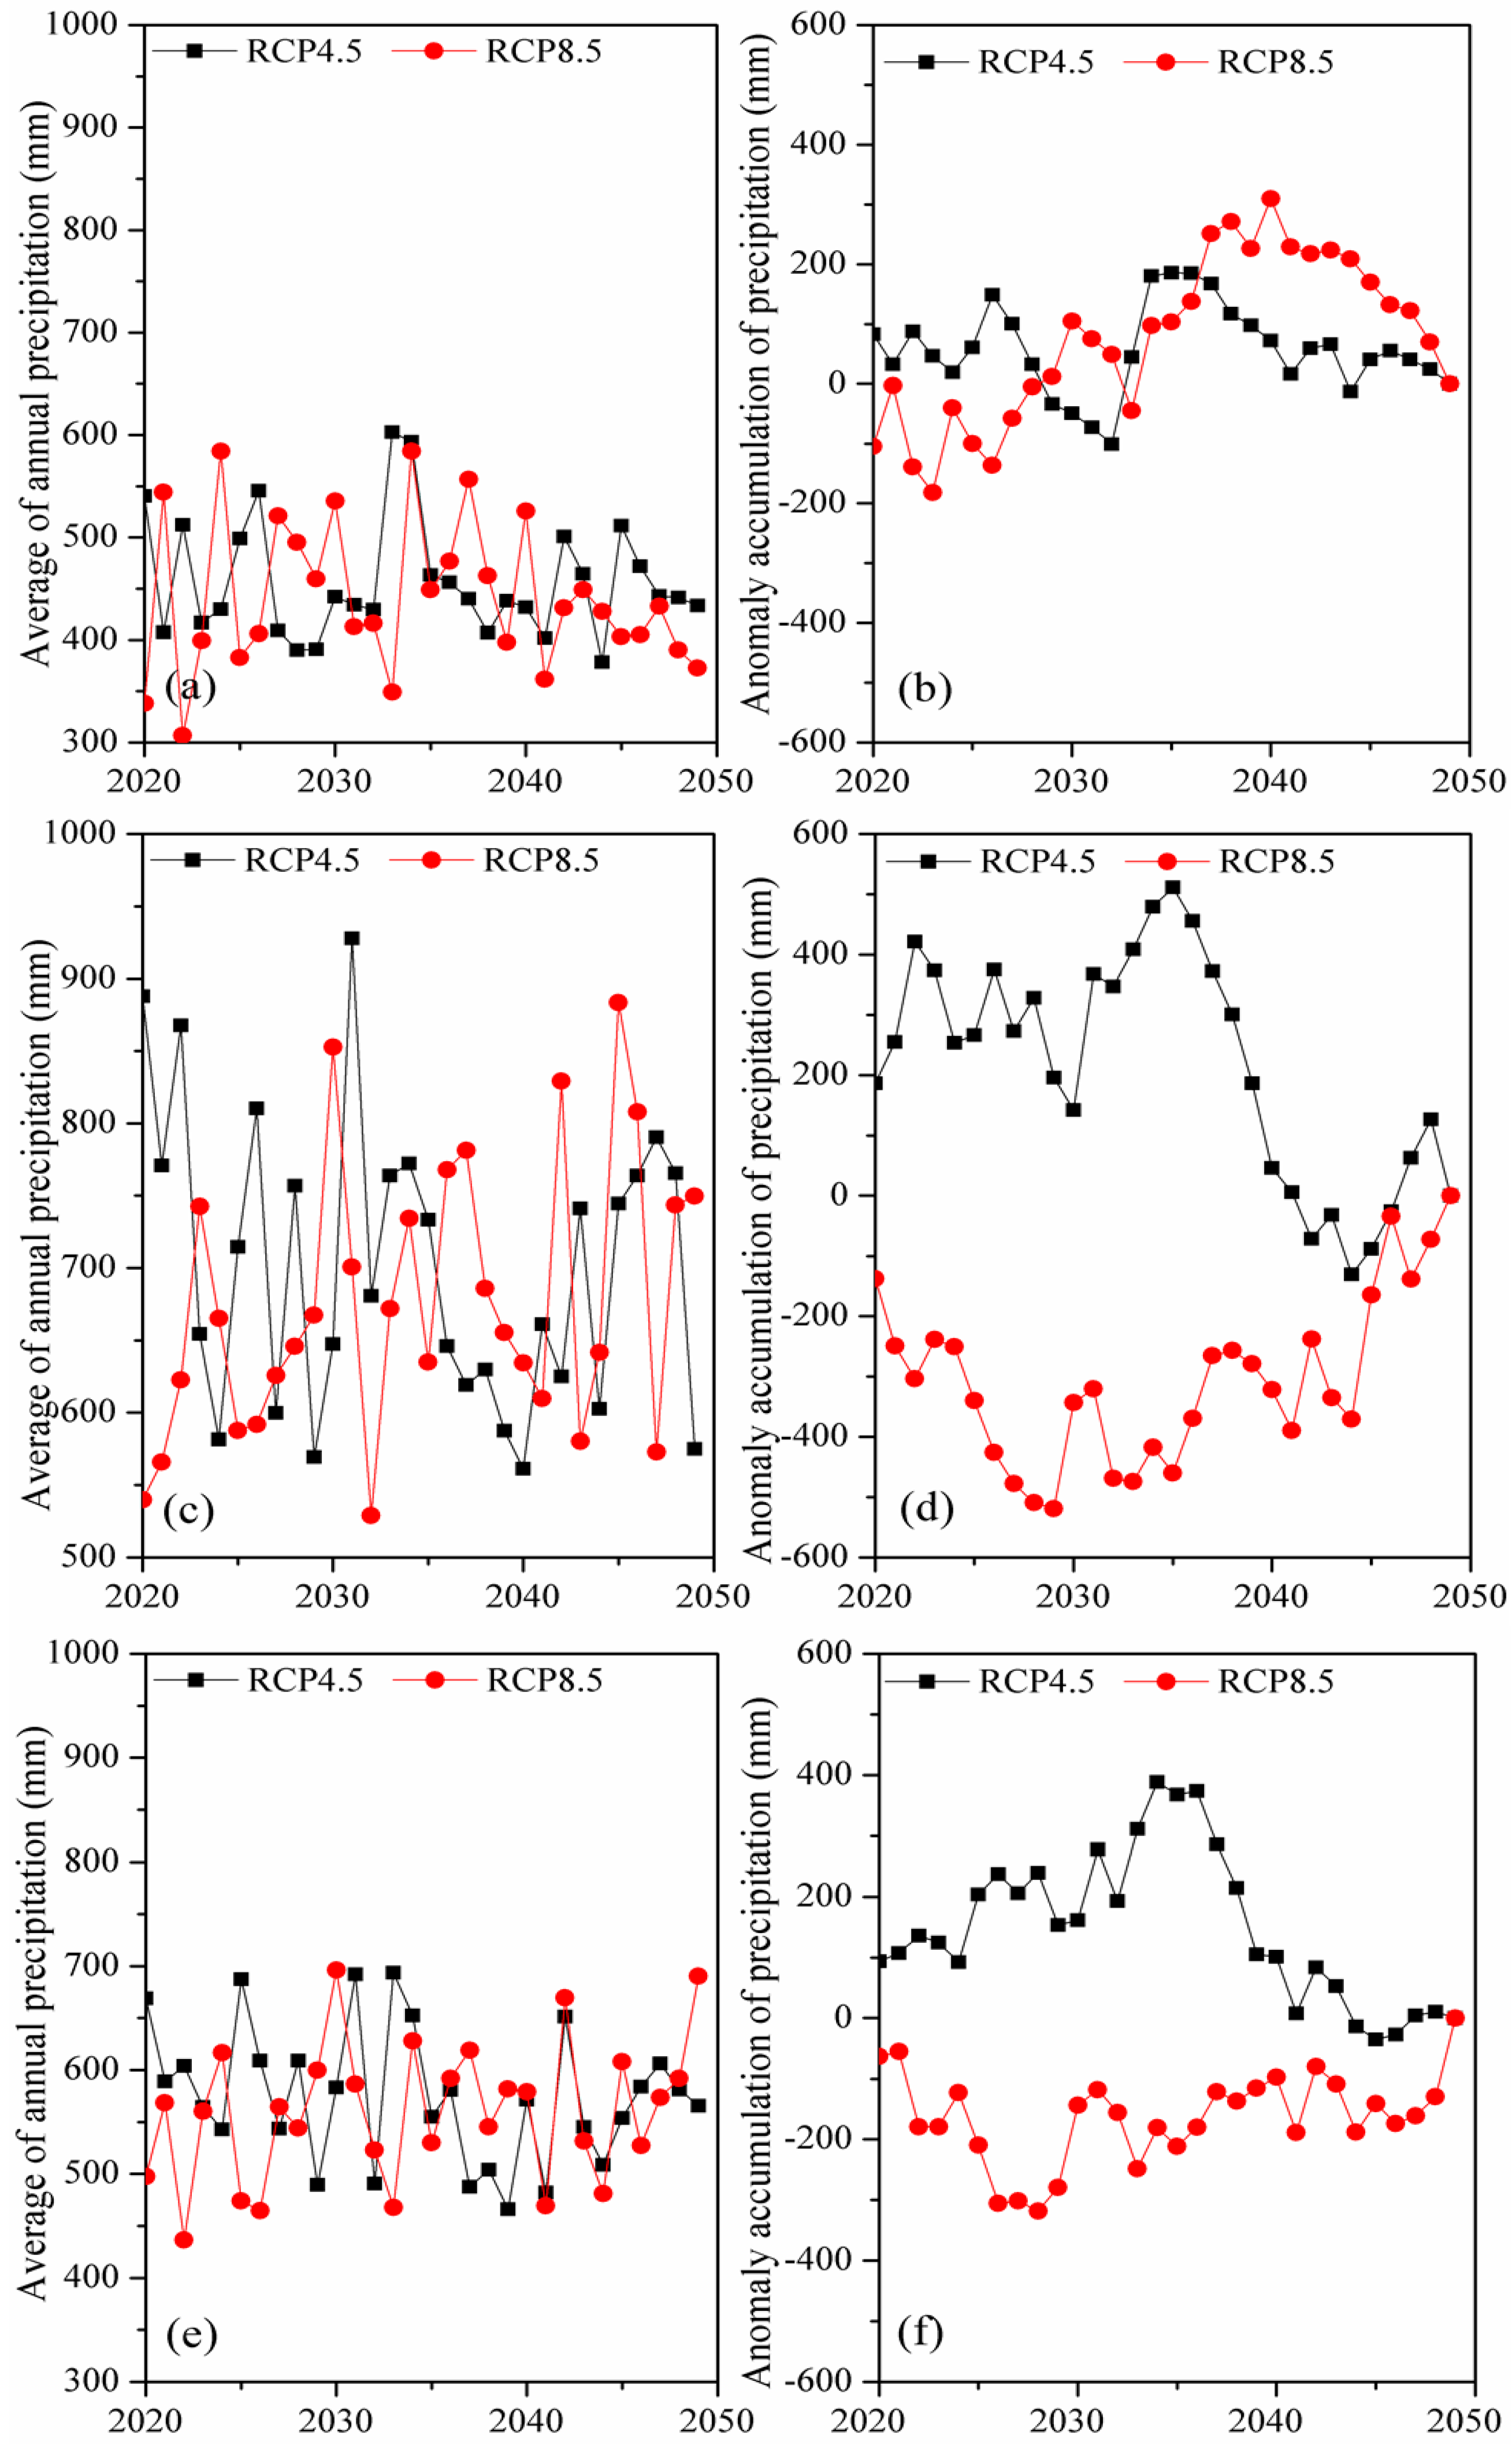
3.2.2. Changes of Projected Precipitation

Precipitation in the SRB is mainly concentrated in summer and fall. Therefore, the change of precipitation in the rainy season was the most relevant factor that affected streamflow during 1960–2009 [13]. The intra-annual distribution of precipitation during 2020–2049 is similar to that in 1980–2009 (Figure 5). Compared to the baseline condition, precipitation generally shows a slight decrease in NRB and LSRB under these two scenarios. For RCP 8.5, precipitation in NRB and LSRB mainly decreases in rainy months from June to August but increases in cold months from November to February. In terms of RCP 4.5, precipitation decrease is mainly concentrated from June to July in the NRB as well as from June to September in the LSRB. Conversely, with changes in the NRB and LSRB, USRB will experience a precipitation increase of 31 mm and 6 mm, respectively, under RCP 4.5 and RCP 8.5. The increase happens in almost all the months except September and October for RCP 4.5. As for RCP 8.5, precipitation in USRB increases by 13% and 15% respectively in August and September, whereas precipitation in March, June and October is about 10%–21% less than the baseline condition.
The inter-annual changes of annual average precipitation in the three sub-basins of the SRB for 2020–2049 are illustrated in Figure 6. For RCP 4.5, the average precipitation of the NRB and USRB suggests a decreasing trend, and the rate of decrease is 8 mm/10a and 28 mm/10a, respectively, whereas an increasing tendency is found in precipitation of LSRB with a rate of 22 mm/10a under the RCP 4.5 scenario. In terms of precipitation under RCP 8.5, downward trends are detected in the NRB and LSRB, where the rate of decrease is 10 mm/10a and 20 mm/10a, respectively. On the contrary, future precipitation in the USRB shows a significant increase of 41 mm/10a during 2020–2049 under the RCP 8.5 scenario.

3.3. Changes in Water Resources During 2020–2049

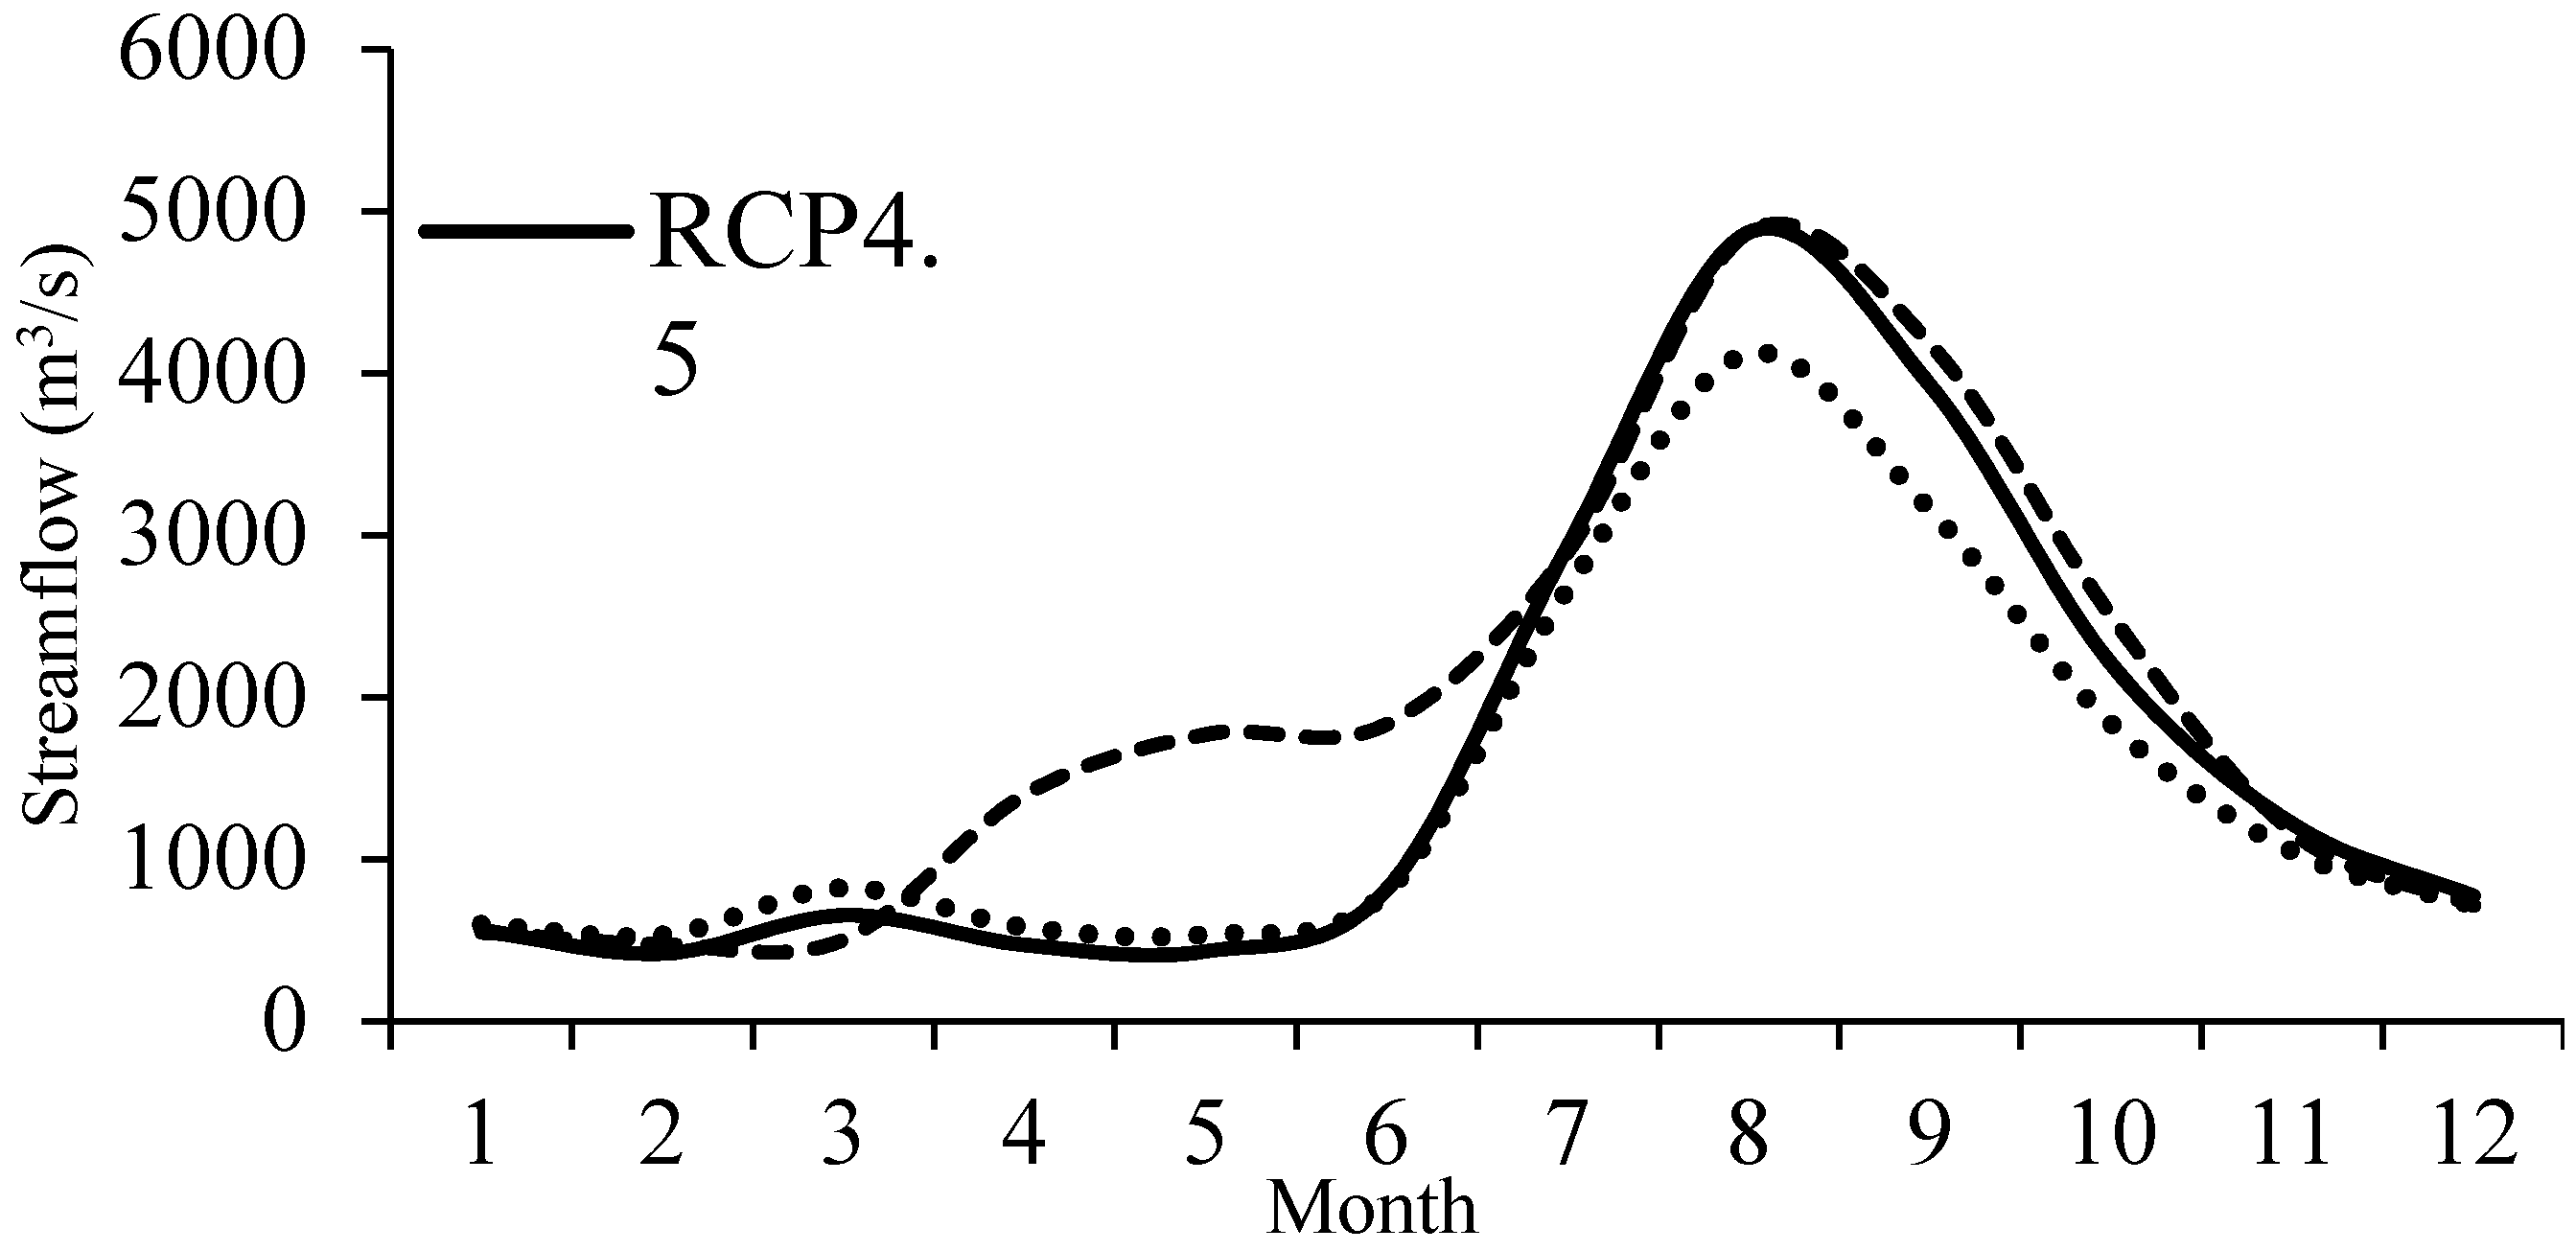
3.3.1. Intra-Annual and Inter-Annual Variations of Streamflow

Based on the projected climate data and the calibrated SWAT model, we obtained the intra-annual variation of streamflow for 2020–2049 in the SRB. For the upcoming three decades, the predicted streamflow is also expected to be high in summer months, which is consistent with that of 1980–2009 (Figure 7). When compared with the baseline condition (1980–2009), the streamflow of 2020–2049 increases in cold seasons but apparently decreases during late spring (i.e., April to June). The decrease during April and June will be 55%–75%. Overall, the streamflow intra-annual distribution curve under RCP 4.5 will be closer to the baseline condition than that of RCP 8.5, which implies a larger intra-annual change under RCP 8.5 scenario. In addition, the RCP 8.5 scenario shows a slightly higher intra-annual variation of streamflow than RCP 4.5 because of its decrease in high flow and increase in low flow.
According to the inter-annual trend analysis (Table 5), total streamflow in the SRB will proceed with a downward trend during 2020–2049. The decline of annual flow rate under the RCP 4.5 scenario will be 362 million m3/a, 202 million m3/a, and 360 million m3/a, respectively, in the NRB, USRB and LSRB. By contrast, the changing rate of annual flow under RCP 8.5 is slightly lower, i.e., 353, 196 and 353 million m3/a in the NRB, USRB and LSRB, respectively. Compared with the results from a previous study on long-term streamflow in this basin, the decreasing trend is more prevalent than that of 1960–2009 [13].

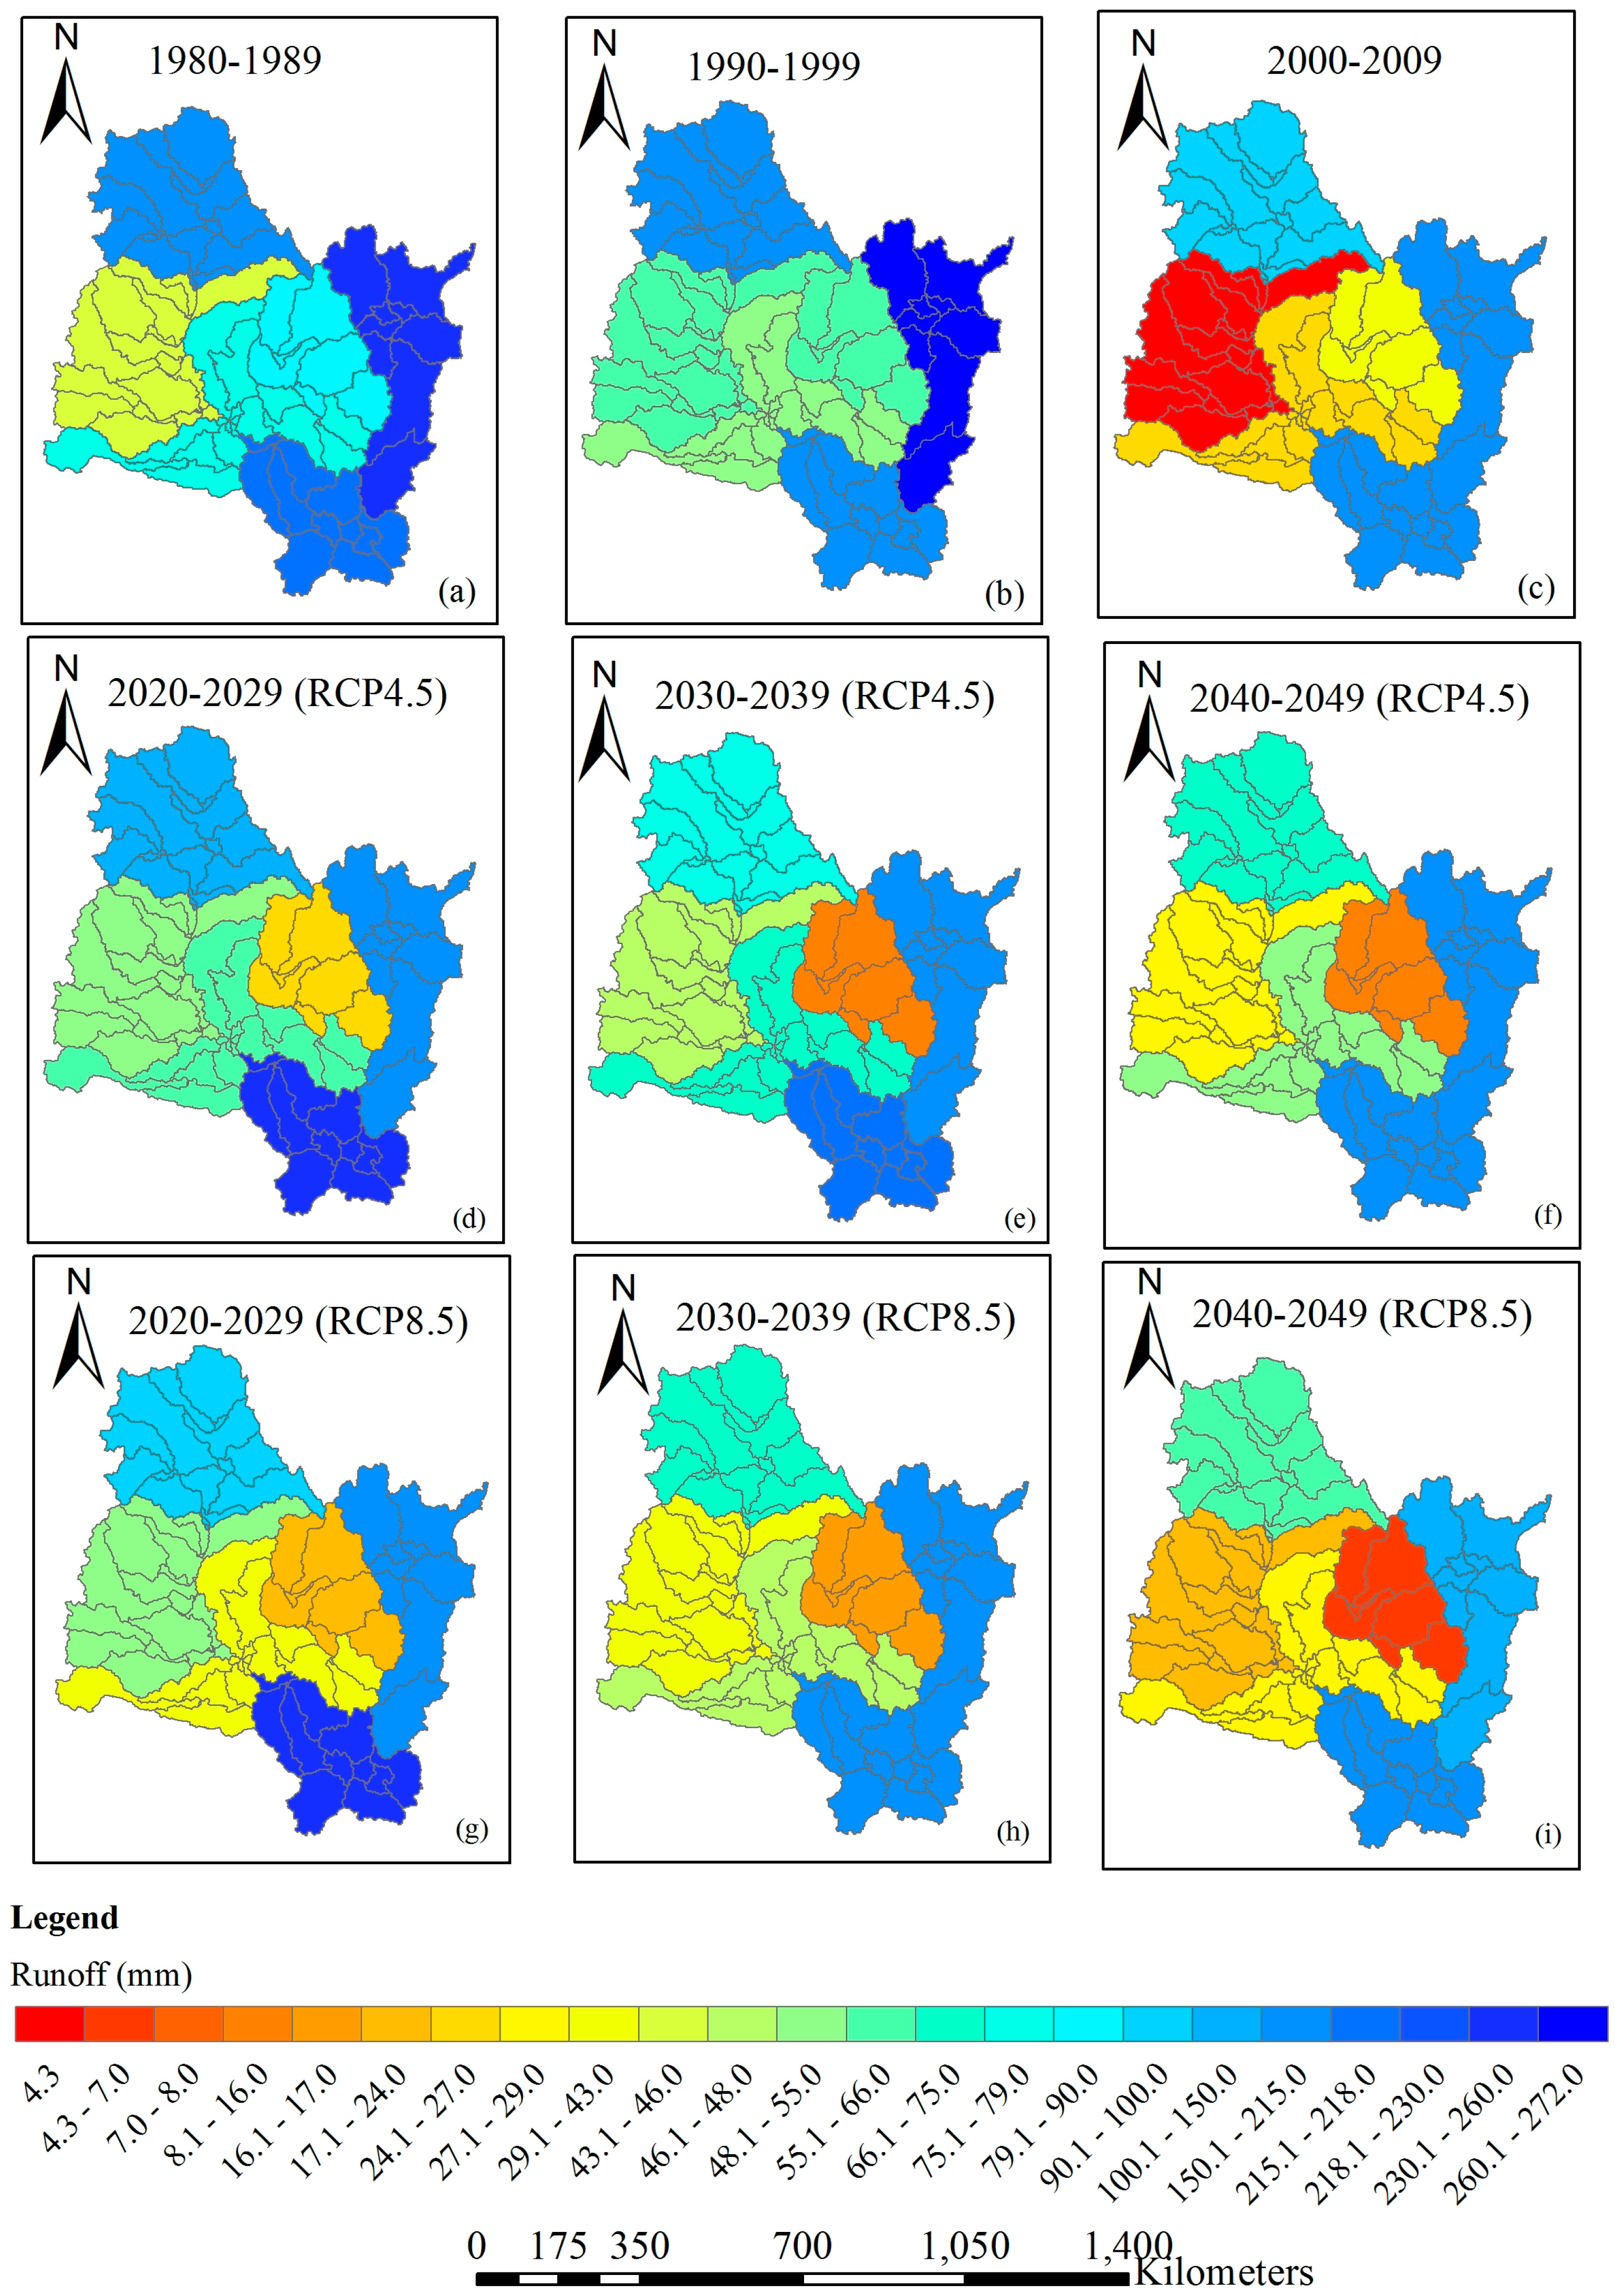
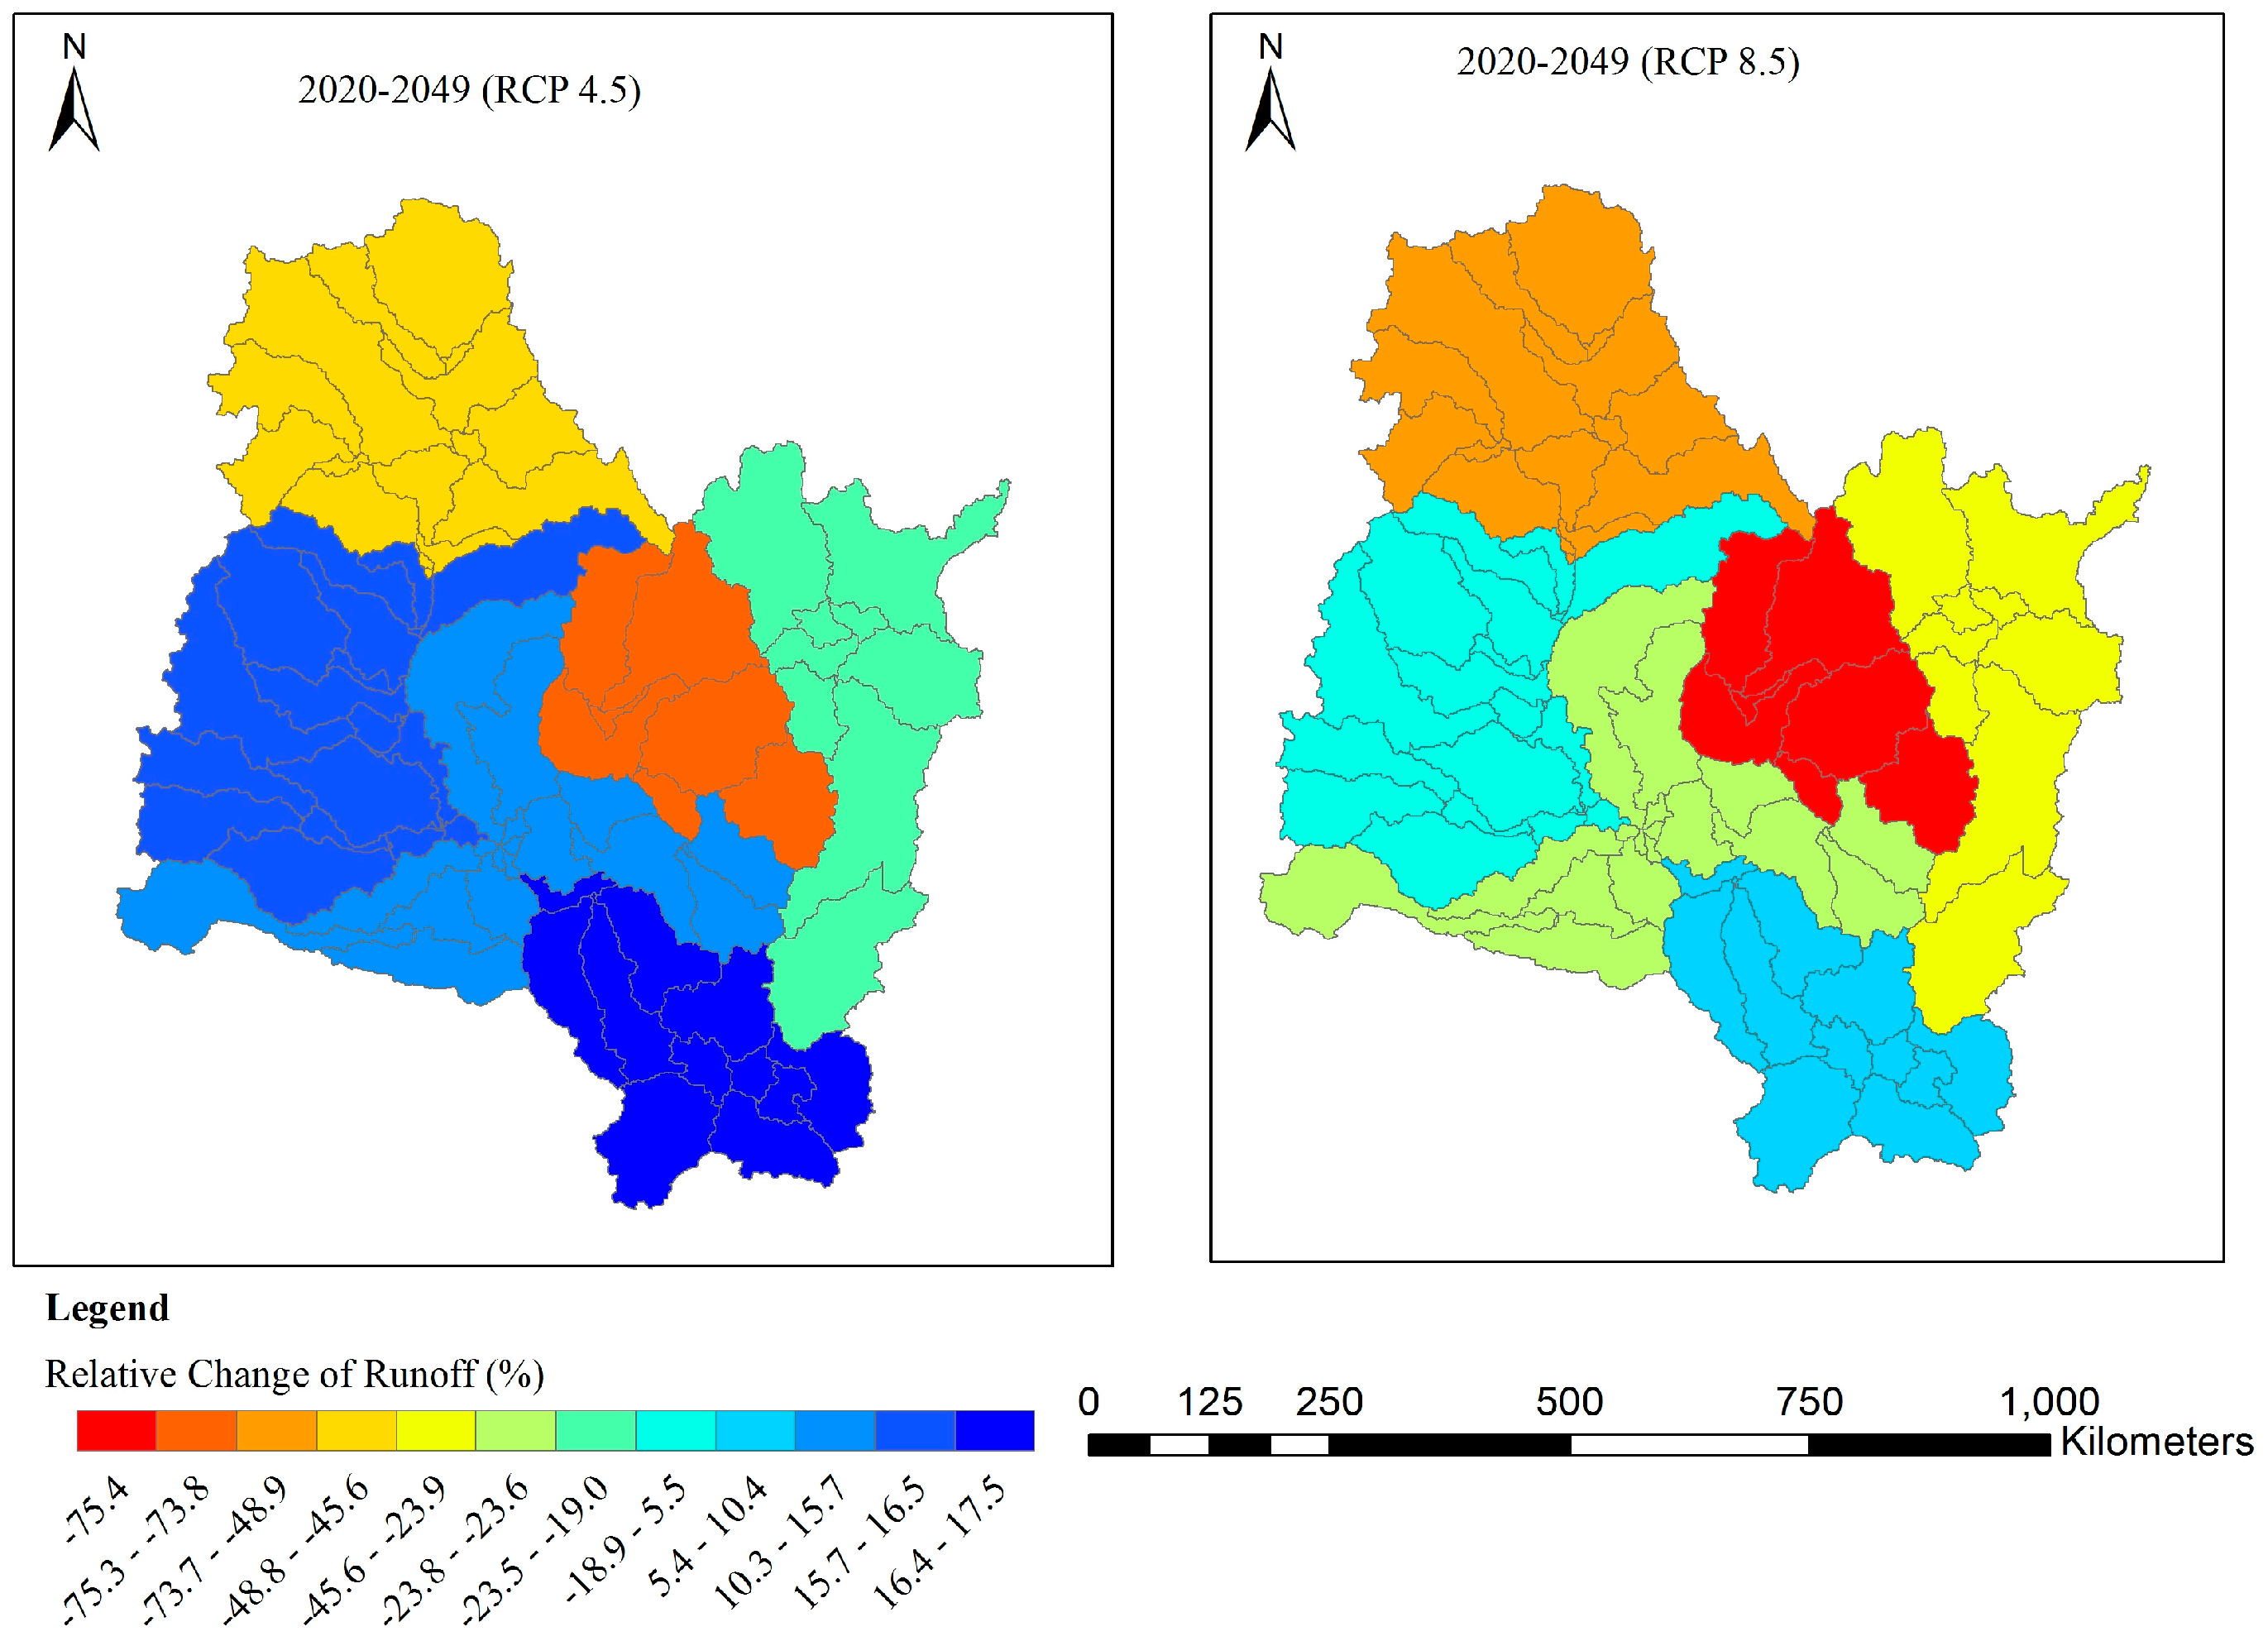
3.3.2. Spatial Variations of Predicted Water Resources

According to the output data of predicted streamflow, the average runoff of each sub-basin was calculated and applied to generate the spatial variation figure of runoff (Figure 8). It can be seen from the figure that the runoff in the SRB will decline over the following three decades under both RCP 4.5 and RCP 8.5 scenarios. Compared with the baseline period (1980–2009), the runoff decline in the future (2020–2049) will mainly happen in the upper NRB and LSRB, especially under the RCP 8.5 climatic condition, and the decrease of runoff will be substantial: 45%–75%. While runoff in the lower basins of the NRB and USRB will have an increase in 2020–2049, the change can be especially prevalent under the RCP 4.5 climatic condition (Figure 9). However, the increase in the lower NRB is much smaller than the decrease in the upper river.
Water resources are vital for eco-system and social activities in this area. As illustrated in Table 6, the average annual water yield of 2020–2049 in NRB and LSRB will be lower than the average value of 1980–2009. For RCP 4.5, the average streamflow in NRB and LSRB will reduce by 33.0% and 20.3% respectively. As for RCP 8.5, the respective decrease of streamflow will be 37.8% and 31.7% in these two sub-basins. Adversely, the streamflow in the USRB will increase by 17.7% and 9.68%, respectively under RCP 4.5 and under RCP 8.5.

4. Discussion

4.1. Implication of This Study

The Songhua River is a major source for industry, agriculture, ecosystem, and public drinking water supplies in Northeast China. Therefore, climate change and streamflow assessments of this river have become a very important issue for this region. In this study, the impact of climate change on future precipitation, temperature and streamflow has been investigated under the RCP 4.5 and RCP 8.5 scenarios of CMIP5 (2020–2049). Based on the statistical analysis results, both RCP 4.5 and RCP 8.5 scenarios suggested a warmer and drier climate for the NRB and LSRB in the future. The declining precipitation and warming temperature might directly affect the agricultural water consumption and crop growth in these areas through the processes such as evapotranspiration. Induced by the changing climate, there will be a more than 20% reduction of the future streamflow in these two sub-basins, especially under RCP 8.5. Previous studies have indicated that the average water demand for the main crops (e.g., corn and rice) in Northeast China is 500–700 mm [39]. In some arid areas, the demand might be larger than 800 mm throughout a growing season [40]. The current area of cultivated land in the SRB is 216,000 km2, of which 25,930 km2 is paddy land. In order to become China’s major grain production base by 2020, the area of cultivated land, especially paddy land, has largely been expanded in recent years [13,41]. In addition, crops’ water demand and irrigation requirement in this region will have a 10% increase under future climate change scenarios [39], which implies more water consumption in agriculture. The increasing water requirement for agriculture and less water resources would consequently increase the conflict in water and demand in these areas.
Streamflow in the SRB is also the main water source for the region’s diverse ecosystems, especially wetlands. Wetlands in the SRB have suffered from severe degradation, with an area deduction of 13.1% from 1975 to 2005 [41]. Climate change is considered as an important factor in the degradation of wetland in the SRB [24,42]. The warming and drying climate as well as the reduction in discharge in the basin would probably exacerbate the concern over wetland shrinkage and biodiversity loss in the river basin. Furthermore, streamflow in SRB will exhibit a decreasing tendency during 2020–2049, indicating that the conflict in water supply and demand will become more and more evident as time passes and consequently will have a strong effect on the agriculture and ecosystems in this region.

4.2. Limitation of This Study

There can be a series of uncertainties in studies of hydrological impact of climate change, including climatic models, greenhouse gas (GHG) emission scenarios, downscaling methods, hydrological model structure and parameters [43,44]. In this study, output data of RCP 4.5 and RCP 8.5 scenarios from CMIP5 were adopted to project the impacts of climate change in the SRB. On the one hand, there is large uncertainty in the process of climate data generation, such as GHG emission scenario assumptions and the climatic model simulation. On the other hand, the uncertainty of climate data processing also cannot be ignored. For instance, the spatial resolution of predicted climate data in this study is 0.5° × 0.5°. Although the climate data has been downscaled to local stations with a statistical method, the accuracy of downscaling is still uncertain. As precipitation and temperature are important factors that affect runoff in the SRB [13], a reliable prediction of future climate is essential for the purpose of obtaining a better estimation of climate change impacts. Therefore, how to assess uncertainty and improve the accuracy of the climate data prediction will be one important focus of our future work.
Other uncertainties such as hydrological models were also found to have similar or even larger influences in climate change studies [45,46,47]. Firstly, the applicability of a hydrological model is an important guarantee in these studies. In our study, the SWAT model, which was mostly used in small and medium-sized catchments [48,49], was applied to a large basin with an area of 556,800 km2. The model parameters are physically based and estimated from spatial databases. Results have shown that the model can simulate river discharge reasonably in the SRB. However, whether parameters can reflect the reality of hydrologic conditions largely depend on the scale and accuracy of the input databases. The resolutions of DEM and land use map in this study are both 1 km × 1 km, which may not be accurate enough to represent the spatial heterogeneity of parameters. In addition, methods selected for modeling, such as stream routing, calibration and sensitivity analysis, can also greatly influence the results. Therefore, the role of hydrological model uncertainty is remarkably high and should be considered in future studies.
In addition, factors such as soil type, land cover and other human management practices also have significant effects on streamflow. This study only assessed the impact of future climate change on streamflow, without considering the possible changes in these factors. Hence, changes in land use and human population should be included in our following studies. More studies and monitoring must be carried out, including the enhancement of detailed hydrological processes for modeling, the measurement of precipitation and related climate data, streamflow, and snow cover data. Additionally, more studies are needed on the effects of the changes in the hydraulic regime on environmental flows, agriculture, and irrigation practices.

5. Summary and Conclusions

This study assessed the impacts of projected climate change on water resources in the Songhua River Basin (SRB), Northeast China using the Soil and Water Assessment Tool (SWAT) model. The model was calibrated with 15-year historical streamflow records and the calibrated model was validated for an 11-year validation period. The model performed satisfactorily for both the calibration and validation periods. Simulations with the calibrated model for streamflow were then conducted for the upcoming three decades (2020–2049) under two climatic scenarios: RCP 4.5 and RCP 8.5 in CIMP5. Major results from this modeling study can be summarized as follows:
(1) Based on the future projection, temperature across the SRB showed a steady and significant increase under both climate change scenarios, especially in the Nenjiang River (NRB) and Lower Songhua River Basins (LSRB) located in northern and western SRB. With regard to precipitation, both scenarios showed a decreasing trend in the NRB and LSRB, but an increasing trend in the Upper Songhua River Basin that is located in the southeastern area SRB.
(2) Future surface water resources in the SRB would experience a considerable spatiotemporal change driven by the changing temperature and precipitation. From 2020 to 2049, streamflow would decline by 20.3%–37.8% in the drier NRB and LSRB, when compared with the 1980–2009 baseline conditions, but would increase by 9.68%–17.7% in the wetter USRB. Streamflow under the RCP 8.5 scenario would decline most in the future.
(3) These changes in future climate and water resources could have a significant impact on the already limited water availability for agriculture and wetland ecosystems in the SRB. The results obtained from this modeling study provide critical insights, potentially helping resource managers and government policymakers to develop effective water resource and eco-environment management strategies in the face of climate change.

Acknowledgments

The research was jointly funded by the National Basic Research Program of China (No. 2010CB428404), Key Research Program of Chinese Academy of Sciences (KSZD-EW-Z-021), the CAS/SAFEA International Partnership Program for Creative Research Teams, and Scientific Research Project of Public Welfare Industry of the Ministry of Water Resources, China (No. 201401014). During preparation of this manuscript, Y. Jun Xu received partial funding support from a U.S. Department of Agriculture Hatch Fund project (project number: LAB94230). We thank all members of our Hydrology and Water Resources Research Group.

Author Contributions

All authors contributed to the design and development of this manuscript. Fengping Li carried out the modeling work and data analysis, and prepared the first draft of the manuscript. Guangxin Zhang is the graduate advisor of Fengping Li and contributed many ideas to the study. Y. Jun Xu provided important advice on the concept of methodology and structuring of the manuscript, as well as edited the manuscript prior to submission and during revisions.

Conflicts of Interest

The authors declare no conflict of interest.

References

  1. Intergovernmental Panel on Climate Change (IPCC). Summary for Policymakers. In Climate Change 2013: The Physical Science Basis; Contribution of Working Group I to the IPCC Fifth Assessment Report Climate Change; Cambridge University Press: Cambridge, UK; New York, NY, USA, 2013. [Google Scholar]
  2. Chang, H.; Jung, I.W. Spatial and temporal changes in runoff caused by climate change in a complex large river basin in Oregon. J. Hydrol. 2010, 388, 186–207. [Google Scholar] [CrossRef]
  3. Jin, X.; Sridhar, V. Impacts of Climate Change on Hydrology and Water Resources in the Boise and Spokane River Basins 1. J. Am. Water Resour. Assoc. 2011, 48, 197–220. [Google Scholar] [CrossRef]
  4. Vaghefi, S.A.; Mousavi, S.J.; Abbaspour, K.C.; Srinivasan, R.; Yang, H. Analyses of the impact of climate change on water resources components, drought and wheat yield in semiarid regions: Karkheh River Basin in Iran. Hydrol. Process. 2014, 28, 2018–2032. [Google Scholar] [CrossRef]
  5. Brown, M.E.; Funk, C.C. Food security under climate change. Science 2008, 319, 580–581. [Google Scholar] [CrossRef] [PubMed]
  6. Ju, H.; Velde, M.V.D.; Lin, E.; Xiong, W.; Li, Y.C. The impacts of climate change on agricultural production systems in China. Clim. Chang. 2013, 120, 313–324. [Google Scholar] [CrossRef]
  7. Piao, S.; Ciais, P.; Huang, Y.; Shen, Z.H.; Peng, S.S.; Li, J.S.; Zhou, L.P.; Liu, H.Y.; Ma, Y.C.; Ding, Y.H.; et al. The impacts of climate change on water resources and agriculture in China. Nature 2010, 467, 43–51. [Google Scholar] [CrossRef] [PubMed]
  8. Sivakumar, B. Global climate change and its impacts on water resources planning and management: Assessment and challenges. Stoch. Environ. Res. Risk Assess. 2011, 25, 583–600. [Google Scholar] [CrossRef]
  9. Bhaduri, B.; Harbor, J.; Engel, B.; Grove, M. Assessing Watershed-Scale, Long-Term Hydrologic Impacts of Land-Use Change Using a GIS-NPS Model. Environ. Manag. 2000, 26, 643–658. [Google Scholar] [CrossRef] [PubMed]
  10. Holmes, M.G.R.; Young, A.R.; Goodwin, T.H.; Grew, R. A catchment-based water resource decision-support tool for the United Kingdom. Environ. Model. Softw. 2005, 20, 197–202. [Google Scholar] [CrossRef]
  11. Sharma, R.H.; Shakya, N.M. Hydrological changes and its impact on water resources of Bagmati watershed, Nepal. J. Hydrol. 2006, 327, 315–322. [Google Scholar] [CrossRef]
  12. Notter, B.; Macmillan, L.; Viviroli, D.; Weingartner, R.; Liniger, H.P. Impacts of environmental change on water resources in the Mt. Kenya region. J. Hydrol. 2007, 343, 266–278. [Google Scholar] [CrossRef]
  13. Li, F.; Zhang, G.; Xu, Y.J. Spatiotemporal variability of climate and streamflow in the Songhua River Basin, northeast China. J. Hydrol. 2014, 514, 53–64. [Google Scholar] [CrossRef]
  14. Shi, C.; Zhou, Y.; Fan, X.; Shao, W. A study on the annual runoff change and its relationship with water and soil conservation practices and climate change in the middle Yellow River basin. Catena 2013, 100, 31–41. [Google Scholar] [CrossRef]
  15. Wang, J.; Wang, E.; Liu, D.L. Modelling the impacts of climate change on wheat yield and field water balance over the Murray—Darling Basin in Australia. Theor. Appl. Climatol. 2010, 104, 285–300. [Google Scholar] [CrossRef]
  16. Gardner, L.R. Assessing the effect of climate change on mean annual runoff. J. Hydrol. 2009, 379, 351–359. [Google Scholar] [CrossRef]
  17. Lin, S.H.; Liu, C.M.; Huang, W.C.; Lin, S.S.; Yen, T.H.; Wang, H.R.; Kuo, J.T.; Lee, Y.C. Developing a yearly warning index to assess the climatic impact on the water resources of Taiwan, a complex-terrain island. J. Hydrol. 2010, 390, 13–22. [Google Scholar] [CrossRef]
  18. Dash, S.K.; Sharma, N.; Pattnayak, K.C.; Gao, X.J.; Shi, Y. Temperature and precipitation changes in the north-east India and their future projections. Glob. Planet. Chang. 2012, 98–99, 31–44. [Google Scholar] [CrossRef]
  19. Dawadi, S.; Ahmad, S. Changing climatic conditions in the Colorado River Basin: Implications for water resources management. J. Hydrol. 2012, 430–431, 127–141. [Google Scholar] [CrossRef]
  20. García-Ruiz, J.M.; López-Moreno, J.I.; Vicente-Serrano, S.M.; Lasanta-Martínez, T.; Beguería, S. Mediterranean water resources in a global change scenario. Earth-Sci. Rev. 2011, 105, 121–139. [Google Scholar] [CrossRef] [Green Version]
  21. Andersson, L.; Wilk, J.; Todd, M.C.; Hughes, D.A.; Earle, A.; Kniveton, D.; Layberry, R.; Savenije, H.H. Impact of climate change and development scenarios on flow patterns in the Okavango River. J. Hydrol. 2006, 331, 43–57. [Google Scholar] [CrossRef]
  22. Lu, Z.H.; Xia, Z.Q.; Yu, L.L.; Wang, J.C. Temporal and spatial variation of characteristics of precipitation in Songhua River Basin during 1958–2009. J. Nat. Res. 2012, 27, 990–1000. (In Chinese) [Google Scholar]
  23. Miao, C.Y.; Yang, L.; Liu, B.Y.; Gao, Y.; Li, S.L. Streamflow changes and its influencing factors in the mainstream of the Songhua River basin, Northeast China over the past 50 years. Environ. Earth Sci. 2011, 63, 489–499. [Google Scholar] [CrossRef]
  24. Dong, L.Q.; Zhang, G.X. The dynamic evolvement and hydrological driving factors of marsh in Nenjiang River basin. Adv. Water Sci. 2013, 24, 177–183. (In Chinese) [Google Scholar]
  25. Feng, X.; Zhang, G.; Yin, X. Hydrological Responses to Climate Change in Nenjiang River Basin, Northeastern China. Water Res. Manag. 2011, 25, 677–689. [Google Scholar] [CrossRef]
  26. Li, D.; Wang, W.; Li, Y. Analysis of Annual Runoff Variation Characteristics in Main Rivers of China. Hydrol. Process. 2012, 26, 2866–2877. [Google Scholar] [CrossRef]
  27. Mu, X.; Li, Y.; Gao, P.; Shao, H.; Wang, F. The Runoff Declining Process and Water Quality in Songhuajiang River Catchment, China under Global Climatic Change. CLEAN—Soil Air Water 2012, 40, 394–401. [Google Scholar] [CrossRef]
  28. Meng, D.; Mo, X. Assessing the effect of climate change on mean annual runoff in the Songhua River basin, China. Hydrol. Process. 2012, 26, 1050–1061. [Google Scholar] [CrossRef]
  29. Miao, C.; Lin, Y.; Liu, B.; Gao, Y.; Li, S. Streamflow changes and its influencing factors in the mainstream of the Songhua River basin, Northeast China over the past 50 years. Environ. Earth Sci. 2011, 63, 489–499. [Google Scholar] [CrossRef]
  30. Thiessen, A.H. Precipitation Averages for Large Areas. Mon. Weather Rev. 1911, 39, 1082–1084. [Google Scholar] [CrossRef]
  31. Setegn, S.G.; Rayner, D.; Melesse, A.M.; Dargahi, B.; Srinivasan, R. Impact of climate change on the hydroclimatology of Lake Tana Basin, Ethiopia. Water Resour. Res. 2011, 47, 289–306. [Google Scholar] [CrossRef]
  32. Zhang, P.; Liu, R.; Bao, Y.; Wang, J.; Yu, W.; Shen, Z. Uncertainty of SWAT model at different DEM resolutions in a large mountainous watershed. Water Res. 2014, 53, 132–144. [Google Scholar] [CrossRef] [PubMed]
  33. Zhang, Y.; Su, F.; Hao, Z.; Xu, C.; Yu, Z.; Wang, L.; Tong, K. Impact of projected climate change on the hydrology in the headwaters of the Yellow River basin. Hydrol. Process. 2015, 29, 4379–4397. [Google Scholar] [CrossRef]
  34. Griensven, A.V.; Meixner, T.; Grunwald, S.; Bishop, T.; Diluzio, M.; Srinivasan, R. A global sensitivity analysis tool for the parameters of multi-variable catchment models. J. Hydrol. 2006, 324, 10–23. [Google Scholar] [CrossRef]
  35. Abbaspour, K.C.; Johnson, C.A.; Genuchten, M.T.V. Estimating Uncertain Flow and Transport Parameters Using a Sequential Uncertainty Fitting Procedure. Vadose Zone J. 2004, 3, 1340–1352. [Google Scholar] [CrossRef]
  36. Nash, J.E.; Sutcliffe, J.V. River flow forecasting through conceptual models part I—A discussion of principles. J. Hydrol. 1970, 10, 282–290. [Google Scholar] [CrossRef]
  37. Dang, B.L.; Ren, Z.Y.; Zhang, C. Statistical analysis on precipitation in Xi’an Region during the last 50 years. J. Northwest Univ. (Nat. Sci. Ed.) 2011, 44, 139–144. (In Chinese) [Google Scholar]
  38. He, W.; Bu, R.C.; Xiong, Z.P.; Hu, Y.M. Characteristics of temperature and precipitation in Northeastern China from 1961 to 2005. Acta Ecol. Sin. 2013, 33, 519–531. (In Chinese) [Google Scholar] [CrossRef]
  39. Cong, Z.; Yao, B.; Ni, G. Crop Water Demand in China under the SRA1B Emissions Scenario. Adv. Water Sci. 2011, 22, 38–43. (In Chinese) [Google Scholar]
  40. Chen, Y.; Zhang, G.; Xu, Y.J.; Huang, Z. Influence of Irrigation Water Discharge Frequency on Soil Salt Removal and Rice Yield in a Semi-Arid and Saline-Sodic Area. Water 2013, 5, 578–592. [Google Scholar] [CrossRef]
  41. Li, F.; Zhang, G.; Xu, Y. Separating the Impacts of Climate Variation and Human Activities on Runoff in the Songhua River Basin, Northeast China. Water 2014, 6, 3320–3338. [Google Scholar] [CrossRef]
  42. Yuan, L.H.; Jiang, W.G.; Luo, Z.L.; He, X.H.; Liu, Y.H. Analysis of wetland change in the Songhua River Basin from 1995 to 2008. IOP Conf. Ser. Earth Environ. Sci. 2014, 17, 12125–12131. [Google Scholar] [CrossRef]
  43. Majone, B.; Bovolo, C.; Bellin, A.; blenkinsop, S.; Fowler, H.J. Modeling the impacts of future climate change on water resources for the Gállego river basin (Spain). Water Resour. Res. 2012, 48. [Google Scholar] [CrossRef]
  44. Bosshard, T.; Carambia, M.; Goergen, K.; Kotlarski, S.; Krahe, P.; Zappa, M.; Schär, C. Quantifying uncertainty sources in an ensemble of hydrological climate-impact projections. Water Resour. Res. 2013, 49, 1523–1536. [Google Scholar] [CrossRef]
  45. Horton, P.; Schaefli, B.; Mezghani, A.; Hingray, B.; Musy, A. Assessment of climate change impacts on alpine discharge regimes with climate model uncertainty. Hydrol. Process. 2006, 20, 2091–2109. [Google Scholar] [CrossRef]
  46. Chen, J.; Brissette, F.P.; Poulin, A.; Leconte, R. Overall uncertainty study of the hydrological impacts of climate change for a Canadian watershed. Water Resour. Res. 2011, 47. [Google Scholar] [CrossRef]
  47. Teutschbein, C.; Wetterhall, F.; Seibert, J. Evaluation of different downscaling techniques for hydrological climate-change impact studies at the catchment scale. Clim. Dyn. 2011, 37, 2087–2105. [Google Scholar] [CrossRef]
  48. Uniyal, B.; Jha, M.K.; Verma, A.K. Assessing Climate Change Impact on Water Balance Components of a River Basin Using SWAT Model. Water Resour. Manag. 2015, 29, 4767–4785. [Google Scholar] [CrossRef]
  49. Maier, N.; Dietrich, J. Using SWAT for Strategic Planning of Basin Scale Irrigation Control Policies: A Case Study from a Humid Region in Northern Germany. Water Resour. Manag. 2016, 30, 3285–3298. [Google Scholar] [CrossRef]
Figure 1. The Songhua River Basin in northeastern China and the gauging (triangles) and meteorological (stars) stations used in this study.
Water 08 00420 g001
Figure 2. Observed and simulated daily streamflow hydrographs during calibration (a) and validation (b) periods.
Water 08 00420 g002
Figure 3. Changes of average monthly temperature in the Nenjiang River (a); Upper Songhua River (b); and Lower Songhua River (c) sub-basins of the Songhua River Basin.
Water 08 00420 g003
Figure 4. The inter-annual variation and anomaly accumulation of temperature in Nenjiang River (a, b), Upper Songhua River (c, d), and Lower Songhua River (e, f) sub-basins of the Songhua River Basin during 2020–2049.
Water 08 00420 g004
Figure 5. Changes of average monthly precipitation in the Nenjiang River (a); Upper Songhua River (b); and Lower Songhua River (c) sub-basins of the Songhua River Basin.
Water 08 00420 g005
Figure 6. Inter-annual variation and anomaly accumulation of precipitation in the Nenjiang River (a, b), Upper Songhua River (c, d), and Lower Songhua River (e, f) sub-basins of the Songhua River Basin during 2020–2049.
Water 08 00420 g006
Figure 7. Intra-annual changes of discharge in the Songhua River Basin (at Jiamusi Station) for 1980–2009 and 2020–2049 under two future climate scenarios (RCP 4.5 and RCP 8.5)
Water 08 00420 g007
Figure 8. Spatial characteristics of annual runoff in the Songhua River Basin for different decades under baseline condition (ac) and future climate scenarios (RCP 4.5 (df) and RCP 8.5 (gi)). Spatial variations of runoff within the six units are not considered.
Water 08 00420 g008
Figure 9. Spatial characteristics of relative changes of runoff in the Songhua River Basin for 2020–2049 under future climate scenarios (RCP 4.5 and RCP 8.5) when compared with runoff of 1980–2009. Spatial variations of runoff within the six units are not considered.
Water 08 00420 g009
Table 1. Summary of main gauging stations and hydrological characteristics in the Songhua River Basin, Northeast China.
Gauging StationRiverBasinDrainage Area (km2)Annual Runoff (108 m3)
JiwenGan RiverNenjiang River Basin487910.83
Liujiatun19,66536.54
SuolunTaoer River58935.99
BalinYalu River28074.10
Zhalantun68919.97
Nianzishan13,56718.06
TaerqiChuoer River19062.96
Wendegen12,44717.58
Liangjiazi15,54418.86
XiaoergouNuomin River16,76131.07
DeduNemoer River720011.04
ShihuiyaoMainstream17,20527.66
Tongmeng108,029150.65
Dalai221,715197.44
WudaogouHuifa RiverUpper Songhua River Basin12,39123.05
GaolichengziMainstream472823.29
Hanyangtun853229.92
Fuyu71,783141.82
TieliHulan RiverLower Songhua River Basin18385.10
Qinjia980920.22
DanianzigouLalin River524112.72
Wuchang564214.46
LianhuaMayi River10,42520.57
MudanjiangMudan River22,19450.69
WokenWoken River41854.25
BaoquanlingWutong River27508.09
FulitunAnbang River5470.94
WuyingTangwang River416011.03
Yixin10,27227.02
Chenming19,18651.35
HaerbinMainstream389,769393.44
Tonghe450,077438.02
Jiamusi528,277612.70
Table 2. Descriptions of the major parameters for the SWAT model used in this study for the Songhua River Basin.
ParameterDescription
CN2Initial SCS runoff curve number for moisture condition II
ESCOSoil evaporation compensation factor
CH_K2 (mm/h)Effective hydraulic conductivity in main channel alluvium
SURLAG (day)Surface runoff lag coefficient
GW_DELAY (day)Delay time for aquifer recharge
ALPHA_BF (day)Baseflow alpha factor
GWQMN (mm H2O)Threshold depth of water in the shallow aquifer required for return flow to occur
GW_REVAPGroundwater “revap” coefficient
REVAPMN (mm)Threshold depth of water in the shallow aquifer for evaporation
SOL_AWC (mm H2O/mm soil)Available water capacity of the soil layer
SOL_K (mm/h)Saturated hydraulic conductivity
Table 3. Evaluation criteria for model performance.
Model EvaluationEnsR2Er
Excellent0.75 < Ens ≤ 1.000.80 <R2 ≤ 1.00|Er| ≤ 10
Good0.65 < Ens ≤ 0.750.70 < R2 ≤ 0.8010 < |Er| ≤ 15
Satisfactory0.54 < Ens ≤ 0.650.50 < R2 ≤ 0.7015 < |Er| ≤ 25
Unsatisfactory0 < Ens ≤ 0.540 < R2 ≤ 0.50|Er| > 25
Table 4. Evaluation for simulation results of monthly streamflow during calibration and validation periods.
Simulation PeriodsEnsR2Er
Calibration (1980–1994)0.670.83−7.60
Validation (1995–2009)0.720.74−9.63
Table 5. Trends of future streamflow in the Nenjiang River (NRB), Upper Songhua River (USRB), and Lower Songhua River (LSRB) sub-basins of the Songhua River Basin under two climate change scenarios.
Climate ScenariosChanging Rate (108 m3/a)
NRBUSRBLSRB
RCP 4.5−3.62−2.02−3.60
RCP 8.5−3.53−1.96−3.53
Table 6. Changes of annual water yield during 2020–2049 under future climate senarios (RCP 4.5 and RCP 8.5) in the Songhua River Basin.
1980–2009 (108 m3)RCP 4.5RCP 8.5
2020–2049 (108 m3)Relative Change (%)2020–2049 (108 m3)Relative Change (%)
NRB202.8135.9−33126.1−37.8
USRB138.8163.317.7152.29.68
LSRB263.1209.6−20.3179.8−31.7

