Article

Quality of Water in the Road Drainage Systems in the Warsaw Agglomeration, Poland

1
Faculty of Civil and Environmental Engineering, Warsaw University of Life Sciences—SGGW, Nowoursynowska 159, Warsaw 02-776, Poland
2
Faculty of Biology and Biotechnology, Universitiy of Warmia and Mazury in Olsztyn, Pl. Łódzki 1, Olsztyn 10-727, Poland
3
Faculty of Environmental Management and Agriculture, Universitiy of Warmia and Mazury in Olsztyn, Pl. Łódzki 4, Olsztyn 10-727, Poland
*
Author to whom correspondence should be addressed.
Water 2016, 8(10), 429; https://doi.org/10.3390/w8100429
Submission received: 18 July 2016 / Revised: 12 September 2016 / Accepted: 23 September 2016 / Published: 29 September 2016

Abstract

:
Water from road drainage systems shed into ditches and infiltration reservoirs may pose a hazard to the natural environment due to the possibility of being introduced into groundwater and surface water. The paper presents the results of chemical analyses of samples collected from selected points of the Warsaw agglomeration road drainage system. The samples were tested for the content of the following parameters: pH, EC (multimeter-electrode), Cl (Mohr method), SO42−, PO43−, NH4+, NO3, TOC, COD (UV-VIS), Cu, Zn, Ni, and Pb (ASA). The analysed points differed significantly in the variability of the tested parameters in the measurement period. The highest values of EC and Cl were noted in three tested points, in which the EC content exceeded the permissible values for the second class of water quality. The contents of sulphates in all but one point were within the range for water of very good quality. Water pH was slightly alkaline. Low concentrations of nitrogen forms, nitrate and ammonium ions were observed. The concentrations of Ni, Pb and Zn did not exceed the boundary values for industrial sewage shed into the water or ground. The concentration of Cu exceeded the permissible concentrations determined in the Regulation of the Minister of the Environment almost three times.

1. Introduction

In recent years, concern about the environment has become of special importance because of the increasing human impact on its various components, such as the atmosphere, surface water, groundwater, soil and others [1,2,3,4]. Within communication objects, rainwater becomes contaminated by various chemical substances. The development of road construction and infrastructure contributes to the increase of environmental contamination, especially in close proximity to highways and roads, and in associated objects, such as petrol stations, car washes and car parking lots [5]. The main pollutants arising from the operation of roads are oils, lubricants, propellants, tars, silicones, exhaust gases produced by the combustion of fuel, abrasive products of brake discs and tires, asphalt, ashes, dusts, organic bituminous ingredients, and remnants after the maintenance of roads during winter [6]. These substances contribute to road runoff that may migrate to receivers such as surface water, soil and wastewater facilities [7]. The infiltration systems allow the management of road runoff and reduce the total pollutant mass delivered to the surface water systems such as rivers and lakes [8]. During the infiltration of collected runoff water, the pollutants may be adsorbed, transformed, biologically degraded or volatised [9,10].
Polish legal regulations [11] define road drainage as a system responsible for the shedding of rainwater flowing from roads, its transportation beyond the crown of the road, water treatment by removing hazardous pollutants resulting from road management, and its introduction into the environment according to the Water Law and the requirements of water protection. Introduction of pollutants into the ground or water requires the construction, maintenance and exploitation of equipment protecting the water against pollution.
Pollutants flowing with rainwater into the receivers can be reduced by different methods, depending on the local conditions (landform, spatial management, hydrography and hydrology) and environmental requirements. However, in each case the basic issue is to protect the reservoir (soil, water) against pollution. The protecting devices can be sub-divided into four groups according to their function or operating mode: increasing runoff retention, mechanical treatment, biological treatment, and devices cutting off the runoff of hazardous substances to the reservoir in cases of their spilling in emergency situations. The devices simultaneously fulfil numerous tasks and may mutually cooperate, forming a treatment system; the basic difficulty with regard to runoff treatment is the lack of a typical composition of stormwater. This fact influences the uneven runoff of pollutants in time [12,13].
Retention installations are designed to minimise the changes of the water balance, assuring the intensification of sedimentation, infiltration and biochemical processes that take place in drainage systems. Their task is also to protect the receiver against erosion, by reducing the intensity of rainwater runoff. Water is captured in retention reservoirs, in thresholds and in compartments in the ditches; as also, minimal longitudinal fall in the dewatering channels and ditches is assured [14].
Mechanical treatment is conducted by processes of sedimentation and flotation of pollutants. The quality of water in the receivers rises due to the reduction of suspension following the sedimentation process. Grass ditches, soil and gravel filters, drainage, grit chambers, settling tanks, gravity and coalescence separators, as well as retention and retention-filtration basins are used in mechanical treatment [15,16].
Biological treatment uses natural processes for water purification. Existing water reservoirs and other natural objects/conditions are very commonly used; artificial installations are also constructed. Grass ditches and surfaces, root and reed treatment plants, as well as retention-infiltration ponds are used in biological treatment [17].
The paper is focused on the analysis of selected physical and chemical parameters of water from road drainage systems and road infrastructure. A series of chemical analyses were conducted to achieve the aim of the research, including tests of: pH, electrical conductivity (EC), Cl, SO42−, PO43−, NH4+, NO3, Cu, Ni and Zn. The obtained results have been used to determine the seasonal variability of the studied parameters.

2. Material and Methods

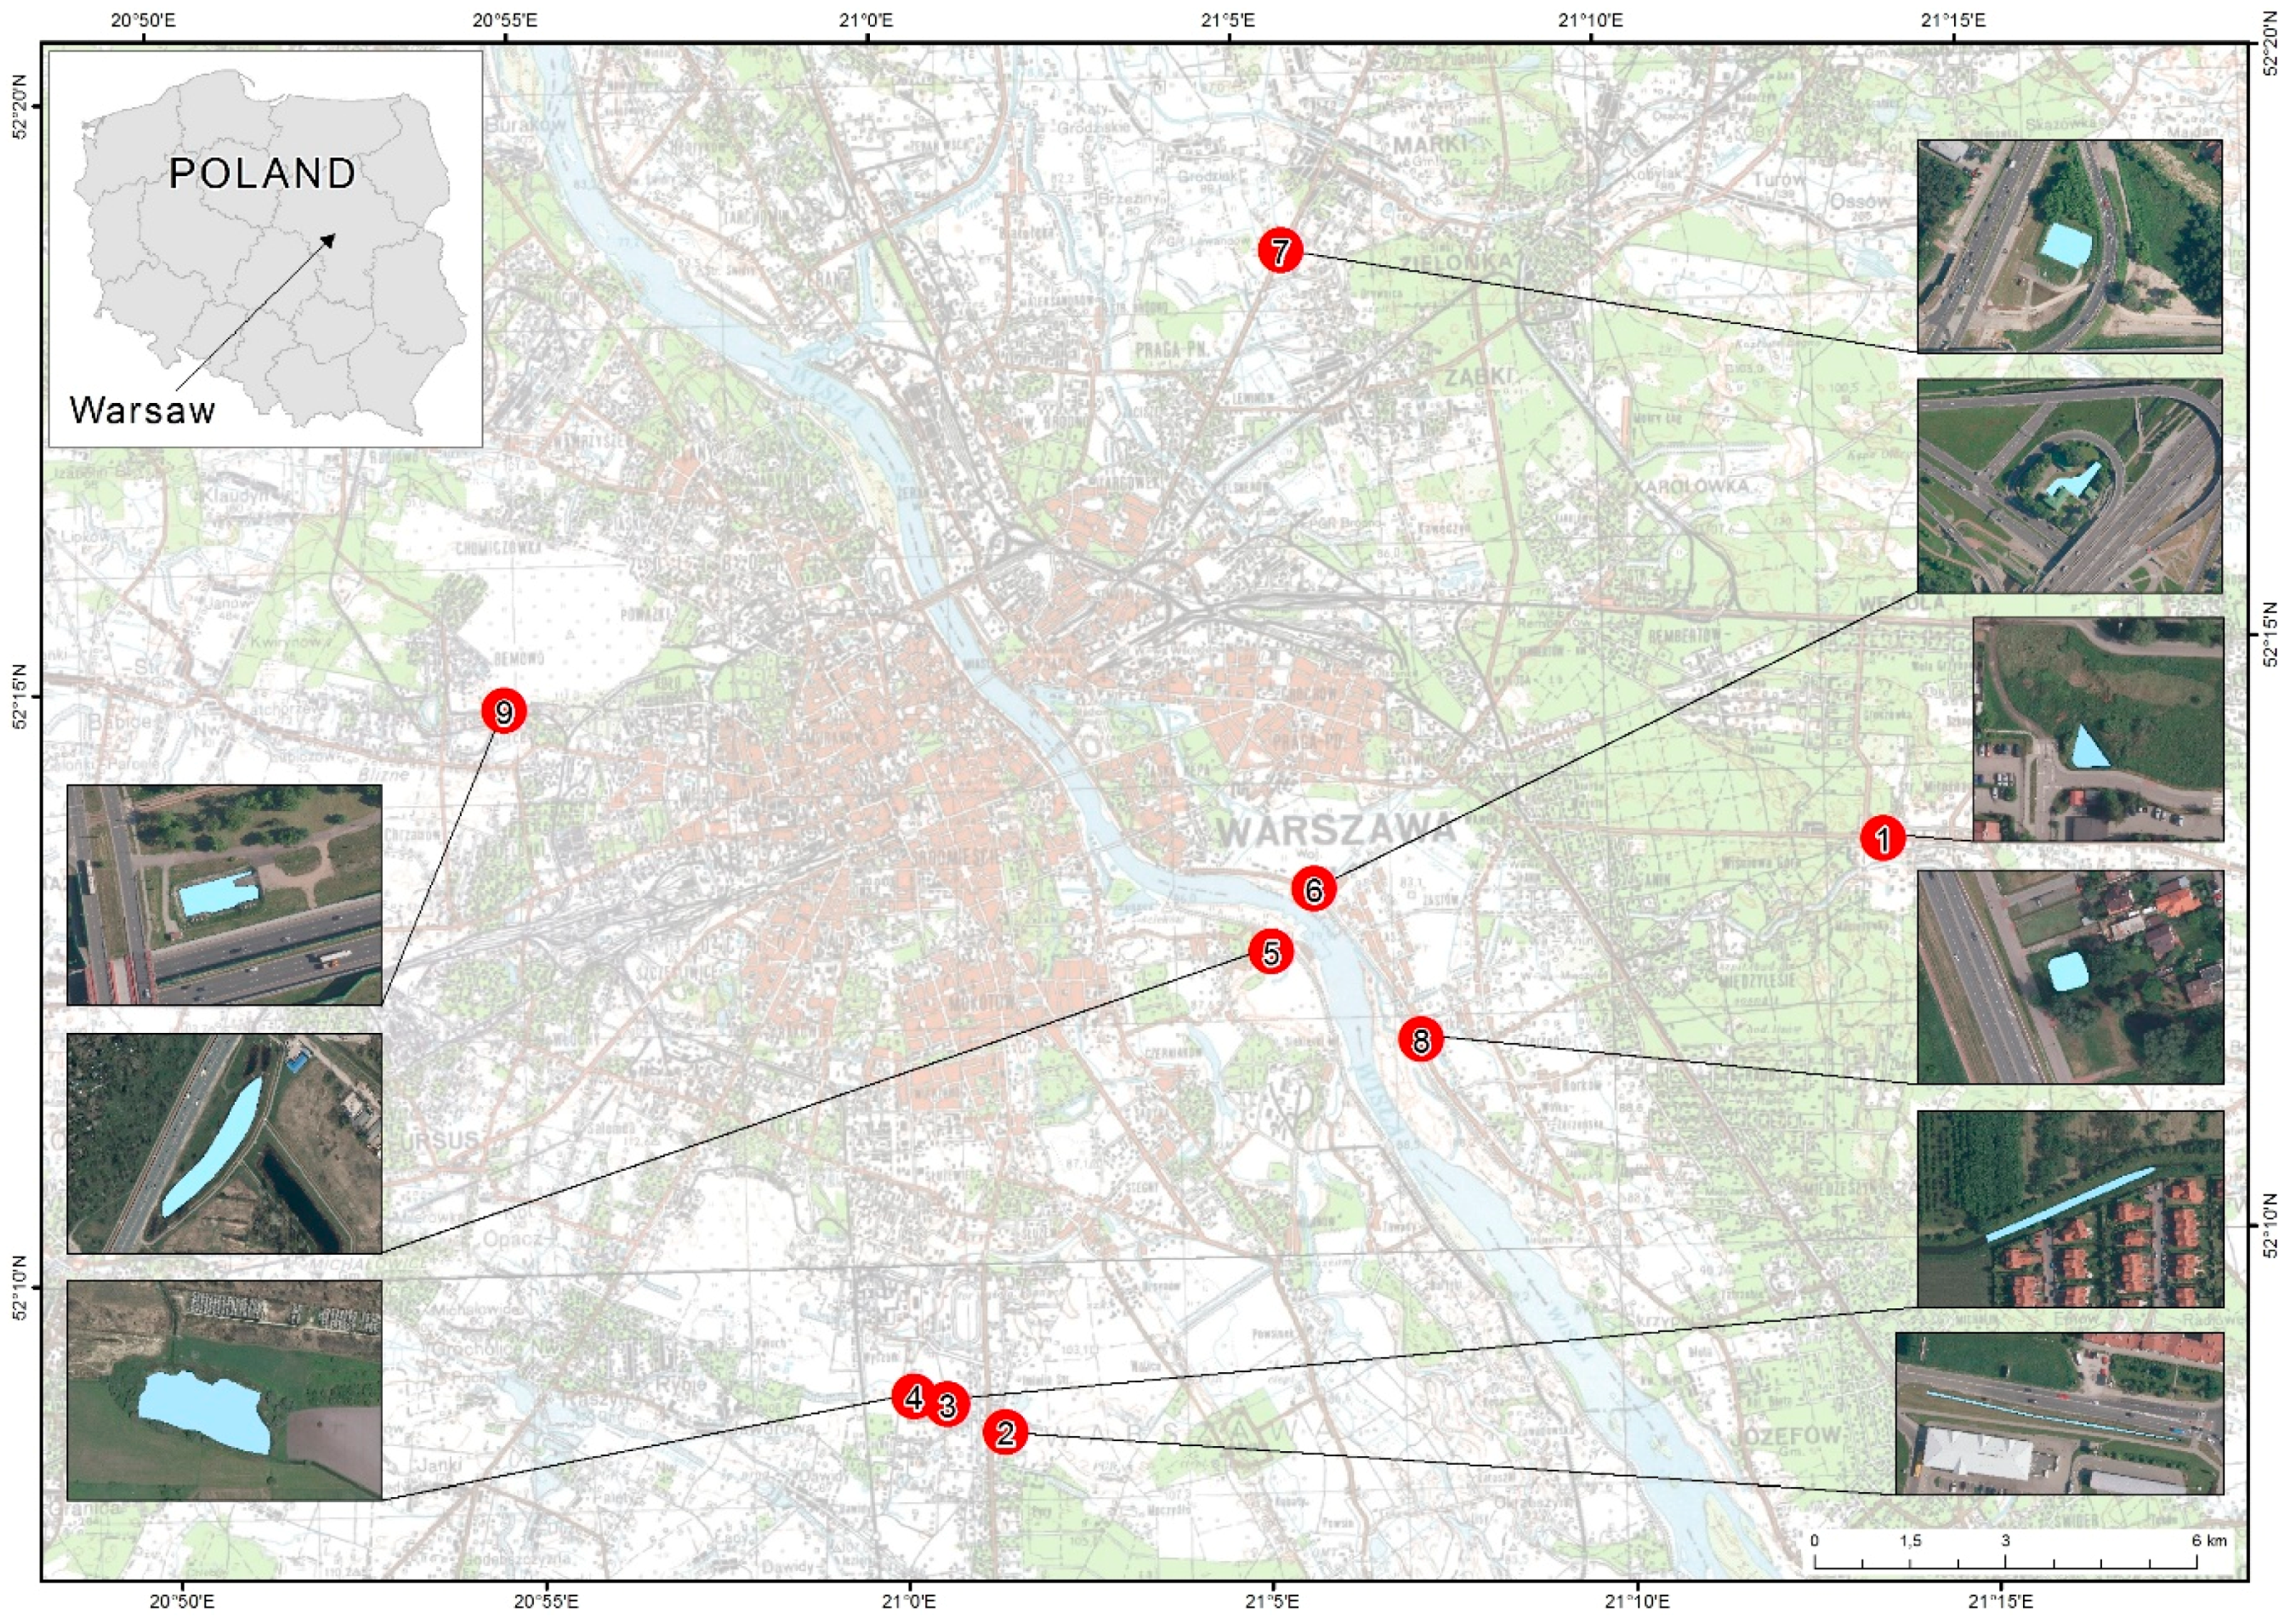
2.1. Characteristics of the Studied Points

Water samples from nine points of the drainage system within the Warsaw agglomeration along roads with variable traffic intensity have been collected in three repetitions (May, July and October) in 2013 (Figure 1). Points Nos. 1 and 6 are generally retention reservoirs, whereas the remaining points variably use ecological treatment of road runoff. A detailed characteristics of the points is presented in Table 1. Figure 2 presents temperature and rainfall in the study period, and 30 days before the first sample collection. Samples were taken after rainfall.

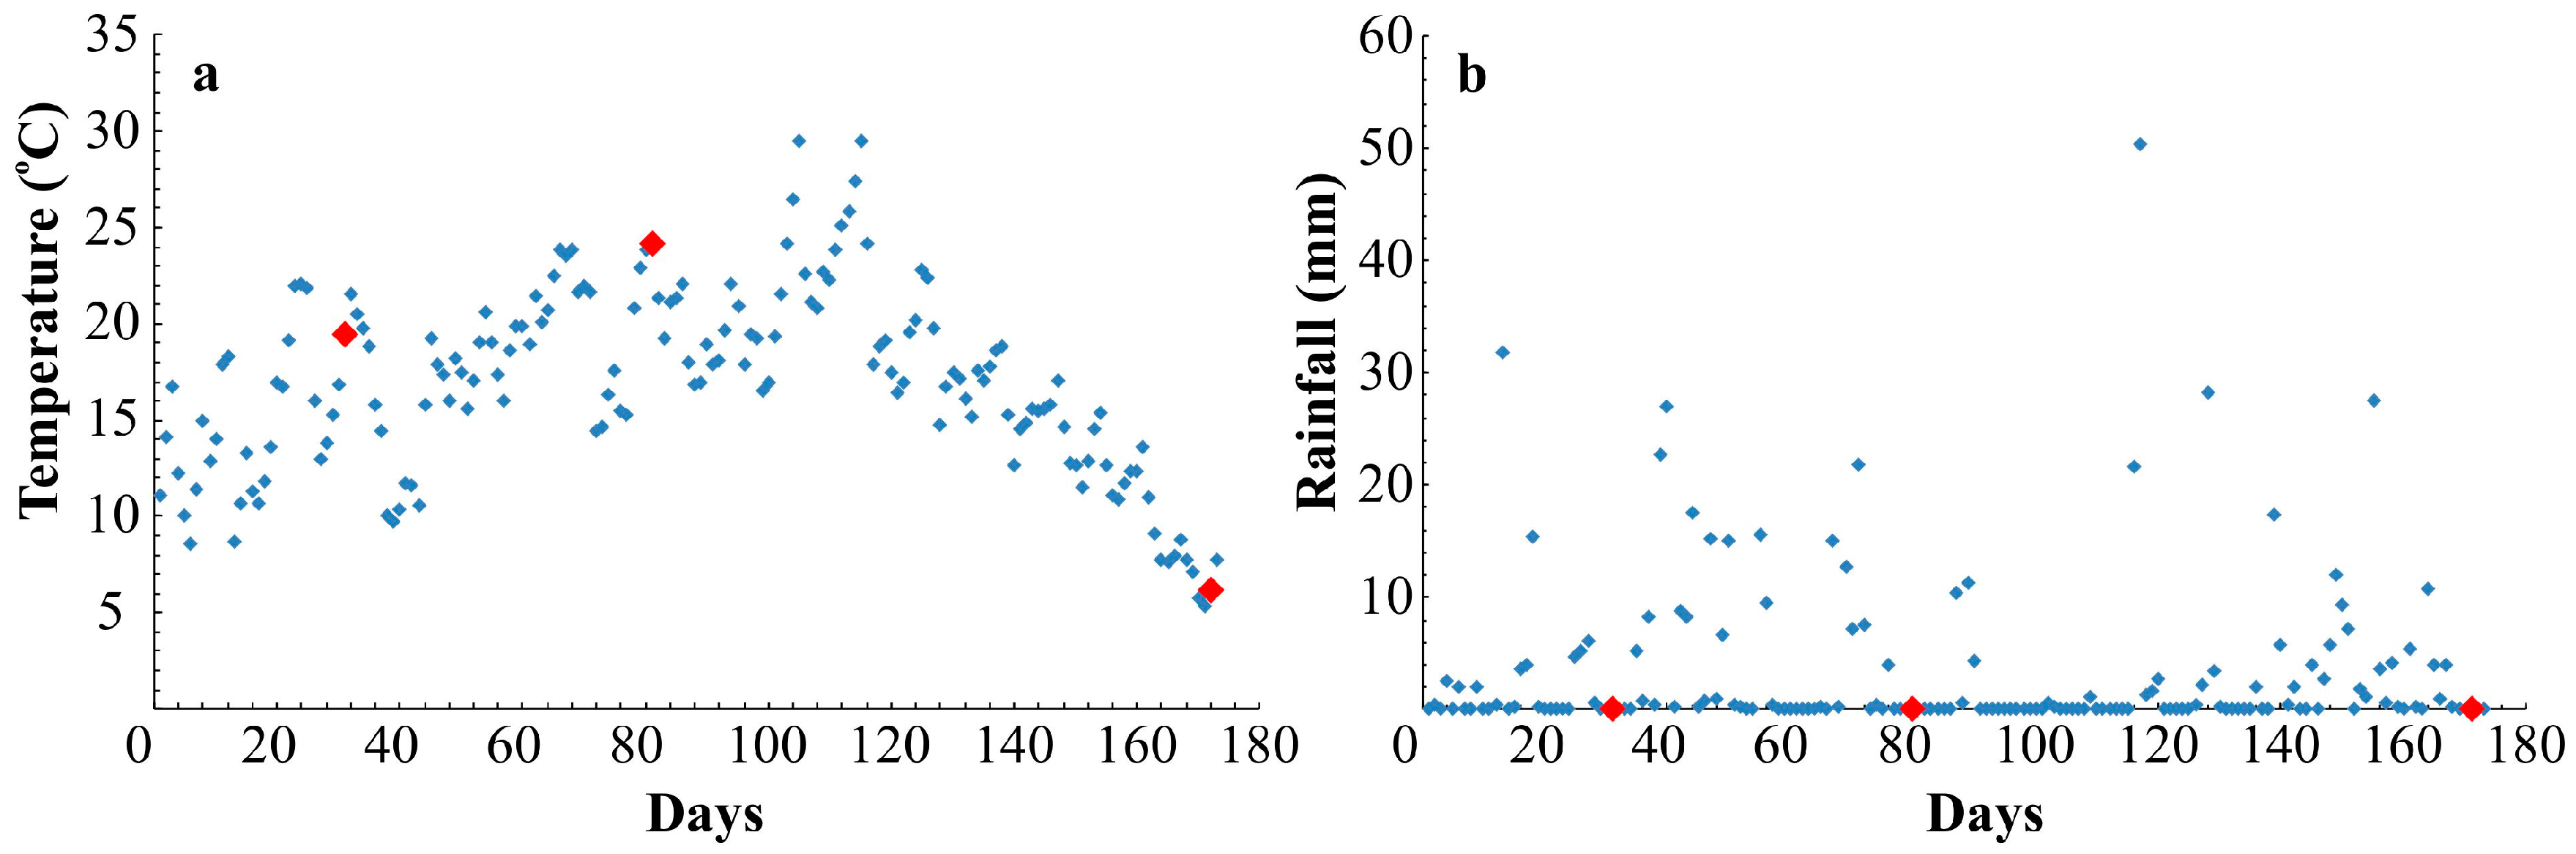
2.2. Sample Collection and Laboratory Analysis

The water samples were collected with a Teflon bucket, their pH and electrical conductivity (EC) were measured using a glass electrode and a Handylab pH/LF 12 pH meter (Schott, Mainz, Germany). The water samples were then filtered through a 0.45 μm filter, poured into plastic containers, cooled to 2 °C and transported to the laboratory. Directly afterwards in the laboratory, the following parameters were measured: concentrations of ammonium ions (NH4+), nitrate ions (NO3), phosphates (PO43−), sulphates (SO42−), total organic carbon (TOC) and chemical oxygen demand (COD) by the spectrophotometric method using DR-6000 UV-VIS equipment (Hach Lange, Loveland, CO, USA), chlorides (Cl) using the Mohr method [18], and heavy metals (Cu, Ni, Pb and Zn). The total concentrations of the analysed heavy metals were determined by means of atomic absorption spectrometry (AAS) using an iCE-3000 spectrometer (Thermo Science, Waltham, MA, USA) in an air-acetylene flame. All chemical analyses were made in three repetitions and averaged values were used in further calculations. The test results were analysed using XLSTAT statistical software for Microsoft Excel.
All standards, reagent solutions and samples were kept in polyethylene containers. All plastic and glassware was washed at least three times with deionised water, soaked in HNO3, again rinsed in deionised water and finally oven dried. Standard metal solutions (1000 mg/L) were purchased from Merck (Darmstadt, Germany). All reagents were of analytical reagent grade unless otherwise stated. Double deionised water (Milli-Q Millipore, Darmstadt, Germany) was used for all dilutions.

3. Results and Discussion

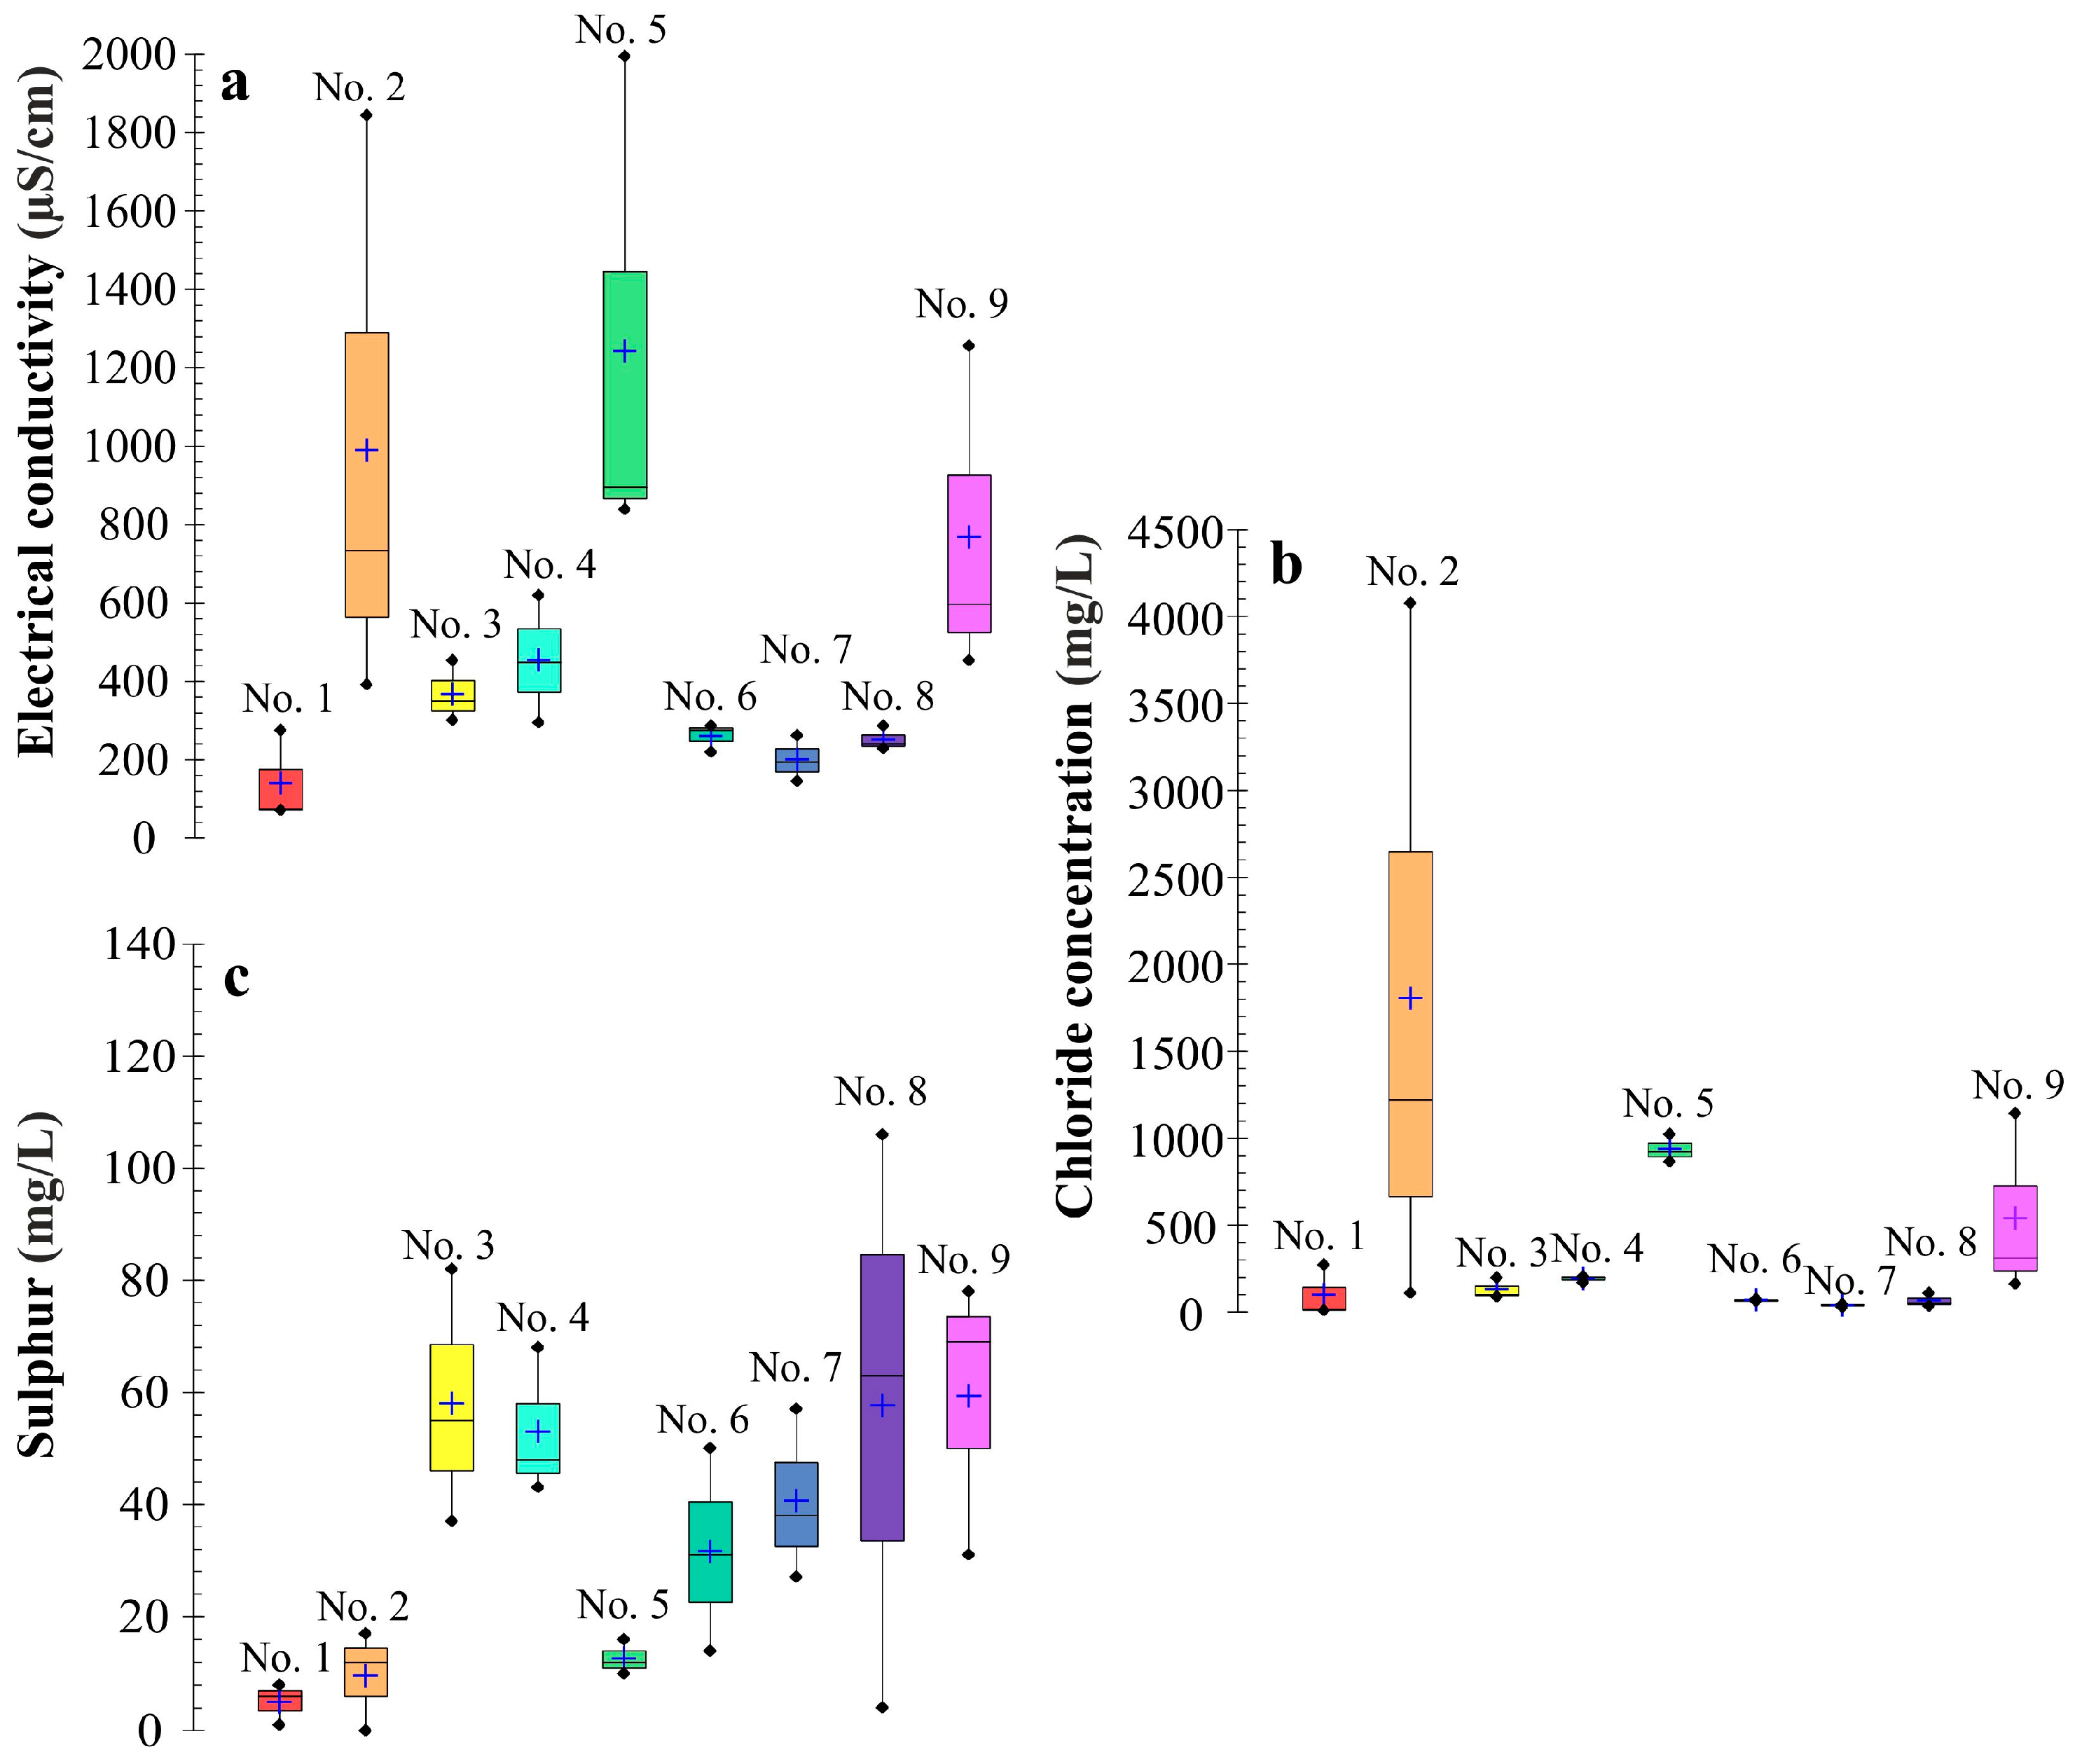
3.1. Indicators Characterizing the Salinity

Indicators characterizing the salinity of surface water, including that from artificial reservoirs shedding road runoff water, are electrical conductivity and the concentration of chlorides and sulphates. Moreover, salinity can also be expressed in ppt units when dissolved substances, total water hardness and concentrations of calcium and magnesium are additionally included.
The minimal, maximal, average and median values of electrical conductivity and chloride concentration (Figure 3) displayed high variability among the analysed points. There was also a strict correlation between these parameters, which was in accordance with existing knowledge [19,20,21]. The measured values of electrical conductivity were between 74.2 μS/cm and 1994 μS/cm, and the chloride concentration was between 7.80 mg/L and 4077 mg/L. The highest EC values and chloride concentrations were noted in water samples collected from sampling points Nos. 2 (ditch), 5 (pond) and 9 (reservoir). In these points water was of unsatisfactory quality, because the EC values exceeded the boundary values for the second class of water quality (≤1500 μS/cm), according to the Regulation of the Minister of the Environment of 9 November 2014, establishing the way of classifying the state of uniform parts of surface waters and environmental quality standards for priority substances [22]. The lowest EC values were observed in a water sample collected from reservoir No. 1. It should also be noted that the analysed points located in Warsaw were, to a various degree, characterised by EC and chloride concentration variability in the measurement period. The highest EC variability, from 391 μS/cm to 1994 μS/cm, occurred in samples collected from ditch No. 2 and pond No. 5, whereas the lowest occurred in samples from reservoir No. 6 and pond No. 8. This may be caused by the presence of vegetation enhancing the self-purification of runoff water in points No. 2 (ditch) and 5 (pond). In the case of the chloride concentration, the highest variability was noted in the water from ditch No. 2 and reservoir No. 9, and the lowest was noted in reservoir No. 7. EC values of water from reservoirs Nos. 1, 6, 7 and pond No. 8 classified the points in the first class of water purity. Increased EC values and chloride concentrations could be related to the activities conducted on the roads during winter maintenance. Water samples from reservoir No. 4 (lake) were collected in close vicinity of the outflow of a tributary carrying runoff water from country road No. 79 linking Central Poland with southeastern Poland. The results indicated the accumulation of pollution in the reservoir, because both the chloride concentration and the electrical conductivity attained higher values than in the tributary. This is highly probable due to the fact that chlorides do not undergo biochemical and chemical transformations [23]. The highest concentration of chlorides in samples collected from ditch No. 2 (4077 mg/L) could have been caused by the direct vicinity of a large parking lot near the shopping center. During the entire measurement period, the contents of chlorides in pond No. 5 were higher than the permissible concentrations determined in the regulation [24] (≤300 mg/L), although decreasing concentration values were observed. The pond is an element of the country road drainage system, which is part of an international communication route E30 from Ireland to Russia, and plays a role in the biological treatment system. However, it did not eliminate the hazard caused by the application of de-icing media. The concentration varied only slightly because stagnating waters exchange with the environment only through infiltration. In general, the results point to a decreasing trend in the chloride concentration in water of the analysed points in the measurement period, which was related to the presence of the pollution source only during the winter months.
The highest concentration of sulphates (106 mg SO4/L) occurred in pond No. 8, in a sample collected in the first collection interval (Figure 3). Likewise, the largest variability of the sulphate concentration during the measurements was observed at this point. According to the accepted scale, the water quality was good (second class of purity). In water samples collected from the remaining points, the content of sulphates was in the range for very high quality water (≤150 mg/L). Therefore, the concentrations of sulphates did not have a significant influence on the value of specific conductivity. The lowest variability of sulphate concentrations was observed in reservoir No. 1 and pond No. 5, being part of the biological treatment system. The source of sulphates may be deposition from the atmosphere polluted by sulphur oxides, and abrasion of tires and brake shields [25]. A decreasing trend can be observed when analysing the sulphate concentration. The only exception was reservoir No. 1, for which the concentration in samples collected in July was the highest of all three measurements conducted at this point. This could be caused by a smaller emission of sulphur compounds to the atmosphere in the non-heated season and the resulting lower deposition with rainfall. According to international reports, the concentrations of sulphates in runoff water noted in Australia, Greece, Korea, Germany and Poland were between 1.22 mg/L and 29.20 mg/L [26,27,28,29,30]. The concentrations of sulphates in water from points Nos. 1 (reservoir), 2 (ditch) and 5 (pond) were within this range, whereas in the remaining points the values were even three times higher.

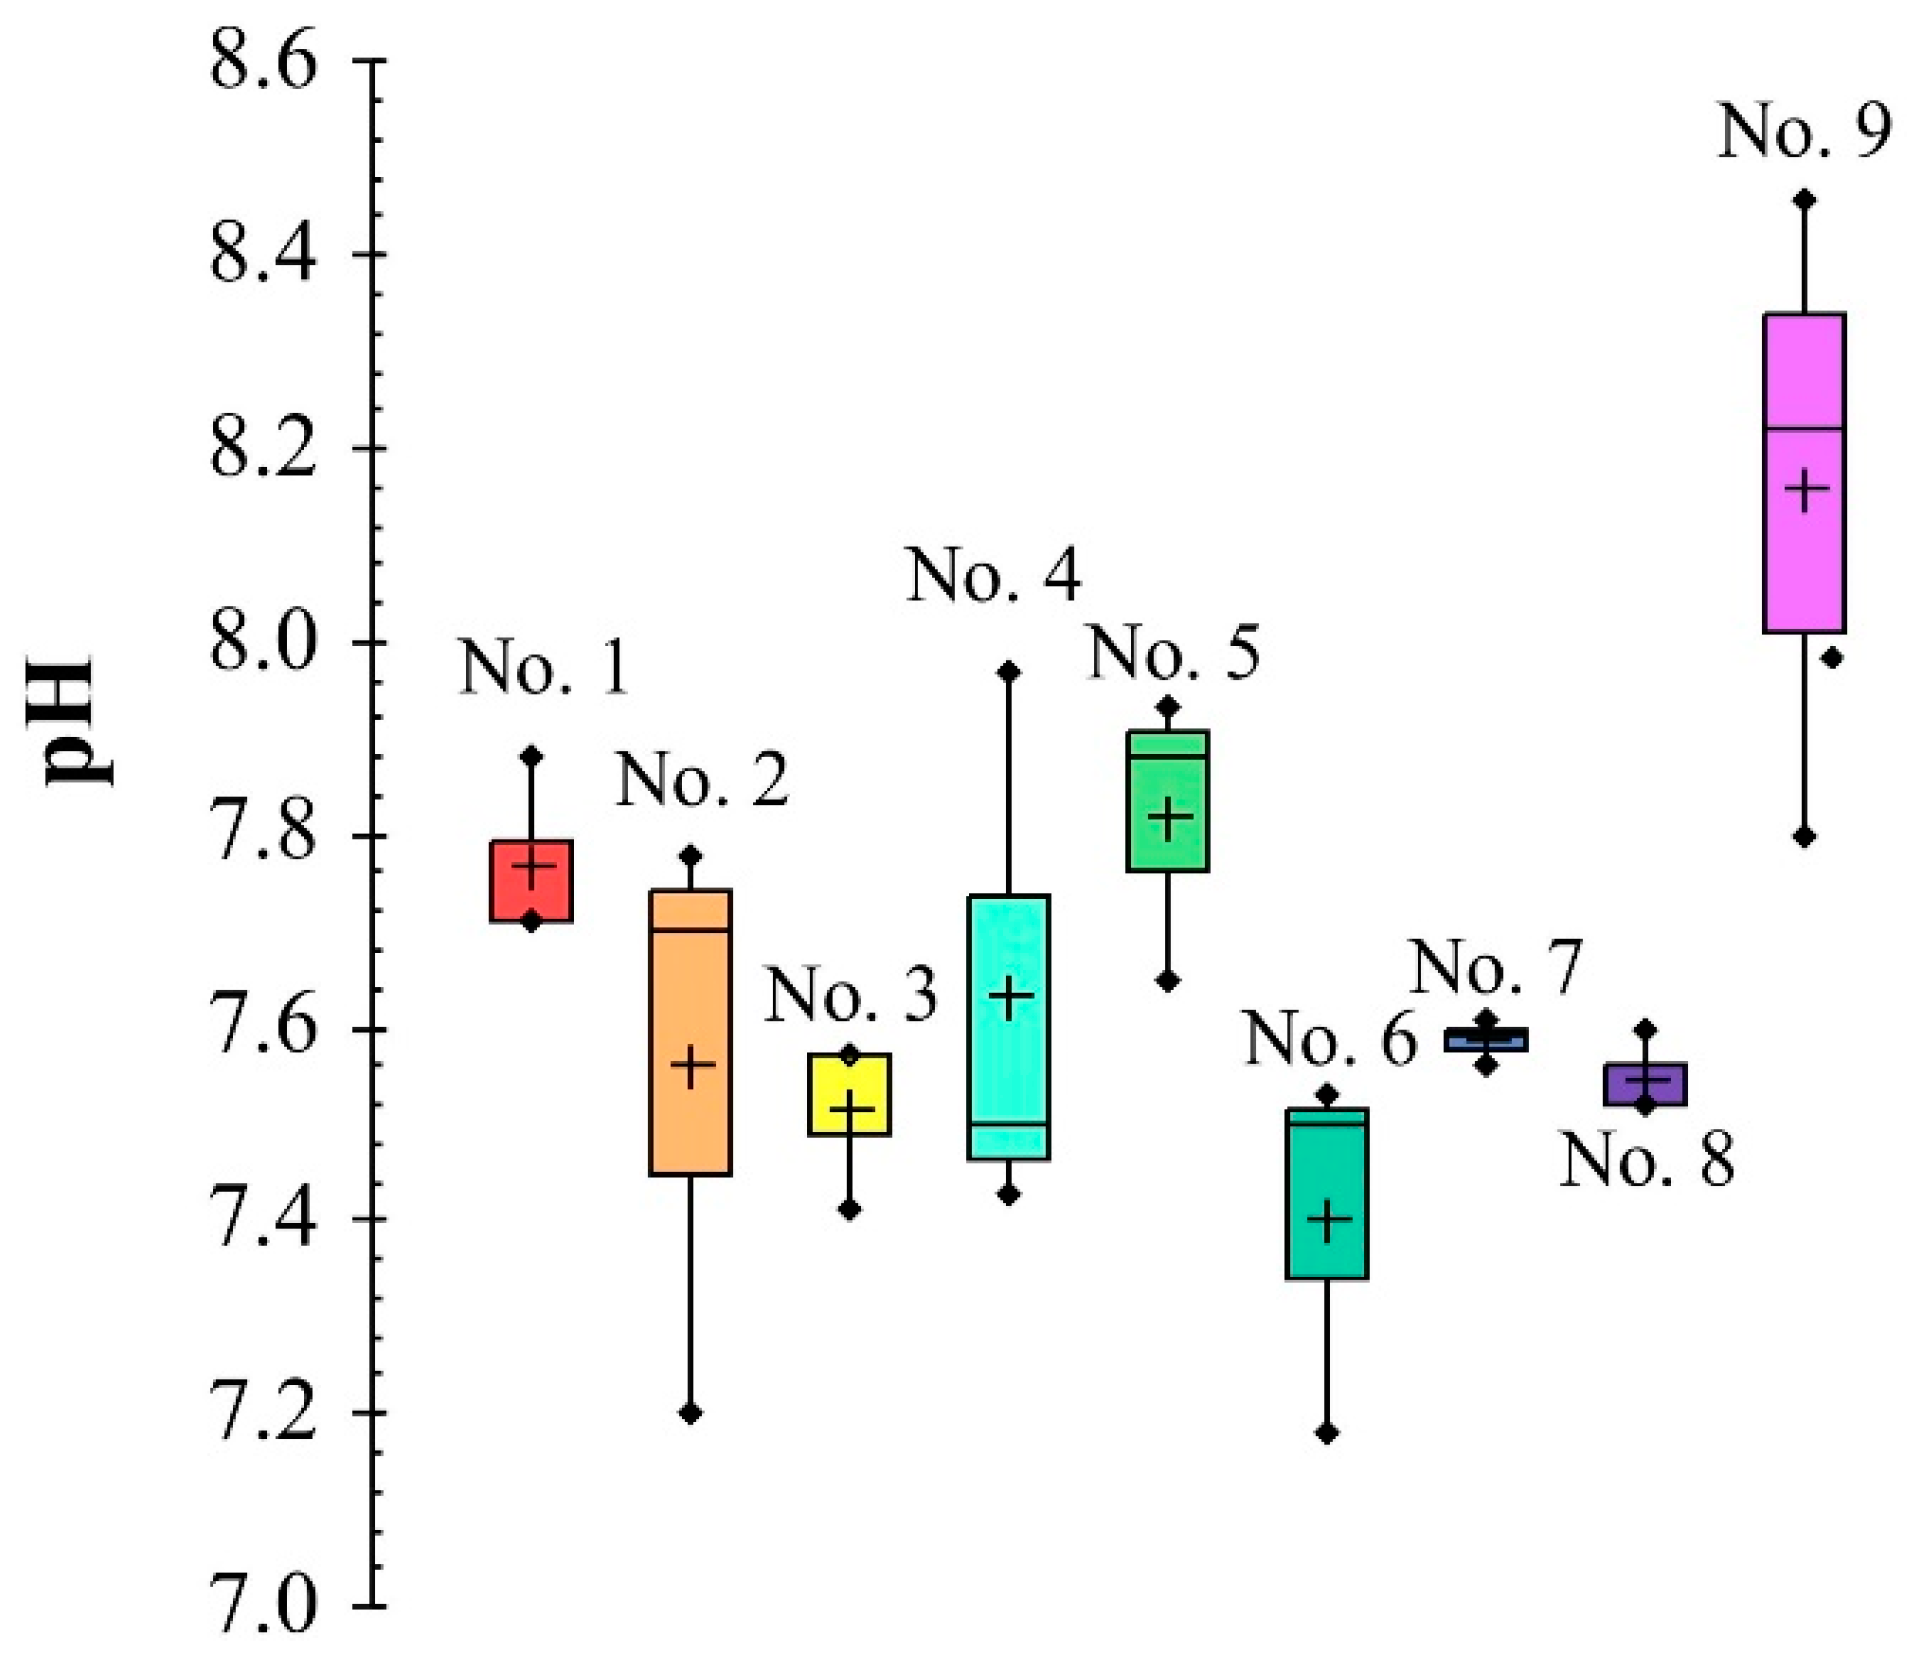
3.2. Indicator Characterizing the Acidification

In Poland, rainwater is typically acidic, but due to the character and type of substratum and contact with pollutants, the pH of the runoff water attained values between 7.18 and 8.46 (Figure 4). The highest value of pH was noted in water collected in October from reservoir No. 9, which collects runoff water from the road that is a part of Via Baltica. The lowest pH value was noted in the same interval in reservoir No. 6 located near the crossway of the local road Warszawa-Puławy with the country road connecting Ireland with Russia. All pH values indicated a poorly alkaline pH of the analysed water. The pH values are partially related to the nature of the transported particles in the suspension, significantly inorganic and alkaline [31].

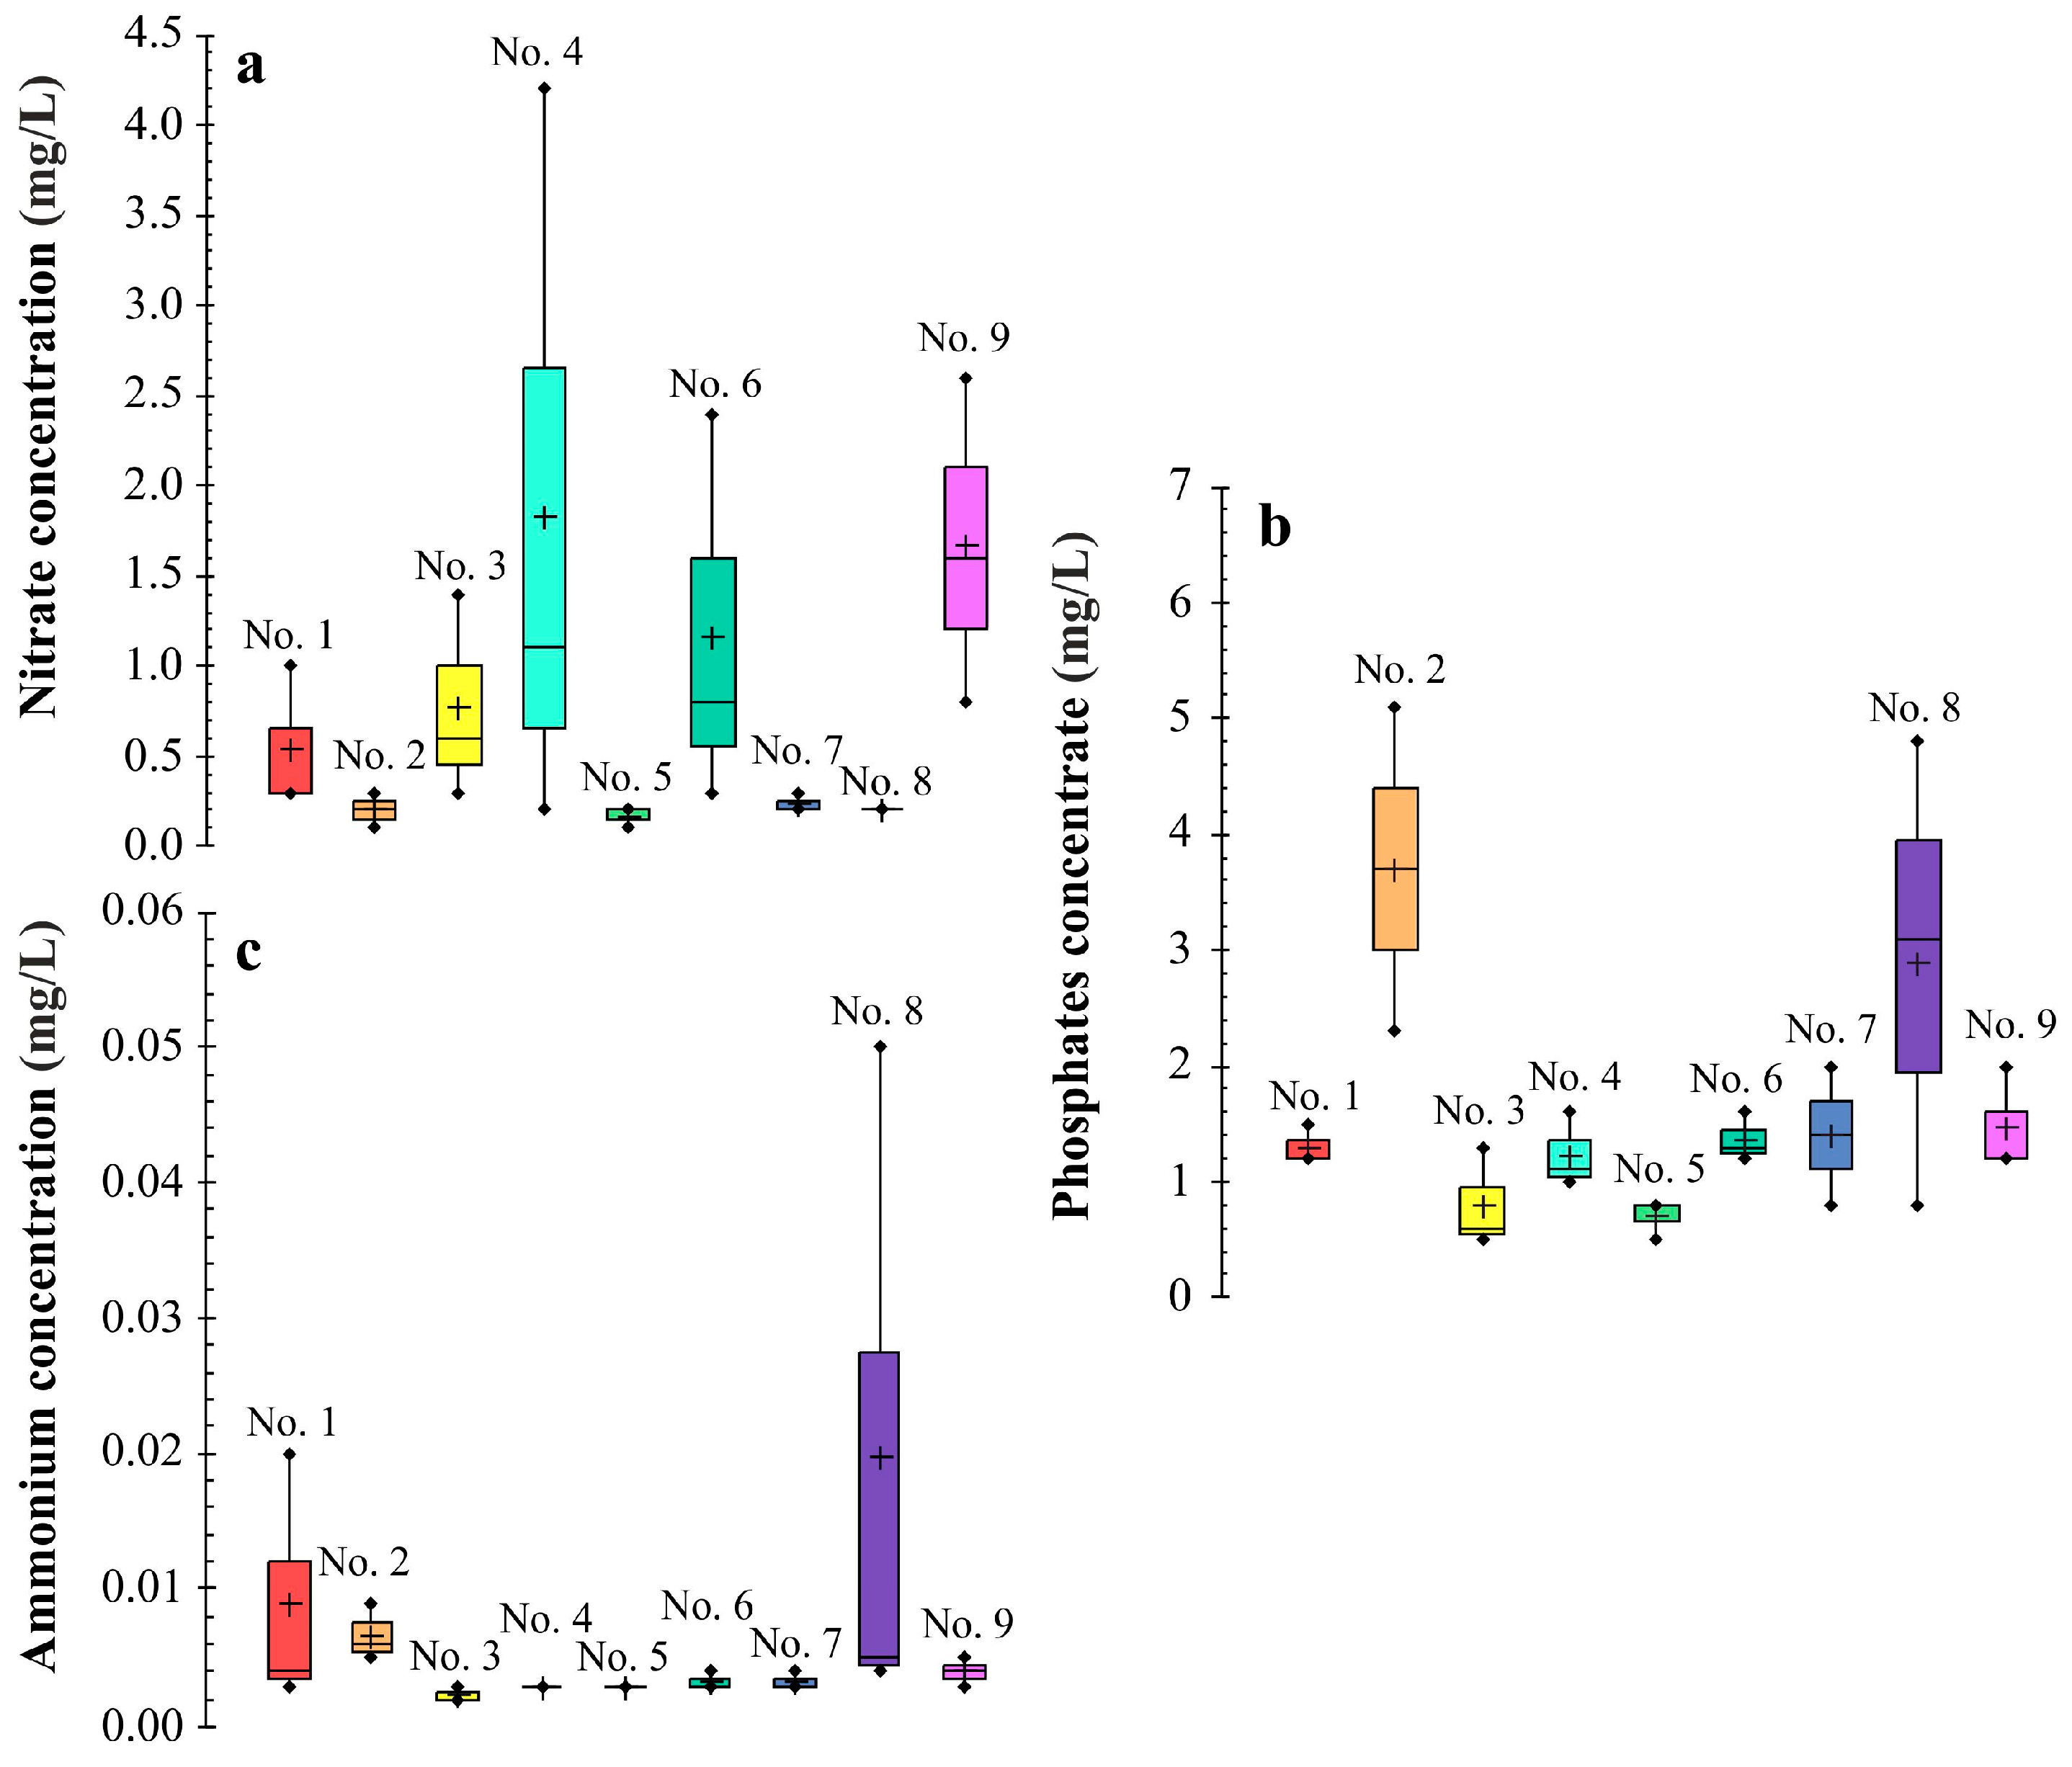
3.3. Indicators Characterizing the Nutrient Conditions
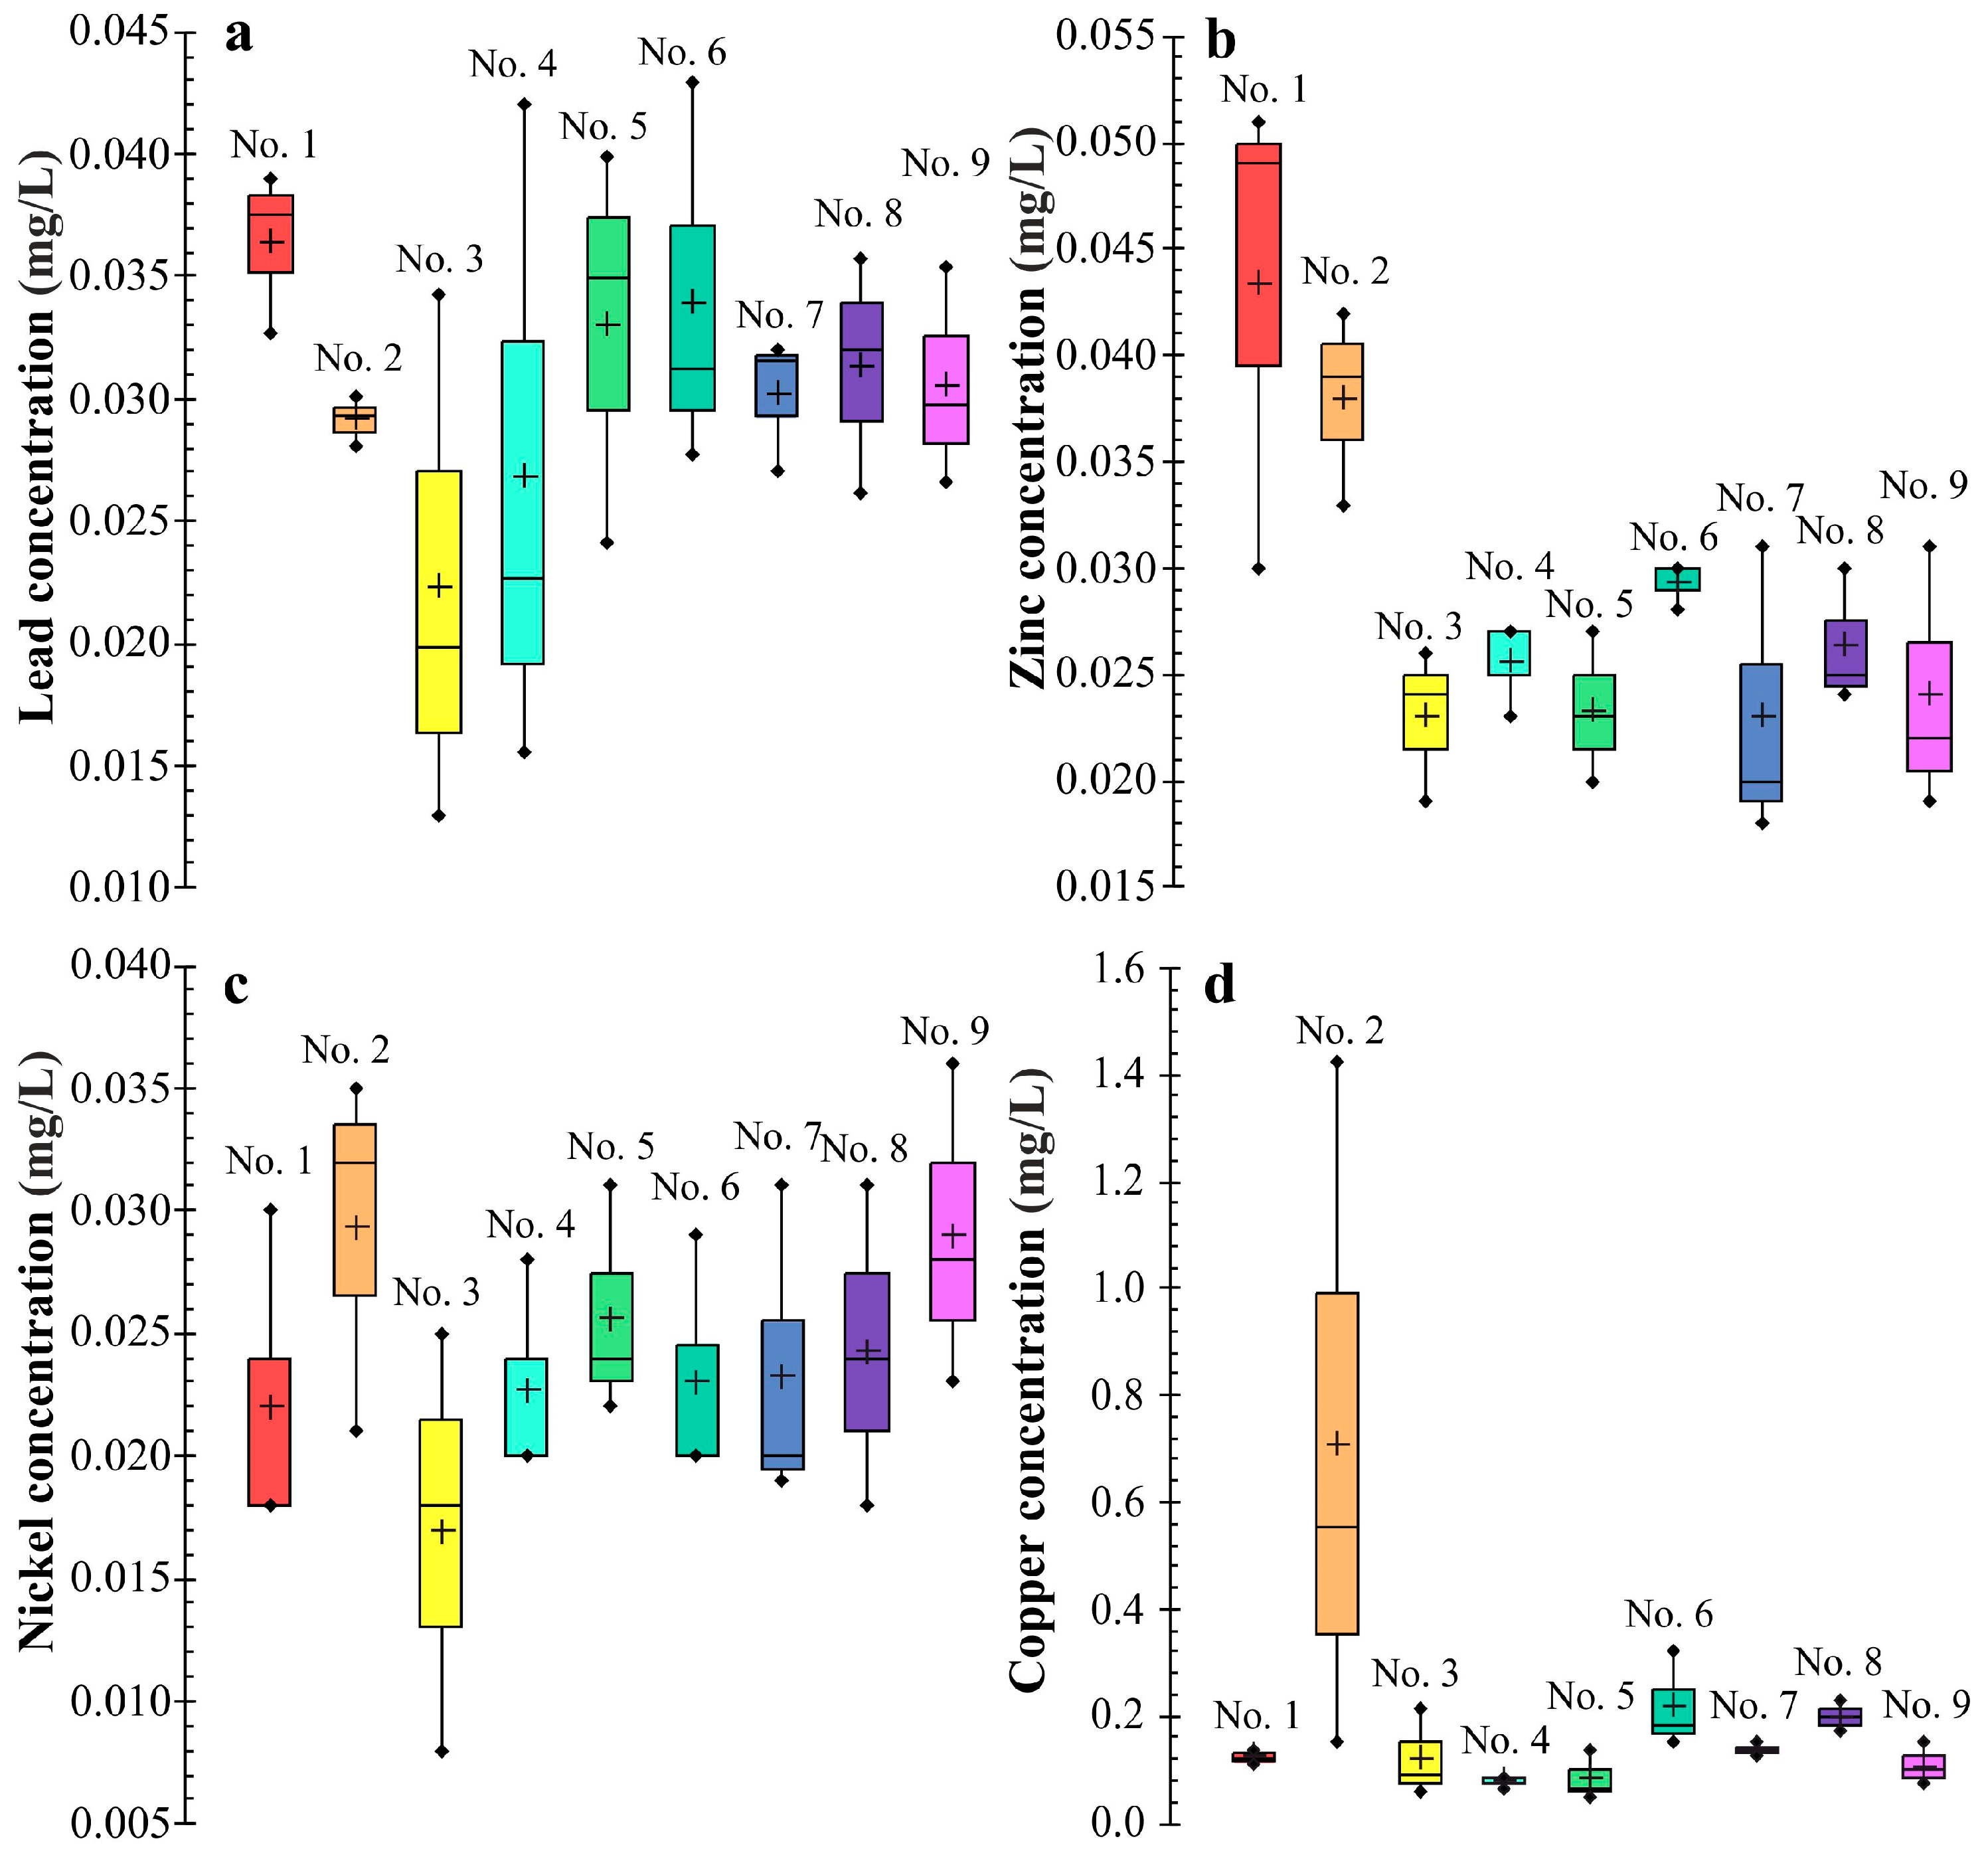
Low concentrations of the analysed forms of nitrogen, nitrate ions and ammonium ions were observed throughout the entire measurement period (Figure 5). The content of these components in the water samples classified the analysed points to the first class of water purity, which would indicate the lack of anthropogenic impact. The highest concentrations of nitrates were noted in reservoirs No. 4 (4.2 mg NO3/L) and No. 6 (2.4 mg NO3/L), in which, due to the natural character of these reservoirs, the source of these compounds could be dead plant remains, and in reservoir No. 9, in which the dominating source of nitrogen compounds could be deposition of nitrogen oxides from fuel combustion [17]. In the case of reservoir No. 4 (lake), an additional source of nitrates could be the application of artificial fertilizers in the surrounding fields. At the remaining points, nitrates attain values lower than 1.4 mg NO3/L. The obtained values were within the nitrate concentrations published in foreign references (from 0.01 mg NO3/L to 15.00 mg NO3/L) [32,33,34].
With regard to the concentration of ammonium nitrogen, each of the reservoirs was in the first class of water quality. The highest value was noted in reservoir No. 8. Ammonium nitrogen could be derived there from the decomposition of humus compounds. The obtained values were much lower from those presented in published reports [35,36].
Analysis of Figure 5 showed that the boundary concentrations of phosphates in the fourth class of water purity have been exceeded in samples from almost all analysed points, with the exception of the pond located near the country road between Ireland and Russia (point No. 5—pond). In the analysed points, with regard to the content of phosphates, water reached the fifth class of purity. Increased concentrations of phosphates in pond No. 8 could also be caused by the decomposition of organic matter. Nolde [29] determined the phosphate concentration in runoff water in Berlin at the level of 0.98 mg/L, whereas Huston et al. [37] noted 0.1 mg/L in runoff waters in Brisbane (Australia).

3.4. Heavy Metals

Abrasive products of tires, car combustion gases, the fall of industrial aerosols and dust are potential sources of heavy metals [38,39]. The concentrations of the analysed heavy metals varied in the measurement period in the following ranges: from 0.049 mg Cu/L to 1.426 mg Cu/L, from 0.008 mg Ni/L to 0.036 mg Ni/L, from 0.013 mg Pb/L to 0.043 mg Pb/L, and from 0.018 mg Zn/L to 0.051 mg Zn/L (Figure 6). The largest variability of the lead concentration was observed for measurement points Nos. 3 (ditch) and 4 (lake). Water from the ditch draining runoff from a road with high traffic density (No. 3) also indicated a high variability of nickel concentration, whereas the concentration of zinc varied in the widest range in reservoir No. 1, and that of copper in the ditch draining runoff from the road and parking lot (No. 2). Lower concentrations of heavy metals in the analysed points may be linked with equipping the system in runoff wells, in which heavy metals are retained with the suspension [40]. This relationship can be observed in pond No. 8 and reservoir No. 9. The concentrations of copper in pond No. 8, without runoff wells, were higher than those in reservoir No. 9, from which every runoff is directed to the runoff wells. The concentration was also influenced by the traffic density on the roads along which the analysed points accept the runoff water. The concentration of copper in reservoir No. 7, adjacent to a road with a traffic density of 120,000 cars per 24 h, was higher than the concentration in pond No. 5, where the traffic density is half this value. Zinc, as an indicator of water quality from the group of elements that is particularly hazardous to the natural environment [41], did not exceed the boundary value (1 mg/L) at any of the analysed points, whereas copper, belonging to the same group of elements, did not exceed the boundary value (0.05 mg/L) only in one sample collected in May from pond No. 5. Moreover, the concentrations of heavy metals did not exceed the boundary values for industrial sewage introduced to water or soil, which for Ni and Pb were 0.5 mg/L, and for Zn was 2 mg/L [22]. The permissible values for copper (0.5 mg/L) determined in the Regulation of the Minister of the Environment [24] were exceeded almost three times. The presence of such concentrations could have been additionally caused by the uncontrolled inflow of runoff from a motor vehicle diagnostic station, from a petrol station or from the parking lot into the ditch. These values can be compared with values obtained for road runoff in similar environments [31,42].

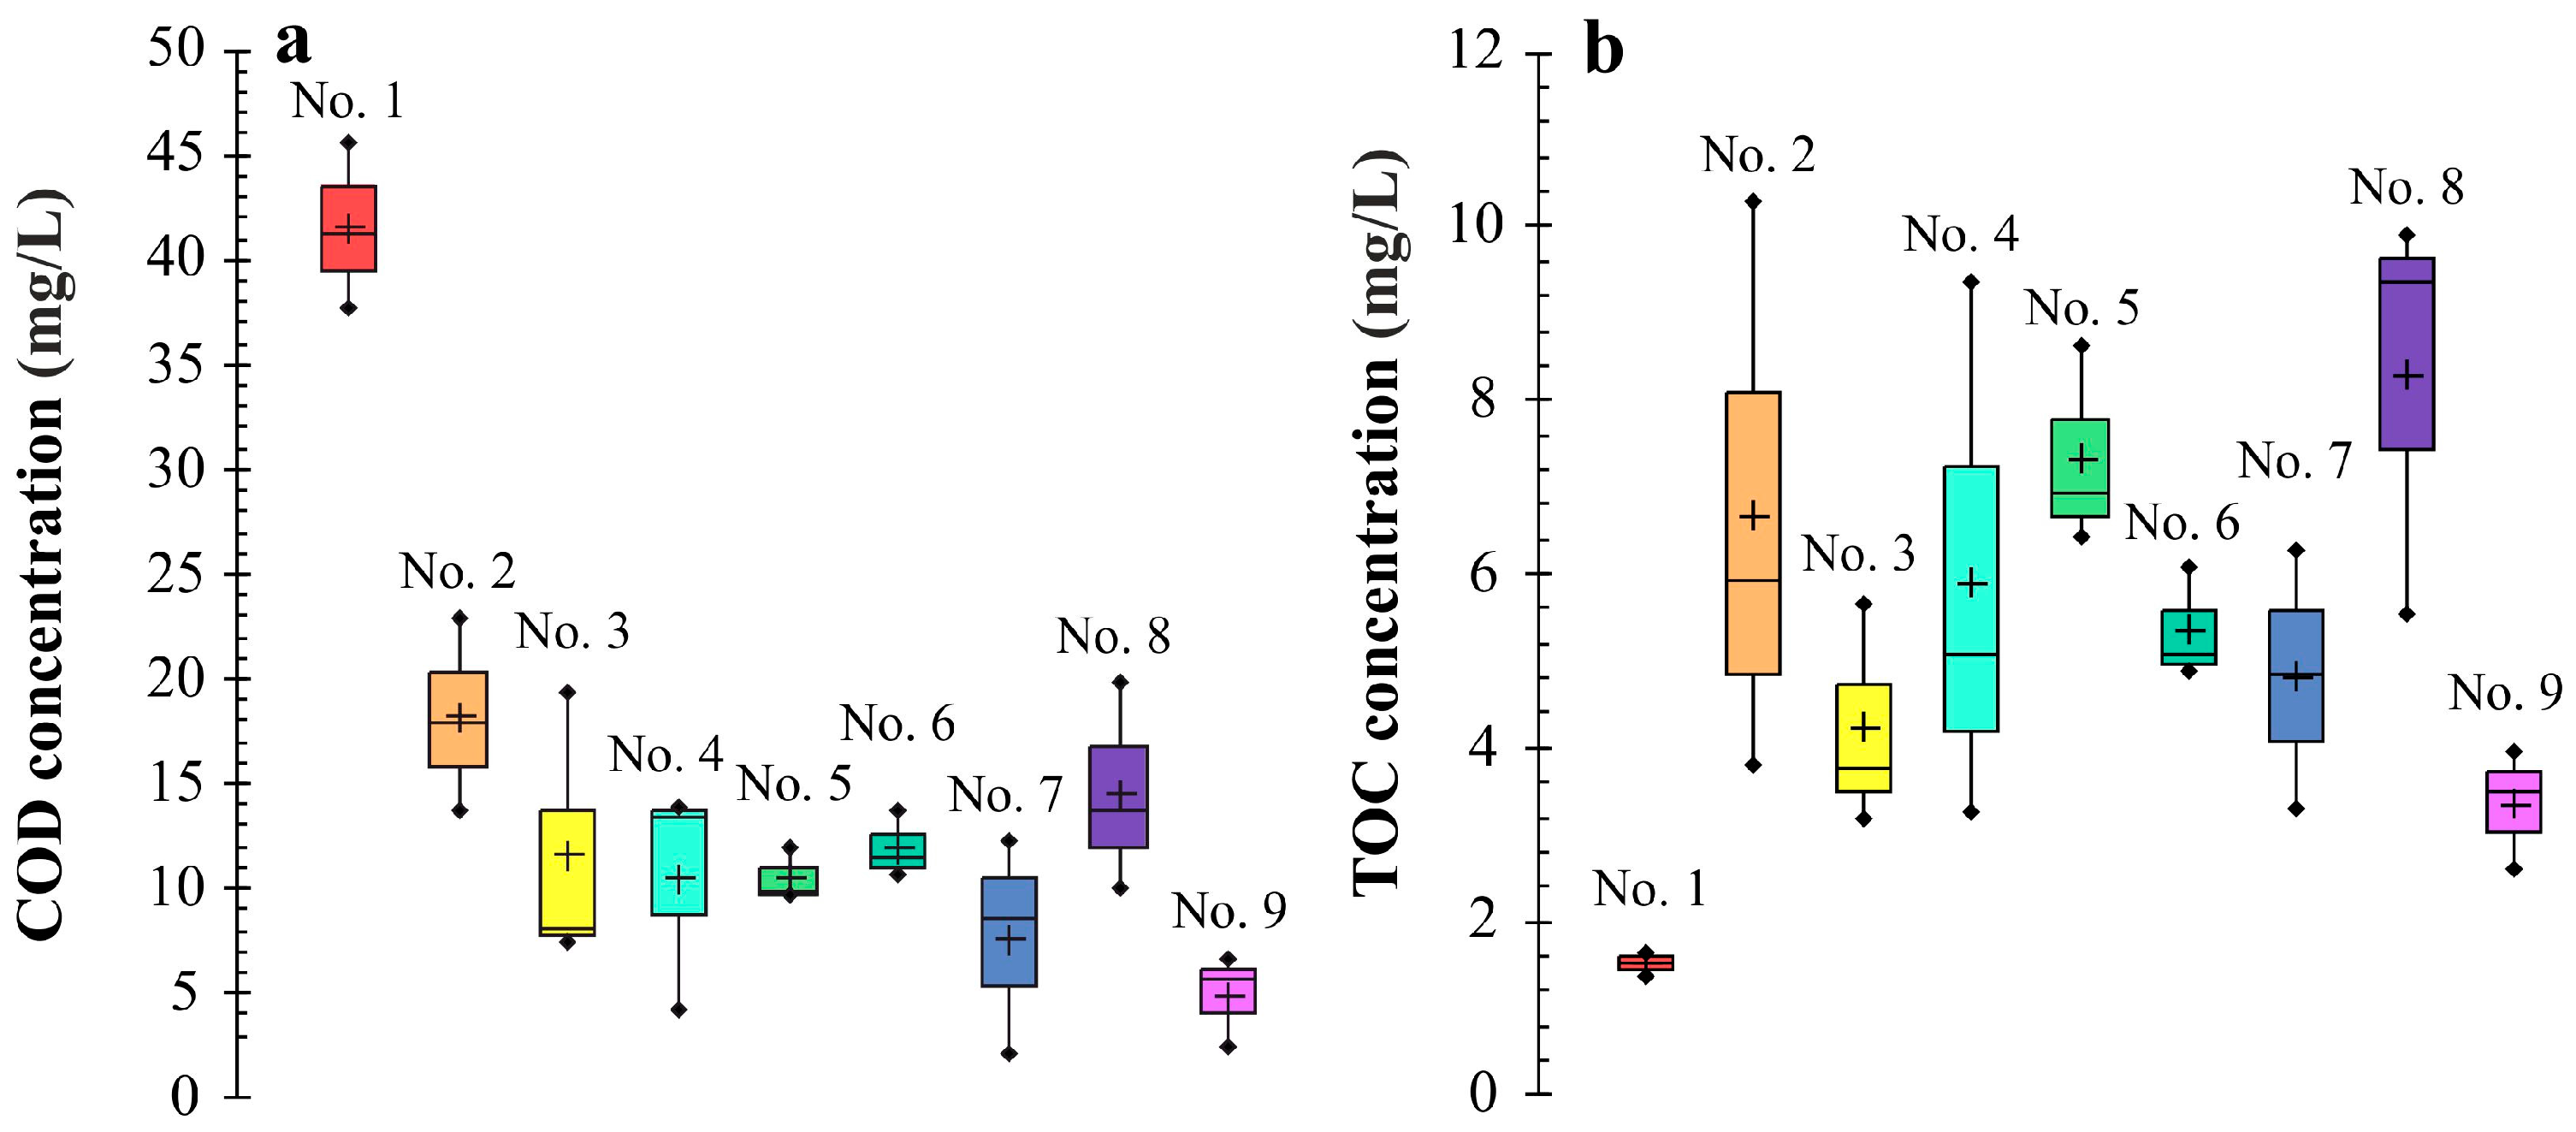
3.5. Indicators Characterizing the Organic Contamination

Water collected from all analysed points was characterised by similar values of COD at an average value of 12.14 mg O2/L (Figure 7). The only exceptions were points Nos. 1 (reservoir) and 9 (reservoir), in which the average concentrations were 41.53 mg O2/L and 4.94 mg O2/L, respectively. Likewise, the TOC values (Figure 7) in samples from these points differed from the average values in the remaining analysed points (6.08 mg/L). The maximal concentration of TOC was found in ditch No. 2 (10.30 mg/L), and the minimal concentration was found in reservoir No. 1 (1.36 mg/L).

3.6. Correlations between Evaluated Parameters

The correlation analysis showed that the concentrations of nickel and the values of TOC in analysed samples were significantly correlated with the chloride ion content and electrical conductivity (Table 2). Moreover, the sulphur concentration has a negative significant correlation with the zinc and lead concentrations, and the copper content has a positive correlation with the chloride ion and phosphates contents.

4. Conclusions

This study characterised the quality of water samples from points that are part of a drainage system of communication roads, i.e., ditches, retention reservoirs and wetlands. The analysed points located in the Warsaw agglomeration were, to a variable degree, characterised by the variability of the studied parameters during the measurement period. The highest values of EC and Cl were noted in sampling points Nos. 2 (ditch), 5 (pond) and 9 (reservoir), in which the EC value exceeded the boundary values for the second class of water quality (≤1500 μS/cm). In water samples collected from the points, the content of sulphates was within the range for water of very good quality (≤150 mg/L), with the exception of pond No. 8, in which the highest concentration of sulphates was noted. The pH values point to a slightly alkaline character of the analysed water. During the entire measurement period, low concentrations of nitrogen forms, nitrite ions and ammonium ions were observed. The content of these components in the water samples classified the analysed waters to the first class of purity. The boundary concentrations of phosphates for the fourth class of purity were exceeded in samples from all analysed points, with the exception of the pond (point No. 5). Water from point No. 3 (ditch) showed a high variability of Ni values, the concentration of Zn varied in the widest range in reservoir No. 1, and the concentration of Cu varied in the widest range in the ditch draining runoff water from the road and the parking lot (point No. 2). The concentrations of Ni, Pb and Zn did not exceed the boundary values for industrial sewage introduced to water or to soil. Only in the case of Cu the concentration exceeded the permissible values (0.5 mg/L) as determined in the Regulation of the Minister of the Environment almost three times.

Author Contributions

Joanna Fronczyk and Maja Radziemska conceived and designed the experiments analysed the data, contributed reagents, materials, analysis tools. Joanna Fronczyk and Marcin Bazydło performed the chemical analysis, Piotr Dynowski and Zbigniew Mazur prepared figures.

Conflicts of Interest

The authors declare no conflict of interest.

References

  1. Radziemska, M.; Fronczyk, J. Level and Contamination Assessment of Soil along an Expressway in an Ecologically Valuable Area, Central Poland. Int. J. Environ. Res. Public Health 2015, 12, 13372–13387. [Google Scholar] [CrossRef] [PubMed]
  2. Mazur, Z.; Radziemska, M.; Fronczyk, J.; Jeznach, J. Heavy metal accumulation in bioindicators of pollution in urban areas in northeastern Poland. Fresenius Environ. Bull. 2015, 24, 216–223. [Google Scholar]
  3. Hemmati, R.; Saboori, H.; Jirdehi, M.A. Multistage generation expansion planning incorporating large scale energy storage systems and environmental pollution. Renew. Energy 2016, 97, 636–645. [Google Scholar] [CrossRef]
  4. Chen, W.Y. Environmental externalities of urban river pollution and restoration: A hedonic analysis in Guangzhou (China). Landsc. Urban Plan. 2017, 157, 170–179. [Google Scholar] [CrossRef]
  5. Botsou, F.; Sungur, A.; Kelepertzis, E.; Soylak, M. Insights into the chemical partitioning of trace metals in roadside and off-road agricultural soils along two major highways in Attica’s region, Greece. Ecotoxicol. Environ. Saf. 2016, 132, 101–110. [Google Scholar] [CrossRef] [PubMed]
  6. Shabbir, Y.; Khokhar, M.F.; Shaiganfar, R.; Wagner, T. Spatial variance and assessment of nitrogen dioxide pollution in major cities of Pakistan along N5-Highway. J. Environ. Sci. 2016, 43, 4–14. [Google Scholar] [CrossRef] [PubMed]
  7. Rivett, M.O.; Cuthbert, M.O.; Gamble, R.; Connon, L.E.; Pearson, A.; Shepley, M.G.; Davis, J. Highway deicing salt dynamic runoff to surface water and subsequent infiltration to groundwater during severe UK winters. Sci. Total Environ. 2016, 565, 324–338. [Google Scholar] [CrossRef] [PubMed]
  8. Drake, J.; Bradford, A.; Seters, T.V. Stormwater quality of spring-summer-fall effluent from three partial-infiltration permeable pavement systems and conventional asphalt pavements. J. Environ. Manag. 2014, 139, 69–79. [Google Scholar] [CrossRef] [PubMed]
  9. Fronczyk, J.; Radziemska, M.; Mazur, Z. Copper removal from contaminated using natural and engineered limestone sand in permeable reactive barriers. Fresenius Environ. Bull. 2015, 24, 228–234. [Google Scholar]
  10. Fronczyk, J.; Radziemska, M. Kinetic studies of copper ions removal from aqueous solutions using various biosorbents feeling permeable reactive barriers (PRBs). Fresenius Environ. Bull. 2014, 23, 3384–3390. [Google Scholar]
  11. PN-S-02204. Vehicle Roads. Water Drainage. 1997. (In Polish)Available online: http://sklep.pkn.pl/pn-s-02204-1997p.html (accessed on 27 September 2016).
  12. Wilkinson, J.L.; Swinden, J.; Hooda, P.S.; Barker, J.; Barton, S. Markers of anthropogenic contamination: A validated method for quantification of pharmaceuticals, illicit drug metabolites, perfluorinated compounds, and plasticisers in sewage treatment effluent and rain runoff. Chemosphere 2016, 159, 638–646. [Google Scholar] [CrossRef] [PubMed]
  13. Hilliges, R.; Schriewer, A.; Helmreich, B. A three-stage treatment system for highly polluted urban road runoff. J. Environ. Manag. 2013, 128, 306–312. [Google Scholar] [CrossRef] [PubMed]
  14. Sabouri, F.; Gharabaghi, B.; Sattar, A.M.A.; Thompson, A.M. Event-based stormwater management pond runoff temperature model. J. Hydrol. 2016, 540, 306–316. [Google Scholar] [CrossRef]
  15. Saraswat, C.; Kumar, P.; Mishra, B.K. Assessment of stormwater runoff management practices and governance under climate change and urbanization: An analysis of Bangkok, Hanoi and Tokyo. Environ. Sci. Policy 2016, 64, 101–117. [Google Scholar] [CrossRef]
  16. Castro-Fresno, D.; Andrés-Valeri, V.C.; Sañudo-Fontaneda, L.A.; Rodriguez-Hernandez, J. Sustainable drainage practices in Spain, specially focused on pervious pavements. Water 2013, 5, 67–93. [Google Scholar] [CrossRef]
  17. Li, J.; Liang, Z.; Gao, Z.; Li, Y. Experiment and simulation of the purification effects of multi-level series constructed wetlands on urban surface runoff. Ecol. Eng. 2016, 91, 74–84. [Google Scholar] [CrossRef]
  18. PN-ISO 9297. Water Quality. Determination of Chloride. Silver Nitrate Titration with Chromate Indicator (Mohr’s Method). 1994. (In Polish)Available online: http://sklep.pkn.pl/pn-iso-9297-1994p.html (accessed on 27 September 2016).
  19. Suaire, R.; Durickovic, I.; Framont-Terrasse, L.; Leblain, J.-Y.; De Rouck, A.-C.; Simonnot, M.-O. Phytoextraction of Na+ and Cl by Atriplex halimus L. and Atriplex hortensis L.: A promising solution for remediation of road runoff contaminated with deicing salts. Ecol. Eng. 2016, 94, 182–189. [Google Scholar] [CrossRef]
  20. Mahanty, M.M.; Mohanty, P.K.; Pattnaik, A.K.; Panda, U.S.; Pradhan, S.; Samal, R.N. Hydrodynamics, temperature/salinity variability and residence time in the Chilika lagoon during dry and wet period: Measurement and modeling. Cont. Shelf Res. 2016, 125, 28–43. [Google Scholar] [CrossRef]
  21. Wychowaniak, D.; Zawadzki, Ł.; Lech, M. Application of column tests and electrical resistivity methods for leachate transport monitoring. Ann. Wars. Univ. Life Sci. 2015, 47, 237–247. [Google Scholar] [CrossRef]
  22. Journal of Laws 2014 pos. 1800, Regulation of the Minister of the Environment of 18 November 2014 on Conditions for the Introduction of Sewage into Water or Soil and on the List of Substances Particularly Harmful to the Water Environment. Available online: http://isap.sejm.gov.pl/DetailsServlet?id=WDU20140001800 (accessed on 27 September 2016).
  23. Kabata-Pendias, A. Behavioural properties of trace metals in soils. Appl. Geochem. 1993, 8, 3–9. [Google Scholar] [CrossRef]
  24. Journal of Laws 2014 pos. 1482, Regulation of the Minister of the Environment of 22 October 2014 Establishing the Way of Classifying the State of Uniform Parts of Surface Waters and Environmental Quality Standards for Priority Substances. Available online: http://isap.sejm.gov.pl/DetailsServlet?id=WDU20140001482 (accessed on 27 September 2016).
  25. Ohizumi, T.; Take, N.; Inomata, Y.; Yagoh, H.; Endo, T.; Takahashi, M.; Yanahara, K.; Kusakabe, M. Long-term variation of the source of sulfate deposition in a leeward area of Asian continent in view of sulfur isotopic composition. Atmos. Environ. 2016, 140, 42–51. [Google Scholar] [CrossRef]
  26. Gikas, G.D.; Tsihrintzis, V.A. Assessment of water quality of first-flush roof runoff and harvested rainwater. J. Hydrol. 2012, 466, 115–126. [Google Scholar] [CrossRef]
  27. Lee, J.Y.; Yang, J.-S.; Han, M.; Choi, J. Comparison of the microbiological and chemical characterization of harvested rainwater and reservoir water as alternative water resources. Sci. Total Environ. 2010, 408, 896–905. [Google Scholar] [CrossRef] [PubMed]
  28. Lee, J.Y.; Bak, G.; Han, M. Quality of roof-harvested rainwater—Comparison of different roofing materials. Environ. Pollut. 2012, 162, 422–429. [Google Scholar] [CrossRef] [PubMed]
  29. Nolde, E. Possibilities of rainwater utilisation in densely populated areas including precipitation runoffs from traffic surfaces. Desalination 2007, 215, 1–11. [Google Scholar] [CrossRef]
  30. Tsakovski, S.; Tobiszewski, M.; Simeonov, V.; Polkowska, Z.; Namiesnik, J. Chemical composition of water from roofs in Gdansk, Poland. Environ. Pollut. 2010, 158, 84–91. [Google Scholar] [CrossRef] [PubMed]
  31. Leroy, M.-C.; Portet-Koltalo, F.; Legras, M.; Lederf, F.; Moncond’huy, V.; Polaert, I.; Marcotte, S. Performance of vegetated swales for improving road runoff quality in a moderate traffic urban area. Sci. Total Environ. 2016, 566–567, 113–121. [Google Scholar] [CrossRef] [PubMed]
  32. Salve, P.R.; Maurya, A.; Wate, S.R.; Devotta, S. Chemical composition of major ions in rainwater. Bull. Environ. Contam. Toxicol. 2008, 80, 242–246. [Google Scholar] [CrossRef] [PubMed]
  33. Peters, A.J.; Weidner, K.L.; Howley, C.L. The chemical water quality in roof-harvested water cisterns in Bermuda. J. Water Supply Res. Technol. AQUA 2008, 57, 153–163. [Google Scholar] [CrossRef]
  34. Baez, A.; Belmont, R.; Garcia, R.; Padilla, H.; Torres, M.C. Chemical composition of rainwater collected at a southwest site of Mexico City, Mexico. Atmos. Res. 2007, 86, 61–75. [Google Scholar] [CrossRef]
  35. Edward, A.C.; Kay, D.; McDonald, A.T.; Francis, C.; Watkins, J.; Wilkinson, J.R.; Wyer, M.D. Farmyards, an overlooked source for highly contaminated runoff. J. Environ. Manag. 2008, 87, 551–559. [Google Scholar] [CrossRef] [PubMed]
  36. Sazakli, E.; Alexopoulos, A.; Leotsinidis, M. Rainwater harvesting, quality assessment and utilization in Kefalonia Island, Greece. Water Res. 2007, 41, 2039–2047. [Google Scholar] [CrossRef] [PubMed]
  37. Huston, R.; Chan, Y.C.; Chapman, H.; Gardner, T.; Shaw, G. Source apportionment of heavy metals and ionic contaminants in rainwater tanks in a subtropical urban area in Australia. Water Res. 2012, 46, 1121–1132. [Google Scholar] [CrossRef] [PubMed]
  38. Djukić, A.; Lekić, B.; Rajaković-Ognjanović, V.; Veljović, D.; Vulić, T.; Djolić, M.; Naunovic, Z.; Despotović, J.; Prodanović, D. Further insight into the mechanism of heavy metals partitioning in stormwater runoff. J. Environ. Manag. 2016, 168, 104–110. [Google Scholar] [CrossRef] [PubMed]
  39. Fronczyk, J.; Lech, M.; Radziemska, M.; Sychowicz, J. Selected phisico-chemical parameters of soil along road located in ecologically valuable areas. Sci. Rev. Eng. Environ. Sci. 2016, 71, 21–30. [Google Scholar]
  40. Jiang, W.; Sha, A.; Xiao, J.; Li, Y.; Huang, Y. Experimental study on filtration effect and mechanism of pavement runoff in permeable asphalt pavement. Constr. Build. Mater. 2015, 100, 102–110. [Google Scholar] [CrossRef]
  41. Directive 2013/39/EU of the European Parliament and of the Council of 12 August 2013 Amending Directives 2000/60/EC and 2008/105/EC as Regards Priority Substances in the Field of Water Policy. Available online: http://www.ecolex.org/details/legislation/directive-201339eu-of-the-european-parliament-and-of-the-council-amending-directives-200060ec-and-2008105ec-as-regards-priority-substances-in-the-field-of-water-policy-lex-faoc127344/ (accessed on 27 September 2016).
  42. Gnecco, C.; Berretta, L.G.; Lanza, P. Storm water pollution in the urban environment of Genoa, Italy. Atmos. Res. 2005, 77, 60–73. [Google Scholar] [CrossRef]
Figure 1. Aerial view of the study area and location of the sampling points.
Water 08 00429 g001
Figure 2. Temperature (a) and rainfall (b) in the study period, and 30 days before the first sample collection (red points indicate sampling days).
Water 08 00429 g002
Figure 3. Boxplots showing the median, quartiles, and minimum and maximum values of quality parameters of the samples: (a) electrical conductivity; (b) chloride concentration; (c) sulphur concentration.
Water 08 00429 g003
Figure 4. Boxplots showing the median, quartiles, and minimum and maximum values of pH for samples collected from the road drainage systems.
Water 08 00429 g004
Figure 5. Boxplots showing the median, quartiles, and minimum and maximum values of quality parameters in the samples: (a) nitrate concentration; (b) phosphate concentration; (c) ammonium concentration.
Water 08 00429 g005
Figure 6. Boxplots showing the median, quartiles, and minimum and maximum values of quality parameters in the samples: (a) lead; (b) zinc; (c) nickel; and (d) copper concentration.
Water 08 00429 g006
Figure 7. Boxplots showing the median, quartiles, and minimum and maximum values of quality parameters of samples: (a) COD; (b) TOC.
Water 08 00429 g007
Table 1. Characteristics of selected points of the road drainage system within the Warsaw agglomeration.
Sampling PointsCharacteristicsTraffic Intensity Vehicles/24 h
1Sealed reservoir with vertical, concrete walls shedding rainwater from grass ditches. A petrol station is located nearby.25,902
2Grass ditch with reed vegetation reinforced by a concrete grid shedding water to the drainage system along a road with high traffic density. Additionally, the ditch sheds runoff from a parking lot, a petrol station and a motor vehicle diagnostic station.58,888
3Ditch reinforced by wooden pegs and a concrete grid with regular escarpments, partly transformed into a concrete pipeline, equipped with runoff wells. The ditch flows into the Grabowskie Lake.58,888
4Grabowskie Lake, neighbouring farmlands, meadows and wetlands, sheds rainwater from the neighbouring housing societies and road with high traffic density.58,888
5Pond is an element of the biological treatment system (Phragmites australis), shedding runoff water from an overpass.24,746
6Reservoir of the “Bluszcze” pumping station with retention and compensation function, completely reinforced by a concrete grid and escarpments with a stable slope. The reservoirs drain runoff water from the Gocław district, the Wał Miedzeszyński terminus and the Siekierkowski Bridge area.24,746
19,101
7Reservoir reinforced by a concrete grid with regular escarpments and runoff wells. It drains runoff water from a country and local road.56,852
63,334
8Pond with aqueous vegetation draining a fragment of a local road.19,101
9Reservoir with runoff wells with concrete grid and regular escarpments.
It drains a fragment of an express road and fast road.
56,852
5355
Table 2. Pearson correlation coefficient between tested parameters.
pHECClSO42−NO3PO43−CuNiZnPbTOC
EC0.051
Cl−0.1680.787
SO42−−0.039−0.117−0.191
NO3−0.1020.051−0.0810.160
PO43−−0.088−0.0110.151−0.322−0.112
Cu−0.0810.1960.411−0.283−0.1650.650
Ni0.0680.4260.5300.280−0.0840.0920.303
Zn−0.052−0.0420.121−0.396−0.0430.2970.3580.176
Pb0.0900.067−0.063−0.4740.2890.1450.031−0.2580.196
TOC−0.2430.4260.4390.186−0.3140.0950.1880.256−0.295−0.146
ChZT−0.046−0.1660.047−0.377−0.2630.0230.039−0.0340.5940.190−0.207
Note: Values in bold are with a significance level p = 0.05.

