Article

Potential Impact of Climate Change on Suspended Sediment Yield in NW Spain: A Case Study on the Corbeira Catchment

by
M. Luz Rodríguez-Blanco
1,*,
Ricardo Arias
1,
M. Mercedes Taboada-Castro
1,
Joao Pedro Nunes
2,
Jan Jacob Keizer
2 and
M. Teresa Taboada-Castro
1
1
Centre for Advanced Scientific Research (CICA), Faculty of Sciences, University of A Coruna, A Coruña 15071, Spain
2
Centre for Environmental and Marine Studies (CESAM) and Department Environment & Planning, University of Aveiro, Aveiro 3810-193, Portugal
*
Author to whom correspondence should be addressed.
Water 2016, 8(10), 444; https://doi.org/10.3390/w8100444
Submission received: 24 May 2016 / Revised: 22 September 2016 / Accepted: 29 September 2016 / Published: 12 October 2016
(This article belongs to the Special Issue Watershed Sediment Process)

Abstract

:
Soil losses and the subsequent sediment delivery constitute significant environmental threats. Climate change is likely to have an impact on the availability of water and therefore on sediment yield in catchments. In this context, quantifying the sediment response to an increased atmospheric CO2 concentration and climate change is of utmost importance to the proper management of rural catchments. However, quantitative assessment of climate change impact remains a complex task. In this study, the potential medium (2031–2060) and long-term (2069–2098) impacts of projected changes of temperature, rainfall and CO2 concentration on sediment yield in a small rural catchment located in NW Spain were evaluated using the Soil and Water Assessment Tool (SWAT) model. Climate change scenarios were created using future climate data projected by regional climate models from the ENSEMBLES project and two CO2 concentration scenarios (550 and 660 ppm). The results showed that climate change would have a noticeable impact on suspended sediment if the forecast temperature, rainfall and CO2 concentration changes included in this study were met. Overall, suspended sediment is expected to decrease (2031–2060: −11%, 2069–2098: −8%) compared to the baseline period (1981–2010), mainly due to decreased streamflow. However, an increase in sediment transport in winter is predicted, possibly associated with increased erosion in cultivated areas (11%–17%), suggesting that, at this time of the year, the effect of soil detachment prevails over sediment transport capacity. Consequently, management practices aimed at reducing soil erosion in cultivated areas should be carried out, because these are the main source of sediment in the study area.

1. Introduction

Sediment in rivers is a natural and essential component of water environments. It is of great importance for living organisms and plays a key role in terms of the stability of water bodies and riverine systems [1]. The dynamic equilibrium between the movement of water and the movement of sediment has been disrupted by the human modifications of natural hydrologic processes [2] resulting in a number of serious environmental problems such as aquatic habitat degradation, reservoir sedimentation and the transport of sediment-bound pollutants [3,4]. These problems may be exacerbated under the changing environment of the 21st century, since future climate change is expected to affect the hydrological cycle and alter various processes occurring at catchment scale, including changes in surface runoff, evapotranspiration rates, erosion and sediment transport [5,6].
The Intergovernmental Panel on Climate Change (IPCC) states, with a high degree of confidence, that there will be an increase in temperature throughout Europe and decreasing rainfall in southern Europe (i.e., increased aridity), with a likely reduction in the availability of water resources, as well as a rise in extreme phenomena such as floods, droughts and fires [7]. This effect is particularly evident for the southern regions (such as the Iberian Peninsula) where the future climate is projected to worsen conditions in a region already vulnerable to climate variability as well as low water availability [8]. Climate change projections for the Iberian Peninsula indicate a decreasing trend in annual mean rainfall and an increase in heavy rainfalls [9,10], although there are divergences depending on the model and the greenhouse gas emission scenario used. The impact of the expected climate change on river regimes in the Iberian Peninsula has been estimated by several scientists [11,12,13,14,15,16], but the impact of changes on soil erosion and sediment yield at catchment scale has received less attention.
Most of the studies have focused primarily on medium and large Mediterranean basins in which soil erosion gives rise to serious problems [11,16,17]. It might be expected that sediment yield would decrease with streamflow, although this does not always happen [18]. In addition, the response of sediment yield to streamflow decrease may not be linear, so it could produce an increase in suspended sediment concentrations due to reduced water discharge, causing a deterioration in water quality if mean concentrations reach 25 mg·L−1, i.e., the guideline set by legislation for drinking water (Directive 75/440/EEC) [19] and fish life (Directive 2006/44/EEC) [20]. Connectivity between the source area of the sediment and the drainage network plays a critical role in sediment delivery to the stream channel [21,22], so the response of soil erosion and sediment yield to changes in climatic variables do not necessarily go in the same direction. Thus, Asselman et al. [23] observed an increase in erosion rates of 12%, but did not notice a significant effect on sediment yield at the catchment outlet, because of the limited sediment delivery to the stream. Conversely, Syvitski et al. [24] found an increase in both soil erosion rates and sediment yield with increasing temperature. Ultimately, it is the combination of changes in transport capacity and erosion rates that determines the flow and sediment concentration in the river. No study has looked at the possible impact of climate change on suspended sediment yield in Galicia (northwest Spain), an area where rainfall is potentially highly erosive and episodic events may lead to short-term issues affecting water quality, owing to high concentrations of sediment, phosphorus and metals from agricultural land carried in runoff [25,26,27,28]. Climate change might contribute to increased soil erosion in this area because of the projected higher frequency of heavy rainfall in autumn and the increase in temperature (2–3 °C) [29], which would lead to a decrease in crop growth, thereby exposing the soil and leading to enhanced soil erosion as has been reported in other areas of the Iberian Peninsula [11,16]. This underlines the need to quantify soil erosion and sediment yield in the area and to improve the knowledge on the interaction between the two processes as a basis for developing catchment management models in the region, in order to implement management practices to preserve soils, promote rational uses of the land and prevent erosion.
In view of the above, this study attempts to provide a first approach to assess the impact of climate change on suspended sediment in Galicia, NW Spain. Specifically, the objective of the study was to assess the effects of potential changes in temperature, rainfall and CO2 concentration on suspended sediment in the Corbeira catchment, a small rural catchment located in Galicia, using the Soil and Water Assessment Tool (SWAT) model. This model has been widely used to evaluate the effects of climate change on soil erosion and sediment yield processes at catchment scale [11,13,16,30,31,32] due to its ability to incorporate future climate predictions from climatic models as inputs to the model, and to account for the effects of increased CO2 on plant development and evapotranspiration. A previous satisfactory calibration and validation of the SWAT for suspended sediment yield in the Corbeira catchment [33] proved to be an appropriate tool for simulating suspended sediment under the conditions prevailing there and, therefore, could be a useful tool to identify the crucial soil loss areas within the catchment and evaluate the influence of alternative management practices in controlling sediment losses.

2. Materials and Methods
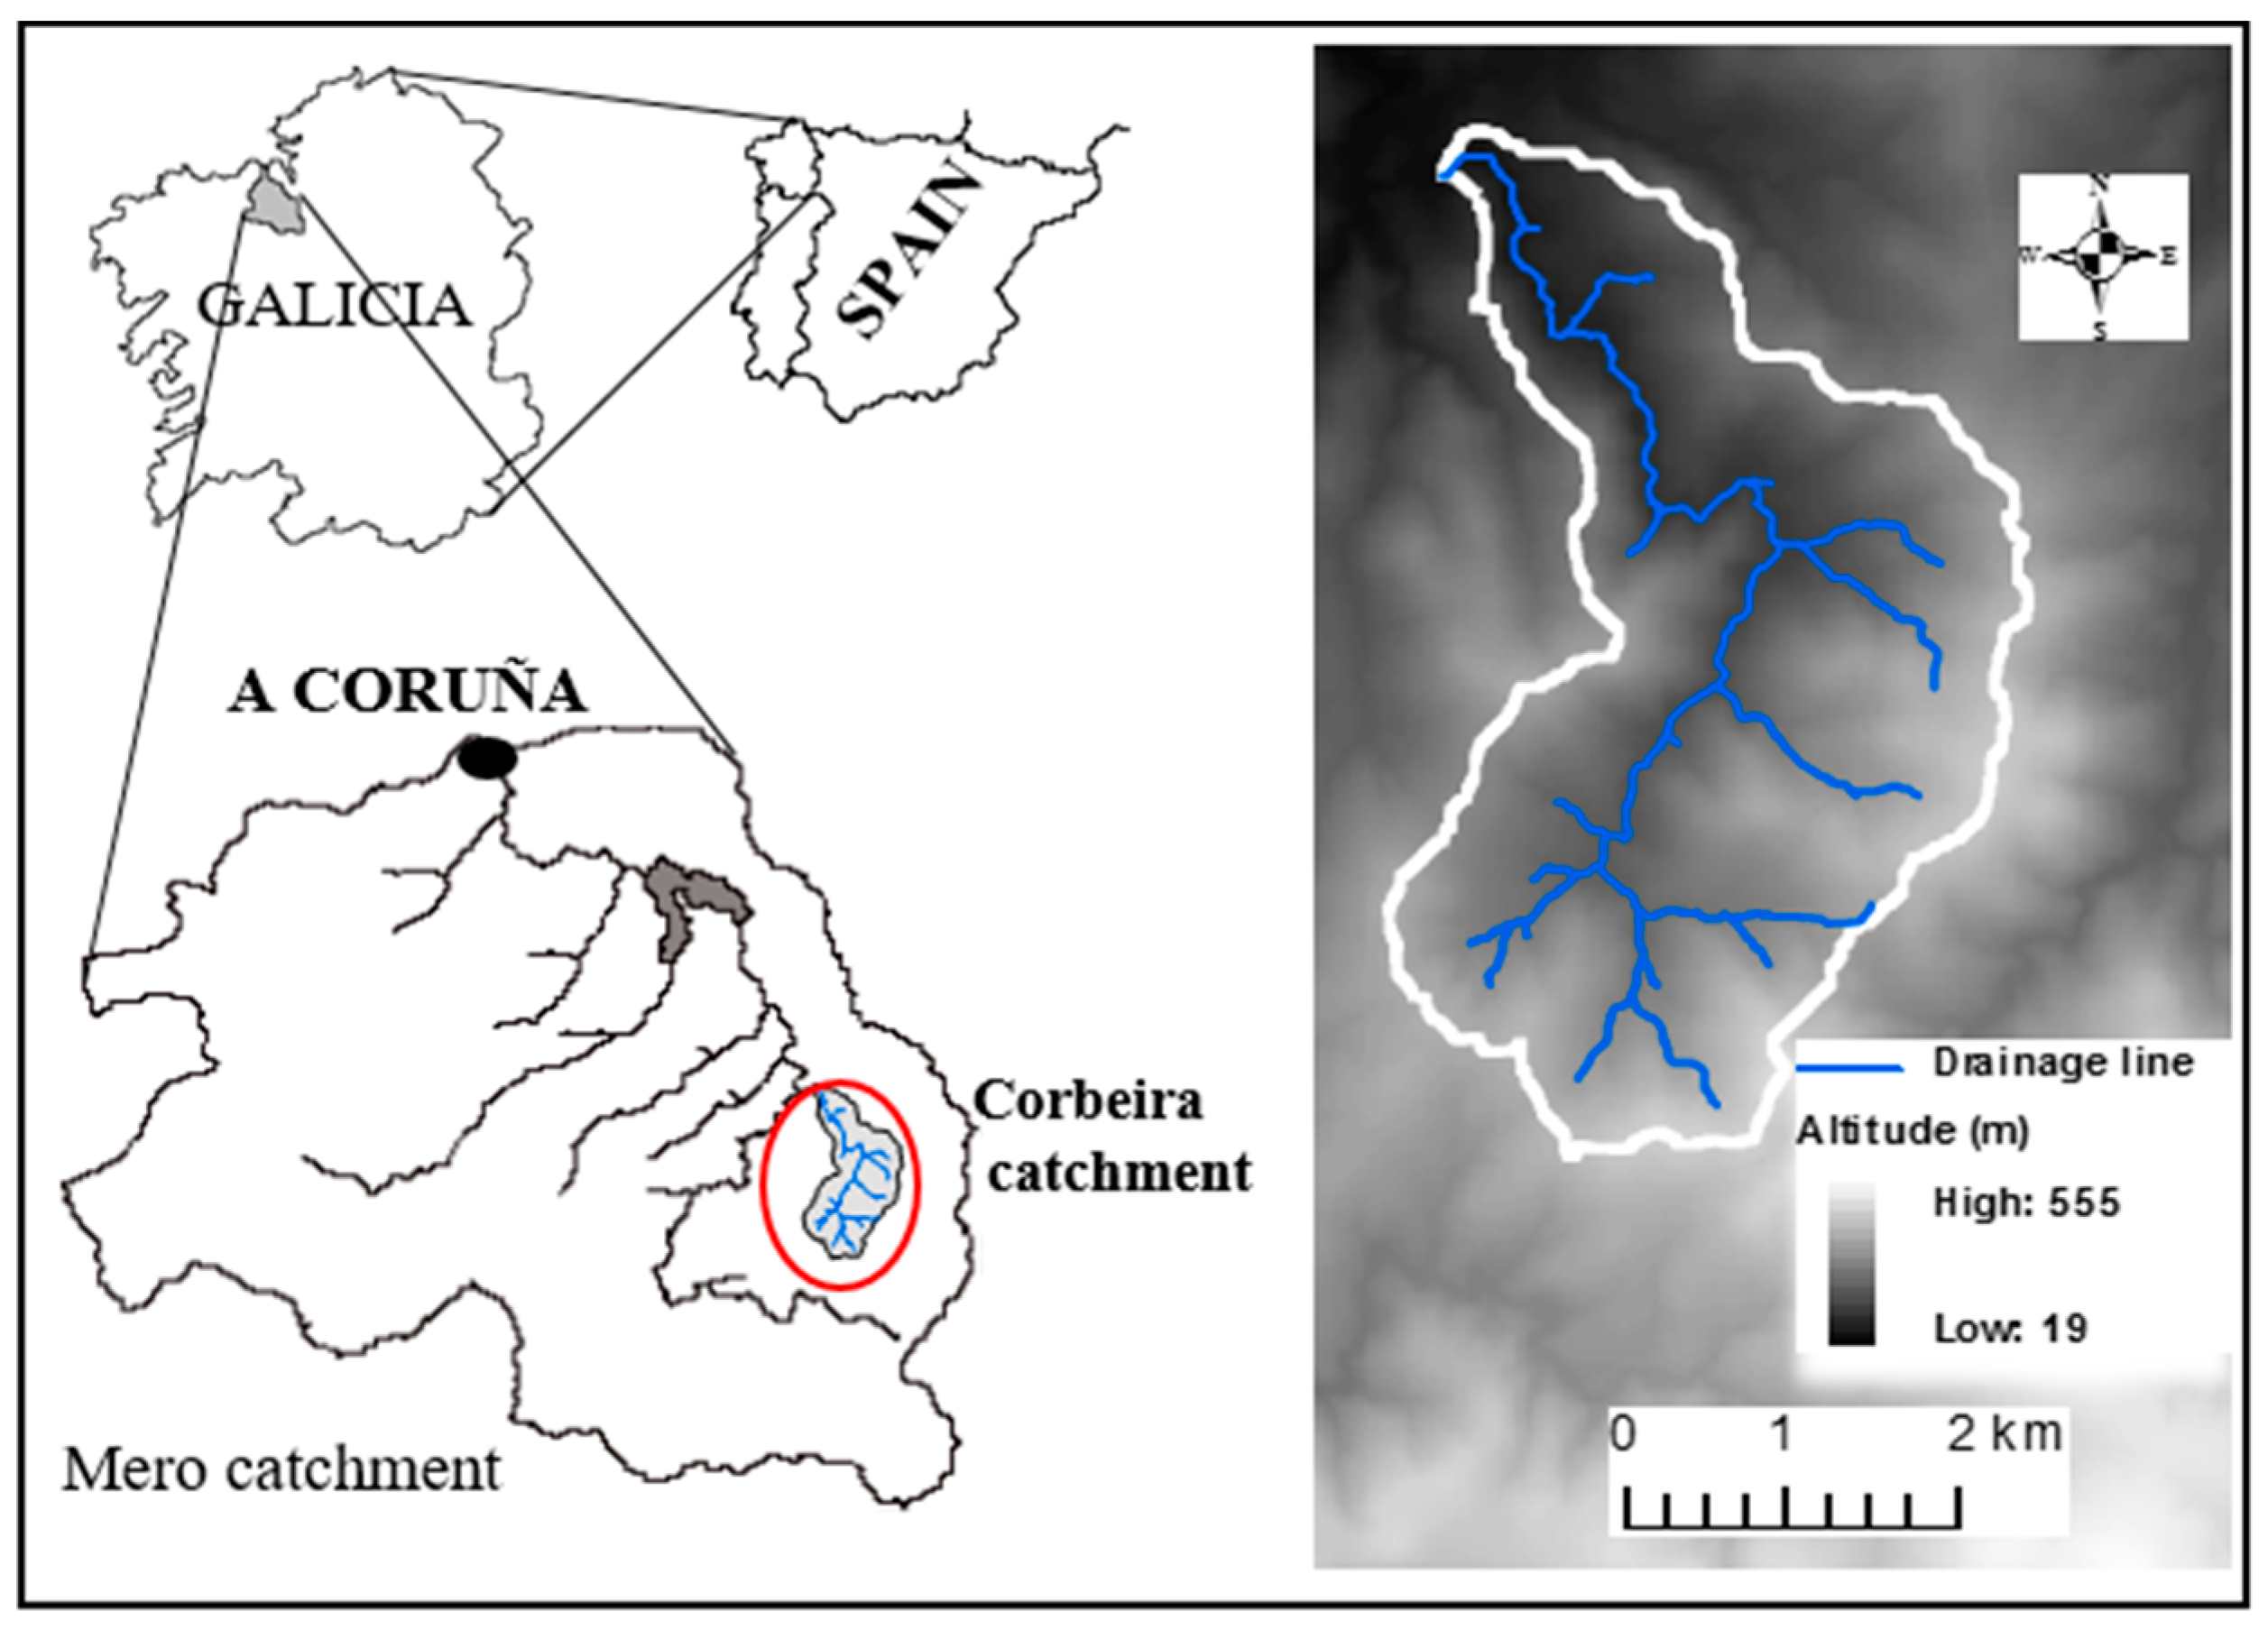
2.1. Study Area

The study was carried out in the Corbeira catchment, a rural catchment covering 16 km2 located in north-west Galicia (Spain) in the province of A Coruña (Figure 1), at a latitude of 43°13′2.3′′ N and a longitude of 8°13′43.9′′ W. Elevations range from 60 m to 470 m a.s.l. with mainly moderate slopes (>13%). The geology of the catchment is dominated by schist of the Órdenes Complex [34]. The predominant soils are Umbrisols (74%) and Cambisols (25%) [35] with a silt and silt–loam texture, very deep and high organic content (mean 6.5%; range 4.4%–10.5%). The principal land uses in this catchment are forestry (65%) and agriculture (30%). The forest area mainly consists of commercial eucalyptus plantations, whereas agriculture land is a patchwork of croplands (4% of total area), mostly growing maize for forage and winter cereal, interspersed with pasture for cattle (26% of total area). Impervious built-up areas and roads cover about 5% of the whole catchment area and are mainly distributed in the agricultural zone.
The study area is characterized by an oceanic climate, with a mean annual temperature of about 13 °C and a mean annual rainfall of about 1063 mm (1983/1984–2009/2010) of which 65% is recorded during the October–March period. The hydrological regime is pluvial, with maximum discharge in December and low flows from June to September. Stream discharge is mainly supplied by groundwater [36]. The sediment yield, estimated from continuous discharge data and suspended sediment concentrations in water samples collected at base flow conditions and runoff events, is low (0.11 t·ha−1·year−1, [25]), although significant sediment amounts are mobilized within the catchment, these do not reach the stream [22,25]. For example, during winter 2008, only 22% of eroded soil in cultivated soils—the main source of sediment in the study area [37]—reached the drainage network.
The Corbeira catchment was chosen for this study because it is a very sensitive area in terms of climate change on hydrological processes as it is projected to undergo a substantial decrease in rainfall and streamflow, especially at the end of the 21st century [14]. The Corbeira catchment is located upstream of the Cecebre reservoir, which is the main drinking water source of A Coruña city and surrounding municipalities (450,000 inhabitants) in NW Spain. Moreover, this reservoir was declared a Special Area of Conservation and Site of Community Importance included in the Natura 2000 Network. Possible deterioration in the water quality in the Corbeira catchment because of the impact of climate change on suspended sediment, and therefore on sediment-associated nutrients and trace elements, could be extrapolated to the river Mero and consequently could affect the Cecebre reservoir.

2.2. SWAT Model and Input Data

The eco-hydrological SWAT model was used to assess the impact of climate change on suspended sediment. This process-based, spatially semi-distributed model was developed by the Agricultural Research Service of the United States Department of Agriculture (USDA) to quantify and predict the impact of agricultural management practices on water, sediment and chemical yields in medium and large complex catchments with varying soils, land use and management conditions over long periods of time [38,39]. However, it has also been satisfactory when applied to small catchments around the world (e.g., references [13,16,32,40,41,42,43,44]), proving the robustness of the SWAT model in predicting water, sediment, and chemical yields from small catchments under different climatic conditions. The SWAT model is also capable of simulating the impacts of climate change and human intervention on vegetation growth, water flow, soil erosion, nutrient export, metal fluxes, pesticide transport and bacteria loadings. Climate change impacts can be simulated directly with SWAT, taking into account (i) changes in climatic inputs and (ii) the effect of increased concentrations of atmospheric CO2 on plant development and transpiration.
The SWAT model operates at daily time step and describes the spatial heterogeneities by dividing the basin into sub-basins, which are further separated into hydrological response units (HRUs), i.e., territorial units characterized by a specific combination of land use, soil type and slope. The SWAT model simulations are separated into two major modules: the first (land phase) controls the amount of water, sediment, nutrient and pesticide loads supplied to the main channel in each sub-basin. The second is related to the movement of water and other elements through the channel network to the catchment outlet. Soil erosion and sediment yield are estimated from each HRU with the Modified Universal Soil Loss Equation (MUSLE; [45]). The MUSLE uses the energy from surface runoff rather than rainfall to simulate erosion and sediment yield, which makes it suitable for application at daily time scales. Erosion and sediment yield are estimated as a function of peak runoff and volume and physical factors, such as soil erodibility (USLE-K), slope steepness and length (USLE-L), cover factor (USLE-C) and support practice factor (USLE-P). The USLE soil erodibility factor (USLE-K) was estimated from data of clay, silt, sand, and organic content in soils using the equation proposed by Williams [45]. The USLE topographic factor (USLE-L) was automatically calculated from the Geographic Information System (GIS) interface in the SWAT model. USLE-C varies throughout the year according to the growth cycle of the plant based on the minimum value for the cover, the management factor for the land cover, and the amount of residue on the soil surface. The minimum C factor for the land cover was estimated using an equation proposed by Arnold and Williams [46]. The USLE support practice factor (USLE-P) was modified following Wischmeier and Smith [47] to reflect management practices for pasture and cropland in the study area. Sediment loads from each HRU collect at sub-basin scale, and the resulting loads are transported by streamflow and distributed to the basin outlet. The sediment transport in the channel is controlled by deposition and degradation processes, which depend on the sediment load coming from upland areas and on the channel capacity to transport sediment.
SWAT incorporates an explicit plant growth model, including plant interactions with temperature, water, nutrient stores, and atmospheric CO2 concentration and it allows vegetation growth to be estimated, including trees grown to mature stand. Several studies have highlighted the ability of SWAT to successfully predict crop yield and biomass production (e.g., references [48,49,50]). The phenological development of vegetation is based on the accumulation of heat units. The potential biomass production is then modeled using a method developed by Monteith [51], which simulates leaf area development (according to the phenological development), light interception and conversion of intercepted light into biomass. It includes the consequences of atmospheric concentrations of CO2 on the efficiency of this conversion, which uses methods developed by Stockle et al. [52]. The model also takes into account the fact that plant growth can be inhibited by temperature, water stress and lack of nutrients. Plant growth is strongly dependent on temperature, which affects erosion by changing the percentage of vegetation cover. A detailed description of the different model components can be found in Neitsch et al. [39].
The SWAT model was previously calibrated and validated for streamflow and suspended sediment yield in the study area. The effects of climate change on water resources were also assessed. Details on model setup and suspended sediment performance can be found in Arias et al. [14] and Rodríguez-Blanco et al. [33]. The model satisfactorily reproduced the pattern of observed daily streamflow and monthly suspended sediment yield based on the values of selected quantitative statistics, including the determination coefficient (R2), Nash–Sutcliffe efficiency (NSE) and percentage of bias (PBIAS). The following statistical performances were obtained for the calibration (October 2005–September 2008) and validation (October 2008–September 2010) period, streamflow: R2 = 0.80 and 0.80, NSE = 0.80 and 0.83, and PBIAS = −1.1% and −3.3%; suspended sediment yield: R2 = 0.67 and 0.84, NSE = 0.48 and 0.50, and PBIAS = −6% and −12%, which are deemed satisfactory according to the thresholds of model performance set by Moriasi et al. [53]. The estimated sediment yield was 0.11 t·ha−1·year−1, a value close to the mean annual sediment measured at the catchment outlet (0.105 t·ha−1·year−1, [33]). However, the estimation of suspended sediment presented difficulties in certain months, particularly when peak discharges were underestimated during periods of high flow [33], which should be taken into account when analyzing model results. Despite these difficulties, results of sediment yield simulations were within the performance criteria provided by Moriasi et al. [53], so the model can be used to obtain a reasonable assessment of the impact of climate change on sediment yield in the study catchment. The sediment yield rates ranged from near zero values in forest areas (0.002 t·ha−1·year−1) and pasture (0.005 t·ha−1·year−1) to 3.09 t·ha−1·year−1 in cultivated areas growing maize, which are the main source of sediment in the catchment.

2.3. Climate Scenario Description

In this study, the evaluation of the impact of climate change on suspended sediment yield has focused on estimating the potential effects that changes in temperature, rainfall and CO2 concentration may cause on suspended sediment yield, following the methodology used in the study by Arias et al. [14]. In SWAT, these variables (temperature, rainfall and CO2 concentration) impact the sediment yield in specific ways, although the mechanisms involving sediment yield are highly interconnected. Temperature impacts evapotranspiration, the decomposition of organic matter and plant productivity. Plant productivity can both increase soil erosion rates through faster residue decomposition due to higher microbial activity [54] and decrease soil erosion rates because of an increase in soil surface canopy cover [55]. Rainfall is the driving factor in runoff and it also has an important role in regulating plant productivity. CO2 concentration controls plant productivity by reducing evapotranspiration rates and increasing surface runoff, the peak runoff rate and the soil vegetation cover, which in turn decrease the MUSLE cover and management factor [39].
Two simulation sets were conducted. The first evaluated the response of suspended sediment to changes in single climate variables, i.e., to temperature, rainfall or CO2 concentration changes and the second analyzed the effect caused on suspended sediment yield by simultaneous changes in the three variables mentioned above. The analysis focused on two periods over the 21st century: a mid-century period (2031–2060: intermediate future) and a late-century period (2069–2098: distant future). The period 1981–2010 was taken as the baseline period.
The IPCC estimates of future atmospheric CO2 concentrations project an increase from current values (330 ppm) to 550–970 ppm by the end of the 21st century [8], depending on greenhouse gas emissions. The scenarios of atmospheric CO2 concentration changes used in this study represent increases of 1.5 to two times the current CO2 concentration, which was set at 330 ppm, as this is the default value set in the SWAT model. Since SWAT does not allow a continuous increase of CO2 concentration throughout the simulation period, it is assumed that the CO2 concentrations chosen (550 and 660 ppm) give a reasonable representation of future CO2 conditions for the mid-century and late-century periods under the A1B scenario [56]. The different climatic scenarios used in this study are based on predicted future alterations from regional models in the ENSEMBLES project (socio-economic A1B scenario) for the Spanish Meteorological Agency’s 1387E meteorological station, located about 20 km from the catchment, for the periods 2031–2060 and 2069–2098. Data from 12 regional models in the ENSEMBLES project (see Arias et al. [14] for details) were combined to obtain mean and maximum monthly rainfall values and mean air temperature for the two periods (2031–2060 and 2069–2098). The mean values for measured monthly rainfall and mean temperature during the reference period (1981–2010) were also calculated. Differences between projected and measured values were used to develop the climate change scenarios for the periods 2031–2060 and 2069–2098. Table 1 shows all climate change scenarios used in the SWAT simulations. The first ten scenarios were created with changes in single variables: the first four with variations in temperature (Sc1, Sc2, Sc3, Sc4), following four with changes in precipitation (Sc5, Sc6, Sc7, Sc8), and the remaining two with changes in the CO2 concentration (Sc9, Sc10). The other four scenarios are combinations of these scenarios. Thus Sc11 = Sc1 + Sc5 + Sc9; Sc12 = Sc2 + Sc6 + Sc9; Sc13 = Sc3 + Sc7 + Sc10 and Sc14 = Sc4 + Sc8 + Sc10.
The WXGEN weather generator [57] included in the SWAT model was the basis for simulating the impact of climate change on suspended yield in the study catchment, as it is an effective tool to generate daily climate data widely used for climate change studies [11,14,58,59]. The SWAT model was run with several changes in temperature, rainfall and CO2 concentrations using the WXGEN weather generator to generate a 30-year weather series with changed average values. The WXGEN weather generator was modified to generate future daily values of climate variable. For temperature, the prescribed monthly differences were added to the weather generator temperature parameter derived from baseline data; while for rainfall, the weather generator rainfall parameters derived from baseline data were multiplied by a given factor. Change factors for rainfall were also used to alter the rainfall characteristics, which may be highly influential on erosion studies. Among the conclusions of a study analyzing the response of runoff and soil erosion to changes in rainfall, Pruski and Nearing [60] indicated that, in order to account for changes in rainfall, it is not enough to vary the number of rainy days, since this methodology could underestimate the potential effects of climate change on runoff and consequently on soil erosion. Nor is it enough to modify the rainfall that occurs on a wet day (the most common method used to reflect changes in the annual or monthly rainfall), since this method tends to overestimate the effects of rainfall on runoff and soil erosion. Therefore, they suggest that the most realistic scenario is one in which 50% of the change is made through changes in the average rainfall occurring on a wet day, and 50% of the change is made via a change in the number of wet days. Following the approach of Pruski and Nearing [60], rainfall changes were made based on half of the total monthly changes being due to the amount of rainfall falling per day, and the other half being due to changes in the number or rainy days. The change of rainy days was carried out by adjusting the probability of one rainy day being followed by another in the month, and the probability of a rainy day being followed by a dry day. These probabilities were obtained by multiplying the baseline probabilities by fifty percent of the change factor for rainfall [adjusted probability = baseline probability + (baseline probability × one half of change factor for rainfall)]. The maximum 30-min rainfall rate value was also changed proportionally. No changes could be made to the historical wind speed, solar radiation, relative humidity and dew point when modeling climate change scenarios because models in the ENSEMBLES project only generate anomalies for temperature and rainfall. There is no information on projected land use changes in the study catchment. Therefore, land use was assumed to remain unchanged throughout the simulation periods and the existing land cover patterns were used in all simulations.
The suspended sediment yields under the selected scenarios were compared with the 30-year simulation of the baseline period (1981–2010). T-tests were performed to assess whether the suspended sediment yields estimated from the climate change scenarios and the reference scenario were statistically different from each other, once the normality of the data had been checked using a Shapiro–Wilk test. The significance level of the statistical tests was set at p < 0.05.

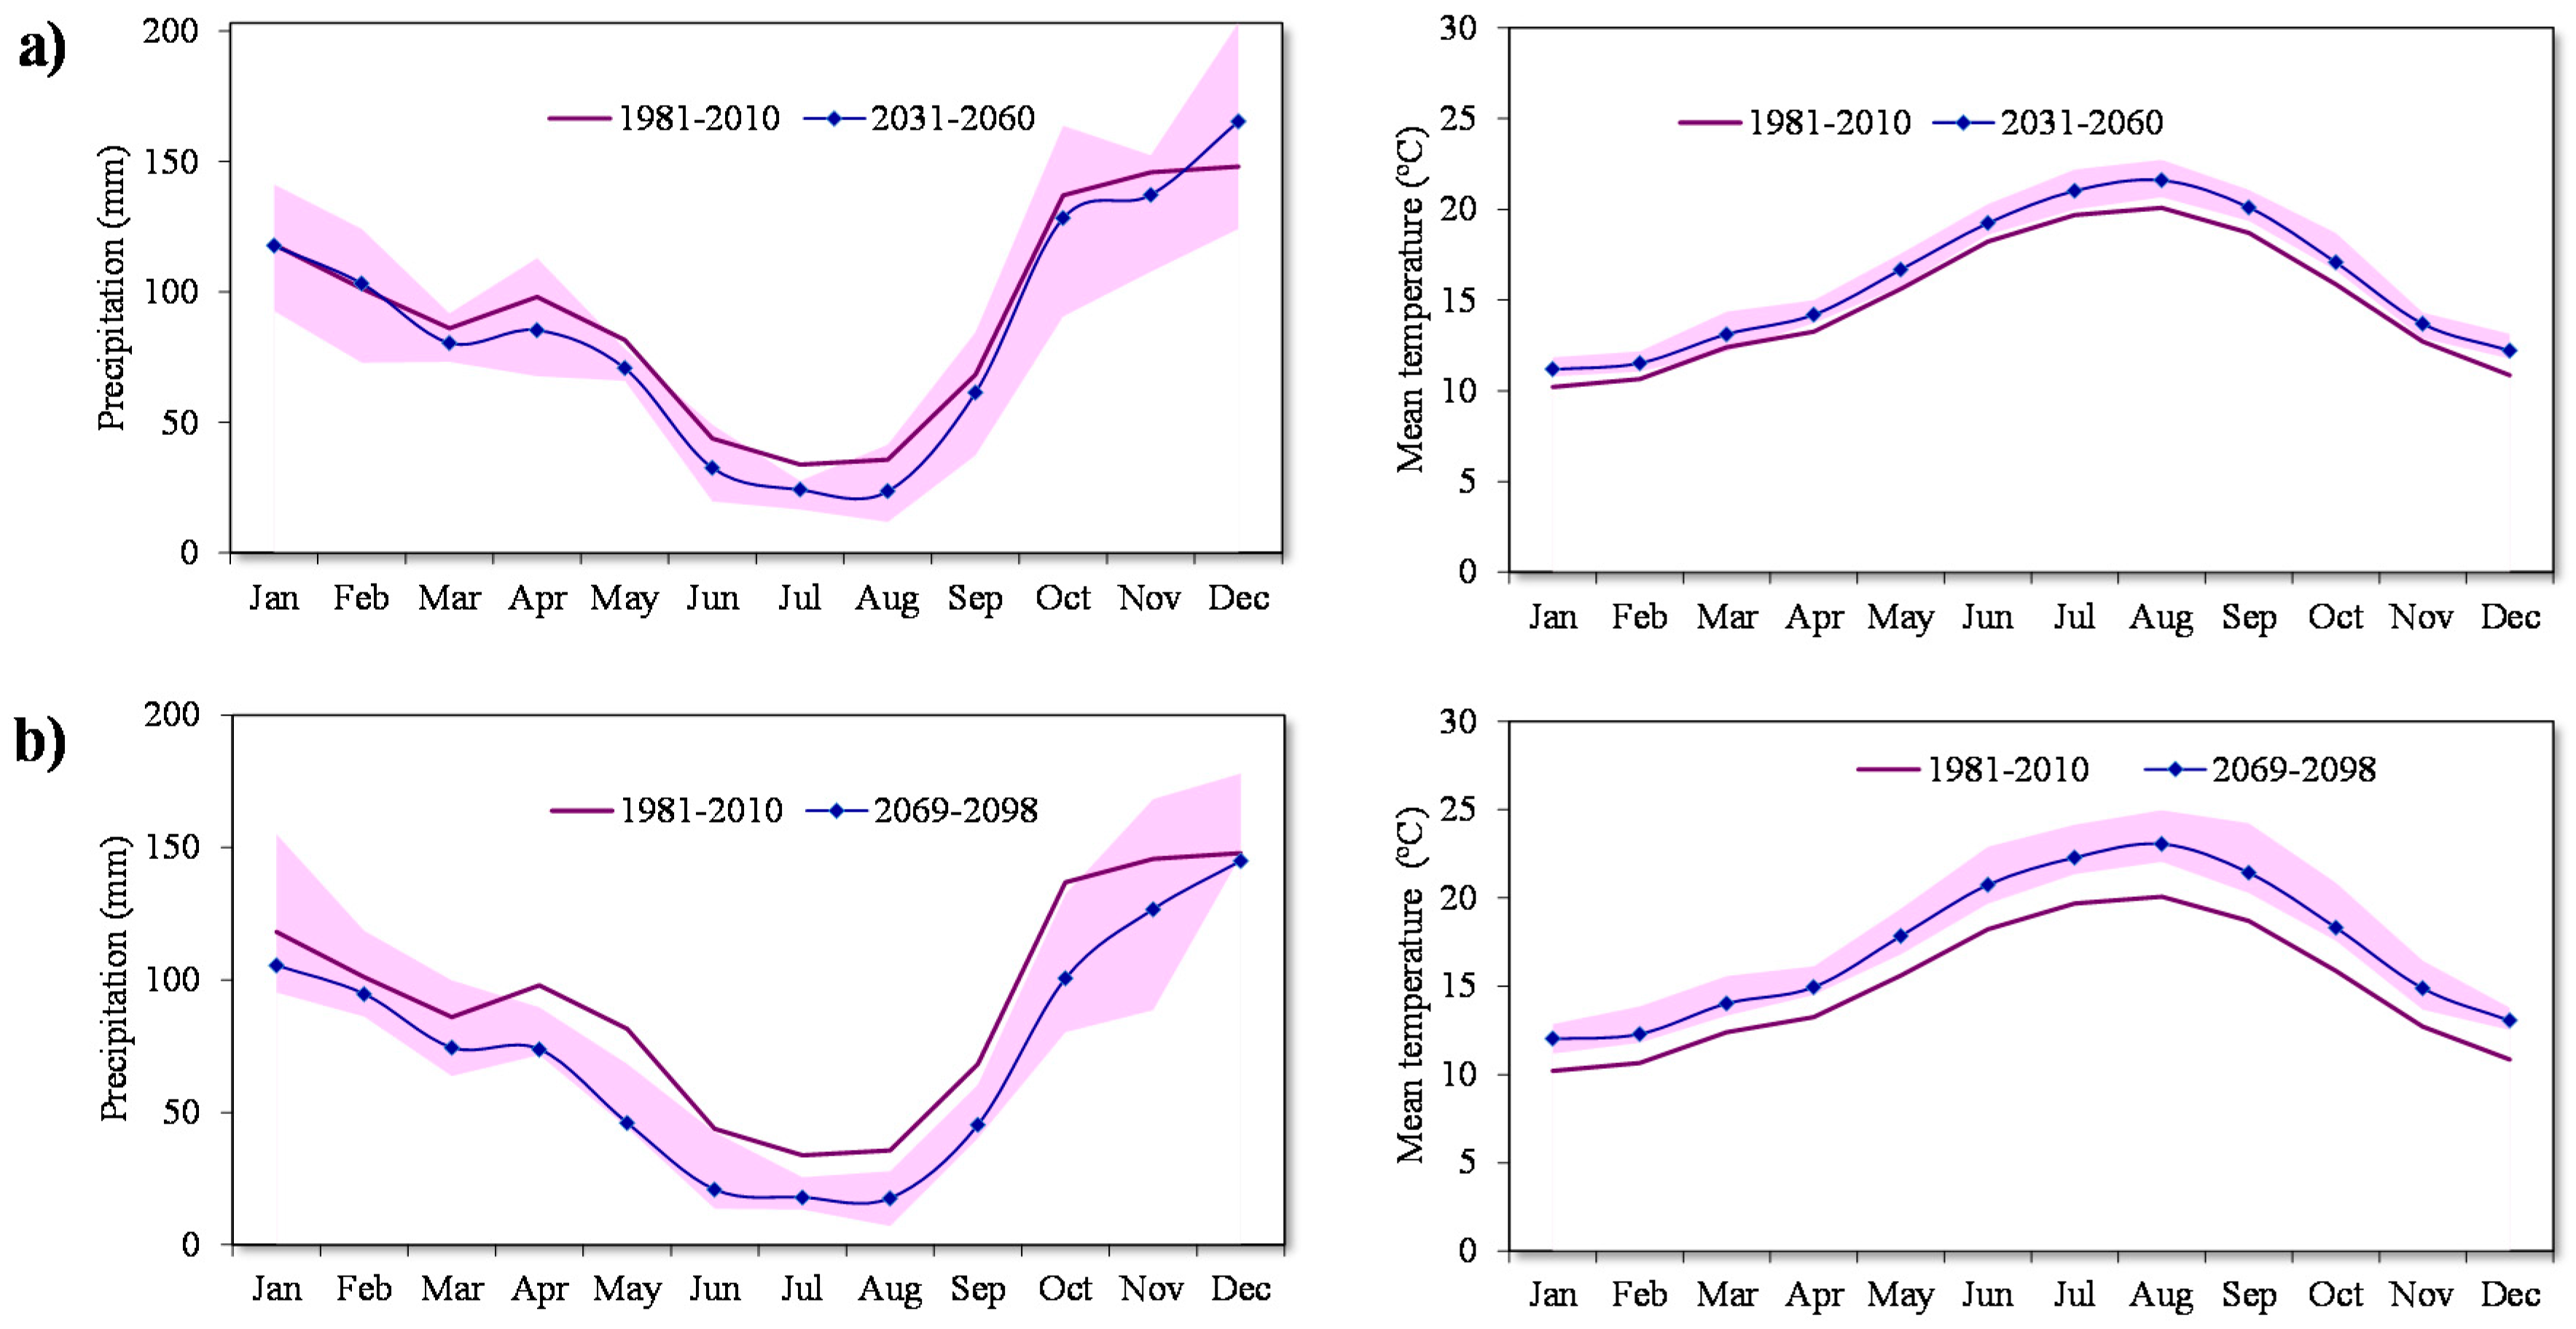
2.4. Projected Changes in Temperature and Precipitation in the Study Area

Figure 2 shows the projected changes in monthly rainfall and mean monthly temperature in the study area for the two time periods (2031–2060 and 2069–2098). It shows that important changes may occur in rainfall and temperature, especially in the period 2069–2098. A generalized warming is expected throughout each period (on average, 1.1 °C and 2.2 °C respectively for the periods 2031–2060 and 2069–2098), more pronounced in summer, the season in which the most extreme cases occur, the temperature increase for the late-century period would exceed 5 °C (Figure 2b). These projections result at a rate of temperature increase below the trend observed for Galicia with the current data series (1973–2004), which points to an increase of 0.5 °C per decade over the last thirty years [61]. Mean annual rainfall is expected to decrease by an average of about 6% and 15% for the period 2031–2060 and 2069–2098, respectively, with marked changes between seasons. Thus, from 2031 to 2060, a slight increase is expected in the amount of rainfall in December, and a large decrease in rainfall in spring and summer, i.e., during the driest period of the year. From 2069 to 2098 rainfall is projected to decrease by 21% and 31% in summer and spring, respectively. In general, a lower decrease is expected in spring, but it should be noted that the summers in the study area are drier than spring, so a decrease of around 40% means a reduction of 20 mm per month, which means that there will be hardly any rain in the warmer months when biological activity is at a high. The reduction of rainfall in the study area is likely to be associated with both a drop in the number of rainy days and increased precipitation when it does rain, i.e., with decreased frequency and increased intensity of rainfall events, as is often suggested for the study area [29]. In short, these projections are indicative of a trend towards the Mediterraneanization of the climate in the study area with increased seasonality of rainfall, so seasonal droughts could increase in the future [29]. All of this will affect the hydrological regimes [13], and thus the sediment and nutrient yields. In the study area, springs and summers are expected to be hot and dry, which could have serious implications in many sectors, such as agriculture or water supply during the summer. This fact should be considered in future catchment management plans and management of the reservoir downstream.

2.5. Characteristics of the Baseline Scenario

The correspondence between simulated suspended sediment yield using the WXGEN weather generator embedded in the SWAT model, and simulated suspended sediment yield using observed meteorological data was verified, in order to check the consistency of weather data simulated by WXGEN for suspended sediment in the Corbeira catchment. The mean suspended sediment yield at the catchment outlet was 0.92 t·ha−1·year−1 for the reference 30-year simulation period, a result comparable with the predicted mean annual export of the catchment (0.105 t·ha−1·year−1) and the observed mean annual sediment yield (0.11 t·ha−1·year−1). The statistical indicators (R2 = 0.55 and NSE = 0.53), following the criteria set by Moriasi et al. [53], suggest that model performance is satisfactory, indicating that the SWAT weather generator can be used with a reasonable degree of confidence to estimate suspended sediment, and hence provide a useful tool for analyzing the impact of climate change on the suspended sediment yield in the Corbeira catchment.

3. Results and Discussion

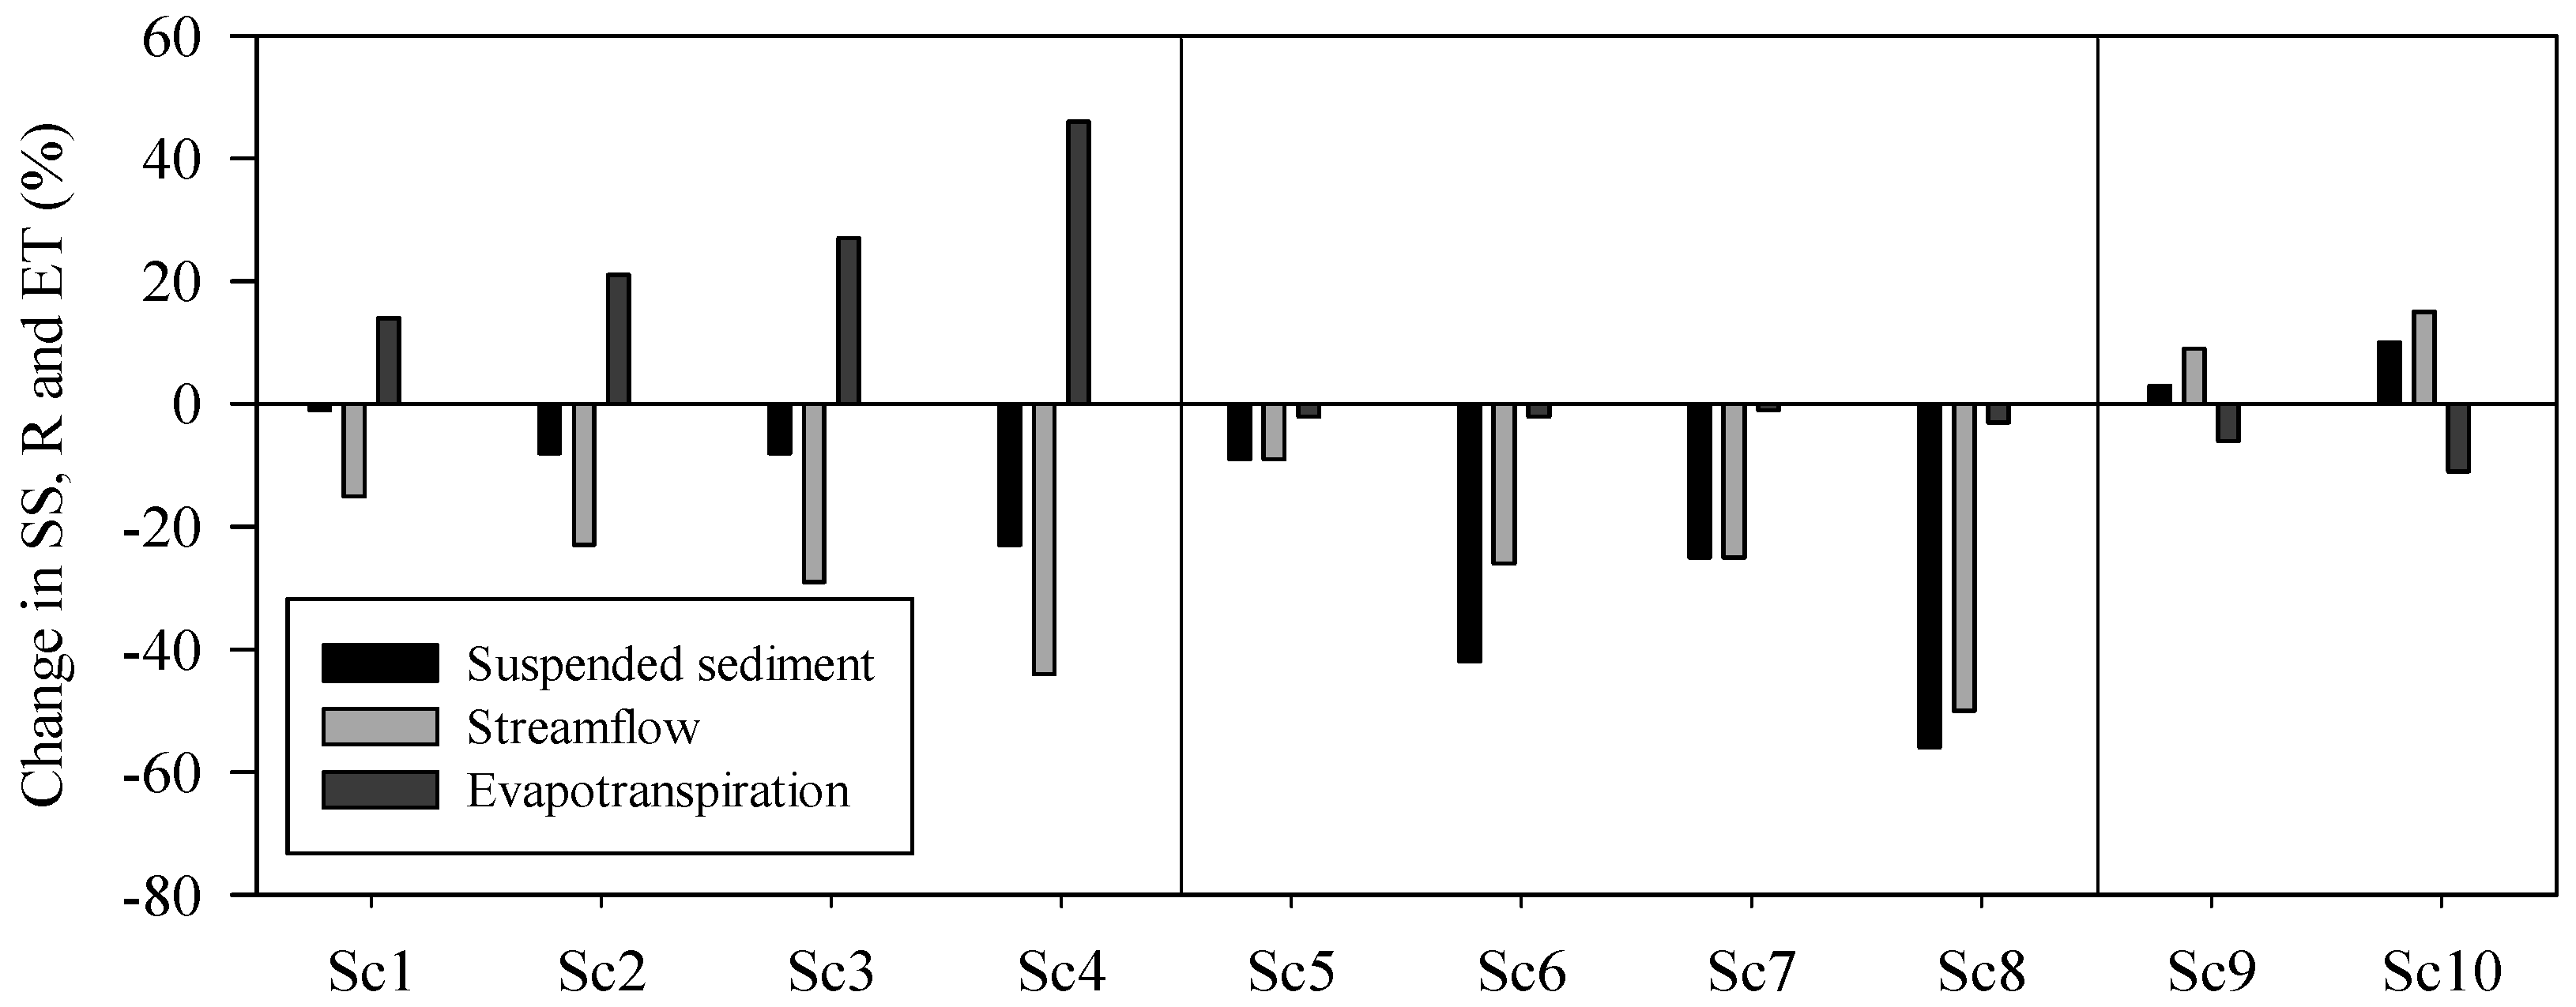
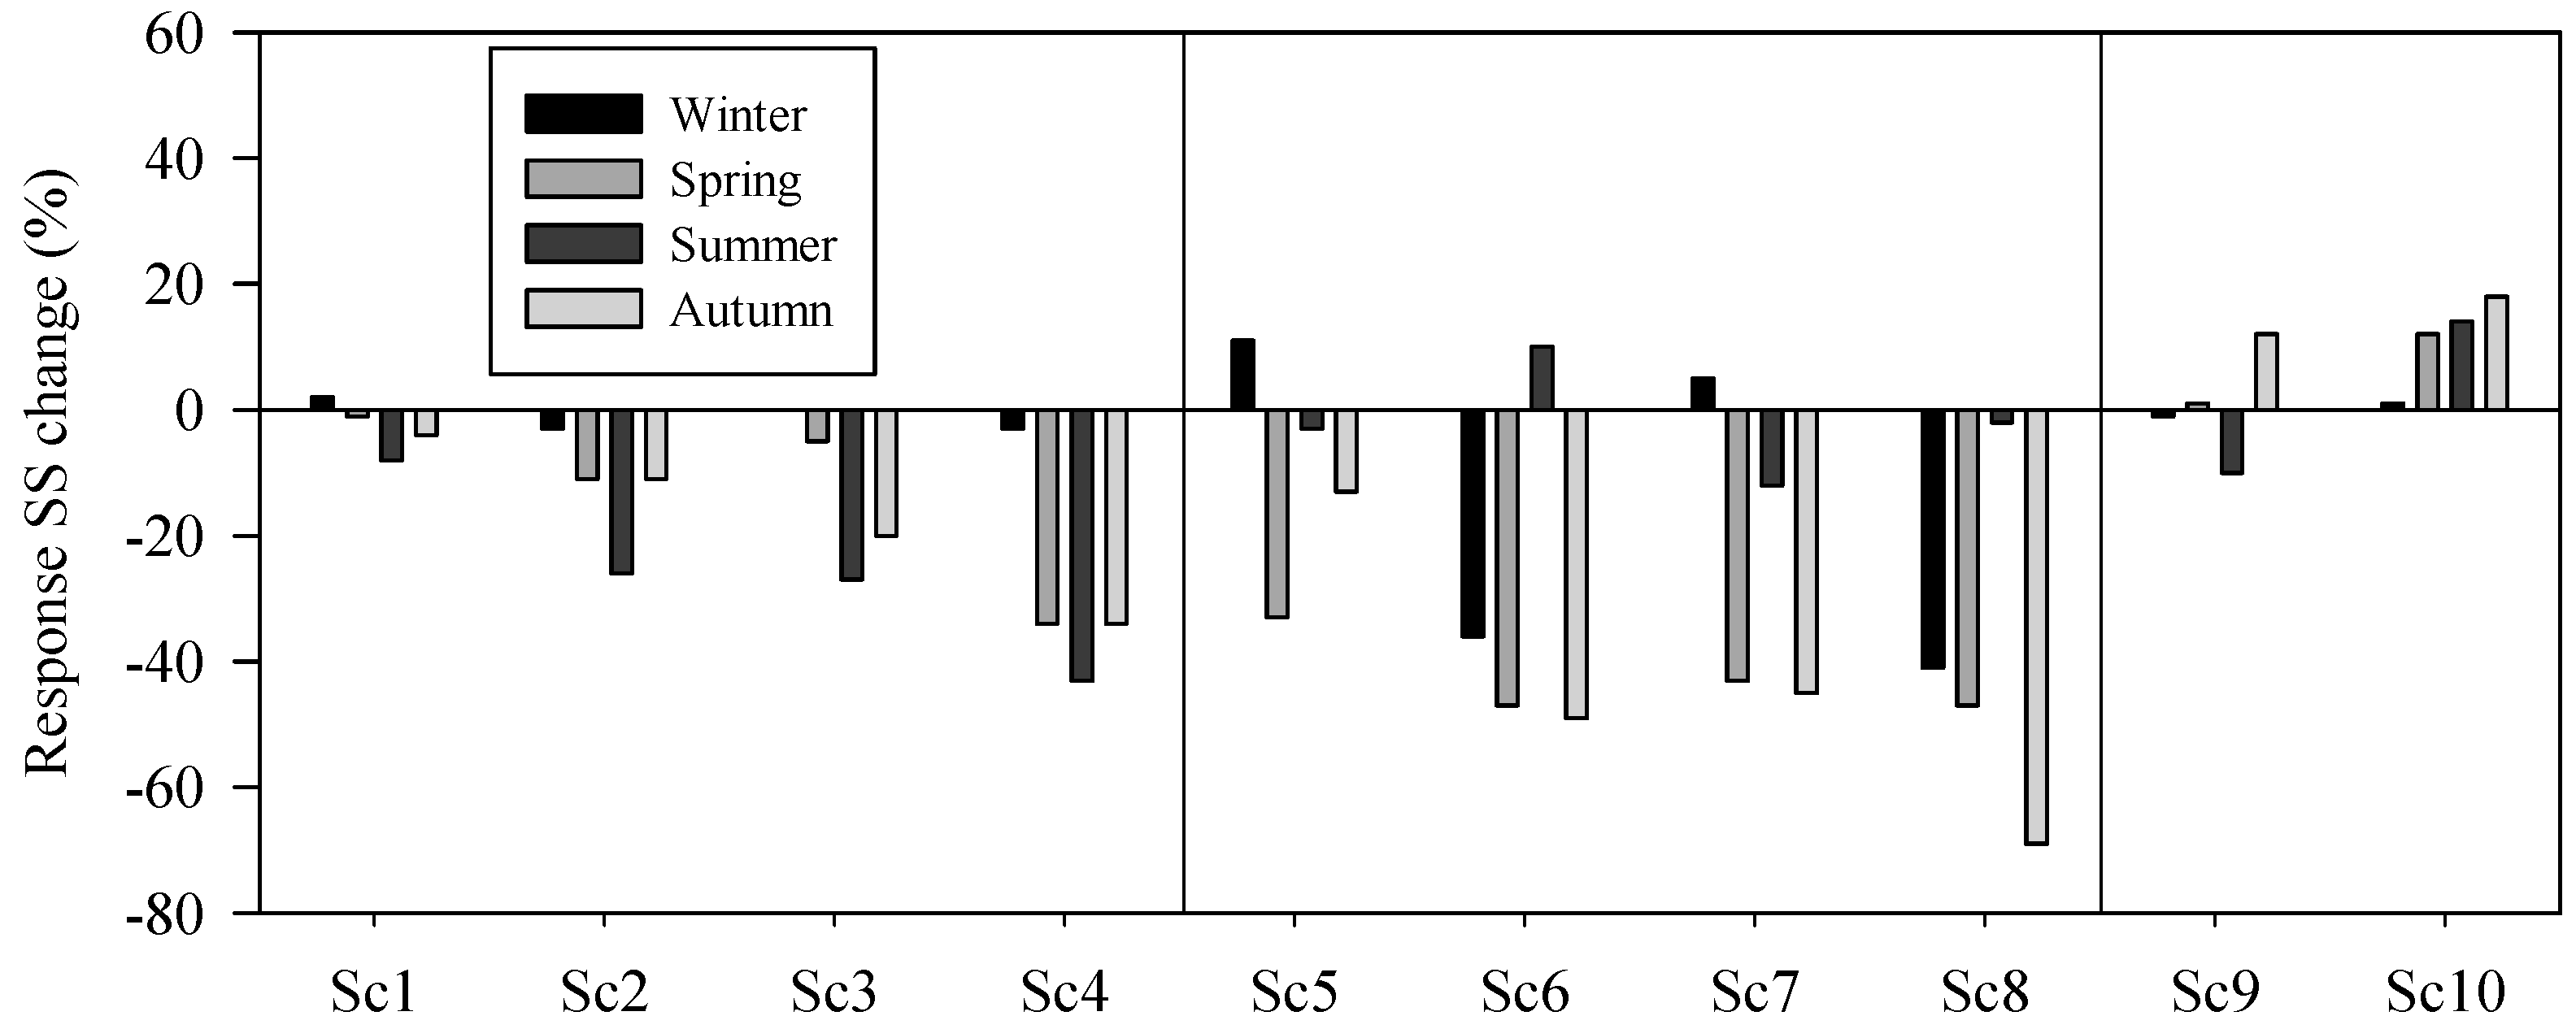
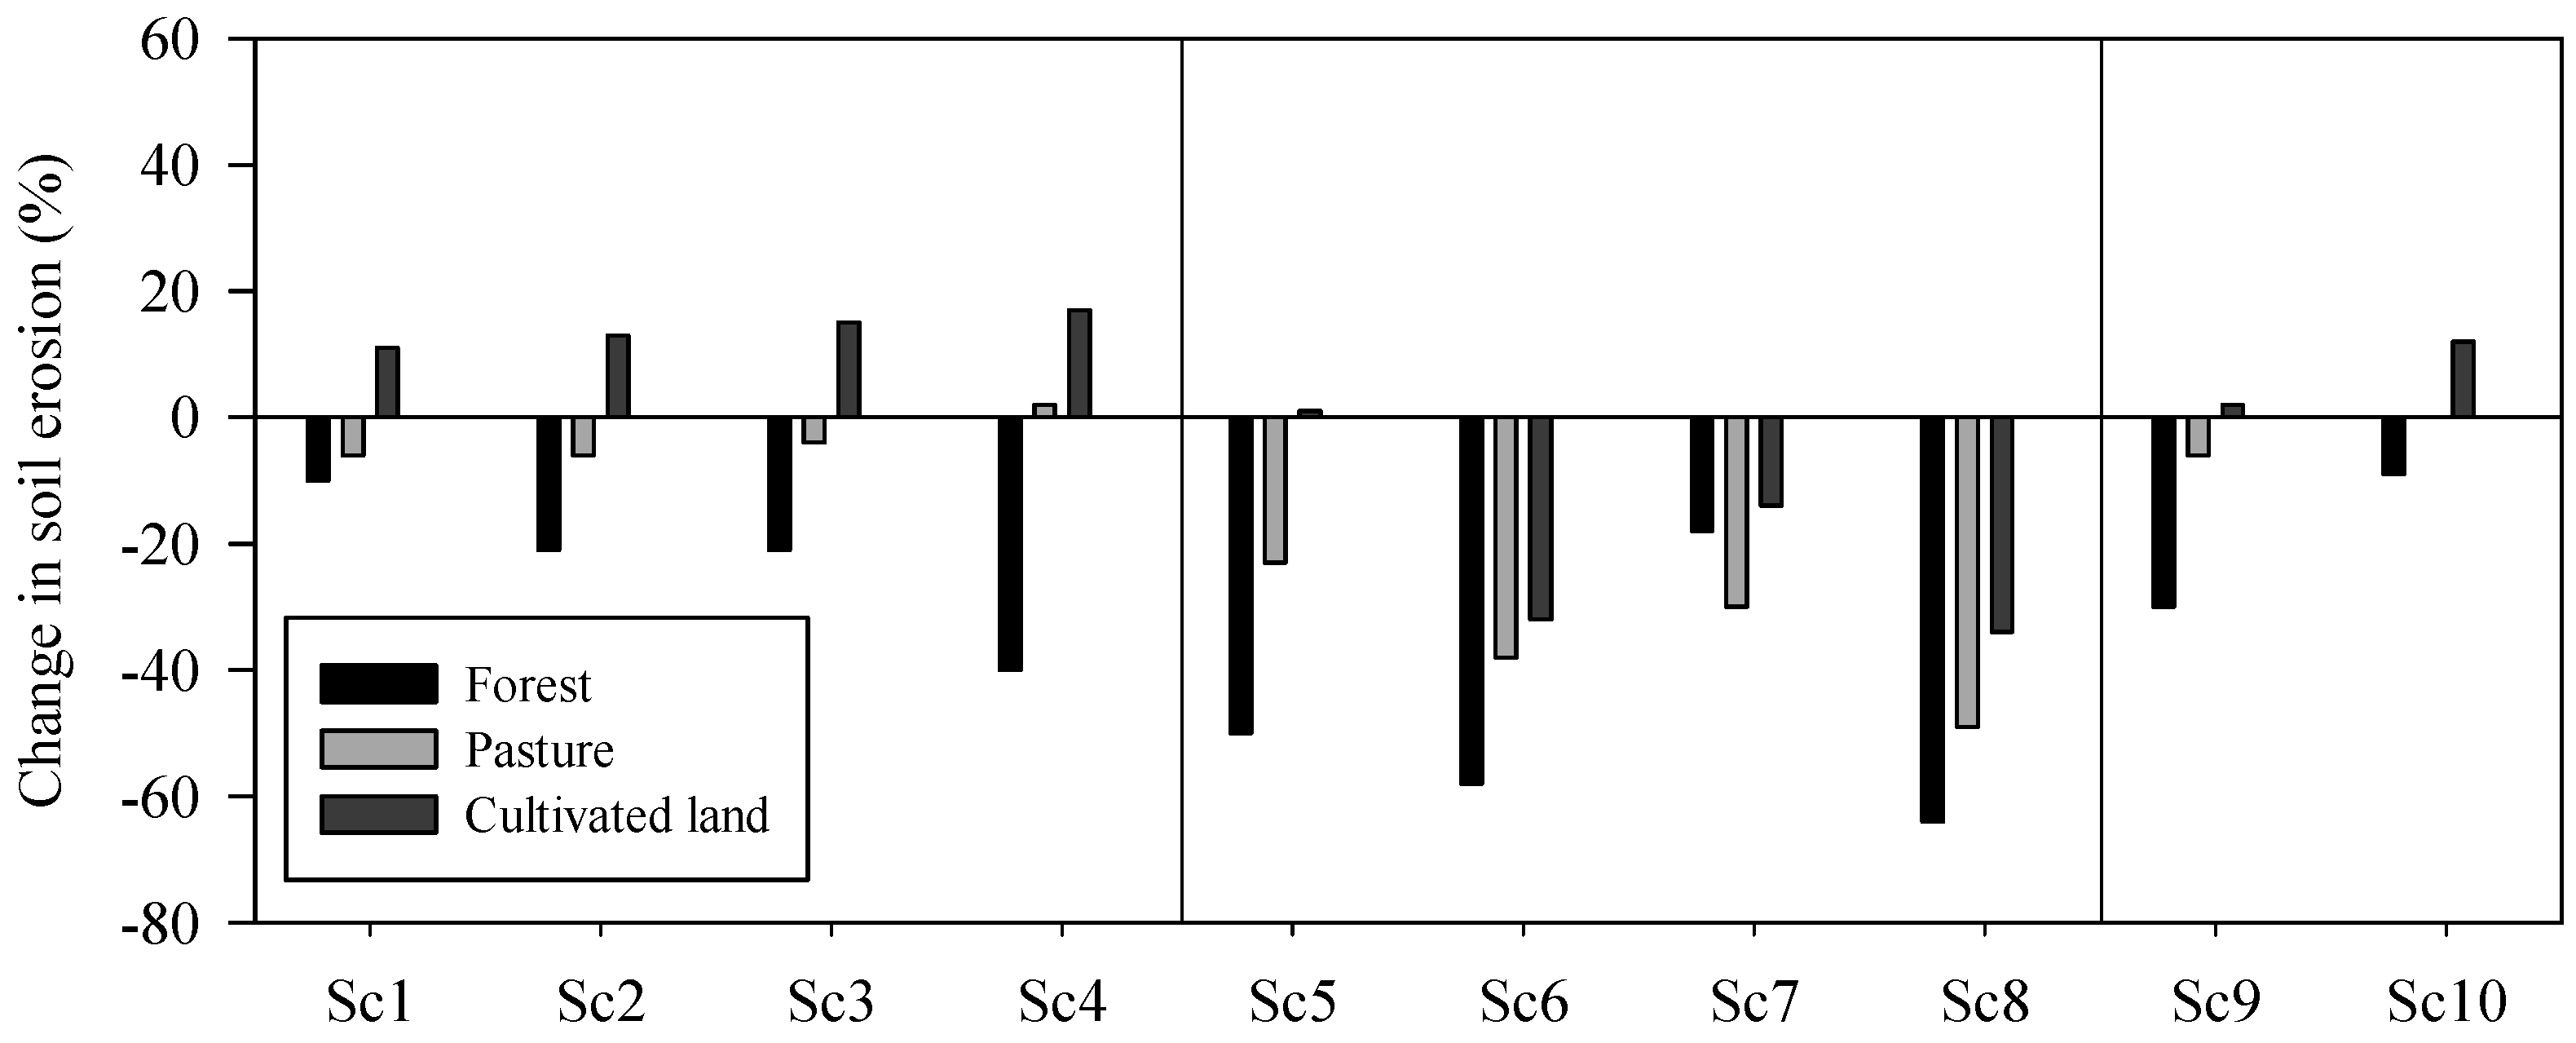
3.1. Effects of Changes in Temperature, Rainfall or CO2 Concentration in Suspended Sediment Yield

Similar to streamflow variation [14], suspended sediment yield in the study catchment is affected by changes in rainfall and, to a lesser extent, by temperature and CO2 concentration, with the largest deviations from the reference values taking place in the late-century period (Figure 3). Significant differences (p < 0.05) were observed between the reference period (1981–2010) and all scenarios, except Sc1 (T + mean 2031–2060 °C) and Sc9 (1.5 × CO2). A reduction in sediment yield is predicted both with increasing temperature and with decreasing rainfall, with differences from the current values in the order of −1% (0.01 t·ha−1·year−1) to −8% (0.007 t·ha−1·year−1) for simulations that use the mean temperature increments (scenarios 1 and 3) and −9% (0.008 t·ha−1·year−1) to −25% (0.23 t·ha−1·year−1) in those run with mean reductions in rainfall (scenarios 5 and 7). A decrease of 20% (0.18 t·ha−1·year−1) for the period 2031–2060 and 36% (0.33 t·ha−1·year−1) for 2069–2098 was forecast for the scenarios with a greater reduction in rainfall (scenarios 6 and 8). Higher CO2 concentration in the atmosphere is predicted to increase sediment yield by 3% (0.03 t·ha−1·year−1) for the intermediate future and by 10% (0.07 t·ha−1·year−1) for the distant future. This is basically due to higher streamflow associated with a decrease in evapotranspiration, related to stomatal closure of plant leaves in response to increasing CO2 concentration [14]. The forecast increase in sediment yield is probably overestimated, because SWAT overestimates the reduction of stomatal conductance due to increased CO2 concentration [62,63] and consequently, the reduction in evapotranspiration. With increased CO2 concentrations, the evapotranspiration capacity from all sources are reduced, including those that are not mediated by plant transpiration (i.e., evaporation properly attributed to canopy interception and surface soil storage) and, therefore, are not affected by changes in the behavior of leaf stomata.
The effects of climate variables on suspended sediment were more noticeable on a seasonal level (Figure 4), highlighting the role of seasonal climate variations in affecting future suspended sediment yield and illustrating the need to look beyond mean annual temperature and rainfall. As shown in Figure 4, a decrease of suspended sediment yield in all seasons except winter was forecast, when including changes in both temperature and rainfall, mainly due to a lower water discharge [14]. However, a different trend was observed in the suspended sediment response as changes in temperature or rainfall occur, demonstrating that these variables affect the runoff differently, and therefore, erosion processes. Thus, simulations that introduce changes in rainfall showed an increase in suspended sediment yield during the winter, probably linked to increased rainfall in December (Figure 2), which could promote soil erosion in cultivated land due to the generally low vegetation cover in these areas during the cold season. The most significant declines in sediment were predicted in spring and autumn, i.e., the seasons with the highest reduction in rainfall (in absolute terms), thus reducing its power of erosion. On the contrary, when temperature is modified, the model results indicated a higher decrease in summer, following the same trend as streamflow (for details see Arias et al. [14]). However, this reduction has little effect on annual sediment export because sediment discharge in summer only accounts for a small percentage (2%) of the annual sediment yield.
The above results, except for differences in magnitude, are similar to those obtained for streamflow in the study area [14], not least because sediment yield at the catchment outlet is often influenced by the streamflow [13,64], although this does not always happen. For example, Ficklin et al. [58] when analyzing the sensitivity of suspended sediment yield to increased CO2 concentrations, observed a decrease in suspended sediment yield linked to increased streamflow. This behavior was attributed to the MUSLE’s reduced coverage factor, together with increased residues in soil with higher CO2 concentrations, showing that the cover factor of the USLE (USLE-C), which in SWAT is regulated by the amount of residue on the soil surface [39], was the parameter exerting the greatest influence on suspended sediment estimation.
Sediment transport is strongly linked to soil erosion, which in turn is predicted to decrease as a result of a reduced amount of rainfall (Figure 5). Similar results have been reported in other humid regions for climate change scenarios forecasting a reduction in rainfall [16]. On the contrary, the increase in temperature is projected to cause a rise [11% (0.3 t·ha−1·year−1)–17% (0.6 t·ha−1·year−1)] in erosion rates in cultivated areas due to the decrease of vegetation cover, while soil erosion in pasture and forest land (i.e., surfaces with permanent vegetation cover) will decline due to the dense vegetation cover (100%) provided by both types of land use. This is important because current soil erosion rates in crop fields in the study area are often superior to the soil formation rate [65,66], although these figures should be interpreted with caution as there is a high uncertainty in assessing erosion rates as “tolerable” or not in terms of net soil erosion, as soil formation rates continue to be poorly known. The existing estimates point to a rate of soil formation for the conditions prevailing in Europe of 1.4 t·ha−1·year−1, with large variations between regions [65,66]. Given the previous figure, an increase in soil erosion in these areas can have a significant potential impact, exacerbating current soil loss problems and reducing soil productivity by removing the most fertile topsoil. However, decreases in soil erosion under pasture and eucalyptus forest have a lesser impact, since current soil losses are already small.
The increase in erosion rates in cultivated land—the dominant sediment source in the study area [37]—could be due, as was found in other studies (e.g., [11]), to the reduction of plant biomass, which was forecast to fall between 7% and 33%, depending on the temperature scenarios used [14]. Erosion is affected by the canopy of vegetation (which reduces the impact of rainfall energy), by crop residues (which protect the soil from the impact of raindrops and drastically reduce the rate of soil particle detachment and sediment transport capacity), and by plant roots and decomposing litter, which mechanically fix the soil in place and provide a medium for microorganisms to thrive. The results of this study seems to indicate that, with increased temperatures, the reduction of plant biomass has a greater effect on soil erosion than on runoff, leading to an increase in soil erosion, even if runoff decreased.

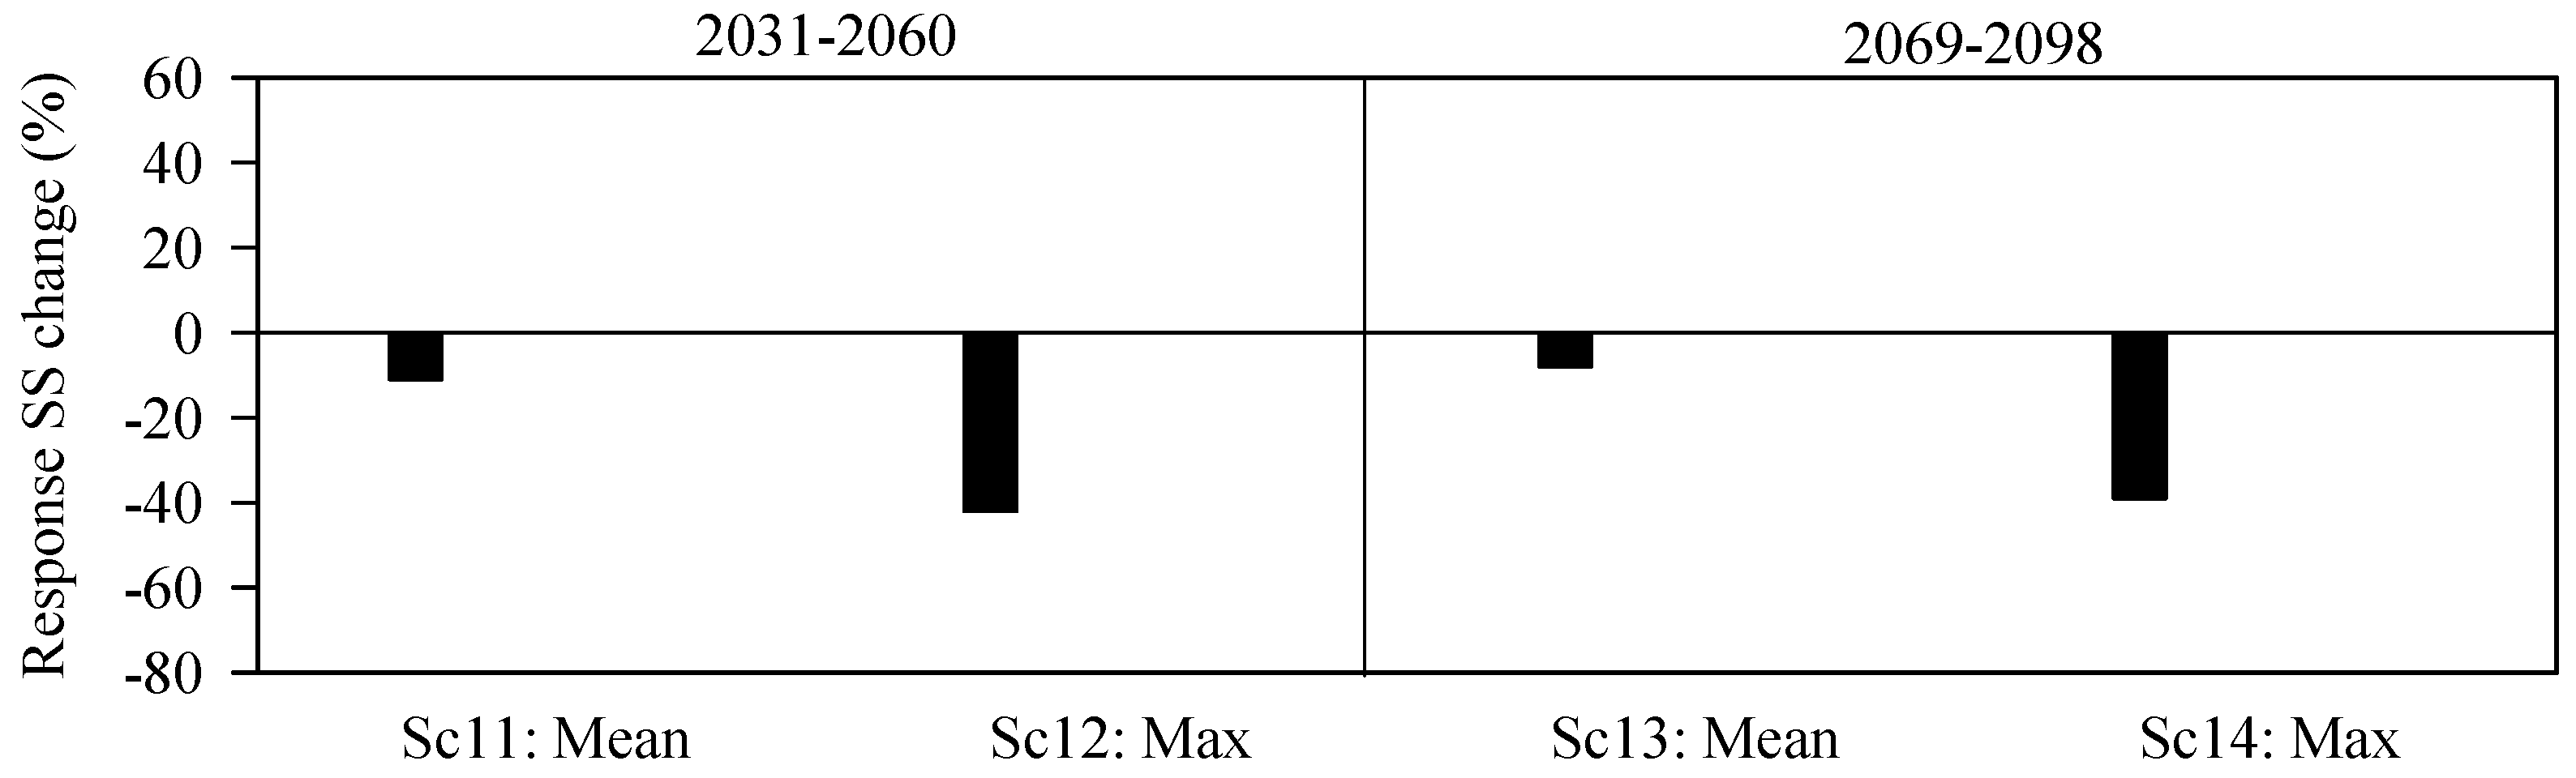
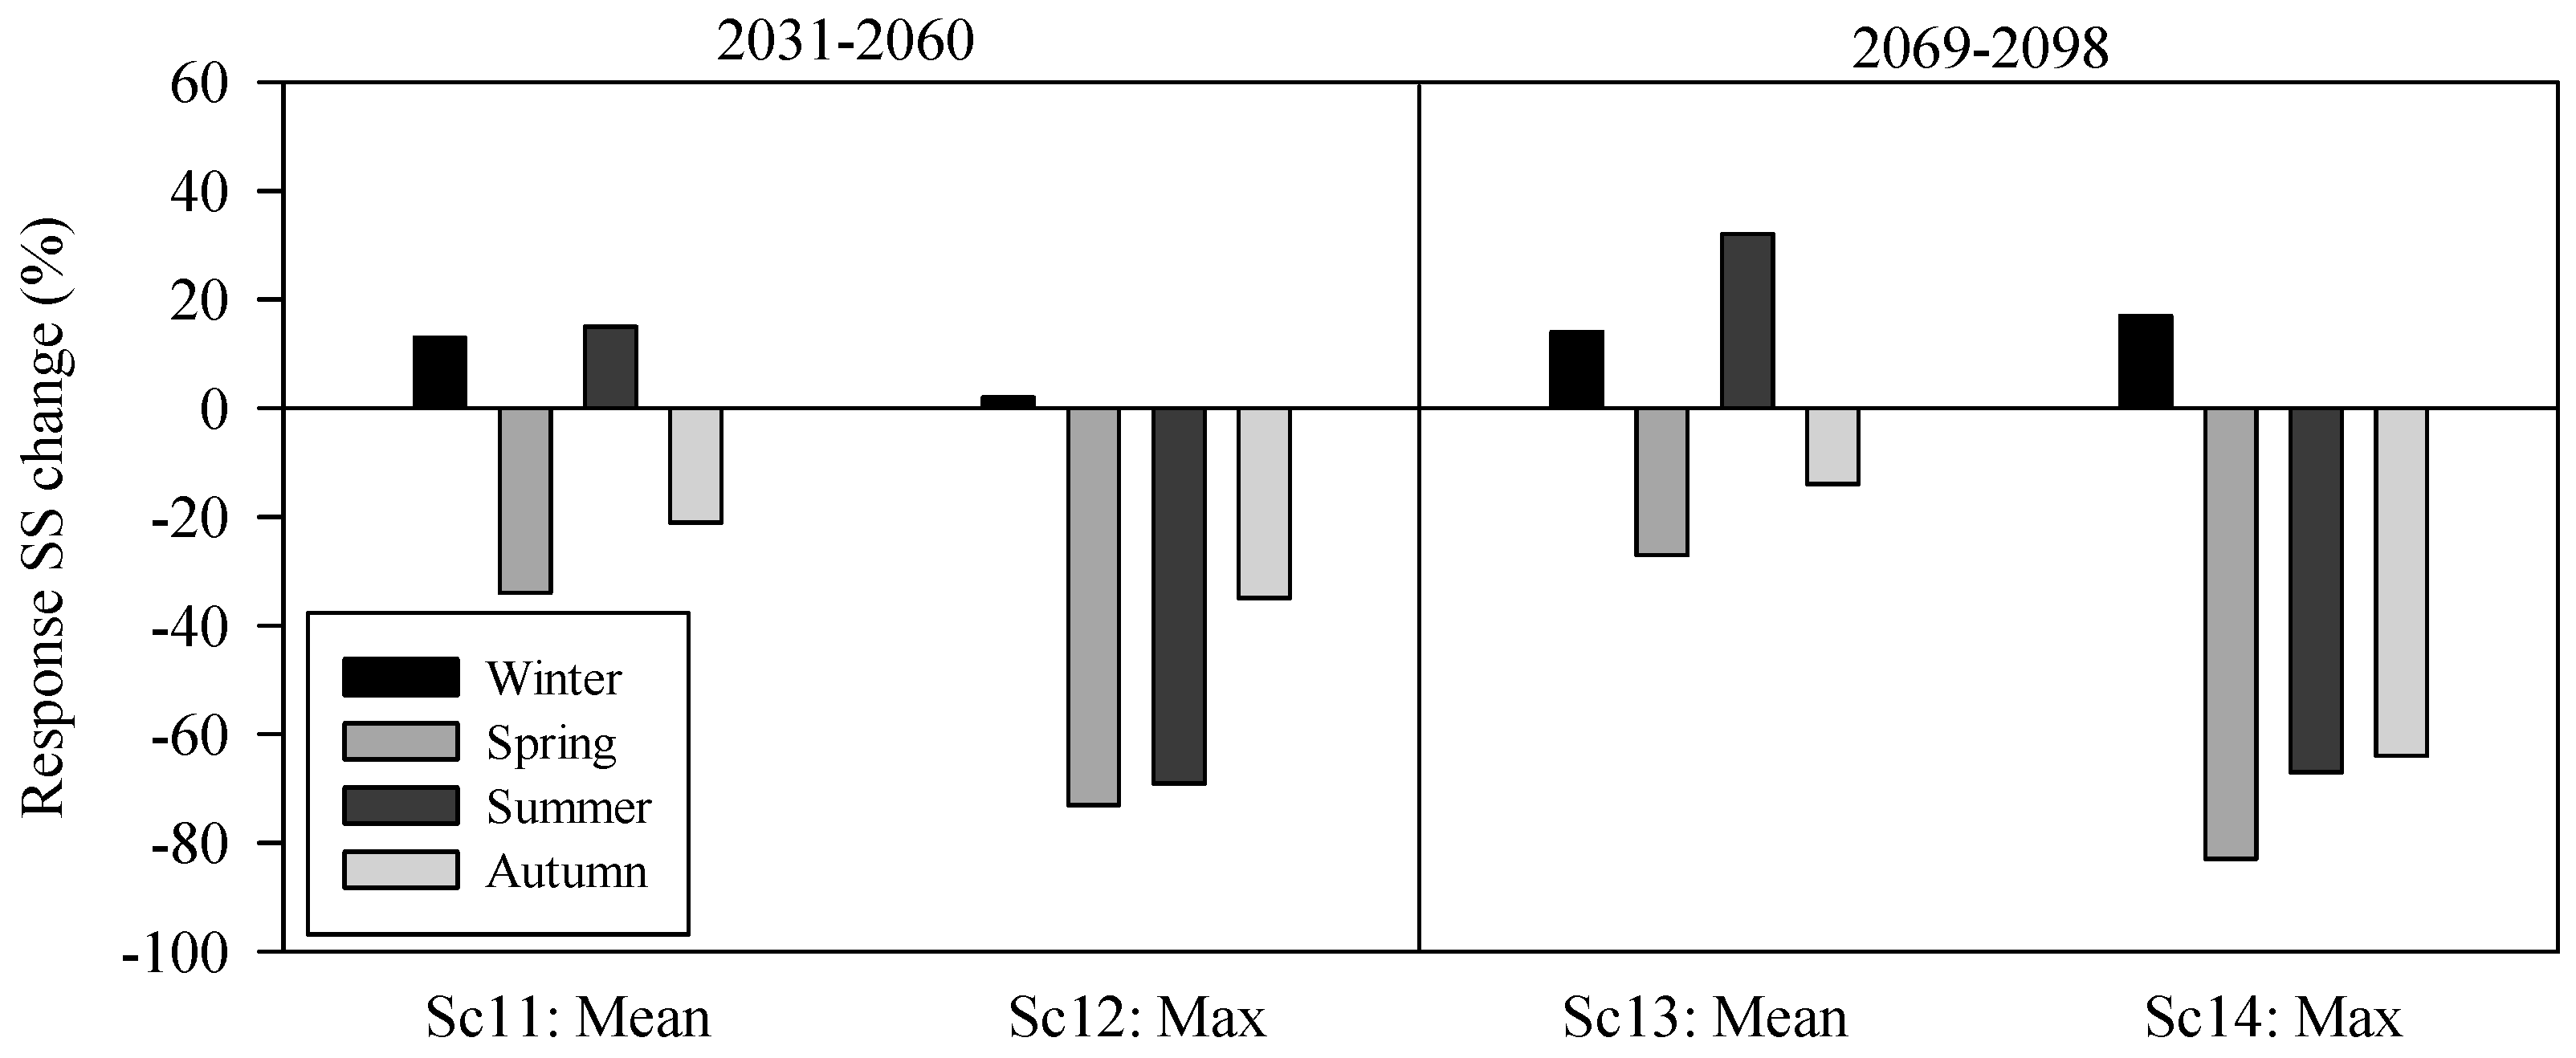
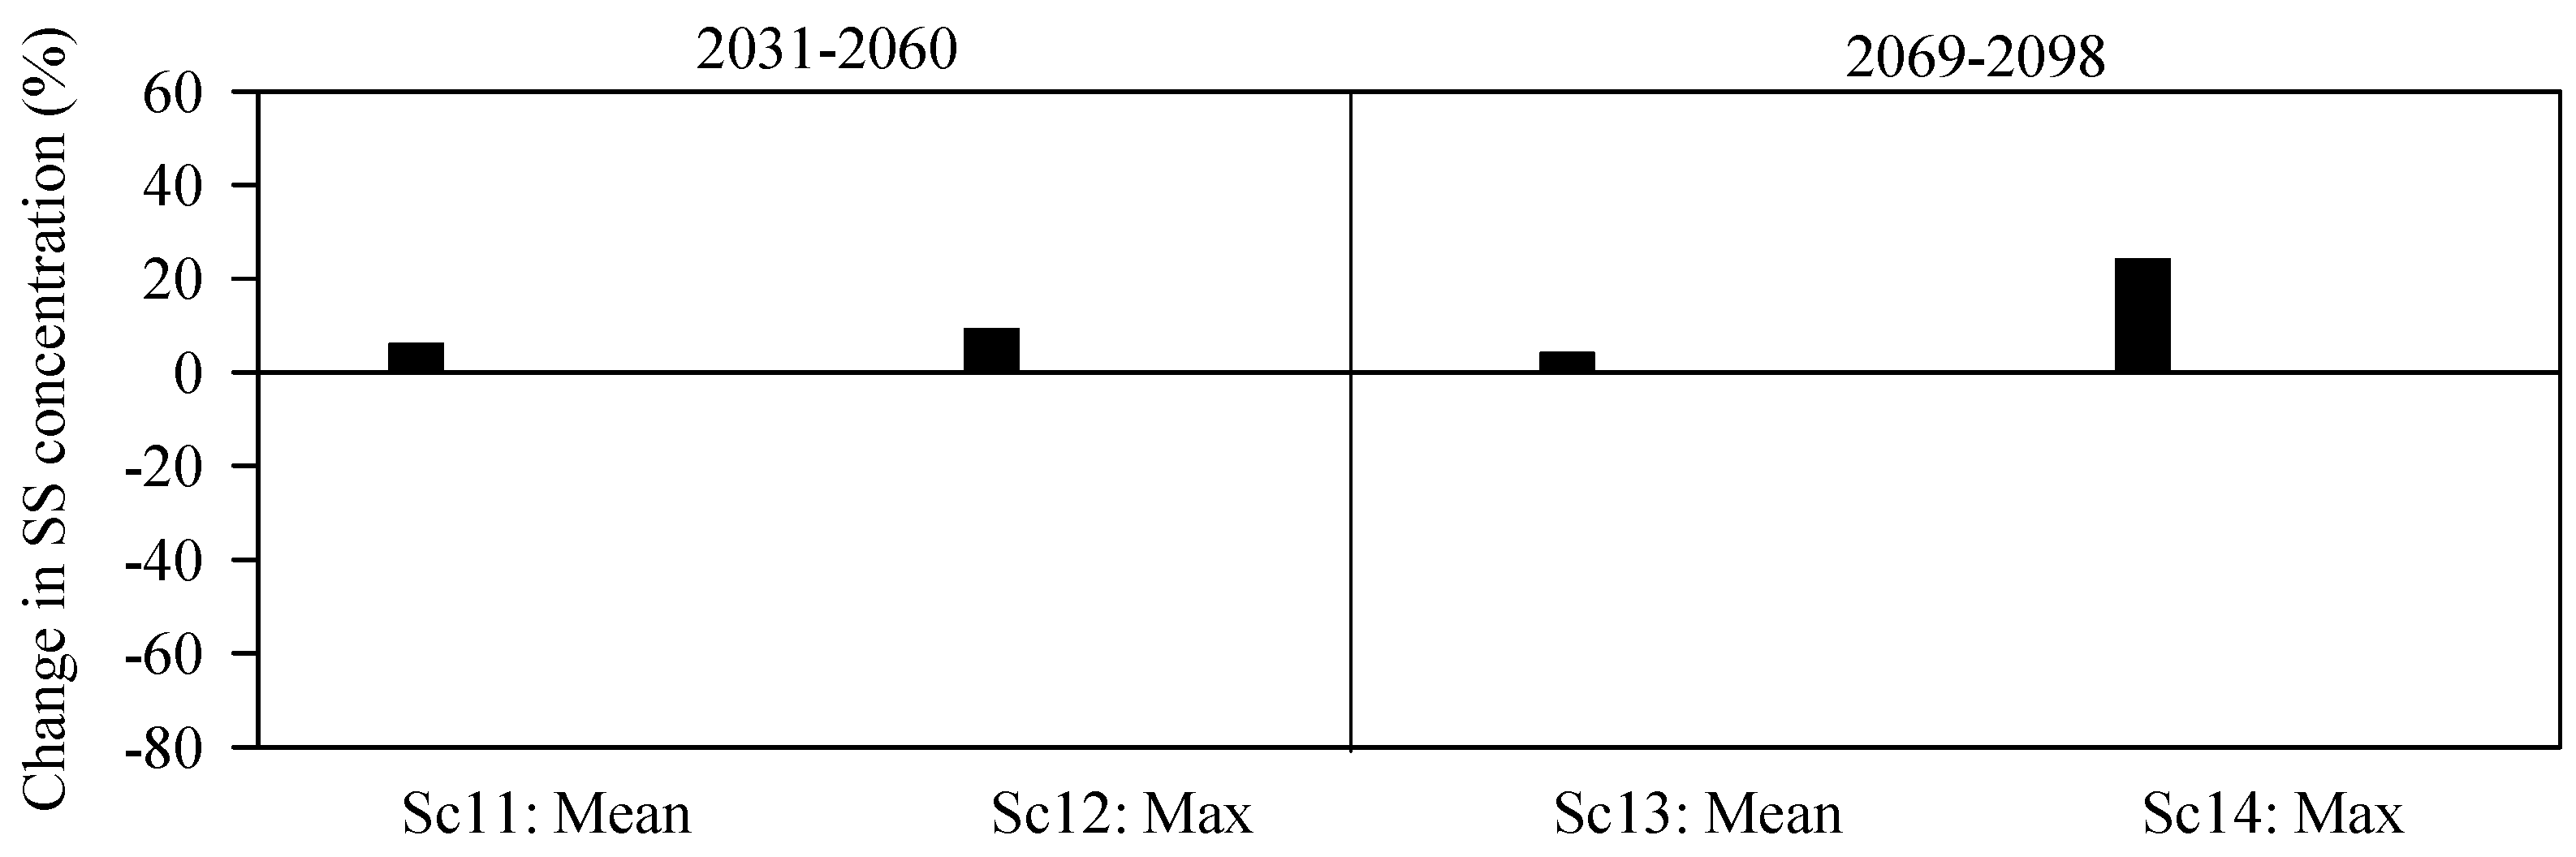
3.2. Effects of Simultaneous Changes in Climate Parameters in Suspended Sediment Yield

The response of suspended sediment yield to combined changes in temperature, rainfall and CO2 concentration is shown in Figure 6. In this catchment, the simulations run using the mean variations (scenarios 11 and 13) give sediment yields 11% (0.10 t·ha−1·year−1) and 8% (0.07 t·ha−1·year−1) lower than the baseline period for 2031–2060 and 2069–2098, respectively, while those performed with maximum anomalies (scenarios 12 and 14) predicted decreases in the mean annual sediment yield of 42% (0.39 t·ha−1·year−1) for the mid-century and 39% (0.36 t·ha−1·year−1) for the late-century period. These results indicate that coupled climate parameter changes had a synergistic effect on suspended sediment in comparison with the results obtained when changing climate parameters separately (temperature or rainfall or CO2 concentration), causing an increase in vulnerability to change. Suspended sediment yield is expected to decrease because of a reduction in streamflow and rainfall—major factors controlling sediment transport capacity. These results are consistent with those observed by Mukundan et al. [67], Zabaleta et al. [13] and Serpa et al. [16], among others; these authors also attributed the sediment yield decrease to a lesser streamflow. Conversely, in some areas of the Yangtze basin in China, Zhu et al. [68] observed an increase in sediment yield with the decrease of streamflow, due to higher rates of soil erosion.
Regarding the seasonal pattern (Figure 7), sediment yield is projected to increase in winter, but in no case goes toward compensating for the losses of the other three seasons. A higher sediment yield in winter, when streamflow decreases, is related to increased soil erosion in crop areas, indicating that the effect of soil erosion in winter is stronger than sediment transport capacity. In the other seasons, the sediment yield decrease is associated with a reduced streamflow. Mukundan et al. [67] using the SWAT model to analyze the effect of climate change on soil erosion and sediment yield in the US, attributed the decrease in soil erosion in summer to the advance of the growing season, because this phenological change affects the quantity of crop residue and the length of time that it remains in the soil and, therefore, soil erosion. In the study catchment, a plant biomass increase in cultivated areas was observed during spring, possibly related to the onset of the growing season for maize. However, a decrease in biomass production, associated with more days with heat stress, was predicted in summer, resulting in a slight increase in soil erosion, while sediment yield decreased.
The above results show that climate change is likely to have a significant impact on sediment yield in the study area. The decrease in streamflow will inevitably involve an attenuation in the suspended sediment yield. Obviously, this reduction will have benefits in terms of sediment-associated pollutants, such as phosphorus and heavy metal elements, because the transfer of phosphorus and metals from soils to surface waters in the Corbeira catchment is mostly through the medium of suspended particles [26,28]. However, the suspended sediment concentration will undergo a slight increase (Figure 8) causing a deterioration in water quality. For scenarios 11 and 13 (mean anomalies), an increase of suspended sediment concentrations of 6% (1.2 mg·L−1) and 4% (0.8 mg·L−1) for the periods 2031–2060 and 2069–2098 is projected, while for scenarios 12 and 14 (maximum anomalies) increases of 9% (1.7 mg·L−1) and 25% (4.6 mg·L−1) for the same horizons are estimated. The mean suspended concentrations could reach 25 mg·L−1, i.e., the guideline threshold set by legislation for drinking water (Directive 75/440/EEC) [19] and fish life (Directive 2006/44/EEC) [20]. Moreover, it is quite likely that soil erosion will increase in cultivated areas, requiring the adoption of new management practices aimed at its reduction. Replacing the present crops or carrying out actions to combat soil erosion (e.g., reduced tillage, management of plant residue) may decrease soil erosion in these areas. The results should be viewed with caution due to uncertainties met in evaluating climate change impacts on sediment yield, i.e., in emission scenarios, global climatic projections, downscaling methods and model simulations. For example, the downscaling technique used in this study—the change factor method—ignores changes in the variability of climate variables and assumes that the spatial pattern of climate will remain constant [69]. However, apart from this drawback, the change factor method also presents several advantages, such as simplicity and speed of calculation, and direct scaling of projections, which only requires information from global or regional climate models on a monthly scale. The SWAT model simulations are another source of uncertainty, due to difficulty in using the model to estimate sediment transport. As a number of researchers have pointed out [13,33,34,43,70] SWAT has limitations in representing the short, rapid rainfall–runoff events that typically occur in small catchments, such as Corbeira, and that will probably increase in the future. Moreover, MUSLE, the method used in SWAT to estimate sediment yield, does not include the characteristics of events, such as the erosive power or duration of rainfall, which might result in model error for assessing erosion, because these variables affect soil detachment by raindrops and transport of detached particles by runoff. This highlights the need for additional research to develop enhancements in SWAT (for example modifying the model to take the rainfall intensity and its duration into account) to improve its performance for sediment yield, particularly in a small catchment.
The forest biomass will increase with rising temperatures [14]. About 65% of the Corbeira is under eucalyptus (E. Globulus) forest, a species adapted to warm, humid climates, with no frost and with an annual rainfall exceeding 700 mm, which is well distributed throughout the year. The higher temperatures predicted due to climate change, and consequent lower risk of frost, will accelerate eucalyptus growth, resulting in increased biological cover and less erosion. However, the substantial increase in the quantity and continuity of biomass present on the ground (i.e., more fuel in the forest area) coupled with an increase in aridity in the study area could cause higher forest fire risks, as outlined by previous studies in Galicia [71,72], which, in turn, could have a strong effect on sediment yields. Forest fires have been one of the most pressing problems in Galicia recently, both from an environmental and economic perspective. Thus, forest fires represent a decline in the quality of air, water and soil, as well as a loss of biodiversity, and cause other environmental problems, such as soil erosion, flooding and avenues. Forest areas in Galicia experienced high post-fire erosion rates due to the combination of an absence of vegetation cover (eliminated by the fire), severe erodibility of burned soils, steep terrain and high levels of rainfall. Thus, soil losses ranging from 1.5 to 21.7 t·ha−1·year−1 have been reported [73], which, under a potential climate change, would make soil erosion a greater concern in forest plantations than in cultivated lands. Despite increased temperatures being predicted to lead to a rise in soil erosion rates in cultivated areas, a reduction in the suspended sediment yield at the catchment outlet is expected as a result of higher temperatures (Figure 3). Soil losses at the Corbeira catchment outlet can be several times lower than the ones measured in the fields [66]. Ultimately, it is the combination of changes in transport capacity and erosion rates which determine the flow and concentration of sediment in the river. In the study catchment, higher temperatures are expected to reduce transport capacity, and the rise in in-stream deposition as a response to lower streamflow is responsible for the decrease in sediment yield. Therefore, reduced transport capacity will have a stronger effect than further erosion. Even so, catchment management strategies should aim to minimize soil erosion in crop fields, as these are the critical source of sediment and phosphorus in the study catchment [22,37].
This study did not address the effect of land use on the sediment yield, since it was restricted to investigating only the direct impacts of climate change (i.e., changes in temperature, rainfall and CO2 concentration) on sediment yield, with no consideration given to the potentially increased/decreased sediment yield through changes in land use/land cover, which is a limitation of the study. The effect of land use on future streamflow and sediment yield is controversial [16,74,75,76]. Some studies have shown that streamflow and sediment yield may be more affected by climate change than changes in land use [74,76], while other studies have highlighted that the effect of changing land use can far outweigh any climate change [16,75]. This underlines the need to understand synergies and feedback between climate and land use change to predict streamflow and sediment yield accurately under future climate change [69]. This issue will be the objective of further research into water quantity and quality in the Corbeira catchment. Moreover, additional research will be conducted in order to assess the impact of forest fires on sediment yield, since fires are a recurrent and serious threat to the forest in Galicia, causing heavy environmental, social and economic damage. Special emphasis will also be placed on reducing the uncertainties that accompany the evaluation of climate change impacts on water resources, particularly the use of statistical downscaling methods to generate specific daily resolution future climate change scenarios.

4. Summary and Conclusions

The results from the present study showed the noticeable sensitivity of suspended sediment to changes in temperature and rainfall in the Corbeira catchment. Similarly, both the medium and long-term effects of climate change on sediment were significant. The suspended sediment response to climate change generally followed the patterns of simulated changes in streamflow. The results showed a fall in suspended sediment of 11% and 8% for the periods 2031–2060 and 2069–2098, respectively, further decreasing up to 42% in the worst case (maximum anomalies) by the late-century. However, a deterioration in the quality of water in the Corbeira stream is expected because suspended sediment is projected to increase. The model also predicted an increase in soil erosion in cultivated areas due to increased temperature, which can have a significant impact, as soil erosion is currently higher than the rate of soil formation for the conditions prevailing in Europe (1.4 t·ha−1·year−1) and, therefore, under a potential climate change scenario, the existing problems will be exacerbated. This should be taken into account when designing management plans for the catchment. This study was conducted as a first approach to the impact of climate change on suspended sediment in NW Spain, with the aim to illustrate the direction and magnitude of changes that could take place in the Corbeira catchment in response to possible climate change, provide data to decision makers and serve as a reference for catchments with similar characteristics.

Acknowledgments

This paper is a contribution to the projects 10MDS103031 of the Xunta of Galicia, and CGL2014-56907-R of the Programa Estatal de Investigación, Desarrollo e Innovación Orientada a los Retos de la Sociedad funded by the Spanish Ministry of Economy and Competitiveness. The first author was a recipient of a post-doctoral research contract (Ángeles Alvariño) funded by the Xunta of Galicia and now is beneficiary of a Juan de la Cierva research contract supported by the Spanish Ministry of Economy and Competitiveness. The authors thank the editor and the three anonymous reviewers for helping to improve the manuscript with their constructive comments and suggestions.

Author Contributions

All authors contributed to the design and development of this manuscript under the supervision of M. Teresa Taboada Castro.

Conflicts of Interest

The authors declare no conflict of interest.

References

  1. Poff, N.L.; Allan, J.D.; Mark, B.B.; Karr, J.R.; Prestegaard, K.L.; Richter, B.D.; Sparks, R.E.; Stromberg, J.C.; Julie, C. The natural flow regime: A paradigm for river conservation and restoration. Bioscience 1997, 47, 769–784. [Google Scholar] [CrossRef]
  2. Dunne, T.; Leopold, L.B. Water in Environmental Planning; Freeman W.H.: San Francisco, CA, USA, 1978; p. 818. [Google Scholar]
  3. Valero-Garcés, B.L.; Navas, A.; Machín, J.; Walling, D. Sediment sources and siltation in mountain reservoirs: A case study from the Central Spanish Pyrenees. Geomorphology 1999, 28, 23–41. [Google Scholar] [CrossRef]
  4. Bilotta, G.S.; Krueger, T.; Brazier, R.E.; Butler, P.; Freer, J.; Hawkins, J.M.B.; Haygarth, P.M.; Macleod, C.J.A.; Quinton, J.N. Assessing catchment-scale erosion and yields of suspended solids from improved temperate grassland. J. Environ. Monit. 2010, 12, 731–739. [Google Scholar] [CrossRef] [PubMed] [Green Version]
  5. Lehner, B.; Doll, P.; Alcamo, J.; Henrichs, T.; Kaspar, F. Estimating the impact of global change on flood and drought risks in Europe: A continental integrated analysis. Clim. Chang. 2006, 75, 273–299. [Google Scholar] [CrossRef]
  6. Kundzewics, Z.; Mata, L.; Arnell, N.; Döll, P.; Jimenez, B.; Miller, K.; Oki, T.; Sen, Z.; Shiklomanov, I. The implications of projected climate change for freshwater resources and their management. Hydrol. Sci. J. 2008, 53, 3–10. [Google Scholar] [CrossRef]
  7. Kovats, S.; Valentini, R. Chapter 23: Europe. In IPCC WGII AR5, IPCC Working Group II; Technical Support Unit: Stanford, CA, USA, 2014. [Google Scholar]
  8. Intergovernmental Panel on Climate Change (IPCC). Impacts, Adaptation, and Vulnerability. Part A: Global and Sectoral Aspects. Contribution of Working Group II to the Fifth Assessment Report of the Intergovernmental Panel on Climate Change; Field, C.B., Barros, V.R., Dokken, D.J., Mach, K.J., Mastrandrea, M.D., Bilir, T.E., Chatterjee, M., Ebi, K.L., Estrada, Y.O., Genova, R.C., et al., Eds.; Cambridge University Press: Cambridge, UK; New York, NY, USA, 2014. [Google Scholar]
  9. Rodrigo, F.S. Changes in the probability of extreme daily precipitation observed from 1951 to 2002 in the Iberian Peninsula. Int. J. Climatol. 2010, 30, 1512–1525. [Google Scholar] [CrossRef]
  10. Barranco, L.M.; Alvarez-Rodriguez, J.; Olivera, F.; Potenciano, A.; Quintas, L.; Estrada, F. Assessment of the expected runoff change in Spain using climate simulations. J. Hydrol. Eng. 2014, 19, 1481–1490. [Google Scholar] [CrossRef]
  11. Nunes, J.P.; Seixas, J.; Pacheco, N.R. Vulnerability of water resources, vegetation productivity and soil erosion to climate change in Mediterranean watersheds. Hydrol. Process. 2008, 22, 3115–3134. [Google Scholar] [CrossRef]
  12. Estrela, T.; Pérez-Martin, M.A.; Vargas, E. Impacts of climate change on water resources in Spain. Hydrol. Sci. J. 2012, 57, 1154–1167. [Google Scholar] [CrossRef]
  13. Zabaleta, A.; Meaurio, M.; Ruiz, E.; Antigüedad, I. Simulation climate change impact on runoff and sediment yield in a small watershed in the Basque Country, northern Spain. J. Environ. Qual. 2014, 43, 235–245. [Google Scholar] [CrossRef] [PubMed]
  14. Arias, R.; Rodríguez-Blanco, M.L.; Taboada-Castro, M.M.; Nunes, J.P.; Keizer, J.J.; Taboada-Castro, M.T. Water resources response to changes in temperature, rainfall and CO2 concentration: A first approach in NW Spain. Water 2014, 6, 3049–3067. [Google Scholar] [CrossRef]
  15. Pulido-Velazquez, M.; Peña-Haro, S.; García-Prats, A.; Mocholi-Almudever, A.F.; Henriquez-Dole, L.; Macian-Sorribes, H.; Lopez-Nicolas, A. Integrated assessment of the impact of climate and land use changes on groundwater quantity and quality in the Mancha Oriental system (Spain). Hydrol. Earth Syst. Sci. 2015, 19, 1677–1693. [Google Scholar] [CrossRef]
  16. Serpa, D.; Nunes, J.P.; Santos, J.; Sampaio, E.; Jacinto, R.; Veiga, S.; Lima, J.C.; Moreire, M.; Corte-Real, J.; Keizer, J.J.; et al. Impacts of climate and land use changes on the hydrological and erosion processes of two contrasting Mediterranean catchments. Sci. Total Environ. 2015, 538, 64–77. [Google Scholar] [CrossRef] [PubMed]
  17. Bussi, G.; Francés, F.; Horel, E.; López-Tarazón, J.A.; Batalla, R.J. Modelling the impact of climate change on sediment yield in a highly erodible Mediterranean catchment. J. Soils Sediments 2014, 14, 1921–1937. [Google Scholar] [CrossRef]
  18. Shrestha, B.; Babel, M.S.; Maskey, S.; van Griensven, A.; Uhlenbrook, S.; Green, A.; Akkharath, I. Impact of climate change on sediment yield in the Mekong River basin: A case study of the Nam Ou basin, Lao PDR. Hydrol. Earth Syst. Sci. 2013, 17, 1–20. [Google Scholar] [CrossRef]
  19. European Council Directive 75/440/CEE of the 16 June 1975 for Provision of Water to Provide Potable Water. Available online: http://eur-lex.europa.eu/legal-content/en/ALL/?uri=CELEX:31975L0440 (accessed on 22 September 2016).
  20. Council Directive 2006/44/EC of the 6 September 2006 on the Quality of Fresh Waters Needing Protection or Improvement in Order to Support Fish Life. Available online: http://eur-lex.europa.eu/LexUriServ/LexUriServ.do?uri=OJ:L:2006:264:0020:0031:EN:PDF (accessed on 22 September 2016).
  21. Steegen, A.; Govers, G.; Takken, I.; Nachtergaele, J.; Poesen, J.; Merckx, R. Factors controlling sediment and phosphorus export from two Belgian agricultural catchments. J. Environ. Qual. 2001, 30, 1249–1258. [Google Scholar] [CrossRef] [PubMed]
  22. Rodríguez-Blanco, M.L.; Taboada-Castro, M.M.; Taboada-Castro, M.T. Linking the field to the stream: Soil erosion and sediment yield in a rural catchment NW Spain. Catena 2013, 102, 74–81. [Google Scholar] [CrossRef]
  23. Asselman, N.E.M.; Middelkoop, H.; van Dijk, P.M. The impact of changes in climate and land use on soil erosion, transport and deposition of suspended sediment in the River Rhine. Hydrol. Process. 2003, 17, 3225–3244. [Google Scholar] [CrossRef]
  24. Syvitski, J.P.M.; Peckham, S.D.; Hilberman, R.; Mulder, T. Predicting the terrestrial flux of sediment to the global ocean: A planetary perspective. Sediment. Geol. 2003, 162, 5–24. [Google Scholar] [CrossRef]
  25. Taboada-Castro, M.M.; Rodríguez-Blanco, M.L.; Palleiro, L.; Taboada-Castro, M.T. Importancia de la cubierta vegetal en procesos de erosión por flujo concentrado en ambiente templado húmedo: Un estudio a escala de cuenca. In Proceedings of the IV Congreso de la Ciencia del Suelo: Suelo Funciones y Manejo, Granada, Spain, 21–24 September 2010; pp. 565–574.
  26. Rodríguez-Blanco, M.L.; Taboada-Castro, M.M.; Taboada-Castro, M.T. Phosphorus transport into a stream draining from a mixed land use catchment in Galicia (NW Spain): Significance of runoff events. J. Hydrol. 2013, 481, 12–21. [Google Scholar] [CrossRef]
  27. Palleiro, L.; Rodríguez-Blanco, M.L.; Taboada-Castro, M.M.; Taboada-Castro, M.T. Hydroclimatic control of sediment and metal export from a rural catchment in northwestern Spain. Hydrol. Earth Syst. Sci. 2014, 18, 3663–3673. [Google Scholar] [CrossRef]
  28. Soto-Varela, F.; Rodríguez-Blanco, M.L.; Taboada-Castro, M.M.; Taboada-Castro, M.T. Metals discharged during different flow conditions from a mixed agricultural-forest catchment (NW Spain). Hydrol. Process. 2015, 29, 1644–1655. [Google Scholar] [CrossRef]
  29. Álvarez, V.; Taboada, J.J.; Lorenzo, M.N. Cambio climático en Galicia en el siglo XXI: Tendencias y variabilidad en temperaturas y precipitaciones (Climate change in Galicia by the XXI century: Tendencies and variability in temperatures and precipitation). Revista Avances Ciencias Terra (ACT) 2011, 2, 65–85. [Google Scholar]
  30. Gassman, P.W.; Reyes, M.R.; Green, C.H.; Arnold, J.G. The soil and water assessment tool: Historical development, applications, and future research directions. Trans. ASABE 2007, 50, 1211–1250. [Google Scholar] [CrossRef]
  31. Wu, Y.; Liu, S.; Gallant, A.L. Predicting impacts of increased CO2 and climate change on the water cycle and water quality in the semiarid James River Basin of the Midwestern USA. Sci. Total Environ. 2012, 430, 150–160. [Google Scholar] [CrossRef] [PubMed]
  32. Glavan, M.; Ceglar, A.; Pintar, M. Assessing the impacts of climate change on water quality and quality modelling in small Slovenian Mediterranean catchment—Lesson for policy and decision makers. Hydrol. Process. 2015, 29, 3124–3144. [Google Scholar] [CrossRef]
  33. Rodríguez-Blanco, M.L.; Arias, R.; Taboada-Castro, M.M.; Nunes, J.P.; Keizer, J.J.; Taboada-Castro, M.T. Sediment yield at catchment scale using the SWAT Model. Soil Sci. 2016, 181, 326–334. [Google Scholar] [CrossRef]
  34. Instituto Tecnológico Geominero de España (IGME). Mapa Geológico de España, 1:50,000. Hoja 45. Betanzos; Servicio de Publicaciones del Ministerio de Industria y Energía: Madrid, Spain, 1981.
  35. IUSS Working Group WRB. World Reference Base for Soil Resources 2014, Update 2015. International Soil Classification System for Naming Soils and Creating Legends for Soil Maps; World Soil Resources Reports No. 106; FAO: Rome, Italy, 2015. [Google Scholar]
  36. Rodríguez-Blanco, M.L.; Taboada-Castro, M.M.; Taboada-Castro, M.T. Rainfall runoff response and event-based runoff coefficients in a humid area (northwest Spain). Hydrol. Sci. J. 2012, 57, 445–459. [Google Scholar] [CrossRef]
  37. Rodríguez-Blanco, M.L.; Taboada-Castro, M.M.; Taboada-Castro, M.T. Sources and sediment yield from a rural catchment in humid temperate environment, northwest Spain. Earth Surf. Process. Landf. 2010, 35, 272–277. [Google Scholar] [CrossRef]
  38. Arnold, J.G.; Srinivasan, R.; Muttiah, R.S.; Williams, J.R. Large area hydrologic modeling and assessment part I: Model development. J. Am. Water Res. Assoc. 1998, 34, 73–89. [Google Scholar] [CrossRef]
  39. Neitsch, S.L.; Arnold, J.G.; Srinivasan, R.; Williams, J.R. Soil and Water Assessment Tool User’s Manual; Texas Water Resources Institute: Collegue Station, TX, USA, 2002; p. 506. [Google Scholar]
  40. Green, C.H.; van Griensven, A. Autocalibration in hydrologic modeling: Using SWAT2005 in small-scale watersheds. Environ. Model. Softw. 2008, 23, 422–434. [Google Scholar] [CrossRef]
  41. Lee, K.S.; Chung, E.S. Hydrological effects of climate change, groundwater withdrawal, and land use in a small Korean watershed. Hydrol. Process. 2007, 21, 3046–3056. [Google Scholar] [CrossRef]
  42. Ferrant, S.; Oehler, F.; Durand, P.; Ruiz, L.; Salmon-Monviola, J.; Justes, E.; Dugast, P.; Probst, A.; Probst, J.L.; Sanchez-Perez, J.M. Understanding nitrogen transfer dynamics in a small agricultural catchment: Comparison of a distributed (TNT2) and a semi distributed (SWAT) modeling approaches. J. Hydrol. 2011, 406, 1–15. [Google Scholar] [CrossRef] [Green Version]
  43. Qiu, L.; Zheng, F.; Yin, R. SWAT-based runoff and sediment simulation in a small watershed, the loessial hilly-gullied region of China: Capabilities and challenges. Int. J. Sediment Res. 2012, 27, 226–234. [Google Scholar] [CrossRef]
  44. Roth, V.; Lemann, T. Comparing CFSR and conventional weather data for discharge and soil loss modelling with SWAT in small catchments in the Ethiopian Highlands. Hydrol. Earth Syst. Sci. 2016, 20, 921–934. [Google Scholar] [CrossRef]
  45. Williams, J.R. Sediment routing for agricultural watersheds. J. Am. Water Resour. Assoc. 1975, 11, 965–974. [Google Scholar] [CrossRef]
  46. Arnold, J.G.; Williams, J.R. SWRRB—A watershed scale model for soil and water resources management. In Computer Models of Watershed Hydrology; Singh, V.P., Ed.; Water Resources Publications: Highlands Ranch, CO, USA, 1995; pp. 847–908. [Google Scholar]
  47. Wischmeier, W.H.; Smith, D.D. Predicting Rainfall Erosion Losses. A Guide to Conservation Planning; Agriculture Handbook No. 537; U.S. Department of Agriculture, Science and Education Administration, U.S. Govermnet Printing Office: Washington, DC, USA, 1978.
  48. Luo, Y.; He, C.S.; Sophocleous, M.; Yin, Z.F.; Ren, H.R.; Zhu, O.Y. Assessment of crop growth and soil water modules in SWAT 2000 using extensive field experiment data in an irrigation district of the Yellow River Basin. J. Hydrol. 2008, 352, 139–156. [Google Scholar] [CrossRef]
  49. Srinivasan, R.; Zhang, X.; Arnold, J. SWAT ungauaged: Hydrological budget and crop yield predictions in the Upper Mississippi River Basin. Trans. ASABE 2010, 53, 1533–1546. [Google Scholar] [CrossRef]
  50. Khanal, S.; Parajuli, P.B. Sensitivity analysis and evaluation of forest biomass production potential using SWAT Model. JSBS 2014, 4, 136–147. [Google Scholar] [CrossRef]
  51. Monteith, J.L. Climate and the efficiency of crop production in Britian. Philos. Trans. Res. Soc. 1977, 281, 277–329. [Google Scholar] [CrossRef]
  52. Stockle, C.O.; Williams, J.R.; Rosenberg, N.J.; Jones, C.A. A method for estimating the direct and climatic effects of rising atmospheric carbon dioxide on growth and yield of crops: Part I. Modification of the EPIC model for climate change analysis. Agric. Syst. 1992, 38, 225–238. [Google Scholar] [CrossRef]
  53. Moriasi, D.N.; Arnold, J.G.; van Liew, M.W.; Bingner, R.L.; Harmel, R.D.; Veith, T.L. Model evaluation guidelines for systematic quantification of accuracy in watershed simulations. Trans. ASABE 2007, 50, 885–900. [Google Scholar] [CrossRef]
  54. Houghton, J.T.; Ding, Y.; Griggs, D.J.; Noguer, M.; van der Linden, P.J.; Dai, X.; Maskell, K.; Johnson, C.A. Climate change: The scientific basis. In Contribution of Working Group I to the Third Assessment Report of the Intergovernmental Panel on Climate Change; Cambridge University Press: Cambridge, UK; New York, NY, USA, 2001. [Google Scholar]
  55. Nearing, M.A.; Jetten, V.; Baffaut, C.; Cerdan, O.; Couturier, A.; Hernandez, M.; Le Bissonnaise, Y.; Nichols, M.H.; Nunes, J.P.; Renschlerg, C.S.; et al. Modeling response of soil erosion and runoff to changes in precipitation and cover. Catena 2005, 61, 131–154. [Google Scholar] [CrossRef]
  56. Rosenzweig, C.; Hillel, D. Climate Change and the Global Harvest: Potential Impacts of the Greenhouse Effect on Agriculture; Oxford University Press: New York, NY, USA, 1998. [Google Scholar]
  57. Sharpley, A.N.; William, J.R. EPIC_Erosion Productivity Impact Calculator, 1. Model Documentation; Technical Bulletin No. 1768; U.S. Departament of Agriculture, Agricultural Research Service: Washington, DC, USA, 1990.
  58. Ficklin, D.L.; Luo, Y.; Luedeling, E.; Zhang, M. Climate change sensitivity assessment of a highly agricultural watershed using SWAT model. J. Hydrol. 2009, 374, 16–29. [Google Scholar] [CrossRef]
  59. Zhang, H.; Huang, G.H.; Wang, D.; Zhang, X. Uncertainty assessment of climate change impacts on the hydrology of small prairie wetlands. J. Hydrol. 2011, 396, 94–103. [Google Scholar] [CrossRef]
  60. Pruski, F.F.; Nearing, M.A. Runoff and soil-loss responses to changes in precipitation: A computer simulation study. J. Soil Water Conserv. 2002, 57, 7–16. [Google Scholar]
  61. Lago, A.; Lage, A.; Cruz, R.; Perez, V. Estudo das variacions de temperatura e precipitacions en Galicia nos últimos 30 ano no contexto do cambio global (Study of variations in temperature and rainfall in Galicia in the last 30 years in the context of global change). Revista Real Academia Galega Ciencias 2006, 25, 85–100. [Google Scholar]
  62. Luo, Y.; Ficklin, D.L.; Liu, Z.; Zhang, M. Assessment of climate change impacts on hydrology and water quality with a watershed modeling approach. Sci. Total Environ. 2013, 450–451, 72–82. [Google Scholar] [CrossRef] [PubMed]
  63. Butcher, J.B.; Johnson, T.E.; Nover, D.; Sarkar, S. Incorporating the effects of increased atmospheric CO2 in watershed model projections of climate change impacts. J. Hydrol. 2014, 513, 322–334. [Google Scholar] [CrossRef]
  64. Rodríguez-Blanco, M.L.; Taboada-Castro, M.M.; Taboada-Castro, M.T. Temporal changes in suspended sediment transport in an Atlantic catchment, NW Spain. Geomorphology 2010, 123, 181–188. [Google Scholar] [CrossRef]
  65. Alexander, E.B. Rates of soil formation—Implications for soil-loss tolerance. Soil Sci. 1988, 145, 37–45. [Google Scholar] [CrossRef]
  66. Verheijen, F.G.A.; Jones, R.J.A.; Rickson, R.J.; Smith, C.J. Tolerable versus actual soil erosion rates in Europe. Earth Sci. Rev. 2009, 94, 23–38. [Google Scholar] [CrossRef] [Green Version]
  67. Mukundan, R.; Pradhanang, S.M.; Pierson, D.C.; Anandhi, A.; Zion, M.S.; Matonse, A.H.; Lounsbury, D.G.; Steenhuis, T.S. Suspended sediment source areas and future climate impact on soil erosion and sediment yield in a New York City water supply watershed, USA. Geomorphology 2013, 183, 110–119. [Google Scholar] [CrossRef]
  68. Zhu, Y.M.; Lu, X.X.; Zhou, Y. Sediment flux sensitivity to climate change: A case study in the Longchuanjiang catchment of the upper Yangtze River, China. Glob. Planet. Chang. 2008, 60, 429–442. [Google Scholar] [CrossRef]
  69. Mullan, D.; Favis-Mortlock, D.; Fealy, R. Addressing key limitations associated with modelling soil erosion under the impacts of future climate change. Agric. For. Meteorol. 2012, 156, 18–30. [Google Scholar] [CrossRef]
  70. Kim, J.G.; Park, Y.S.; Yoo, D.; Kim, N.; Engel, B.A.; Kim, S.; Kim, K.S.; Lim, J. Development of a SWAT patch for better estimation of sediment yield in steep sloping watershed. J. Am. Water Resour. Assoc. 2009, 45, 963–972. [Google Scholar] [CrossRef]
  71. Vega, J.A.; Fernández, C.; Jiménez, E.; Ruiz, A.D. Evidencias de cambio climático en Galicia a través das tendencias dos indices de perigo de incendios forestais. In Evidencias e Impactos do Cambio Climático en Galicia; Xunta de Galicia: Santiago de Compostela, Spain, 2009; pp. 173–194. [Google Scholar]
  72. Vega, J.A.; Fernández, C.; Jiménez, E.; Ruiz, A.D. Impacto dun escenario de cambio climático sobre o perigo de incendios en Galicia. In Evidencias e Impactos do Cambio Climático en GALICIA; Xunta de Galicia: Santiago de Compostela, Spain, 2009; pp. 583–607. [Google Scholar]
  73. Vega, J.A.; Bará, S.; Villamuera, M.A.; Alonso, M. Erosión Después de un Incendio Forestal; Departmento Forestal de Zonas Húmedas: Pontevedra, Spain, 1982. [Google Scholar]
  74. Tu, J. Combined impact of climate and land use changes on streamflow and water quality in eastern Massachusetts, USA. J. Hydrol. 2009, 379, 268–283. [Google Scholar] [CrossRef]
  75. Hadjikakou, M.; Whitehead, P.G.; Jin, L.; Futter, M.; Hadjincolaou, P.; Shahgedanova, M. Modelling nitrogen in the Yeşilirmak River catchment in Northern Turkey: Impacts of future climate and environmental change and implications for nutrient management. Sci. Total Environ. 2011, 409, 2404–2418. [Google Scholar] [CrossRef] [PubMed]
  76. Gabriel, M.; Knightes, C.; Cooter, E.; Dennis, R. Evaluating relative sensitivity of SWAT-simulated nitrogen discharge to projected climate and land cover changes for two watersheds in North Carolina, USA. Hydrol. Process. 2016, 30, 1403–1418. [Google Scholar] [CrossRef]
Figure 1. Location of the Corbeira catchment and Digital Elevation Model of the region.
Water 08 00444 g001
Figure 2. Current monthly rainfall and mean temperature in the study area and projections of climate change for (a) 2031–2060 and (b) 2069–2098. The shaded area shows the range of climate model predictions for the study area. The line represents the mean.
Water 08 00444 g002
Figure 3. Response of suspended sediment yield (SS), streamflow (R) and evapotranspiration (ET) to changes in temperature (Sc1, Sc2, Sc3 and Sc4), rainfall (Sc5, Sc6, Sc7 and Sc8) and CO2 concentration (Sc9, Sc10) based on the scenarios defined in Table 1. Sc1: T + mean 2031–2060 °C; Sc2: T + max 2031–2060 °C; Sc3: T + mean 2069–2098 °C; Sc4: T + max 2069–2098 °C; Sc5: P–mean 2031%–2060%; Sc6: P–max 2031%–2060%; Sc7: P–mean 2069%–2098%; Sc8: P–max 2069%–2098%; Sc9: 1.5 × CO2; Sc10: 2 × CO2.
Water 08 00444 g003
Figure 4. Seasonal response of suspended sediment (SS) yield to changes in temperature (Sc1, Sc2, Sc3 and Sc4), rainfall (Sc5, Sc6, Sc7 and Sc8) and CO2 concentration (Sc9, Sc10) based on the scenarios defined in Table 1. Sc1: T + mean 2031–2060 °C; Sc2: T + max 2031–2060 °C; Sc3: T + mean 2069–2098 °C; Sc4: T + max 2069–2098 °C; Sc5: P–mean 2031%–2060%; Sc6: P–max 2031%–2060%; Sc7: P–mean 2069%–2098%; Sc8: P–max 2069%–2098%; Sc9: 1.5 × CO2; Sc10: 2 × CO2.
Water 08 00444 g004
Figure 5. Response of erosion of different vegetation covers to changes in temperature (Sc1, Sc2, Sc3 and Sc4), rainfall (Sc5, Sc6, Sc7 and Sc8) and CO2 concentration (Sc9, Sc10) based on the scenarios defined. Sc1: T + mean 2031–2060 °C; Sc2: T + max 2031–2060 °C; Sc3: T + mean 2069–2098 °C; Sc4: T + max 2069–2098 °C; Sc5: P–mean 2031%–2060%; Sc6: P–max 2031%–2060%; Sc7: P–mean 2069%–2098%; Sc8: P–max 2069%–2098%; Sc9: 1.5 × CO2; Sc10: 2 × CO2.
Water 08 00444 g005
Figure 6. Response of suspended sediment yield to combined changes in temperature, rainfall and CO2 concentration based on the scenarios defined in Table 1. Sc11: T + mean 2031–2060 °C, P–mean 2031%–2060%, CO2 550; Sc12: T + max 2031–2060 °C, P–mean 2031%–2060%, CO2 550; Sc13: T + mean 2069–2098 °C, P–mean 2069%–2098%, CO2 660; Sc14: T + max 2069–2098 °C, P–max 2069%–2098%, CO2 660.
Water 08 00444 g006
Figure 7. Seasonal response of suspended sediment yield to combined changes in temperature, rainfall and CO2 concentration based on the scenarios defined in Table 1. Sc11: T + mean 2031–2060 °C, P–mean 2031%–2060%, CO2 550; Sc12: T + max 2031–2060 °C, P–mean 2031%–2060%, CO2 550; Sc13: T + mean 2069–2098 °C, P–mean 2069%–2098%, CO2 660; Sc14: T + max 2069–2098 °C, P–max 2069%–2098%, CO2 660.
Water 08 00444 g007
Figure 8. Response of suspended sediment concentration to combined changes in temperature, rainfall and CO2 concentration based on the scenarios defined in Table 1. Sc11: T + mean 2031–2060 °C, P–mean 2031%–2060%, CO2 550; Sc12: T + max 2031–2060 °C, P–mean 2031%–2060%, CO2 550; Sc13: T + mean 2069–2098 °C, P–mean 2069%–2098%, CO2 660; Sc14: T + max 2069–2098 °C, P–max 2069%–2098%, CO2 660.
Water 08 00444 g008
Table 1. Climate change scenarios used for SWAT (Soil and Water Assesment Tool) simulations.
ScenarioModified ParameterJanuaryFebruaryMarchAprilMayJuneJulyAugustSeptemberOctoberNovemberDecember
1Temperature (°C) (mean 2031–2060)1.00.90.70.91.11.01.31.51.41.21.01.4
2Temperature (°C) (maximum 2031–2060)1.61.521.71.92.12.52.72.42.81.62.3
3Temperature (°C) (mean 2069–2098)1.81.61.61.72.22.52.63.02.72.52.22.2
4Temperature (°C) (maximum 2069–2098)2.73.23.22.93.84.74.54.95.55.03.72.9
5Rainfall (mm) (mean 2031–2060)−1.21.0−5.2−12.7−10.6−11.4−9.8−11.8−6.8−8.2−8.717.8
6Rainfall (mm) (maximum 2031–2060)−26.0−28.3−12.9−30.4−15.5−24.1−17.2−23.9−30.7−46.4−37.954.7
7Rainfall (mm) (mean 2069–2098)−3.5−1.0−5.2−17.6−31.8−21.0−14.5−16.4−19.1−27.4−8.7−8.9
8Rainfall (mm) (maximum 2069–2098)36.617.2−22.4−26.5−37.5−30.2−20.6−28.5−28.0−56.1−56.8−29.6
9CO2 concentration (ppm)550550550550550550550550550550550550
10CO2 concentration (ppm)660660660660660660660660660660660660
11Temperature (°C) (mean 2031–2060)1.00.90.70.91.11.01.31.51.41.21.01.4
Rainfall (mm) (mean 2031–2060)−1.21.0−5.2−12.7−10.6−11.4−9.8−11.8−6.8−8.2−8.717.8
CO2 concentration (ppm)550550550550550550550550550550550550
12Temperature (°C) (maximum 2031–2060)1.61.521.71.92.12.52.72.42.81.62.3
Rainfall (mm) (maximum 2031–2060)−26.0−28.3−12.9−30.4−15.5−24.1−17.2−23.9−30.7−46.4−37.954.7
CO2 concentration (ppm)550550550550550550550550550550550550
13Temperature (°C) (mean 2069–2098)1.81.61.61.72.22.52.63.02.72.52.22.2
Rainfall (mm) (mean 2069–2098)−3.5−1.0−5.2−17.6−31.8−21.0−14.5−16.4−19.1−27.4−8.7−8.9
CO2 concentration (ppm)660660660660660660660660660660660660
14Temperature (°C) (maximum 2069–2098)2.73.23.22.93.84.74.54.95.55.03.72.9
Rainfall (mm) (maximum 2069–2098)36.617.2−22.4−26.5−37.5−30.2−20.6−28.5−28.0−56.1−56.8−29.6
CO2 concentration (ppm)660660660660660660660660660660660660
Notes: Sc1: T + mean 2031–2060 °C; Sc2: T + max 2031–2060 °C; Sc3: T + mean 2069–2098 °C; Sc4: T + max 2069–2098 °C; Sc5: P–mean 2031%–2060%; Sc6: P–max 2031%–2060%; Sc7: P–mean 2069%–2098%; Sc8: P–max 2069%–2098%; Sc9: 1.5 × CO2; Sc10: 2 × CO2.

