Article

Physical Modeling on Hydraulic Performance of Rectangular Bridge Deck Drains

1
Department of Civil & Environmental Engineering, Lamar University, P.O. Box 10024, Beaumont, TX 77710, USA
2
Department of Industry Engineering, Lamar University, P.O. Box 10032, Beaumont, TX 77710, USA
3
Department of Civil, Architectural, and Environmental Engineering, The University of Texas at Austin, Austin, TX 78712, USA
*
Author to whom correspondence should be addressed.
Water 2016, 8(2), 67; https://doi.org/10.3390/w8020067
Submission received: 17 November 2015 / Revised: 6 January 2016 / Accepted: 14 February 2016 / Published: 22 February 2016

Abstract

:
This paper presents results from an extensive experimental study on hydraulic performance of new rectangular bridge deck drains developed by the Texas Department of Transportation (TxDOT) Bridge Division. It fits between the deck reinforcement with the top of the drain flush with the bridge surface and does not interfere with the structural connection of the bridge rail to the deck. Experiments have been performed by varying drain sizes, the number of open drains in series, approach discharges, cross slopes and longitudinal slopes. Measurements include a series of approach gutter flow depth and ponding width at different stations along the deck, and weir heights for capture and bypass discharges. An accurate prediction model has been developed for the captured discharge. The model reveals that the capture discharge is a function of the drain size, the number of open drains, the Manning’s roughness coefficient, the depth of approach flow, the longitudinal slope, and the cross slope. The rating curve for each individual drain in series is the same when the drain size is 10 cm by 20 cm; however, it decreases slightly along the flow direction when the drain size is 15 cm by 20 cm.

1. Introduction

Removal of runoff from bridge decks is important, as wet conditions increase splash and stopping distance of vehicles. Accumulated runoff can cause complete loss of control and potential loss of life due to hydroplaning. Bridge deck drains are useful for fast and effective drainage of runoff on bridges [1]. However, relatively small bridge deck drains are often less effective than roadway drainage because of lower cross slopes, uniform cross slopes for traffic lanes and shoulders, and parapets, which collect relatively large amounts of debris and result in clogging of inlets and drainage systems [2]. A new rectangular deck drain (i.e., scupper) developed by Texas Department of Transportation (TxDOT) Bridge Division, consists of a drain pan and a drain grate (Figure 1). The drain pan, which is made from standard hollow structural steel tubing, fits between the deck reinforcement with the top of the drain flush with the bridge surface and does not interfere with the structural connection of the bridge rail to the deck. Two 1 cm wide grates are placed over the top of the drain to prevent clogging and to provide safety for pedestrians, bicyclists and vehicles. The captured flow can discharge directly to the air or be routed through a conveyance system depending on the bridge configuration. A number of drains can be installed on the bridge deck in series to improve the capacity (Figure 1a). A search of state transportation department web sites and national transportation databases, and canvassing of bridge offices have revealed [3] that thirty-one states used scuppers and twenty-eight states used Hydraulic Engineering Circular (HEC) 21 [2] as the design guidelines. Only Texas, New Mexico and California adopted the slotted drain equations developed by Federal Highway Administration (FHWA) in HEC 22 [4]. No equation is available to model the hydraulic performance of the new drain in series configuration. The objective of this research is to develop an equation to predict the hydraulic performance of rectangular bridge deck drains under different hydraulic conditions. Obtaining a mathematical solution for the amount of flow captured by deck drains is a very complex problem and would require verification against experimental results. Therefore, the primary approach for accomplishing the study is to construct a large, versatile full-scale physical model of a bridge [5] and to conduct a large number of experiments to cover the expected flow conditions and geometries of bridge deck drains.

2. Background

Various topics concerning bridge deck drains were studied in the literature to identify the general behavior of drain systems. Izzard [6,7] developed an alternative form of Manning’s equation to calculate the gutter flow. It assumed that the longitudinal velocity at each distance from the curb could be calculated by Manning’s equation for the velocity based on the local depth at that point being equal to the hydraulic radius. Therefore, the gutter flow can be obtained by integrating the flow through an incremental area at each distance, as expressed in Equation (1):
Q = 3 8 κ n S x 5 / 3 T 8 / 3 S 0
where Q = gutter flow rate, κ = 1 for SI units (1.486 for English units), n = Manning’s roughness coefficient, S0 = the longitudinal slope of the bridge, Sx = the cross slope of the bridge, and T = the ponding width or spread along the deck. The allowable ponding width (T) in Equation (1) can be estimated based on the likelihood of the hydroplaning, which is a function of rainfall intensity and resulting water depth, air pressure in the tires, tread depth and siping pattern of the vehicle tires, condition and character of the pavement, and vehicle speed [2,4,8].
Observation suggests that critical flow occurs at the edge of the drain. Furthermore, experiment results suggest that the effective specific energy for each drain corresponds to the flow depth upstream of the drain system. For such weir-type flow conditions, the lateral discharge per length of the drain is a product of the water depth and lateral velocity, as shown in Equation (2) [3]:
q c = y c V c = 2 y 3 V c = g ( 2 y 3 ) 3 2
If the lateral inflow is uniform along a drain of length L, then the drain capture discharge is calculated using Equation (3):
Q L = g ( 2 y 3 ) 3 2 L
Alternatively, following Izzard’s study, Li [9] made a comparison between flow into a drain inlet and flow falling freely off a channel end to determine the captured discharge by a curb inlet. It assumes that due to drain inflow, the depth varies linearly from the upstream curb depth (Y) to zero at capture length (LT) for total capture of the approach discharge. With this varying depth along the length of the drain, Equation (2) is used to calculate the lateral inflow specific discharge for slotted drains [4]. Replacing y = LY/LT in Equation (2) and integrating this specific discharge along the inflow length (LT) gives:
Q c = 2 5 g ( 2 Y 3 ) 3 2 L T
Comparison of Equations (3) and (4) is of interest. These equations suggest that for the same capture discharge, a drain system with uniform inflow along its length is shorter in length by a factor of approximately 2.5 compared to a drain system with linearly varying depth along its length. Therefore, how the flow depth varies along its length is the key for the deck drain model development.
Two similar studies have been identified in the literature. The data for 10 cm diameter circle scupper on a continuous grade bridge with the 3% cross slope [8] and 10 × 15 cm rectangular scupper [10] have shown the flow into the scupper drain behaves as a flow over a weir for the smaller flow depths, while it behaves as an orifice at higher water depths. The regression analysis on the weir-type data demonstrated the capture discharge is a function of the water depth, longitudinal slope, and cross slope [10]. To verify the capacity of the new deck drain, a physical modeling study was designed to confirm its hydraulic performance as a function of approach discharges, different drain configurations, and bridge characteristics.

3. Physical Model

The physical modeling studies were carried out within the hydraulics laboratory facilities of The University of Texas at Austin, Center for Research in Water Resources (CRWR). The primary experiments were conducted using an existing elevated decking surface that was used in previous hydraulic modeling studies of bridge and road drain performance [1,5,10,11]. The existing “bridge deck” facility was constructed for the specific objective of evaluating the hydraulic performance of bridge deck drains. The decking surface is attached to a rigid frame through a pulley-hoist system that easily allows adjustment of the longitudinal and cross slopes.

3.1. Facility Setup

The bridge deck physical model measures 3.20 m in width and 19.05 m in length. Five rectangular drains in series are located on the left side (looking downstream from the headbox) 15.70 m from the upstream end of the model as shown in Figure 2. The cross slope and longitudinal grade are modified by adjusting the hoists located on three of the steel supports. The fourth support, located near the downstream, right side of the channel, is pinned at a fixed elevation. Two reservoirs were constructed to collect the discharge from the drains in order to measure captured flow and bypass flow. Each reservoir has a newly installed V-notch weir for discharge measurement. A new headbox and tailbox for the decking surface were also constructed. The decking surface was coated with granular material and resin to provide the desired surface roughness of the bridge deck. Ten model bridge drains (five with size of 10 cm × 20 cm and five with size of 15 cm × 20 cm) were constructed out of Plexiglas and installed flush with the decking surface (Figure 2). Five drains were constructed in series with a spacing of 46 cm from nose to nose. The Plexiglas drains were sized so that the inside dimensions are the same as the inside dimensions of standard steel tubing used for the prototype drains (Figure 1a). Each drain has a lower plate with a rubber gasket that can be used to close the drain. In this fashion the drain system can be run with zero, one, two, three, four or five open drains. Drains were closed consecutively from the downstream end during the experiments. Fourteen stations were assigned to gather water depth and ponding width measurements (Figure 2). The distance among Stations (1)–(3) is 122 cm. The distance among Stations (3)–(7) is 61 cm. The Station (7) is located in front of the first drain. Stations (8)–(11) are located in the middle of the two drains. Station (12) is located 2.74 m upstream of the end of the deck. The distance among Stations (12)–(14) is 91 cm.
The water used for the physical model experiments was pumped into the headbox from a 500,000-gallon reservoir located outside of the laboratory. Two water supply lines lead from the distribution reservoir to the model, each with its own pump. Water flows out of the headbox, down the model decking, reaches uniform flow upstream of the drains, and either is captured by the drains or bypasses the drains. The captured flow enters the drains to a reservoir beneath the model and is measured by captured V-notch weir. Similarly, the bypass flow travels into another reservoir and is measured by bypass V-notch weir. The discharge from a V-notch weir (Qv) can be calculated by:
Q v = C e 8 15 2 g tan ( θ 2 ) H 2.5
where Qv = discharge measured by V-notch weir, and H = head on the weir measured from the V-notch. With the discharge coefficient Ce = 0.584 for 120-degree weir, and Ce = 0.580 for 60-degree weir [12], Equation (5) becomes Qv = 4.33H2.5 and Qv = 1.443H2.5, respectively. The two weirs discharge to a single conveyance channel that returns the flow to the distribution reservoir.

3.2. Model Manning’s Roughness Coefficient Determination

The typical Manning’s roughness coefficient for a bridge deck surface is between 0.011 and 0.017 [4]. The surface roughness of the experimental decking should be in this range since the bridge and rectangular drains are studied at full-scale. The exact value of Manning’s roughness coefficient (n) for the model surface was determined by experiments with all drains closed. The experiments tested cross slope Sx = 2%, 4%, and 6%, and longitudinal slope S0 = 0.1%, 0.5%, 1%, 2%, and 4%. For each slope combination, five different approach discharges between 0.003 and 0.034 m3/s (0.1 and 1.2 cfs) were used. A total of 75 (3 × 5 × 5) runs were initially conducted. Measurements include the head on the V-notch weir from the bypass reservoir, and ponding width (spread) and curb depth at a number of 14 stations along the deck. The head on the V-notch weir was used to calculate the flow rate in Equation (5). With all drains closed, the flow should be uniform within the gutter and can also be estimated from Equation (1). The average of the spread and curb depth were used to confirm the cross slope of the deck. The Manning’s roughness coefficient value for each individual experiment were calculated by taking the discharge measured at the weir along with measured spread and curb depth. The results showed the Manning’s coefficient for 0.1% longitudinal slope is significantly different from that for all other slope values. The average Manning’s coefficient value for the 0.1% longitudinal slope is n = 0.0122, however, the averaged values of n for the 0.5%, 1%, 2% and 4% are close to 0.0166. The small slope behavior of Manning’s coefficient was investigated [13] and concluded that simpler diffusion wave model is needed for longitudinal slope less than 0.5%, although Izzard’s equation can be confidently used to determine inlet spacing, even on mild slopes with downstream control.

3.3. Experiment Procedures

Six series of physical model experiments were conducted for 10 cm × 20 cm and 15 cm × 20 cm drains as listed in Table 1. Each run has tested for 5, 4, 3, 2 and 1 open drains at 5 to 10 different flow rates. The physical model was used to successfully conduct 586 tests for the 10 cm × 20 cm drain and 236 tests for the 15 cm × 20 cm drain. In each test, two weir heights and a series of the water depth and ponding width from upstream to downstream at 14 stations (Figure 2) along the deck were measured with the steel tape. The capture discharge (Qc), approach discharge (Qa) and the calibrated cross slope (Sx) have been calculated for each test.

4. Experiment Data Analysis and Model Development

4.1. Data Analysis and Equation Development

The measured capture discharge was compared with the calculated capture discharge using the FHWA slotted drain method [4] and the grate inlet method suggested by HEC 21 [2] to verify adopted design methods. The slotted drain method is expressed in Equation (6)
Q c = ( L T ( n S x ) 0.6 K T S 0 0.8 ) 2.38
where LT = total length of the deck drain, KT = 0.817 for SI units (0.6 for English units), and Qc = captured flow rate. The FHWA slotted drain method underestimates the capacity of the rectangular drains, i.e., previous designs in Texas, New Mexico and California are safe. The capacity of the rectangular drains is 2 to 20 times larger than that calculated from the slotted drain equation with the equivalent slot length. The wider width of the drain does increase the capacity as expected. Moreover, the spacing between each drain also enhances the capture discharge because it allows the flow in the gutter to reposition itself towards the curb and the next drain. The grate inlet method is summarized in Equation (7) [2]:
Q c = R t [ 1 ( 1 W / T ) 2.67 ] Q w h e r e : R t = 1 0.09 ( V V 0 )
where W = width of the drain, Rt = frontal flow interception efficiency for typical grates, V = gutter flow velocity, and V0 = grate splashover velocity. By applying Chart 10 in HEC 21 [2] to the data, the value of Rt is great than 1 for both drain sizes. The ratio of the capacity of rectangular drain to the grate inlet is between 0.45 and 3.23. It decreases with the increased longitudinal slope for the same cross slope. It overestimates when the longitudinal slope is less than 0.005, while underestimates when the longitudinal slope is greater than 0.01. Therefore, the grate inlet method is not safe to apply for longitudinal slope less than 0.005. A wide range of correction factors would be needed for both methods. Therefore, a new equation for the rectangular drains was developed.
The relationship between the measured capture discharges and the approach curb water depths for the case with a single drain open was plotted. A weir equation, Q c = 3.24 ( 2 y 3 ) 1.5 , fits the experimental data for a single drain with R2 = 0.9871 and Root Mean Square Error (RMSE) = 0.0004 m3/s (0.0145 cfs). The better hydraulic performance of the new drain does not cause the orifice-type behavior as in [10]. The orifice-type behavior was observed when the approach discharge was spread across more than one lane, which has no practical design value. The data also show that each additional drain has very similar performance, and the larger drain width improves the hydraulic performance. Similarly, by assuming that critical flow (based on curb depth) occurs along the upstream and lateral drain edges, the capture discharge from a set of open drains can be expressed using the similar weir equation as Equations (3) and (4):
Q c = a S 0 α S x β N g ( 2 y 3 ) 1.5 ( L + W )
where N = the number of the open drains, g = gravitational acceleration, L = the drain length, W = the drain width, and y = the curb depth calculated from Equation (1): y = ( 8 n S x Q a 3 κ S 0 ) 3 / 8 . The coefficients a, α, and β can be estimated from data using regression methods. Please note, the data for S0 = 0.1% (114 tests) have been excluded since the diffusion wave model is recommended [13]. The fitted coefficients and statistical measurements are listed in Table 2 for different cases of the drain size. By substituting coefficients for both drains (R2 = 0.9328, and standard error 0.0012 m3/s) in Equation (8) and combining with Equation (1), we obtain Equation (9), which expresses the relationship between capture discharge and approach discharge as:
Q c = K C N ( n Q a ) 9 / 16 ( L + W ) S x 0.3122 S 0 0.1770
where Kc = 1.180 for SI units (1.712 for English units). If the approach discharge is less than the capture discharge (Qa < Qc), the model assumes Qc = Qa since no bypass discharge occurs. Equation (9) indicates that the capture discharge increases with increased cross slope and/or decreased longitudinal slope for the same approach discharge.

4.2. Model Results

The captured discharge calculated by Equation (9) and the measured capture discharge versus the approach discharge at different cross slopes and longitudinal slopes for drain size 10 cm × 20 cm and 15 cm × 20 cm were plotted and compared. Figure 3 and Figure 4 show the representative comparison for 10 cm × 20 cm and 15 cm × 20 cm drains, respectively. In general, the predicted capture discharge matches well with the experimental results, especially for the 10 cm × 20 cm drains. However, a close examination revealed a tendency of the model to transit from underestimating to overestimating as the number of drains increases for most of 15 cm × 20 cm drain cases. For example, for 15 cm × 20 cm drains at Sx = 2% and 6% (the 1st and 3rd rows of Figure 4), the hydraulic performance is slightly overestimated for five open drains while it is underestimated for one and two open drains. At Sx = 4% (2nd row of Figure 4), the hydraulic performance is underestimated for one open drain although the model fits the data very well for five open drains. The model assumes equal hydraulic performance for all the open drains by adopting a proportional relationship of the capture discharge with the number of open drains (N) as in [4]. The discrepancy observed suggests that the hydraulic performance of individual drains decreases slightly in the downstream direction with multiple drains in series. The capture discharge calculated by Equation (9) versus the measured capture discharge for all the data are compared in Figure 5. This figure demonstrates that the model has good agreement with the measurements because the data are centered very close to the one-to-one line.

4.3. Discussion

To further investigate the effects of the drain width (W) and the number of open drains (N) on hydraulic performance, non-linear regression analysis has been proposed, which adds a power term (γ) to the number of open drains (N) and introduces a scalar multiplier (b) to the drain width. The modified Equation (9) can be rewritten as:
Q c = a S 0 α S x β ( L + b W ) N γ g ( 2 y 3 ) 1.5
The fitted coefficients are a = 0.464, α = 0.116, β = −0.272, b = 1.082 and γ = 0.867. The predicted capture discharges with b = 1.082, and b = 1 comparing with the measured capture discharges are nearly identical. The result suggests that the drain width has almost equivalent effect as the drain length on the capture discharge for the rectangular drains, and should be incorporated into the model for a unified expression for different size of drains. The estimated power (γ) on N is 0.867, which is less than unity, as expected. The predicted capture discharges for both models have been compared with the measured capture discharge. The RMSE have been calculated as 0.0028 m3/s for γ = 0.867 and 0.0035 m3/s for γ = 1, which is not significant for such a large-scale physical model. Therefore, from practical point of view, the simple model of Equation (9) is recommended.
The study indicates the spacing between drains enhances the hydraulic performance of drain. The effect of spacing warranted further investigation. An additional 464 runs, as presented in Appendix C of [3], have been performed testing drains with spacing values (measured from the center of the first open drain to the center of the next open downstream drain) of 46 cm (drain 1 to 2), 91 cm (drain 1 to 3, and drain 1, 3 and 5), 137 cm (drain 1 and 4) and 183 cm (drain 1 and 5). The data analysis shows a slightly higher fraction of flow is captured by spacing the drains more than 46 cm apart, and each drain basically captures the same amount of flow. The magnitude of Root-mean-square deviation (RMSE), gamma values, magnitude of error, and residuals all indicate a sufficiently small difference exists between the measured captured flow values and the modeled values. Due to the highly unpredictable nature of hydraulics, this magnitude of error is insignificant. Equation (9) provides a sufficiently good fit for modeling purposes and the best method for increasing the amount of flow captured is to increase the number of drains.

5. Design Guidance

Design guidance is implemented to determine the capture discharge of rectangular deck drains required for a given set of parameters of a bridge. A flow chart is also presented in Figure 6 to outline the procedure. Qian et al. [3] provided an example to demonstrate design procedures both in English and SI Units.

Design Steps

The detailed design steps are listed as follows:
Step 1: Determine 100% efficiency capture discharge.
The typical rectangular deck drains have two different sizes: 10 cm × 20 cm and 15 cm × 20 cm. When the maximum number of drains, the drain size, and bridge characteristics are known, the 100% efficiency capture discharge for the maximum number of drains in Equation (11) is determined by setting Qa = Qc in Equation (10):
Q c 100 % = k 100 % ( N m ( L + W ) ) 16 / 7 n 9 / 7 S x 0.7136 S 0 0.4046
where Nm = number of drains required to intercept total gutter flow, L = nominate length of the drain, W = nominate width of the drain, and k100% = 1.4598 for SI units (3.4176 for English units).
Step 2: Determine the number of drains required.
When the approach flow is lower than the 100% capture discharge, the ratio of the 100% capture discharge to the approach discharge needs to be determined. When the ratio is less than 110%, the number of drain for calculating 100% capture discharge is the 100% efficiency drain number. Otherwise, the 100% capture discharge needs to be determined for N = N − 1. Following the loop until either the ratio is less than 110% or the approach flow is higher than the 100% capture discharge, the number of the rectangular deck drain openings can then be determined by Equation (12):
N = K R Q a 0.4375 S 0.1770 1 n 0.5625 S x 0.3122 L + W
where N = number of drains required to intercept total gutter flow, KR = 0.8476 for SI units (0.5841 for English units), and Qa = total gutter flow.
Step 3: Determine the efficiency of drain if the drain number exceeds the maximum drain number.
When N is greater than the maximum drain number (Nm), the efficiency (E) of the rectangular deck drains is determined by Equation (13):
E = N m N

6. Summary and Conclusions

The objective of the study is to obtain an accurate predictive equation for the hydraulic performance of rectangular bridge deck drains. The physical model representing one lane of a bridge has been built to allow easy changes to the longitudinal and cross slopes. Two different drain sizes, 10 cm by 20 cm and 15 cm by 20 cm, have been constructed in Plexiglas so that the behavior of the flow inside of the inlet can be observed. The physical model has been used to successfully conduct 586 tests for the 10 cm × 20 cm drain and 700 tests for the 15 cm × 20 cm drain, for a variety of longitudinal slope (S0), cross slopes (Sx), number of open drains (N), different spacing, and approach discharge (Qa). Measurements in each test include the head on the V-notch weir from two reservoirs, and ponding widths (spread) and curb depths at 14 stations along the deck. The data measured from physical model indicate that capture discharges can be predicted by a weir-type equation. A new equation has been successfully developed and shows good agreement with the physical model data for both drain sizes. The capture discharge is a function of the approach discharge, Manning’s coefficient, cross slope and longitudinal slope as expressed in Equation (9). It also indicates the capture discharge is proportional to the number of open drains, and to the sum of the drain length and width. In addition, the rating curve for each individual drain in series decreases slightly along the flow direction when the drain size is 15 cm by 20 cm, and a slightly higher fraction of flow is captured by spacing the drains more than 46 cm apart. Due to the highly unpredictable nature of hydraulics, both effects are insignificant. Equation (9) provides a sufficiently good fit for modeling purposes and the best method for increasing the amount of flow captured is to increase the number of drains. A detailed design guide has been developed based on Equation (9) and has been documented here for the practical use.

Acknowledgments

Research support from the Texas Department of Transportation is greatly appreciated. The following students contributed greatly to the completion of this laboratory research program: Jung Kim, Hua Liu, Cynthia Castro, Heath Thompson and Haley Born. This work was also partially supported by the Center for Advances in Port Management at Lamar University.

Author Contributions

Randall J. Charbeneau and Michael E. Barrett designed and supervised the experiments. Qin Qian conducted the data analysis and developed the model. Xinyu Liu conducted the statistical analysis on the experiment data. Qin Qian drafted the manuscript, which was revised by all authors. All authors read and approved the final manuscript.

Conflicts of Interest

The authors declare no conflict of interest.

References

  1. Smith, M.A.; Holley, E.R. Hydraulic Characteristics of Flush Depressed Curb Inlets and Bridge Deck Drains; Rep. No. FHWA/TX-95/0-1409-2F; Center for Transportation Research, the University of Texas at Austin: Austin, TX, USA, 1995. [Google Scholar]
  2. Young, G.K.; Walker, S.E.; Chang, F. Design of Bridge Deck Drainage; FHWA-SA-92-010, Hydraulic Engineering Circular 21 (HEC 21); Federal Highway Administration (FHWA): Washington, DC, USA, 1993; p. 129. [Google Scholar]
  3. Qian, Q.; Liu, X.; Charbeneau, R.; Barrett, M. Hydraulic Performance of Small Scale Bridge Deck Drains; Rep. No. FHWA/TX-12/06653-1; Center for Transportation Research, the University of Texas at Austin: Austin, TX, USA, 2013. [Google Scholar]
  4. Brown, S.A.; Schall, J.D.; Morris, J.L.; Doherty, C.L.; Stein, S.M.; Warner, J.C. Urban Drainage Design Manual: FHWA-NHI-10–009, Hydraulic Engineering Circular 22(HEC-22), 3rd ed.; Federal Highway Administration (FHWA): Washington, DC, USA, 2009; p. 478. [Google Scholar]
  5. Charbeneau, R.J.; Jeong, J.; Barrett, M.E. Highway Drainage at Superelevation Transitions; Rep. No. FHWA/TX-08/0-4875-1; Center for Transportation Research, the University of Texas at Austin: Austin, TX, USA, 2008. [Google Scholar]
  6. Izzard, C.F. Hydraulics of runoff from developed surfaces. In Proceedings of the 26th Annual Meeting of Highway Research Board National Research Council, Washington, DC, USA, 5–8 December 1946; pp. 129–150.
  7. Izzard, C.F. Tentative Results on Capacity of Curb Opening Inlet; Research Report No. 11-B; Highway Research Board: Washington, DC, USA, 1950; pp. 36–51. [Google Scholar]
  8. Johnson, F.L.; Chang Fred, F.M. Drainage of Highway Pavements; FHWA-TS-84-202, Hydraulic Engineering Circular 12(HEC12); Federal Highway Adimistration (FHWA): Washington, DC, USA, 1984; p. 136. [Google Scholar]
  9. Li, W.H.; Sorteberg, K.K.; Geyer, J.C. Hydraulic behavior of storm-water inlets. II. Flow into curb-opening inlets. In Sewage and Industrial Waters; The Federation, the University of California: Berkeley, CA, USA, 1954; Volume 23, pp. 143–159. [Google Scholar]
  10. Holley, E.R.; Woodward, C.; Brigneti, A.; Ott, C. Hydraulic Characteristics of Recessed Curb Inlets and Bridge Drains; Rep. No. FHWA/TX-92/0-1267-2F; Center for Transportation Research, the University of Texas at Austin: Austin, TX, USA, 1992. [Google Scholar]
  11. Hammons, M.A.; Holley, E.R. Hydraulic Characteristics of Flush Depressed Curb Inlets and Bridge Deck Drains; Rep. No. FHWA/TX-95/0-1409-01; Center for Transportation Research, the University of Texas at Austin: Austin, TX, USA, 1995. [Google Scholar]
  12. Bos, M.G. Discharge Measurement Structures; Delft Hydraulic Laboratory: Delft, The Netherlands, 1989. [Google Scholar]
  13. Kehoe, G.; Charbeneau, R.; Barrett, M. Errors Introduced by Using Manning’s Equation to Estimate Ponded Width on Roadways with Mild Slopes. In Proceedings of the Transportation Research Board Annual Conference, Washington, DC, USA, 11–15 January 2015.
  14. Texas Department of Transportation. Hydraulic Design Manual; Texas Department of Transportation (TxDOT): Austin, TX, USA, 2009. [Google Scholar]
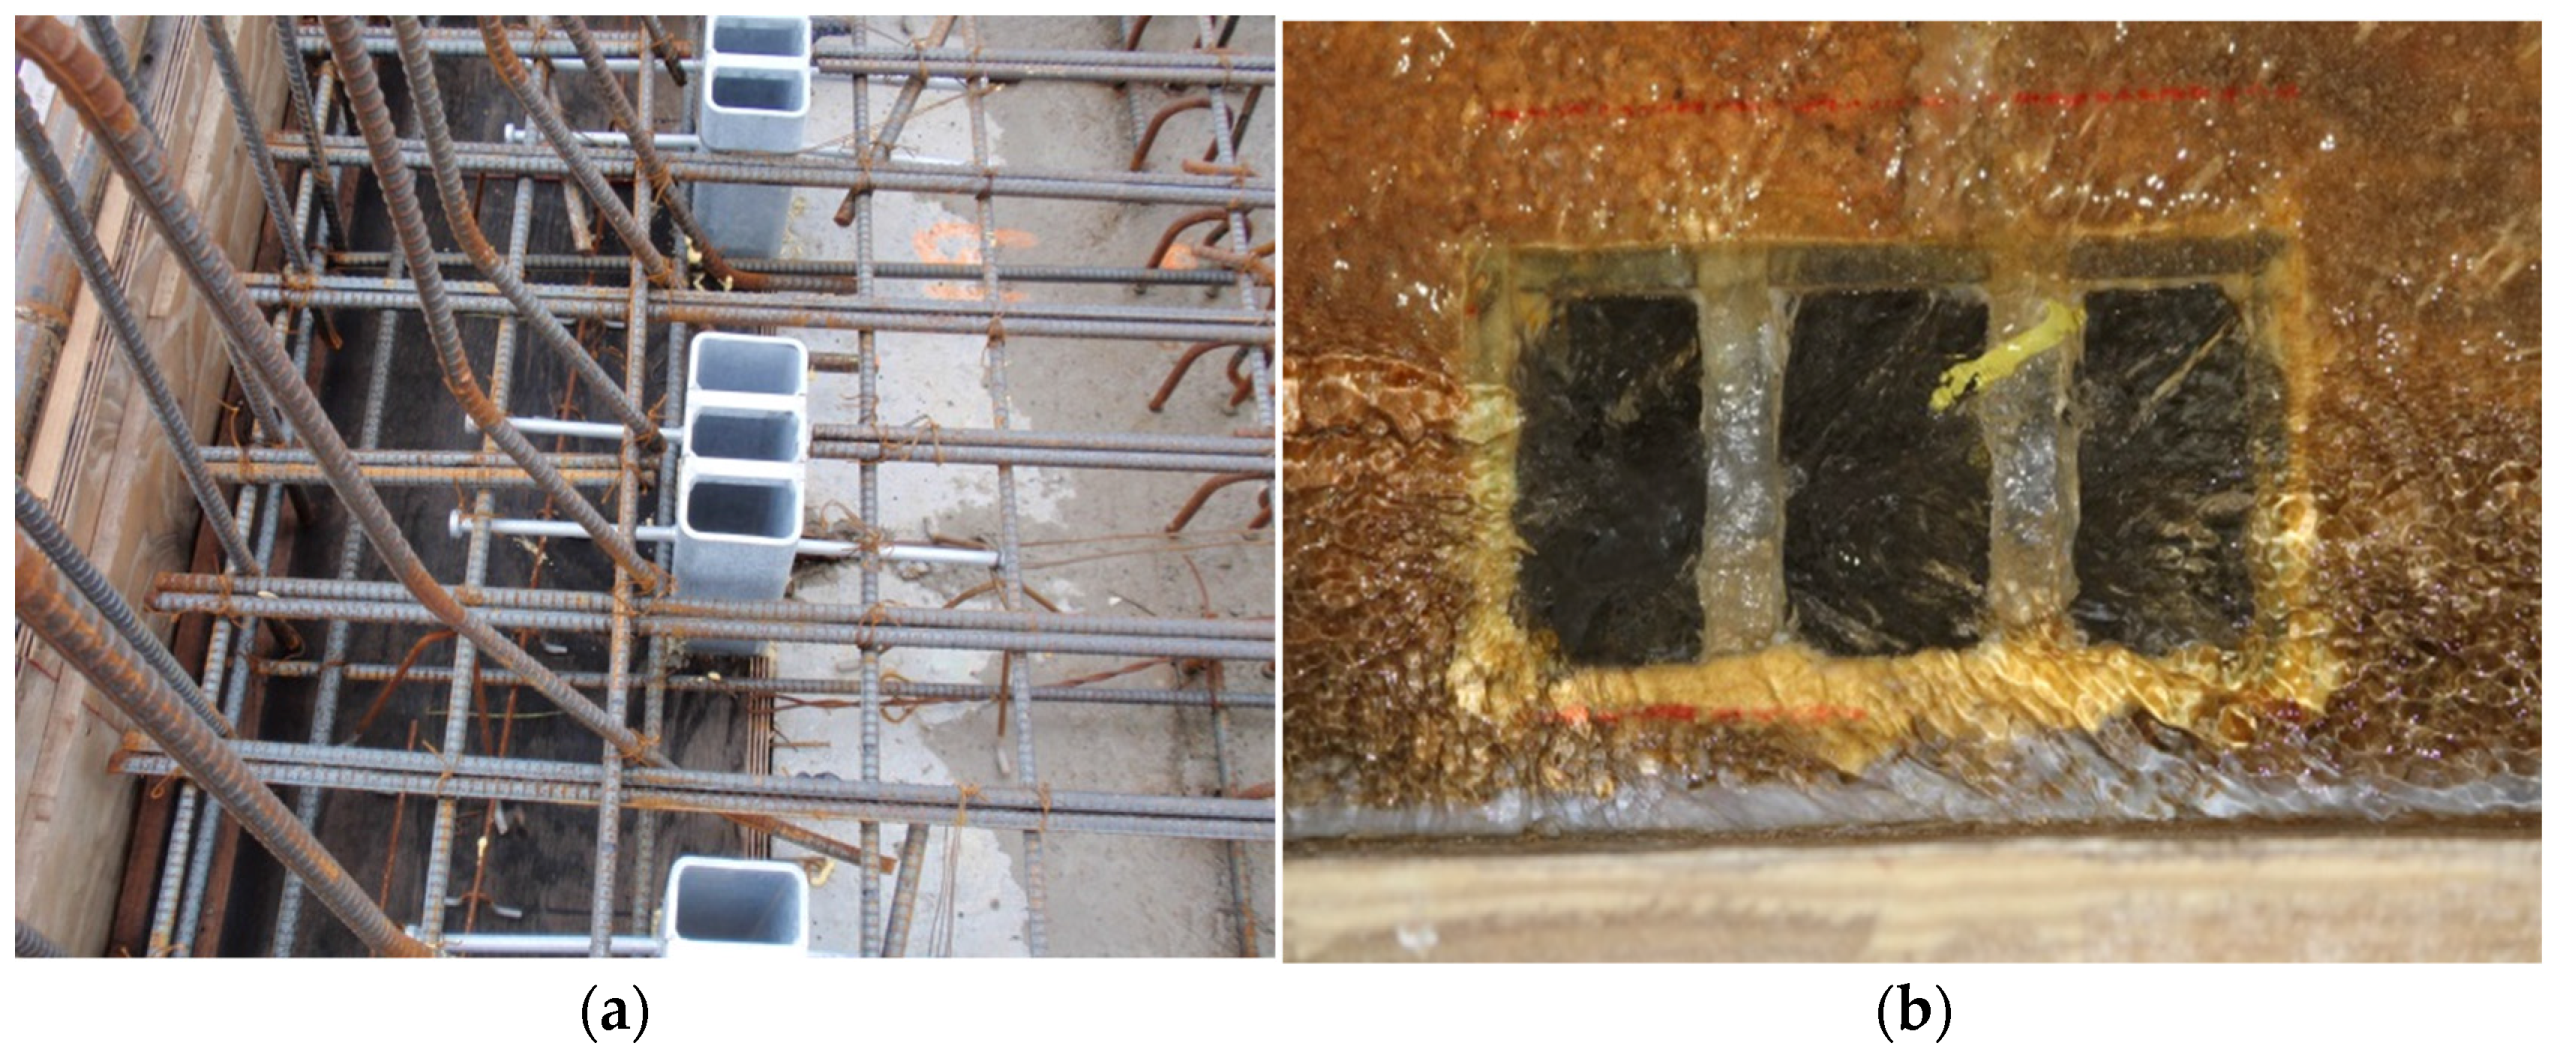
Figure 1. Rectangular Deck Drain prototype (a) and Plexiglas Deck Drain model (b) (Not to scale).
Water 08 00067 g001
Figure 2. Plan view of the physical model (not to scale) and the picture of Plexiglas drain installments along model bridge surface.
Water 08 00067 g002
Figure 3. The captured discharge calculated by model (dashed lines) and the measured capture discharge (N = 1, filled diamond; N = 2, filled rectangle; N = 3, filled triangle; N = 4, diamond; N = 5, triangle) vs. approach discharge at 2% cross slope and different longitudinal slopes for drain size 10 cm × 20 cm.
Water 08 00067 g003
Figure 4. The captured discharge calculated by model (dashed lines) and the measured capture discharge (N = 1, filled diamond; N = 2, filled rectangle; N = 3, filled triangle; N = 4, diamond; N = 5, triangle) vs. approach discharge at 2%, 4% and 6% cross slope and different longitudinal slopes for drain size 15 cm × 20 cm.
Water 08 00067 g004
Figure 5. Comparison of measured capture discharge and capture discharge calculated using Equation (9) for both drain sizes.
Water 08 00067 g005
Figure 6. Design Flow Chart for Rectangular Drain.
Water 08 00067 g006
Table 1. Experiment Series (Followed TxDOT Hydraulic Design Manual, 2009[14]).
RunDrain Size (cm)Longitudinal SlopeCross Slope
110 × 200.1%, 0.5%,1%, 2% and 4%2%
210 × 200.1%, 0.5%,1%, 2% and 4%4%
310 × 200.1%, 0.5%,1%, 2% and 4%6%
415 × 200.5% and 2%2%
515 × 200.5% and 2%4%
615 × 200.5% and 2%6%
Table 2. The fitted coefficients in Equation (8) and statistical analysis results.
VariablesDrain 10 × 20 (cm)Drain 15 × 20 (cm)Both Drains
a0.36020.54690.3989
α0.10430.12050.1043
β−0.2816−0.1760−0.2503
R square0.95320.97600.9328
Standard Error (m3/s)0.00110.00070.0012