
Isotopic Characterization of River Waters and Water Source Identification in an Inland River, Central Asia

Abstract
:1. Introduction
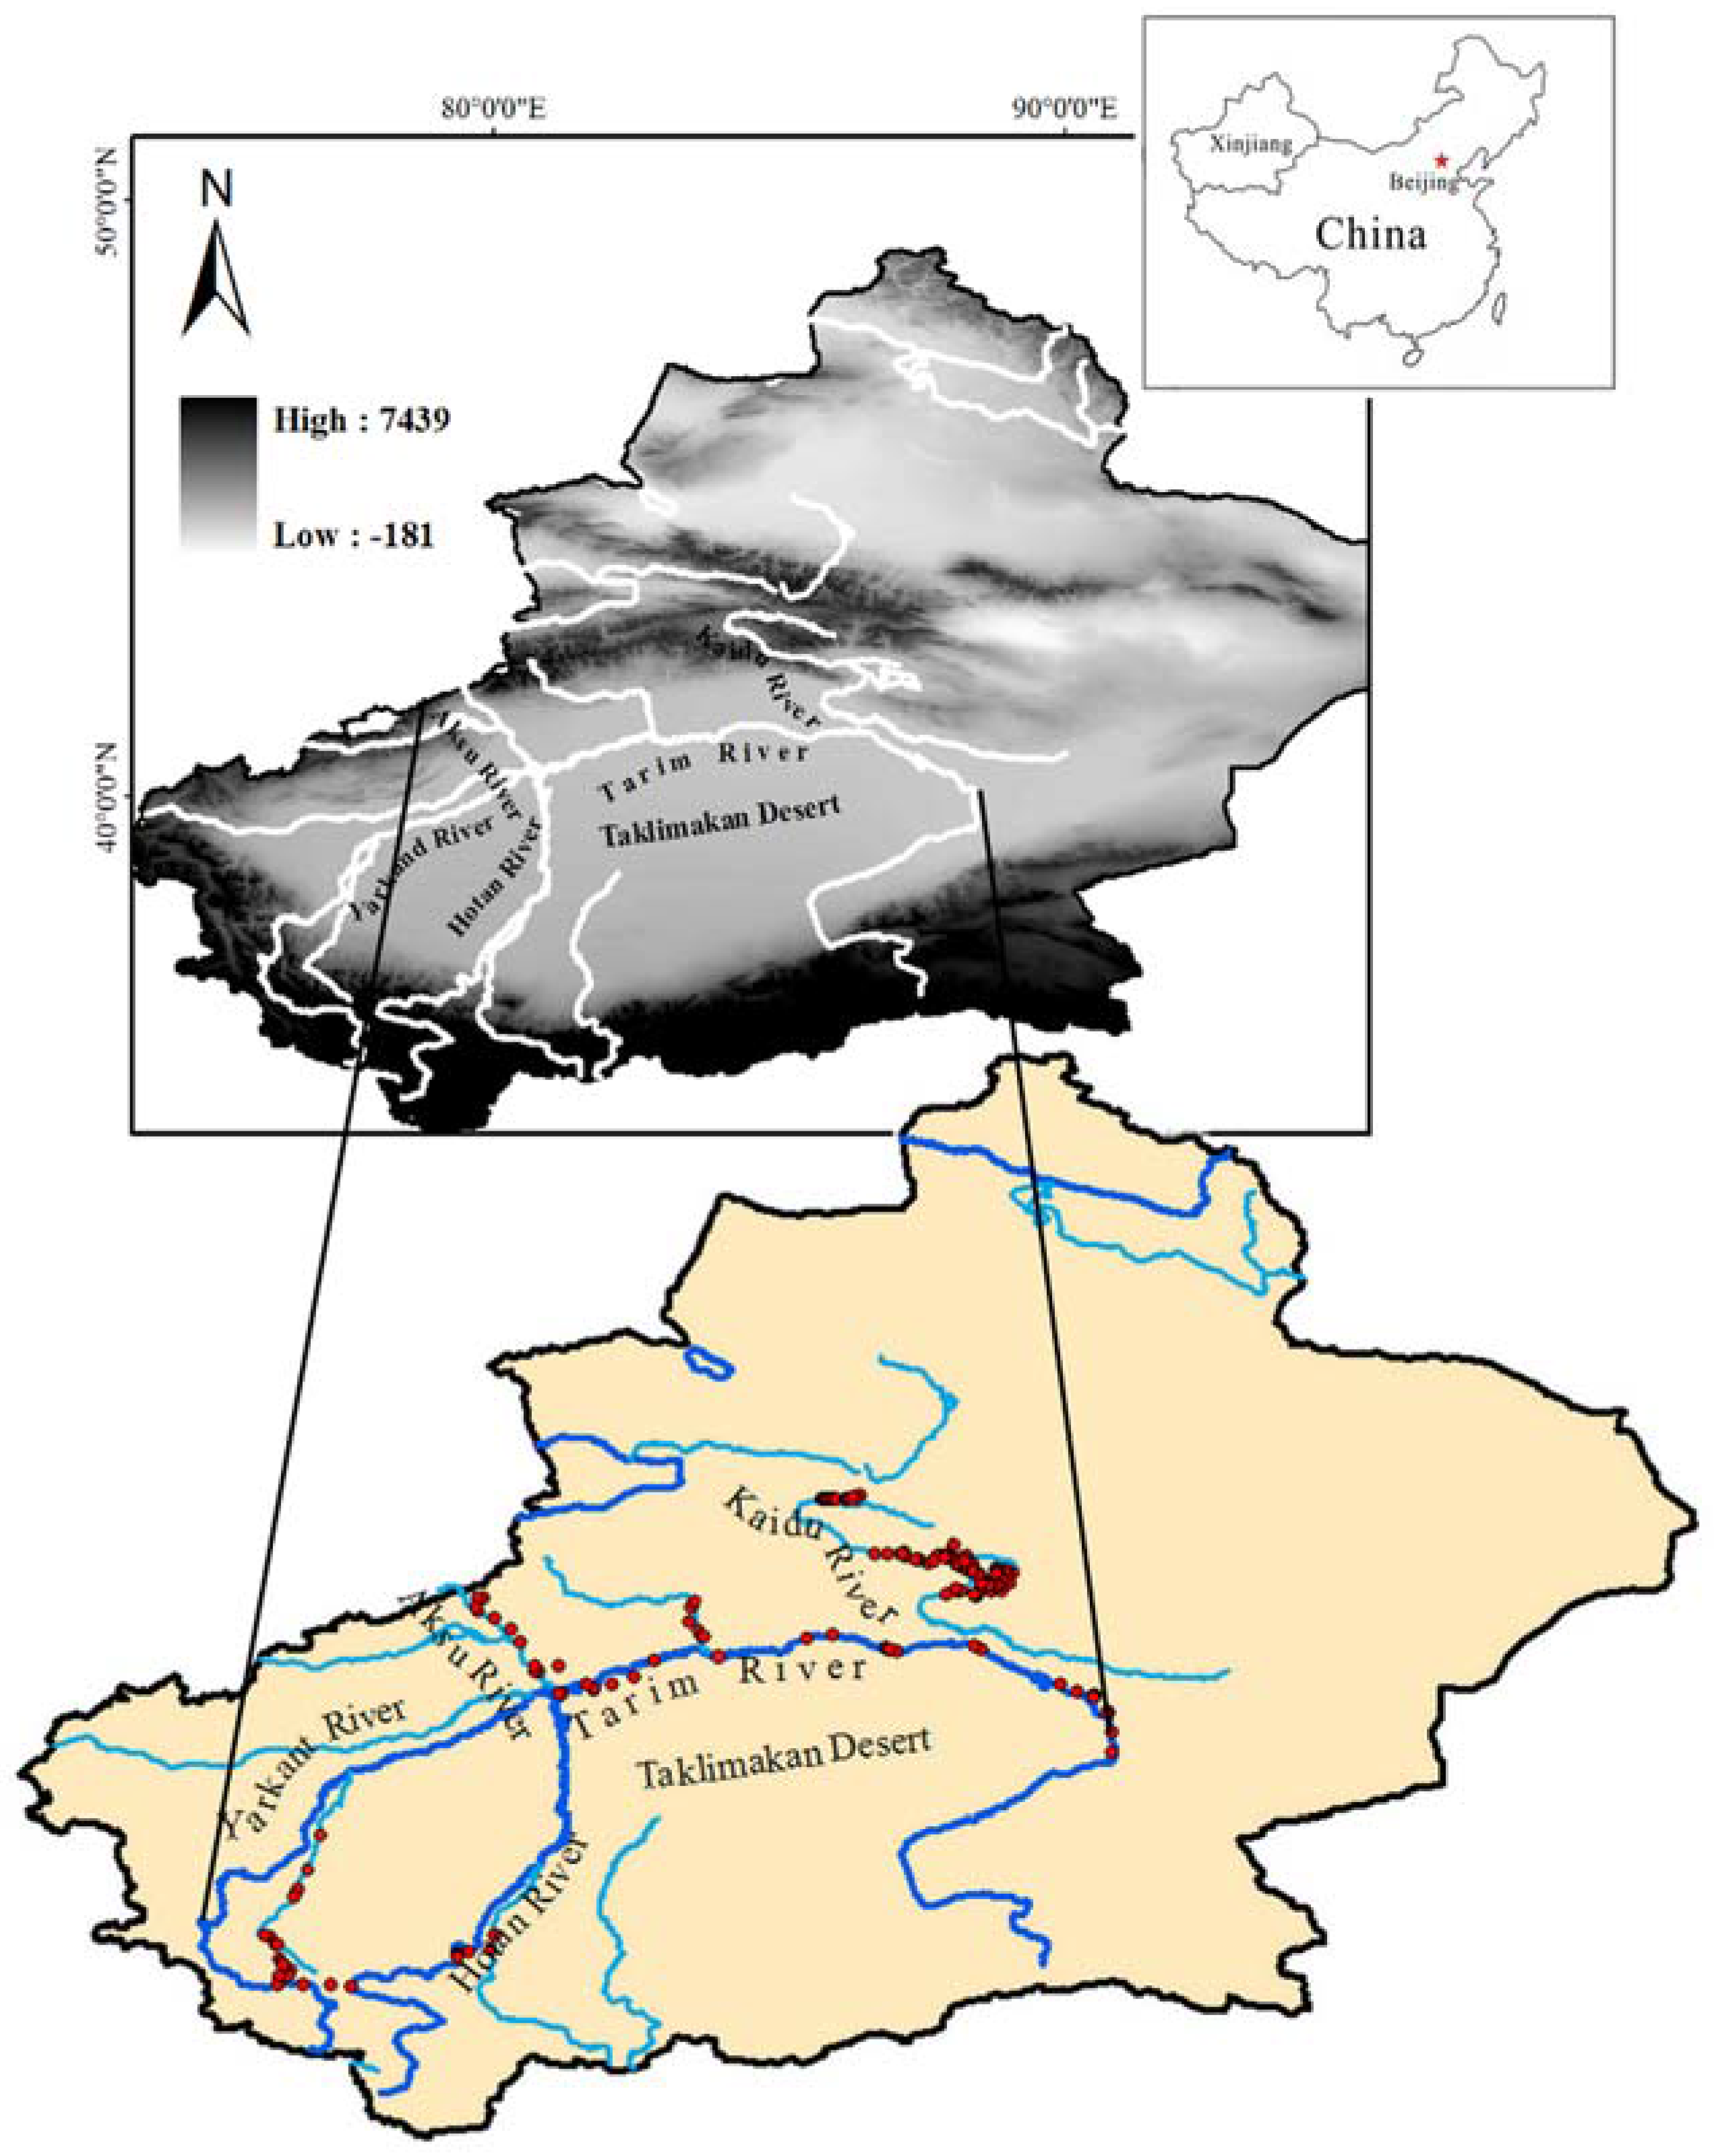
2. Study Area
3. Sampling and Analytical Method
3.1. Sampling
3.2. Measurement
3.3. Baseflow Index Calculation
3.4. Hydrograph Separation
4. Results
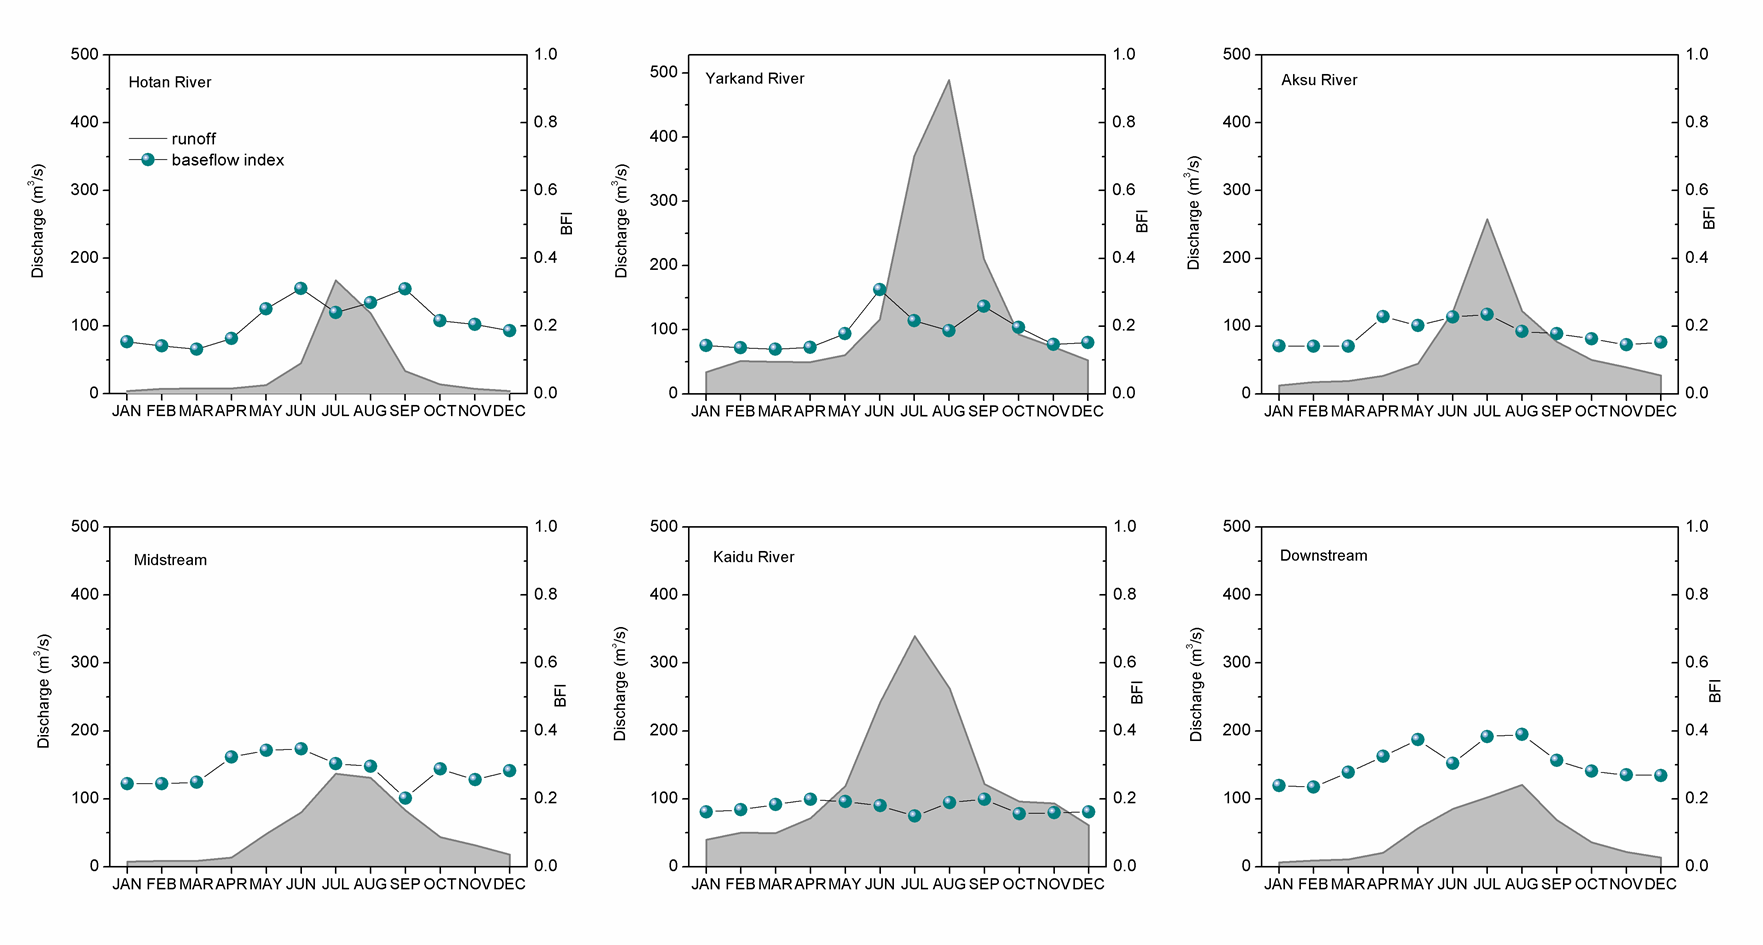
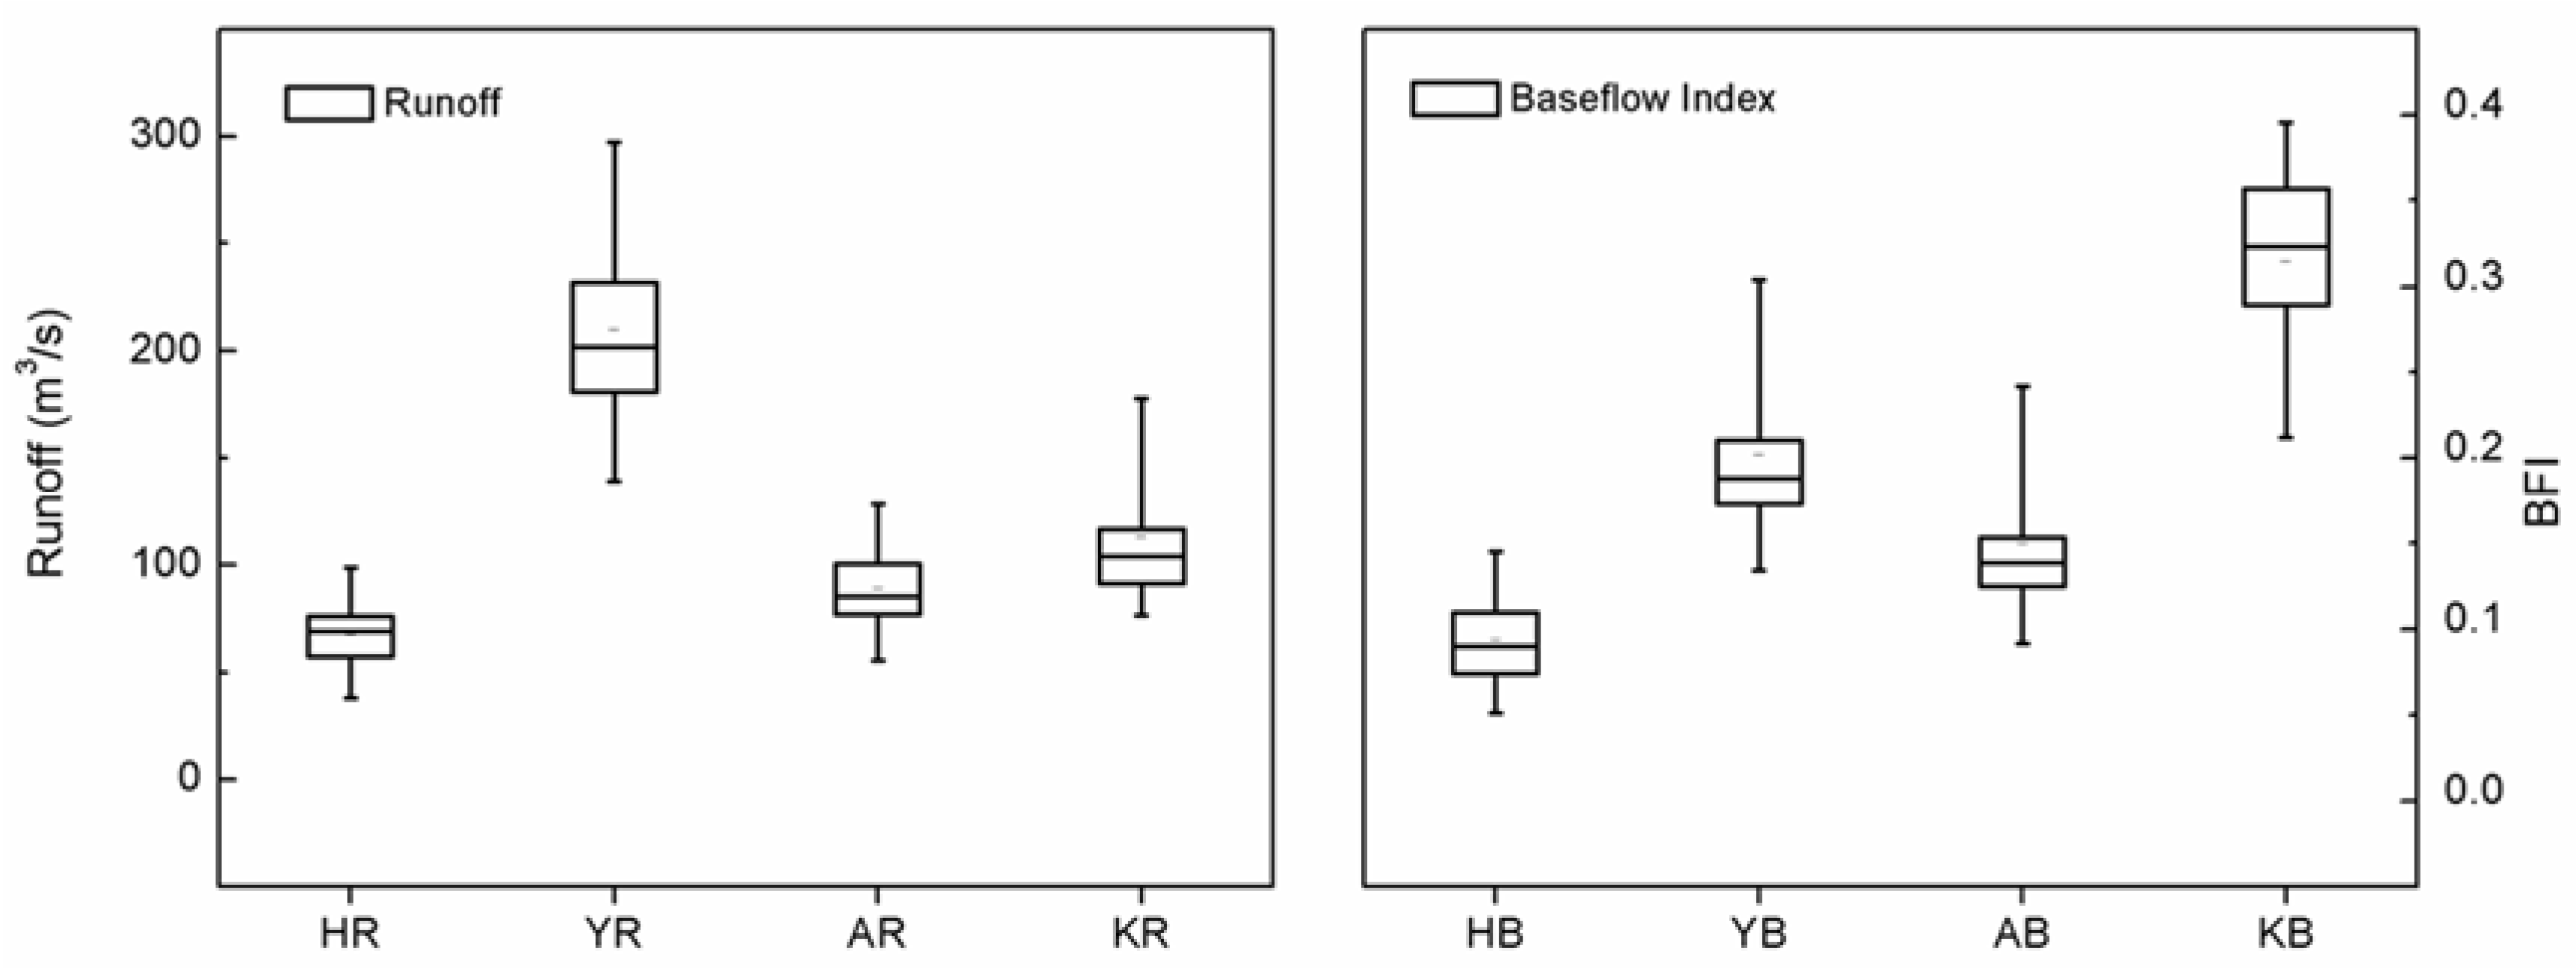
4.1. Characteristics of Discharge and Baseflow
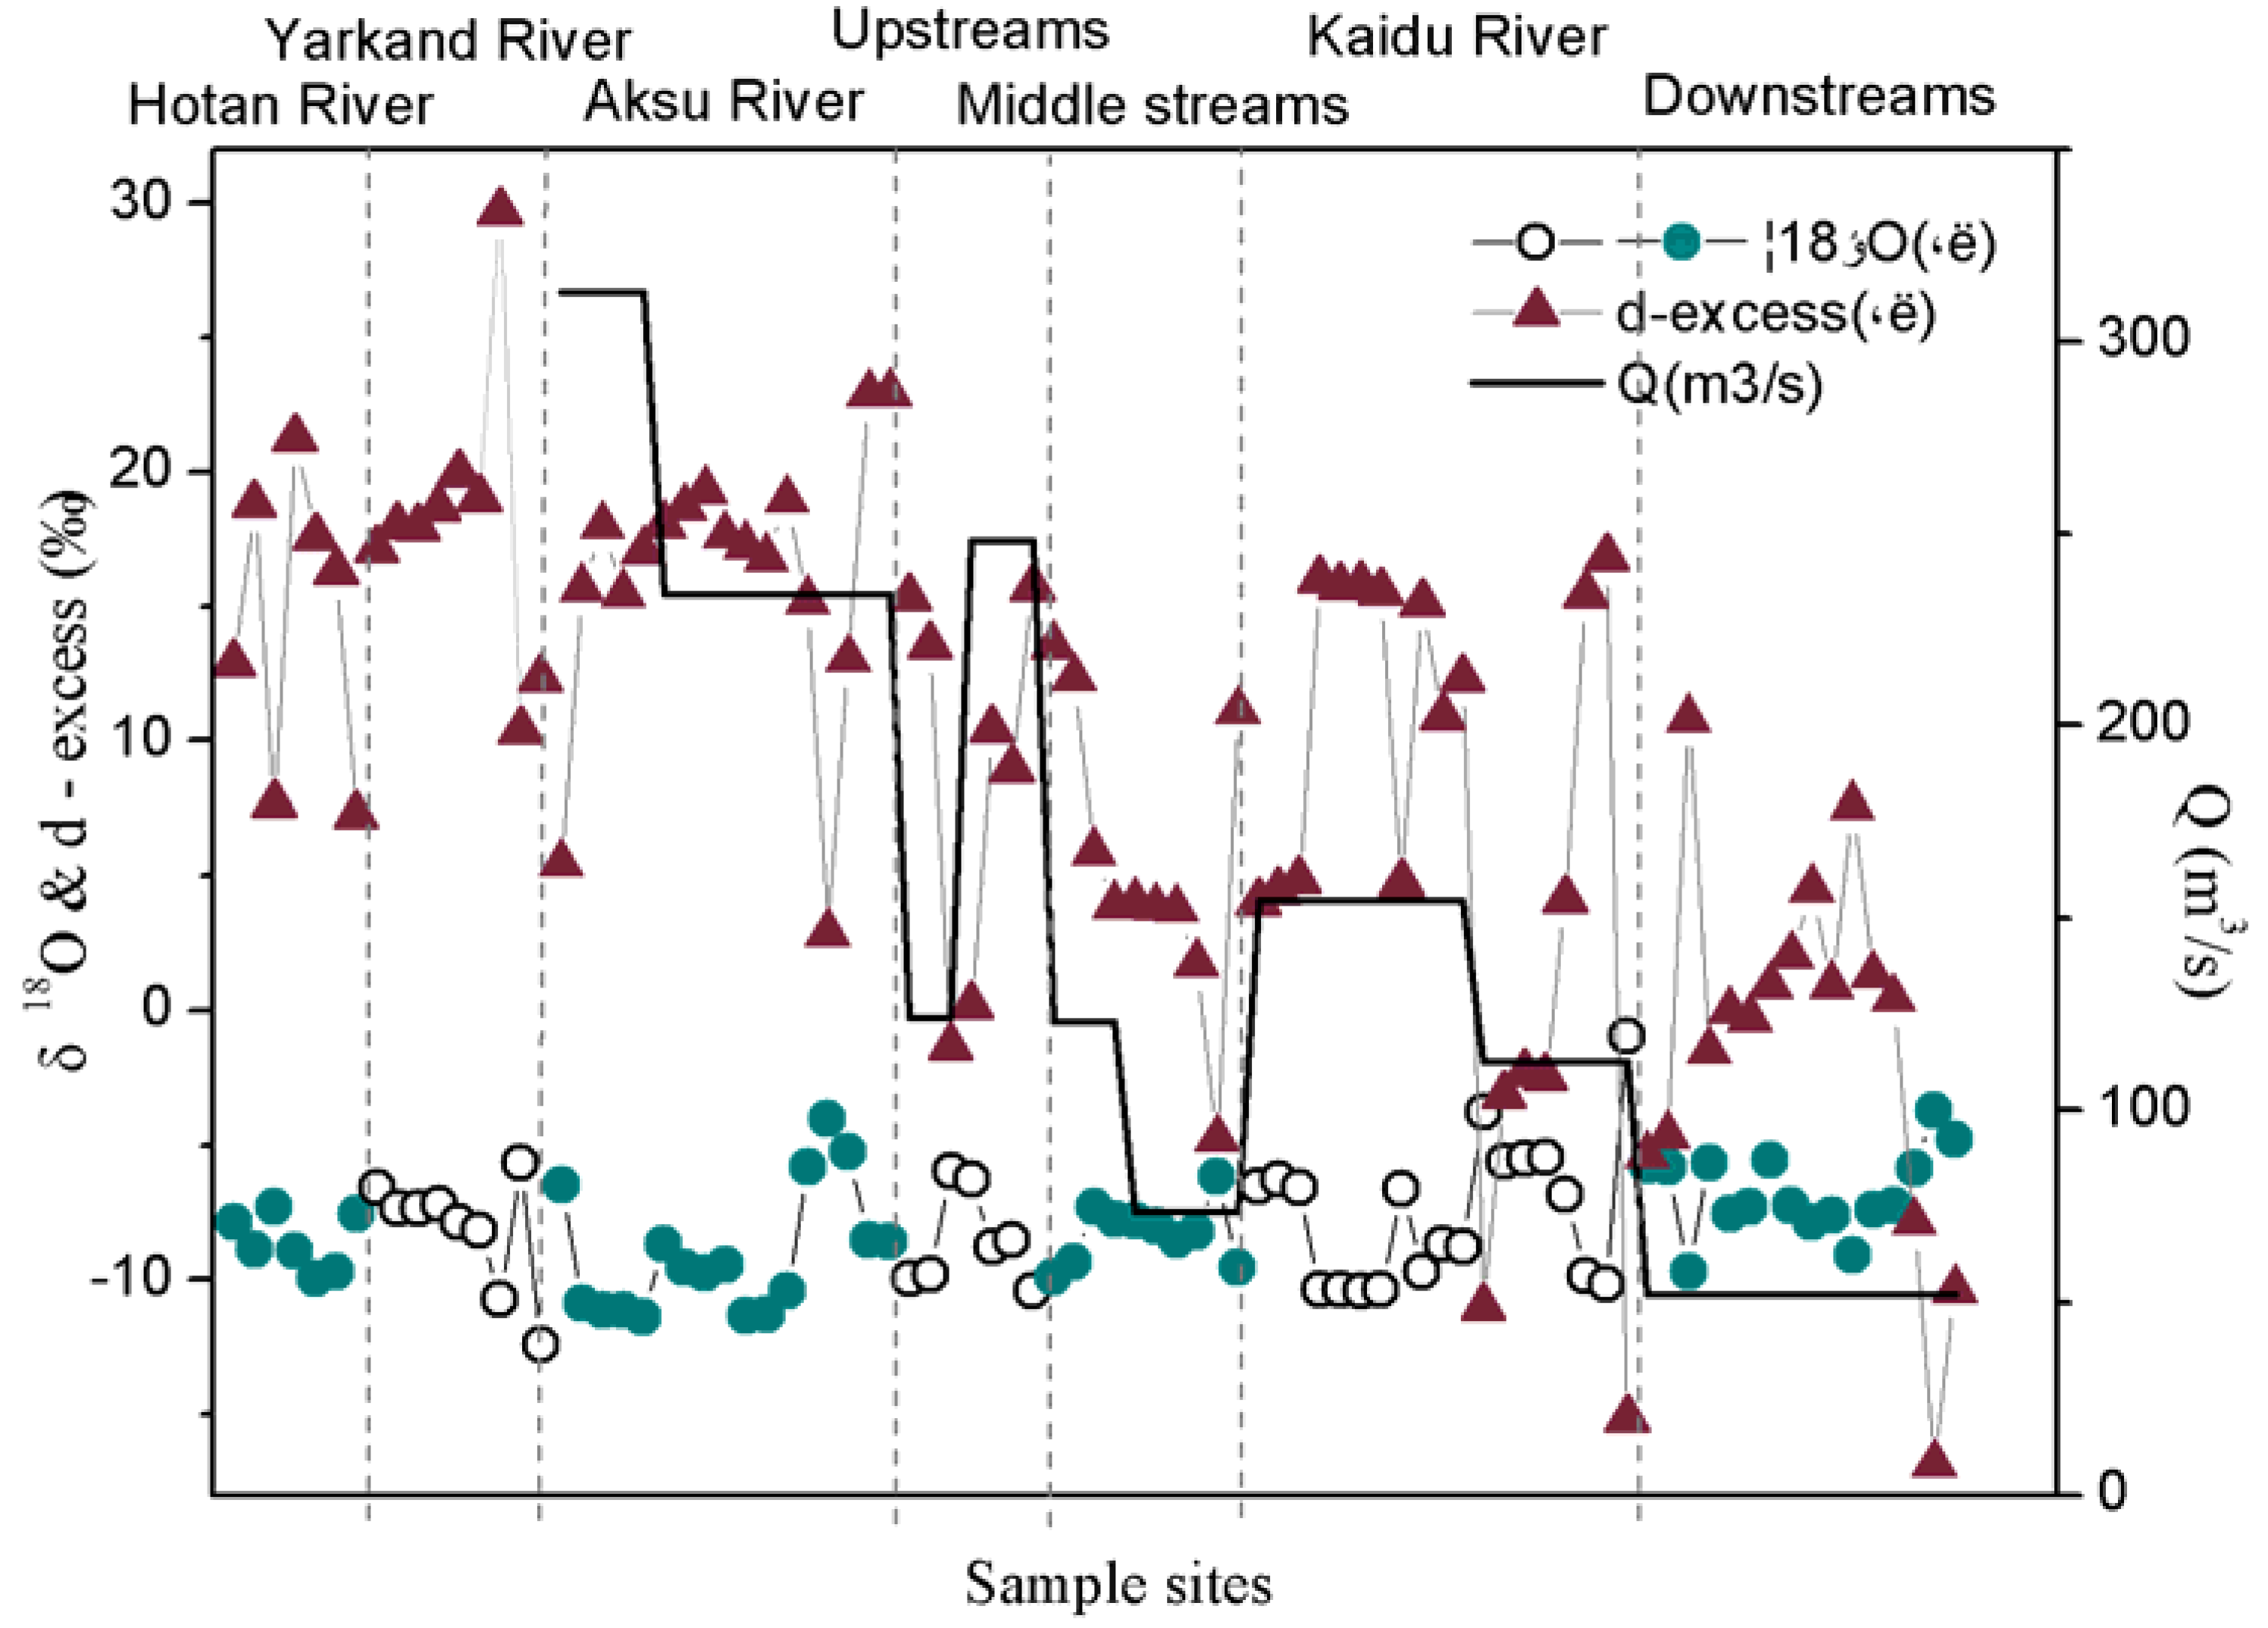
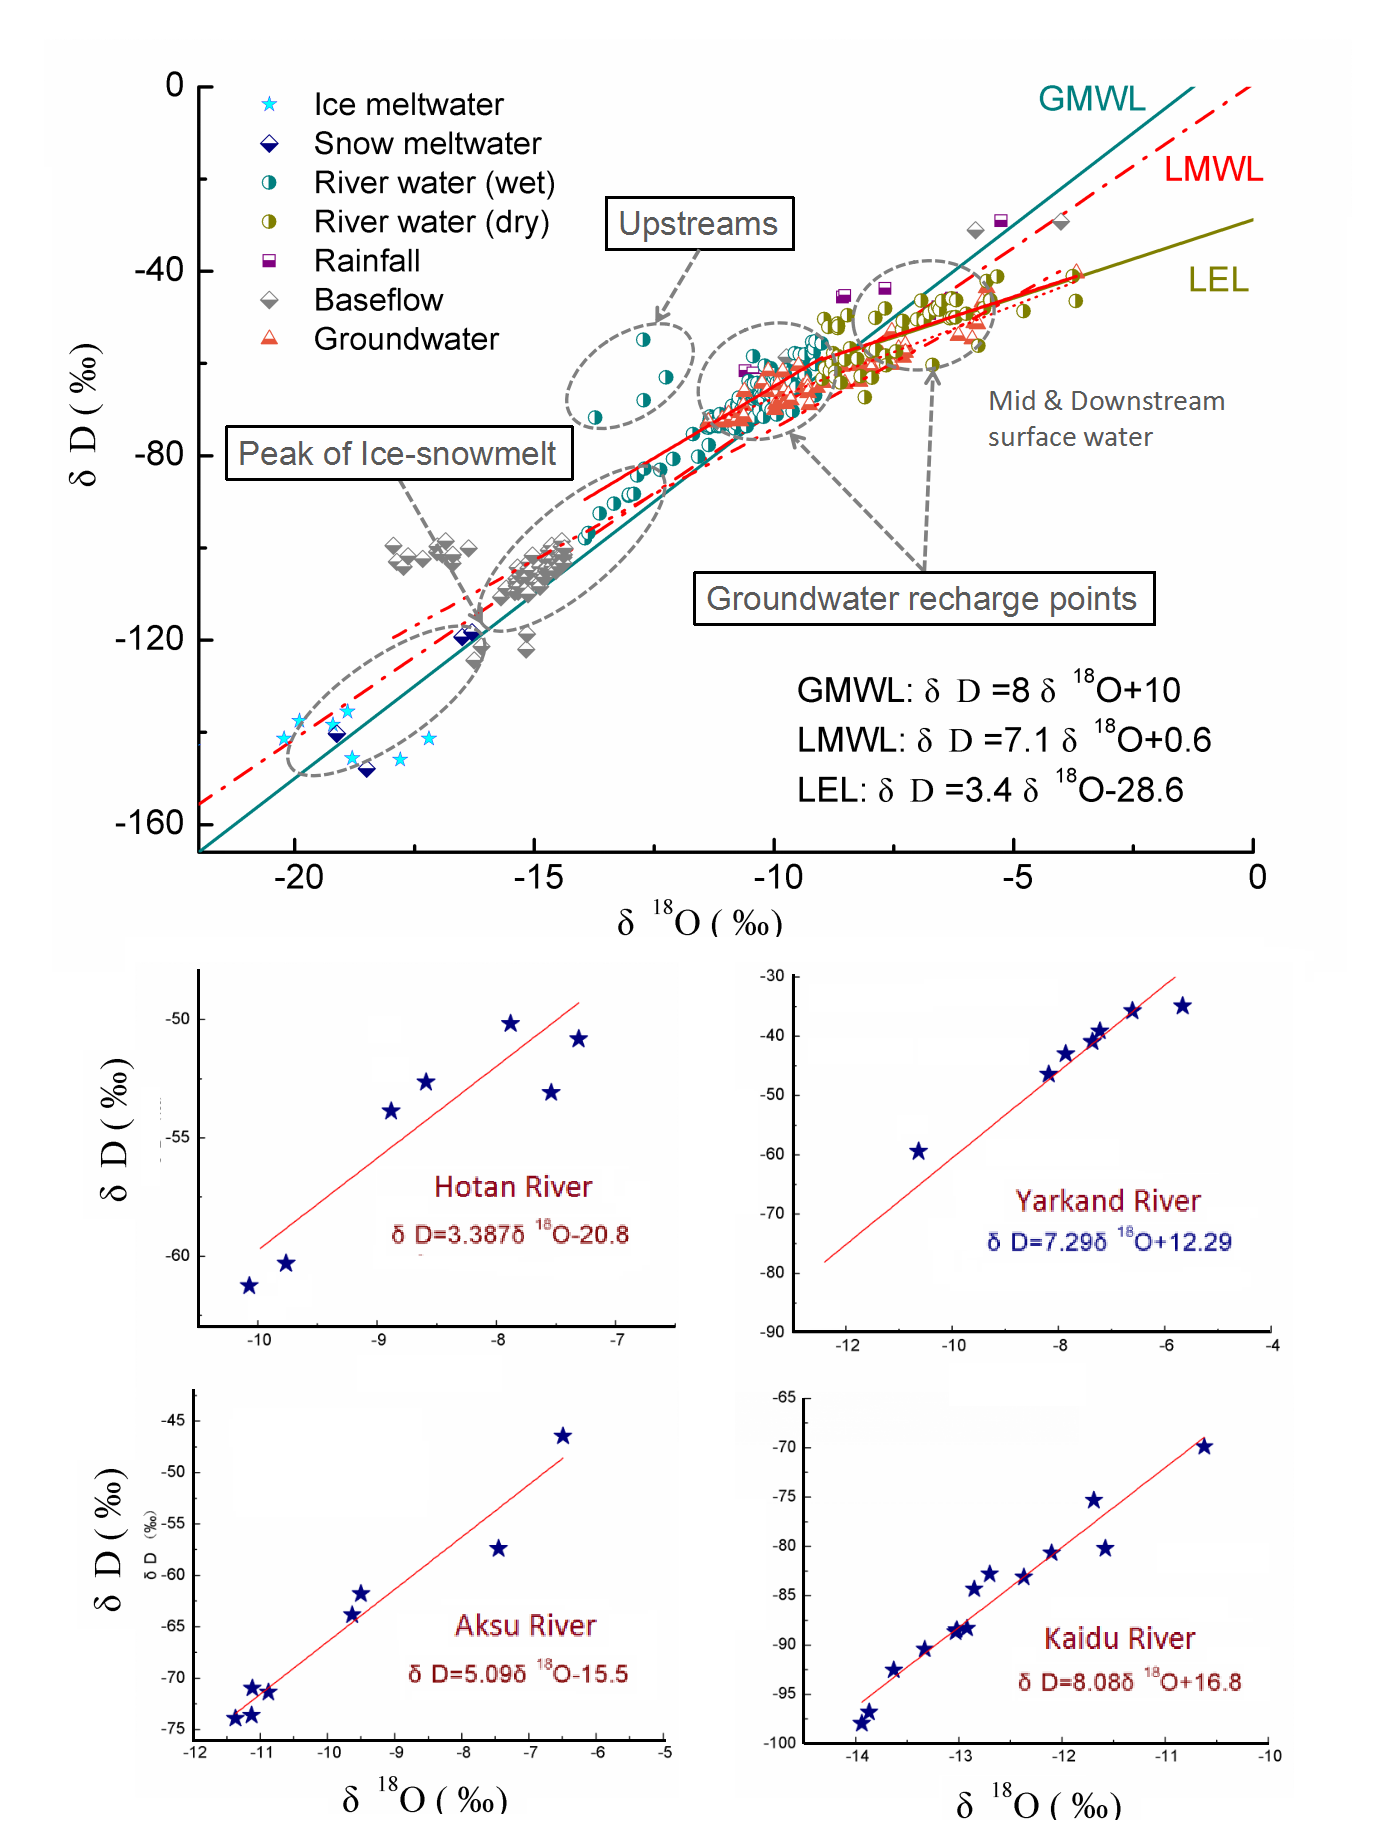
4.2. Characteristics of Water Isotopes
4.3. Hydrograph Separation
5. Discussion
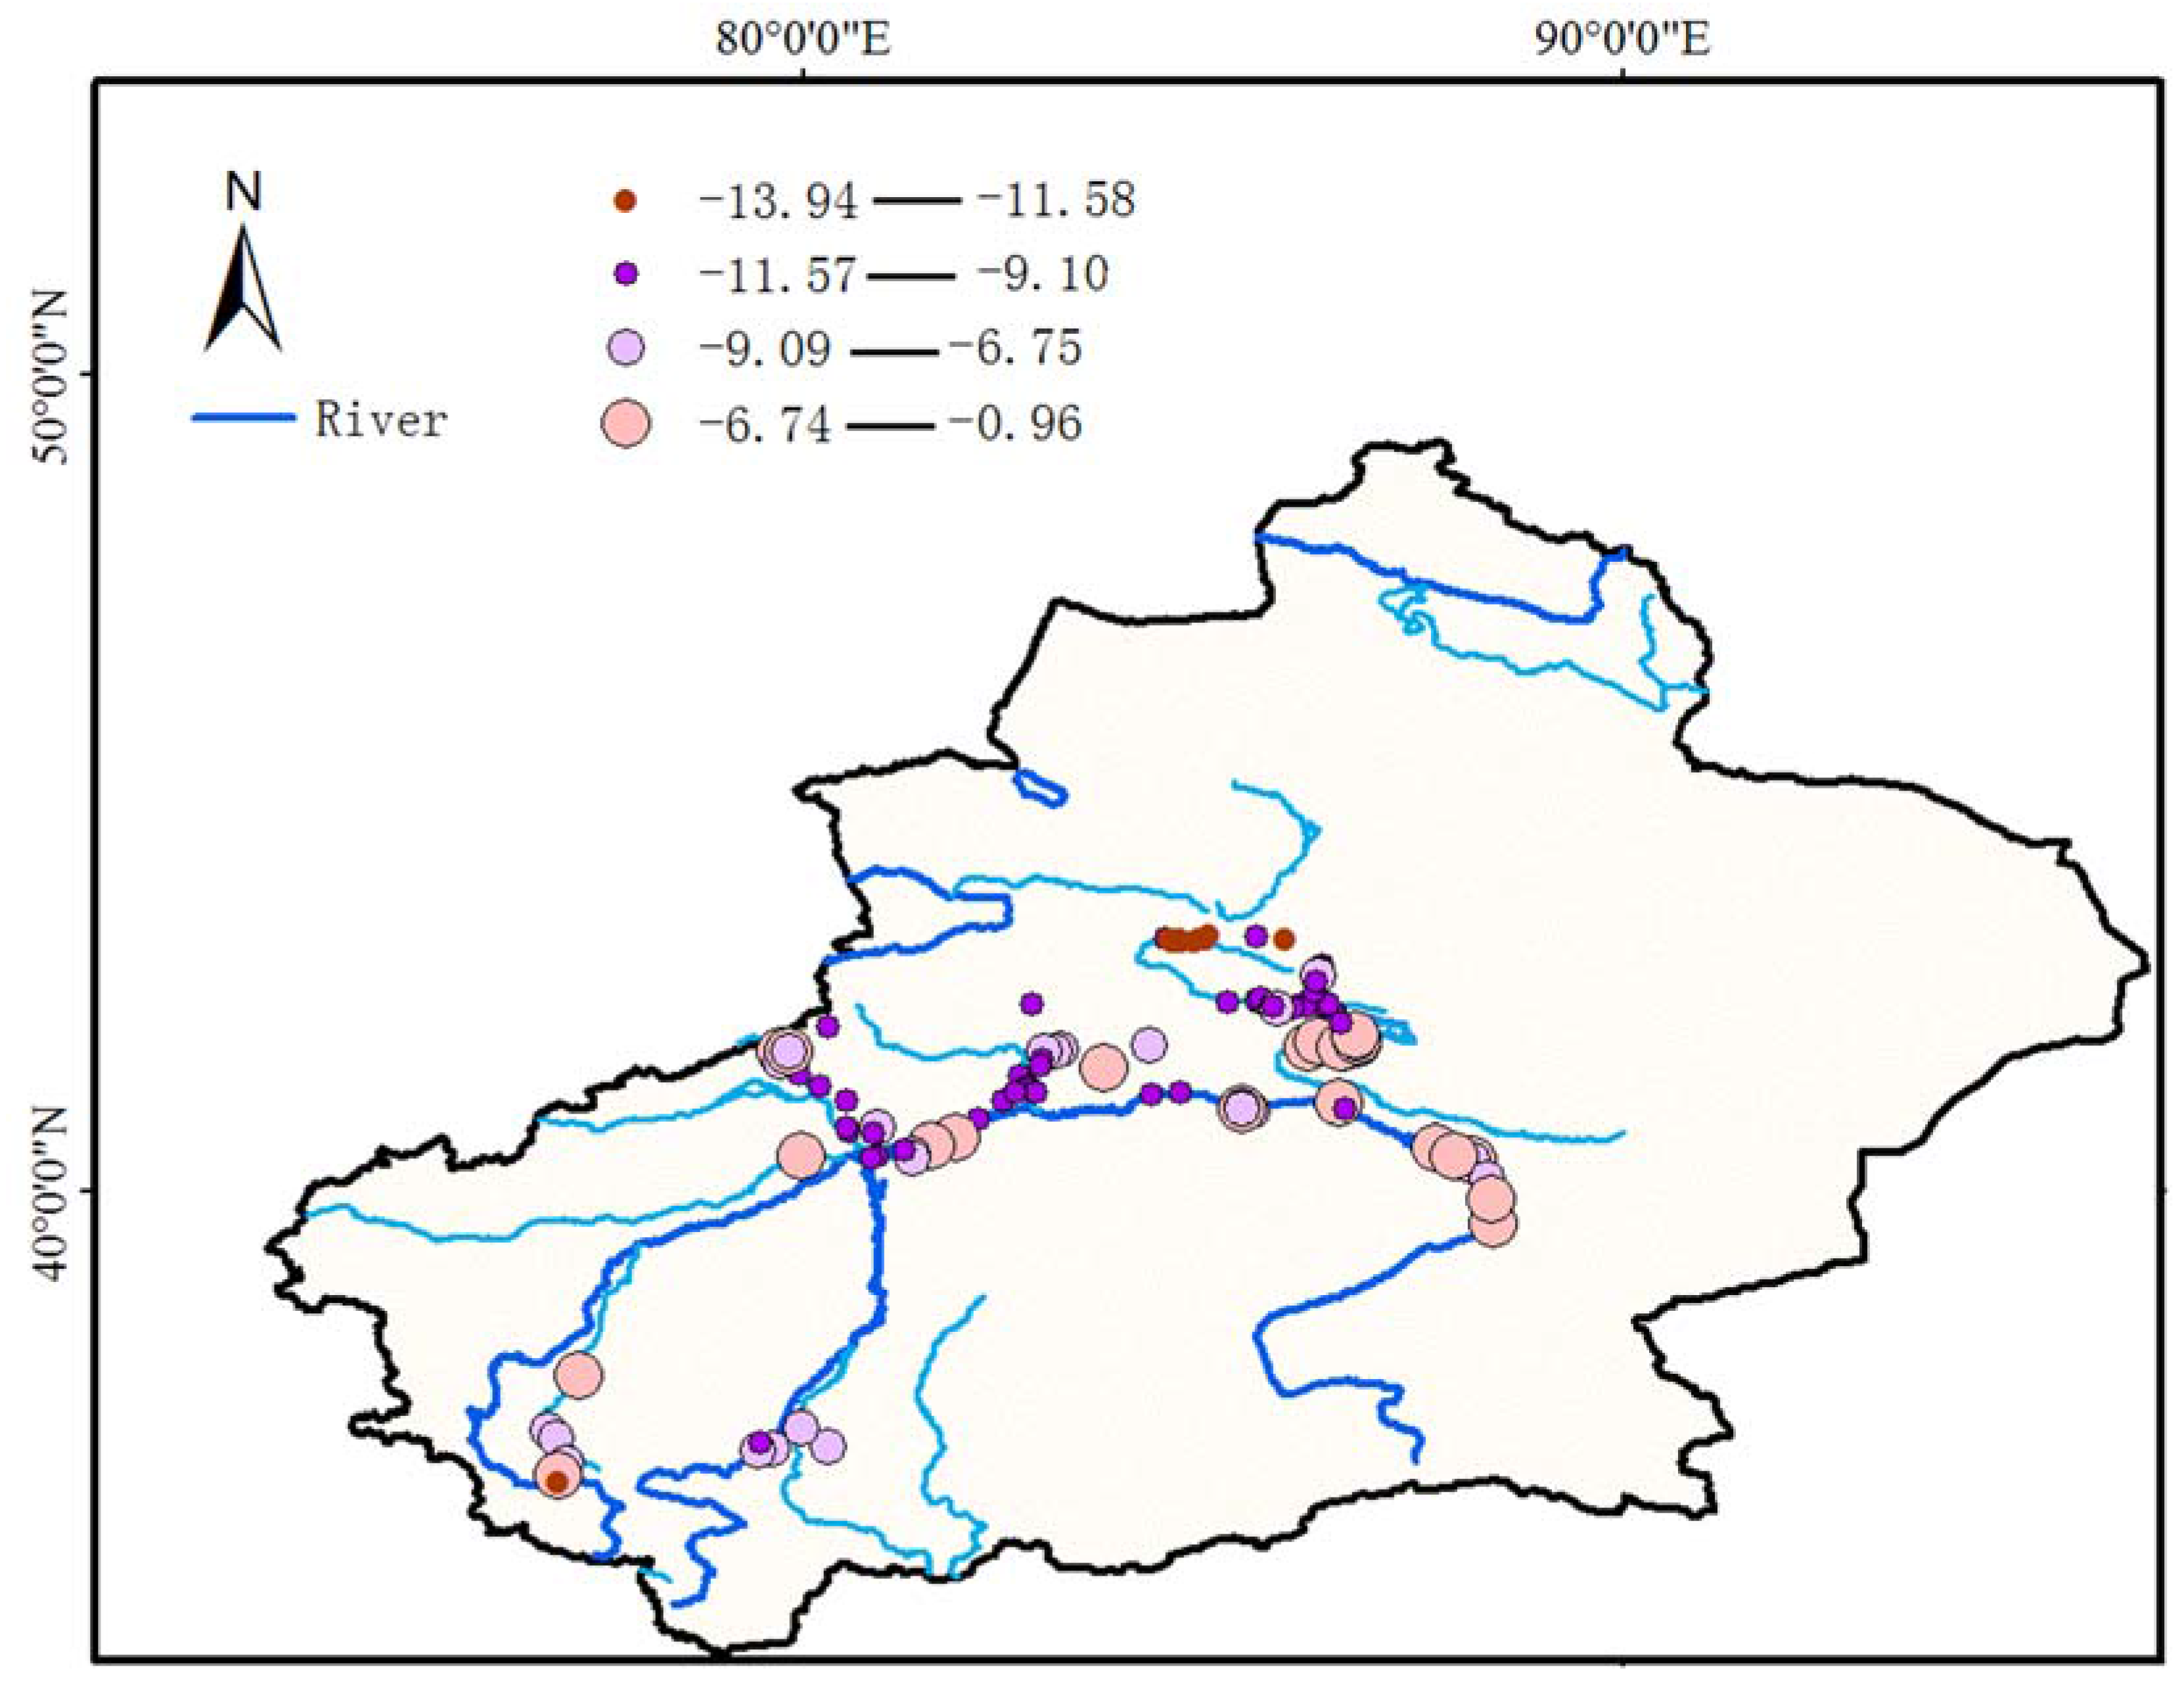
5.1. Reasons for Spatial and Temporal Variations of δD and δ18O
5.2. The Sensitivity of Glacier Rivers to Climate Change
6. Conclusions
Acknowledgments
Author Contributions
Conflicts of Interest
References
- Barnett, T.P.; Adam, J.C.; Lettenmaier, D.P. Potential impacts of a warming climate on water availability in snow-dominated regions. Nature 2005, 438, 303–309. [Google Scholar] [CrossRef] [PubMed]
- Immerzeel, W.W.; van Beek, L.P.H.; Bierkens, M.F.P. Climate change will affect the Asian water towers. Science 2010, 328, 1382–1385. [Google Scholar] [CrossRef] [PubMed]
- Chen, Y.N.; Li, Z.; Fan, Y.T.; Wang, H.J.; Deng, H.J. Progress and prospects of climate change impacts on hydrology in the arid region of northwest China. Environ. Res. 2015, 139, 11–19. [Google Scholar] [CrossRef] [PubMed]
- Hagemann, S.; Chen, C.; Clark, D.B. Climate change impact on available water resources obtained using multiple global climate and hydrology models. Earth Syst. Dyn. Discuss. 2012, 3, 1321–1345. [Google Scholar] [CrossRef]
- Kong, Y.; Pang, Z. Isotope hydrograph separation in alpine catchments: A review. Sci. Cold Arid Reg. 2011, 3, 86–91. [Google Scholar]
- Gibson, J.; Edwards, T.; Birks, S.; Amour, N.; Buhay, W.; McEachern, P.; Wolfe, B.; Peters, D. Progress in isotope tracer hydrology in Canada. Hydrol. Process. 2005, 19, 303–327. [Google Scholar] [CrossRef]
- Fritz, P.; Cherry, J.A.; Weyer, K.U.; Sklash, M. Storm runoff analyses using environmental isotopes and major ions. Panel Proc. Ser. Int. Atom. Energy Agency (IAEA) 1976, 36, 13–24. [Google Scholar]
- Meng, Y.; Liu, G.; Li, M. Tracing the Sources and Processes of Groundwater in an Alpine Glacierized Region in Southwest China: Evidence from Environmental Isotopes. Water 2015, 7, 2673–2690. [Google Scholar] [CrossRef]
- Doveri, M.; Menichini, M.; Cerrina Feroni, A. Stable water isotopes as fundamental tool in karst aquifer studies: Some results from isotopic applications in the Apuan Alps carbonatic complexes (NW Tuscany). Ital. J. Eng. Geol. Environ. 2013, 1, 33–50. [Google Scholar]
- Merlivat, M.; Jouzel, J. Global climatic interpretation of the deuterium-oxygen-18 relationship for precipitation. Geophys. Res. 1979, 84, 5029–5033. [Google Scholar] [CrossRef]
- Eastoe, C.J.; Hutchison, W.R.; Hibbs, B.J.; Hawley, J.; Hogan, J.F. Interaction of a river with an alluvial basin aquifer: Stable isotopes, salinity and water budgets. J. Hydrol. 2010, 395, 67–78. [Google Scholar] [CrossRef]
- Gonfiantini, R.; Frohlich, K.; Araguas-Araguas, L.; Rozanski, K. Isotopes in groundwater hydrology. In Isotope Tracers in Catchment Hydrology; Elsevier Science B.V.: Amsterdam, The Netherlands, 1998; pp. 203–225. [Google Scholar]
- Meredith, K.; Hollins, S.; Hughes, C. The influence of groundwater/surface water exchange on stable water isotopic signatures along the Darling River, NSW, Australia. In Groundwater and Ecosystems; CRC Press: Boca Raton, FL, USA, 2013; p. 57. [Google Scholar]
- Kanduc, T.; Grassa, F.; McIntosh, J. A geochemical and stable isotope investigation of groundwater/surface−water interactions in the Velenje Basin, Slovenia. Hydrogeol. J. 2014, 22, 971–984. [Google Scholar] [CrossRef]
- De Graaf, I.E.M.; van Beek, L.P.H.; Wada, Y. Dynamic attribution of global water demand to surface water and groundwater resources: Effects of abstractions and return flows on river discharges. Adv. Water Resour. 2014, 64, 21–33. [Google Scholar] [CrossRef]
- Wheater, H.S. Hydrological processes, groundwater recharge and surface-water/groundwater interactions in arid and semi-arid areas. In Groundwater Modeling in Arid and Semi-Arid Areas, 1st ed.; Cambridge University Press: Cambridge, UK, 2010; pp. 5–37. [Google Scholar]
- Fan, Y.T.; Chen, Y.N.; Li, W.H. Characteristics of water isotopes and ice-snowmelt quantification in the Tizinafu River, North Kunlun Mountains, Central Asia. Quat. Int. 2014. [Google Scholar] [CrossRef]
- Hugenschmidt, C.; Ingwersen, J.; Sangchan, W. A three-component hydrograph separation based on geochemical tracers in a tropical mountainous headwater catchment in northern Thailand. Hydrol. Earth Syst. Sci. 2014, 18. [Google Scholar] [CrossRef]
- Xie, F.M.; Mao, W.Y.; Zhang, J.G. Analysis of streamflow from four source rivers to mainstream of the Tarim River. J. Glaciol. Geocryol. 2007, 29, 559–569. [Google Scholar]
- Fan, Y.T.; Chen, Y.N.; Liu, Y.B. Variation of Baseflows in the Headstreams of the Tarim River Basin during 1960–2007. J. Hydrol. 2013, 487, 98–108. [Google Scholar] [CrossRef]
- Fan, Y.T.; Chen, Y.N.; Li, W.H. Response of runoff to temperature and precipitation changes in Tarim River during the past 50 years. J. Arid Land 2011, 3, 220–230. [Google Scholar] [CrossRef]
- Dansgaard, W. Stable isotopes in precipitation. Tellus 1964, 16, 436–468. [Google Scholar] [CrossRef]
- Antonia, L.; Paolo, V. Baseflow index regionalization analysis in a mediterranean area and data scarcity context: Role of the catchment permeability index. J. Hydrol. 2008, 355, 63–75. [Google Scholar]
- Clark, I.D.; Fritz, P. Environmental Isotopes in Hydrogeology; CRC Press Lewis Publishers: Boca Raton, FL, USA, 1997. [Google Scholar]
- Craig, H. Isotope variations in meteoric waters. Science 1961, 133, 1702–1703. [Google Scholar] [CrossRef] [PubMed]
- Pang, Z.; Kong, Y.; Froehlich, K.; Huang, T.; Yuan, L.; Li, Z.; Wang, F. Processes affecting isotopes in precipitation of an arid region. Tellus 2011, 63, 352–359. [Google Scholar] [CrossRef]
- Froehlich, K.; Kralik, M.; Papesch, W.; Rank, D.; Scheifinger, H. Deuterium excess in precipitation of Alpine regions moisture recycling. Isot. Environ. Health Stud. 2008, 44, 61–70. [Google Scholar] [CrossRef] [PubMed]
- Zhao, Z.; Tian, L.; Fischer, E.; Li, Z.; Jiao, K. Study of chemical composition of precipitation at an alpine site and a rural site in Urumqi River Valley, Eastern Tien Shan, China. Atmos. Environ. 2008, 42, 8934–8942. [Google Scholar] [CrossRef]
- Sun, C.; Li, W.; Chen, Y.; Li, X.; Yang, Y. Isotopic and hydrochemical composition of runoff in the Urumqi River, Tianshan Mountains, China. Environ. Earth Sci. 2015, 74, 1–17. [Google Scholar]
- Lambrecht, A.; Kuhn, M. Glacier changes in the Austrian Alps during the last three decades, derived from the new Austrian glacier inventory. Ann. Glaciol. 2007, 46, 177–184. [Google Scholar] [CrossRef]
- Lambrecht, A.; Mayer, C. Temporal variability of the non-steady contribution from glaciers to water discharge in western Austria. J. Hydrol. 2009, 376, 353–361. [Google Scholar] [CrossRef]
- Shi, Y.; Liu, S. Estimation on the response of glaciers in China to the global warming in the 21st century. Chin. Sci. Bull. 2000, 45, 668–672. [Google Scholar] [CrossRef]
- Pang, Z.; Huang, T.; Chen, Y. Diminished groundwater recharge and circulation relative to degrading riparian vegetation in the middle Tarim River. Hydrol. Process. 2010, 24, 145–157. [Google Scholar]


| Sampling Region | Water Type | No. | δ18O (‰ V-SMOW) | δD (‰ V-SMOW) | D-excess | ||||
|---|---|---|---|---|---|---|---|---|---|
| Max | Min | Mean | Max | Min | Mean | Mean | |||
| Hotan River | Ice-snowmelt | 46 | −10.44 | −10.11 | −10.72 | −70.35 | −68.52 | −69.14 | 16.62 |
| Precipitation | −6.29 | −2.41 | −2.55 | −45.88 | −30.28 | −25.65 | −5.25 | ||
| River water | −49.21 | −6.37 | −6.64 | −53.24 | −41.05 | −48.30 | 4.82 | ||
| Groundwater | −10.70 | −7.58 | −9.70 | −72.48 | −59.72 | −66.79 | 10.81 | ||
| Yarkand River | Ice-snowmelt | 32 | −19.12 | −11.02 | −11.19 | −140.25 | −70.56 | −72.20 | 17.32 |
| Precipitation | −8.52 | −4.62 | −4.80 | −45.27 | −35.17 | −38.80 | −0.40 | ||
| River water | −12.10 | −7.67 | −8.78 | −80.68 | −58.28 | −59.82 | 10.45 | ||
| Groundwater | −9.29 | −6.15 | −7.54 | −66.36 | −53.98 | −53.08 | 7.24 | ||
| Aksu River | Ice-snowmelt | 45 | −18.50 | −10.23 | −11.17 | −147.91 | −70.24 | −72.72 | 16.67 |
| Precipitation | −8.57 | −4.85 | −5.19 | −45.64 | −28.80 | −29.06 | 12.45 | ||
| River water | −8.66 | −7.01 | −7.85 | −51.90 | −50.48 | −57.04 | 5.80 | ||
| Groundwater | −10.12 | −7.87 | −9.94 | −64.36 | −58.45 | −64.66 | 14.83 | ||
| Kaidu River | Ice-snowmelt | 68 | −16.50 | −10.23 | −11.17 | −119.30 | −74.13 | −73.61 | 15.78 |
| Precipitation | −4.79 | −3.70 | −3.98 | −48.70 | −46.44 | −51.25 | −19.42 | ||
| River water | −10.76 | −5.49 | −7.52 | −68.90 | −46.23 | −57.40 | 2.78 | ||
| Groundwater | −11.37 | −7.75 | −10.58 | −72.72 | −58.12 | −66.08 | 18.58 | ||
| Middle Stream | Precipitation | 15 | −10.11 | −4.83 | −6.61 | −61.19 | −28.64 | −47.72 | 5.20 |
| River water | −13.94 | −8.52 | −9.53 | −97.96 | −59.22 | −65.24 | 10.96 | ||
| Groundwater | −10.64 | −5.82 | −8.26 | −69.15 | −51.22 | −60.49 | 5.55 | ||
| Downstream | Precipitation | 18 | −6.29 | −3.65 | −3.87 | −45.88 | −19.20 | −29.06 | 1.87 |
| River water | −10.78 | −5.73 | −7.78 | −73.06 | −56.19 | −57.04 | 5.21 | ||
| Groundwater | −8.02 | −5.75 | −7.21 | −61.56 | −51.40 | −50.82 | 6.90 | ||
| Sampling Region | River Water | Rainfall | Groundwater | Ice-Snowmelt Water | Estimated Fractions (%) | ||
|---|---|---|---|---|---|---|---|
| (δ18O, ‰) | (δ18O, ‰) | (δ18O, ‰) | (δ18O, ‰) | Rainfall | Groundwater | Ice-Snowmelt Water | |
| Hotan River | −6.64 | −2.55 | −9.70 | −10.72 | 26.18 | 58.85 | 14.97 |
| Yarkand River | −8.78 | −4.80 | −7.54 | −11.19 | 9.04 | 50.10 | 40.85 |
| Aksu River | −7.85 | −5.19 | −9.94 | −11.17 | 54.80 | 20.59 | 24.61 |
| Kaidu River | −7.52 | −3.98 | −10.58 | −11.17 | 49.91 | 15.34 | 34.75 |
| Middle Stream | −9.53 | −6.61 | −8.26 | −17.91 | / | −69.58 | / |
| Downstream | −7.78 | −3.87 | −7.21 | −19.49 | / | −92.45 | / |
© 2016 by the authors; licensee MDPI, Basel, Switzerland. This article is an open access article distributed under the terms and conditions of the Creative Commons Attribution (CC-BY) license (http://creativecommons.org/licenses/by/4.0/).
Share and Cite
Fan, Y.; Chen, Y.; He, Q.; Li, W.; Wang, Y. Isotopic Characterization of River Waters and Water Source Identification in an Inland River, Central Asia. Water 2016, 8, 286. https://doi.org/10.3390/w8070286
Fan Y, Chen Y, He Q, Li W, Wang Y. Isotopic Characterization of River Waters and Water Source Identification in an Inland River, Central Asia. Water. 2016; 8(7):286. https://doi.org/10.3390/w8070286
Chicago/Turabian StyleFan, Yuting, Yaning Chen, Qing He, Weihong Li, and Yun Wang. 2016. "Isotopic Characterization of River Waters and Water Source Identification in an Inland River, Central Asia" Water 8, no. 7: 286. https://doi.org/10.3390/w8070286