Article

Isotopic Characterization of River Waters and Water Source Identification in an Inland River, Central Asia

1
Key Laboratory of Tree-Ring Physical and Chemical Research of China Meteorological Administration/Xinjiang Laboratory of Tree Ring Ecology, Institute of Desert Meteorology, China Meteorological Administration, Urumqi 830002, China
2
State Key Laboratory of Desert and Oasis Ecology, Xinjiang Institute of Ecology and Geography, CAS, Urumqi 830011, China
*
Author to whom correspondence should be addressed.
Water 2016, 8(7), 286; https://doi.org/10.3390/w8070286
Submission received: 11 March 2016 / Revised: 28 June 2016 / Accepted: 7 July 2016 / Published: 12 July 2016

Abstract

:
Understanding runoff generation and dynamics is the basis for water resource management, while water isotopic ratios are a potential tool for studying the mechanism on a large scale. In this paper, spatial variations of δ18O and δD of river water and their sources within a large region of the Tarim River were investigated. The results showed obvious spatial variations of both water isotope values along the river flow direction, and significant seasonal variation occurred within the river water isotopes. This indicated that different proportions of rain and melt water entering river water should lead to spatial variation, and for mid-stream and downstream regions, the transformation relationship between surface water and groundwater should consider less input of melt water. Furthermore, we quantitatively determine the ratio of different water sources using the stable isotope mass balance method and other stable tracer elements. Results showed the contribution of ice-snowmelt water varied from 14.97% to 40.85%, that of rain varied from 9.04% to 54.80%, and that of groundwater varied from 15.34% to 58.85%, and they also showed that baseflow is a factor connecting melt water and groundwater, which meant the Hotan River and the Yarkand River are melt water–dependent rivers, and seasonal precipitation is the main water supply source of baseflow in the Aksu River and the Kaidu River.

1. Introduction

Water demand consistently exceeds supply in many parts of the world, especially in the arid and semi-arid regions [1,2]. As human water need is increasing worldwide, the growth of pressure on water resources and their sustainable development is in jeopardy [3,4]. The Tarim River Basin, with a size of 1.02 × 10⁶ km2, is the largest inland river basin in Central Asia. The basin occupies about two-thirds of the total area of Xinjiang (the largest provincial administration unit of China). This northwestern arid inland region is situated far from the sea with a typical continental climate, lack of precipitation, intensive evaporation, and extremely fragile ecological environment. The Tarim is a typical braided river, forming a north-south alluvial plain with a width of more than 100 km [3]. By river erosion and stacking interactions, the riverbed is very unstable, and the river positional swing is strong. Runoff generation and dynamics are important issues for this watershed and water resource management, but the mechanism at such a large scale is unclear and site-dependent; for this reason, suitable hydrograph separation is needed for analysis of the recharge mechanism.
Nowadays, hydrograph separation methods include graphical, time-interval, and filtering methods, as well as hydrology and water balance models [5,6]. In the arid and semi-arid areas, a combination of hydrology and environmental isotope technology (18O, D) has been demonstrated to be a meritorious tool for investigating the process of water circulation [7,8]. Isotopes of particular interest for hydrological studies include the stable isotopes of water (18O, D), which are incorporated within the water molecule (H218O, HD16O) [7], and because of isotope fractionation, they show regular spatial and temporal variations with the water cycle phase changes and diffusion [9,10,11]. It is reasonable to use isotopic techniques to study the water sources and supply mechanism of surface water and groundwater [6,12,13,14,15], the evaporation of water bodies, and the mixing processes among various headwaters [16,17,18]. Isotope hydrograph separation (IHS) could provide a quantitative method to differentiate the replenishment of rivers for water resource management, especially in ungauged basins. Therefore, the isotope hydrograph separation method has been a helpful tool for providing information on the different contributions of river components. Over several decades, IHS has undergone two-component hydrograph separation (1970–1980), three-component hydrograph separation (1980–1990), and uncertainty analysis (1990s–present), and has been applied in many catchments all over the world [5].
Through a review of published papers, we found there are still opportunities for improving the understanding of groundwater isotopes: (1) quite a few studies quantified the recharge proportion via kinetic fractionation of stable isotopes in the large inland rivers of Central Asia and (2) there are several shortcomings associated with the quantitative assessment of ice-snowmelt water and baseflow for mountain-plain areas. Alpine catchments are of great importance as the origin of much of the world’s water resources [19]. However, knowledge of the significance of the mountainous hydrological cycle is still uncertain. Natural stable isotopes of hydrogen and oxygen dissolved in water are very useful to study hydrological processes and determine water sources. There are two aims of this study: (i) to investigate spatial and temporal variations of δD and δ18O of river water and their sources within the large area of the Tarim River in northwestern China; and (ii) to evaluate the ratio of different water types in the river water from a high mountain area to the downstream region. Taken altogether, we expect that the results will provide insight for water resource and watershed management in the large inland river basin and similar watersheds of Central Asia.

2. Study Area

The landforms of the Tarim River Basin include mountains (47%), plains (22%), desert (31%), and an arable land area of 1.36 × 10⁶ km2 (Figure 1). The Aksu River, Yarkand River, and Hotan River join the Tarim River in the upper reaches, while the Kaidu River flows into the Tarim River in the lower reaches [19]. The Tarim River Basin is the largest inland river basin in China; the majority of the basin is located in Xinjiang, the largest provincial administration unit of China, and occupies about two-thirds of the total area of Xinjiang [20]. The Tarim River is about 1321 km long, from the confluence composed of the Aksu, Hotan, and Yarkand Rivers to Taitema Lake [21].
The Hotan River, formerly known as the Khotan, runs through the Xinjiang Uygur Autonomous Region in the southwestern Tarim Basin. It is the largest river on the northern slope of the Kunlun Mountains. The main stream, Yurungkax, comes from the northern foot of the Kunlun Mountains, while the smaller stream, the Karakax River, descends from the Karakoram Mountains. Where the Yurungkax and the Karakax converge, the Hotan River begins. The Hotan is divided into two tributaries. The eastern branch of the old Hotan River downstream has completely dried up, but the western branch of the new Hotan River runs for 806 km through the Taklimakan Desert, in the vicinity of the upstream reservoir and the Aksu and Yarkand River confluence, where the Tarim River begins.
The Yarkand River, at 996 km, is the Kashi region’s longest river, and it originates in the Karakoram Pass of the Karakoram mountains in northern Kashmir. It forms where the Laskaimu and Arcatagai Rivers flow together at the Helbalongke of Karakoram Pass. The Yarkand flows from the southwest to the northeast, running through the Kashi region, the Kirgiz Autonomous Prefecture, and the Hotan and Aksu Prefectures. The drainage area is 108,000 km2, and the irrigation areas are Taxkorgan, Yecheng, Poskam, Yarkand, Markit, and Bachu counties, as well as 10 mission fields in the Agricultural Division, giving a total land mass of 2883.78 million m2. Water from Chogori feeds the Yarkland, along with snowmelt water, spring river flood waters, and rain.
The Aksu River includes two major tributaries. The first of these is the Kumalake River (also known as the Kunmalik River), which originates in the Kyrgyzstan Tianshan glacier. The other tributary, the Tuoshigan River, has its source at the border of China and Kyrgyzstan in the southern Tianshan Mountains. These two rivers flow together in Wensu County, forming the Aksu. From this point of confluence in Wensu to the Tarim River, the Aksu measures 130 km in length and is the source of the Tarim River. During the summer flood season, the Hotan and Yarkand Rivers also flow into the Tarim River.
The Kaidu River is the third largest river in Tianshan and has its source in the Albion Mountain in Tianshan Mountains. Nearly 560 km in length, the Kaidu flows through the Yurdusi Basin at the upstream section of the river and ends at Bosten Lake. Bosten Lake is the source of the Peacock River in the southwestern area of the Yanqi Basin. The Peacock then flows into the Tarim Basin along the Tiemenguan injection.

3. Sampling and Analytical Method

3.1. Sampling

Surface water samples were collected on a seasonal basis where possible from January 2011 to July 2012 at six stations along the Tarim River system, with additional smaller surface water (e.g., rivers, lakes, springs, and streams) samples collected opportunistically in the basin on two occasions (Figure 1). Water samples including surface water, precipitation, baseflow, groundwater, and ice-snowmelt water were collected along four headstreams and the mainstream of the Tarim River Basin. In addition, water samples (500 mL) for ion concentration analysis were collected in glass bottles that were sealed immediately after collection and stored at −18 °C. Prior to analysis, samples were transferred into a refrigerator at 4 °C to thaw gradually so that evaporation did not occur. The elevation, temperature, latitude, and longitude were recorded at the time of sample collection.
Precipitation: The precipitation was sampled (by event) both in the mountain region and oasis region from January 2011 to July 2012.
River: A total of 268 samples of river water were collected at sites of interest, and 35 samples were collected at hydrological stations.
Baseflow: A total of 24 baseflow samples were collected during December to the following February (the period for calculating baseflow index), and the rainy season (from June to September).
Groundwater: A sample from 42 wells was collected during each different season.
Ice-snowmelt water: At the tongue of mountains, 13 samples of ice-snowmelt water were collected underneath the snow pack.

3.2. Measurement

Samples were later analyzed in the State Key Laboratory of Desert and Oasis Ecology, Xinjiang Institute of Ecology and Geography, Chinese Academy of Sciences.
δ18O and δD analysis: The Los Gatos Research analyzer was used to perform the measurement and analysis of isotopic ratios of liquid water samples. In order to avoid the memory effect that continuous measurement caused with respect to the next sample test, the same sample was continuously measured six times, and the first two results were ignored. The accuracy of the measurements was 0.1‰ for δ18O and 0.3‰ for δD. All δ18O and δD values are expressed as related to the Vienna Standard Mean Ocean Water (V SMOW) in ‰. The final results are expressed by the value relative to SMOW:
δ 18 O = [ ( 18 O / 16 O ) s a m p l e ( 18 O / 16 O ) S M O W ] / ( 18 O / 16 O ) S M O W × 10 3
δ D = [ ( D / H ) s a m p l e ( D / H ) S M O W ] / ( D / H ) S M O W × 10 3
Deuterium excess (d-excess) calculation: The d-excess was defined by Dansgaard in order to highlight the isotopic variability that is not driven by equilibrium fractionation, which, otherwise, for the isotopic values encountered here, leads to a linear relationship between δ18O and δD with a global mean slope of 8 [22].
d - e x c e s s = δ D 8 × δ 18 O

3.3. Baseflow Index Calculation

The baseflow index (BFI) is one of the most important low flow indexes; it is construed as a long-term ratio of baseflow volume to total streamflow volume, and BFI is influenced by a number of climatic factors and underlying conditions [23]. BFI is presented as a ratio of the baseflow volume divided by the total streamflow volume for a specific time period, and it can be expressed as:
B F I =   t 1 t 2 Q b ( t ) d t t 1 t 2 Q ( t ) d t
where t1 and t2 are starting and ending time points, respectively. In our study area, snowfall is accumulated from December to February and it supplies baseflow during the spring snowmelt season [20].

3.4. Hydrograph Separation

Two- and three-component isotope hydrograph segmentations were adopted to calculate the ratio of different sources of supply in the Tarim River Basin; the three-component method was used to quantify water sources of headstreams, and the two-component method was used for the interaction calculation of the mid-stream and downstream. In the Tarim River mountain watersheds, the river water is composed of ice-snowmelt water, local precipitation, and groundwater; in the middle stream and downstream, the groundwater originates only from ice-snowmelt and local precipitation without baseflow into this area, so the runoff can be separated into the two components of groundwater and the full precipitation mixture. Both the two- and three-component methods can be described as a uniform equation [5]:
Q t = m = 1 n Q m
Q t C t j = m = 1 n Q m C m j , j = l , ... , k
where Qt is the total runoff discharge, Qm is the discharge of component m, and C m j is the tracer j incorporated into component m. The C m j should be the constant during the calculation period, such as a rainfall-runoff process, and it should be different between each component. At least another one of the tracers should be chosen as a reference for the isotope hydrograph separation, such as a kind of isotope. A steady-state model adequately represents watershed conditions.

4. Results

4.1. Characteristics of Discharge and Baseflow

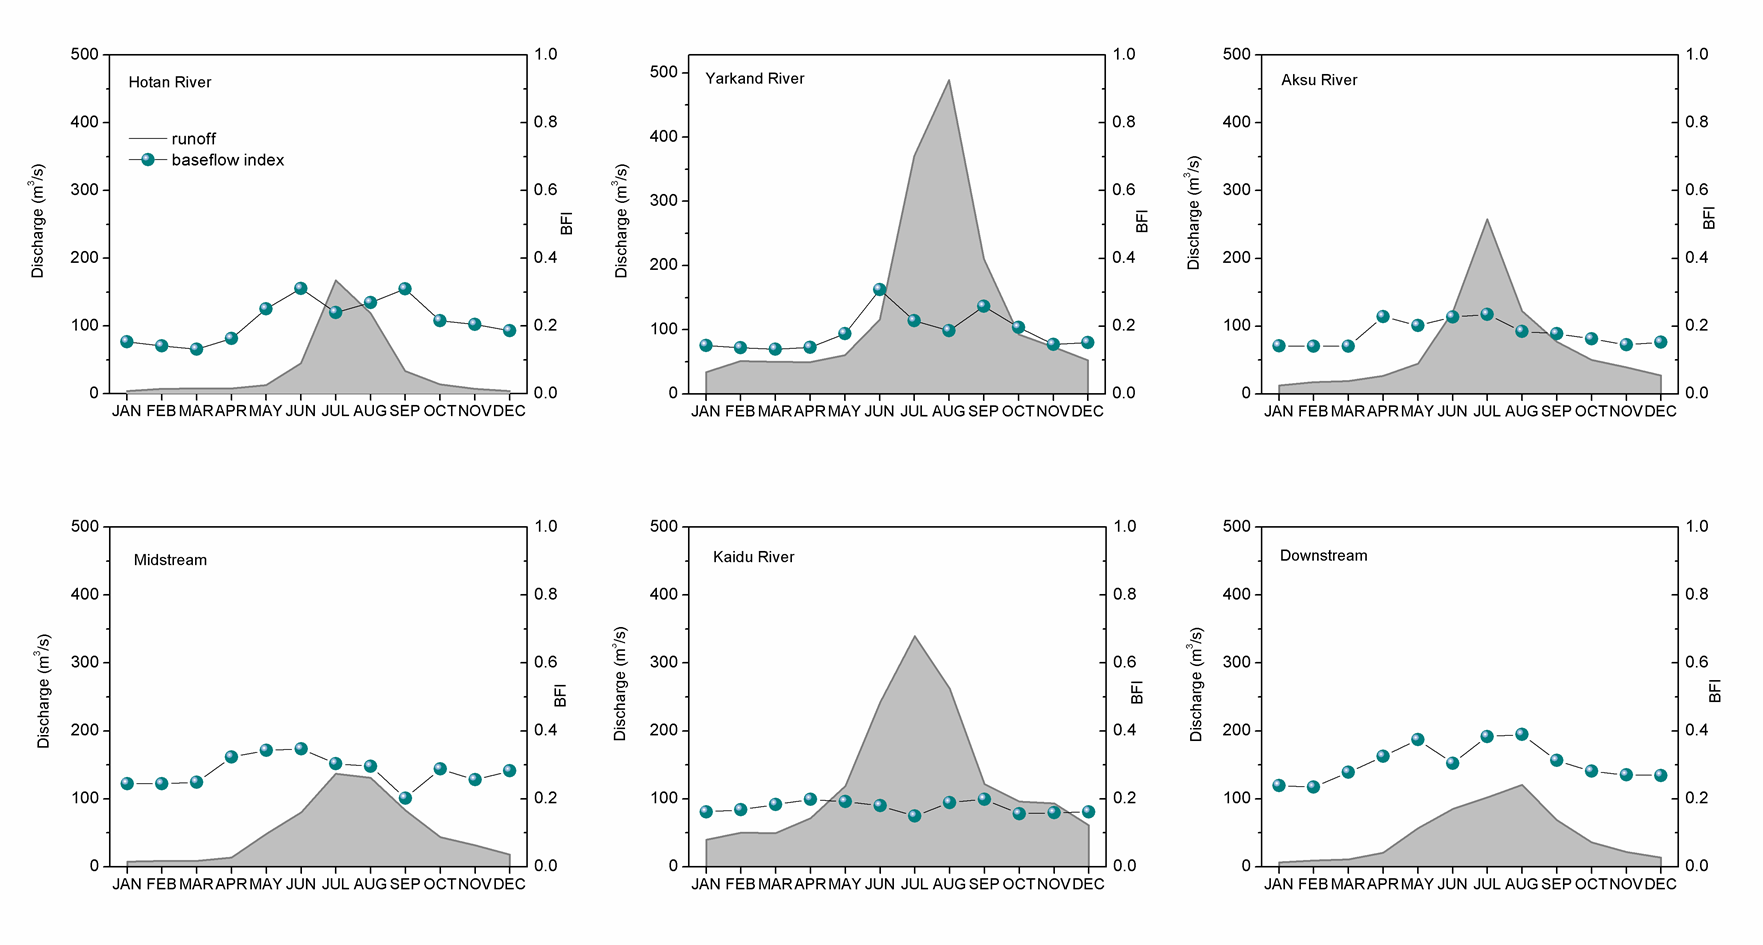
Discharge in four headstreams, the midstream, and downstream of the Tarim River have increased during the last 50 years [19], and discharge in the headstreams increased more than that in the midstream and downstream. Nevertheless, the baseflow index shows an opposite result. Baseflow is the kind of flow that has more relevance with groundwater by discharge, but is not very sensitive to precipitation. Studies have demonstrated that baseflow has a strong correlation with climate, so the baseflow index is an important factor linking ice-snowmelt water and groundwater recharge. We compared the four headstreams (the Hotan River, Yarkand River, Aksu River, and Kaidu River), the midstream and downstream of the Tarim River, and both discharge and baseflow have an apparent seasonal pattern. The peaks of the Hotan River, Aksu River, Kaidu River occur in July, while that of Yarkand River and the downstream occur in August, and that of the midstream occurs in both July and August. The month during which the baseflow index begins to increase differs: April for Hotan River and Yarkand River, March for Aksu River, the midstream and downstream, and a stable recharge index is observed throughout the whole year for Kaidu River. The midstream and downstream have a large amount of baseflow recharge during the whole year, with smooth trends. Only the Hotan River, Yarkand River, midstream, and downstream present a lower baseflow index after the maximum. The unique baseflow mechanism in the Tarim River Basin due to these particular hydrological characteristics is presented as sensitive to climatic change (Figure 2).
Box plots of both discharge and baseflow index values clearly displayed the spatial variations among all the headstreams (Figure 3). The spatial variations of the discharge and baseflow index values should be caused by spatial variations of water sources and different contributions of the water types. The relationship between the total runoff and baseflow index is quite different. An explanation for the Kaidu River’s unique phenomenon is that the amount of baseflow in the Kaidu River that is increased by the increasing glacial meltwater could be explained as being the result of a warm, wet climate effect. The Kaidu River is primarily recharged by spring snowmelt and precipitation, and the amount of spring (March–May) runoff and summer (June–August) runoff together accounts for 62% of the yearly river runoff. In the following, we will use isotope hydrograph separation to check the reasons after an analysis of the recharge relationship among different water types.

4.2. Characteristics of Water Isotopes

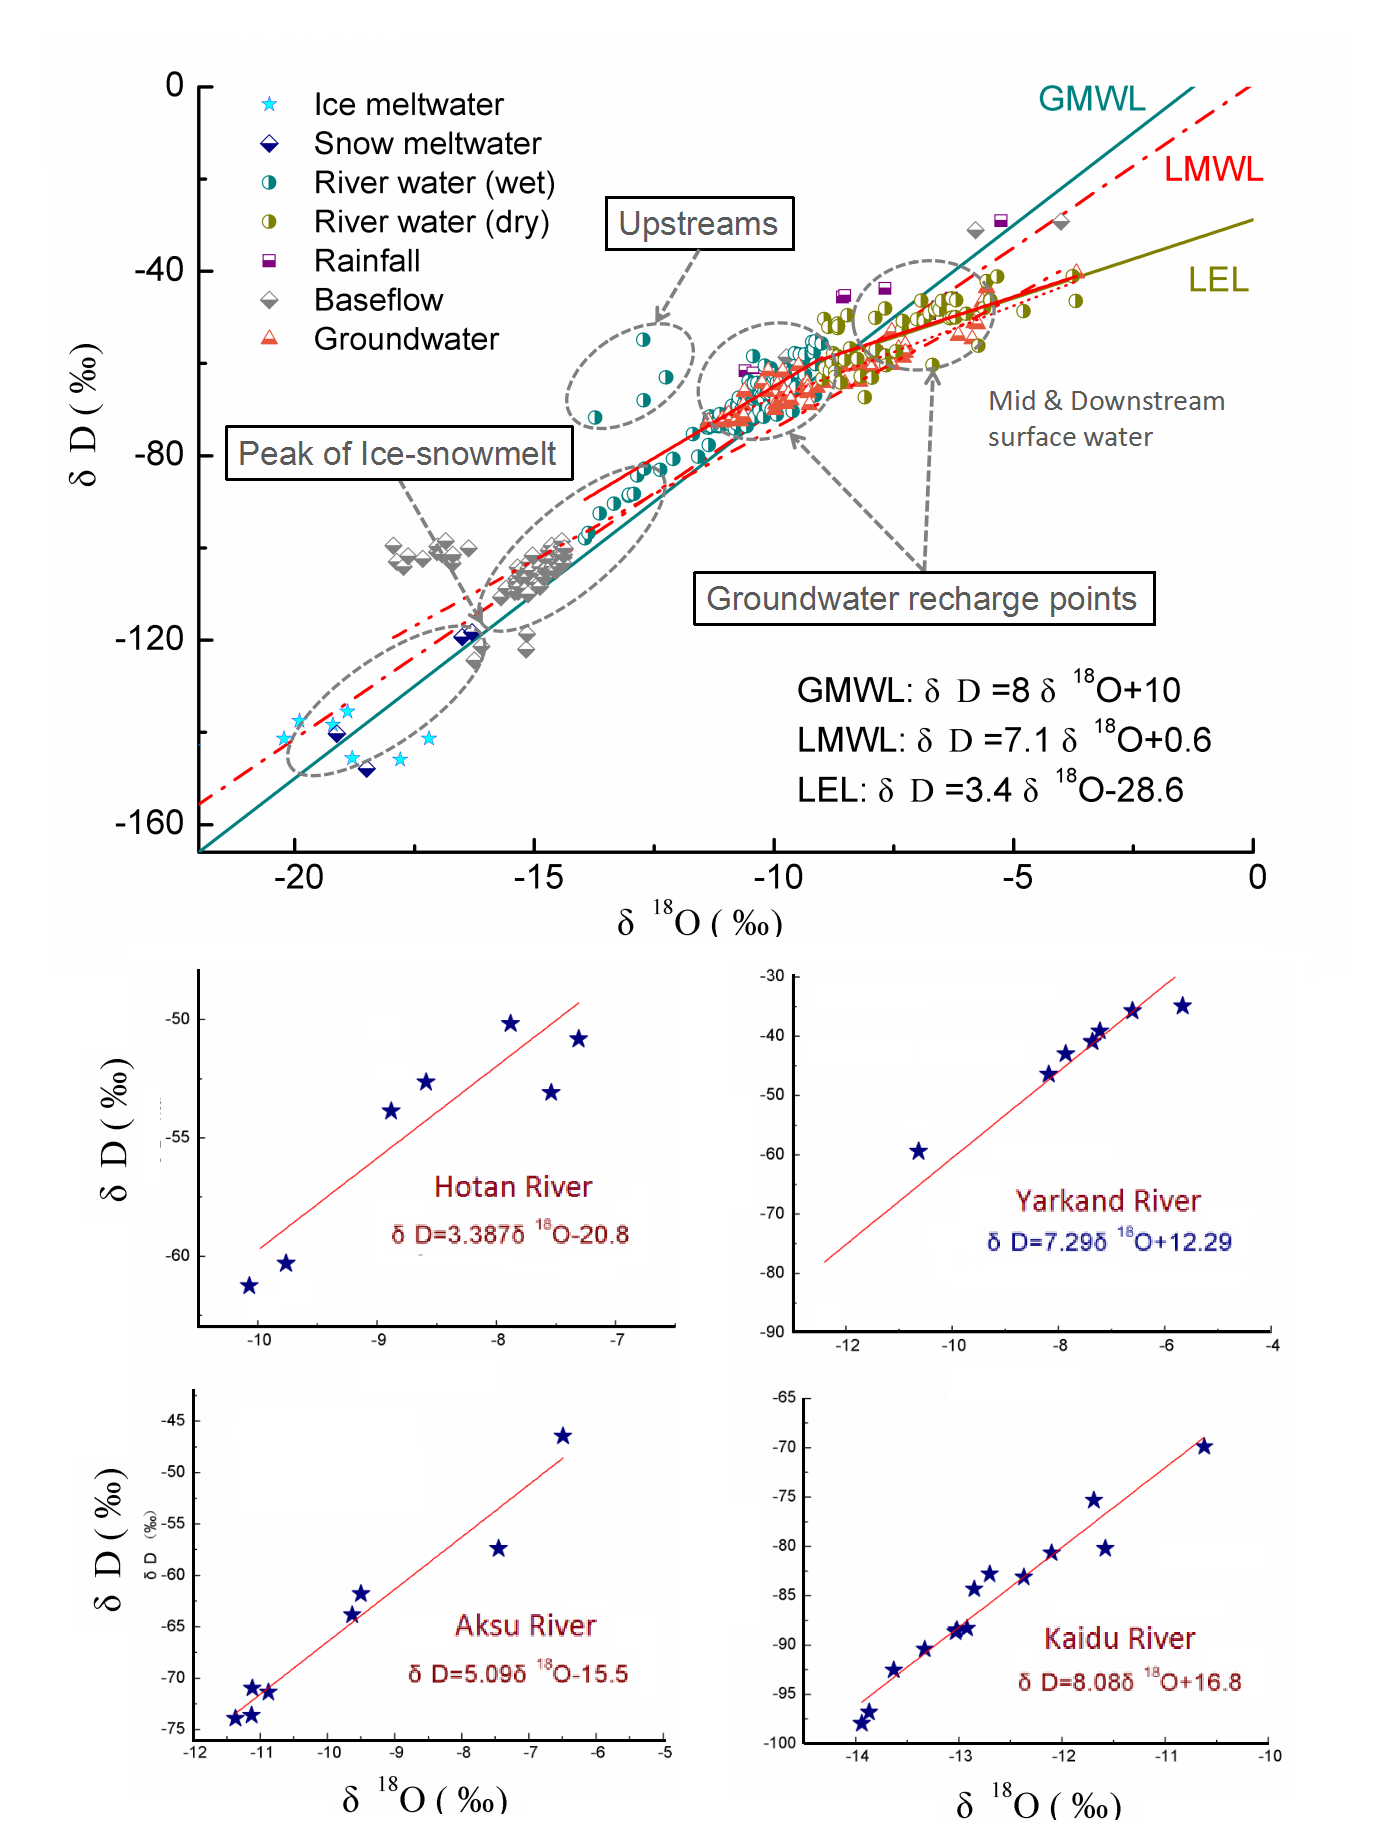
The relationship between river water and the global meteoric water line (GMWL) and the local meteoric water line (LMWL) was displayed by bivariate plots of δ18O and δD (Figure 4). The δ18O and δD composition of all water components from the Tarim River Region from 2012 to 2014 (Figure 4 and Table 1) shows that the isotopic composition for almost all waters lies on or close to the GMWL and LMWL. Considering the local climatic conditions could affect the LMWL, comparing the different water samples with the LMWL is an essential way to test these water sources and their isotopic fractionation for regional hydrology investigation [24].
According to the spatial distribution of δ18O and δD from river water, most of the river water sample points were located above the GMWL and LMWL (δD = 8δ18O + 10 and δD = 7.1δ18O + 0.6), although some of them more closely approached the two meteoric water lines. An interesting feature of water isotopes in the Kaidu River is that several surface water sample measurements lie far above the LMWL (Figure 4), which indicates some of the Kaidu River water samples are significantly different from other streams with respect to their water isotope values. It is not common to find surface water or groundwater that lies far above the line, and this may suggest that the occurrence of moisture recycling caused by vapor originated from closed desert basins. Most points of the other streams overlapped, which displayed similarity in the composition of water sources. Isotopes of the river vary with large values during the dry season, and most of them are more enriched than groundwater and ice-melt water. The fitting line of the river water samples during the wet season was (δD = 6.2δ18O − 2.8), which was different from the river water line during the dry season (δD = 3.8δ18O − 30.0). This showed that the river water source during the wet season was different from that during the dry season. For sampling time during the rainy season, it is possible for precipitation to participate in the recharging component. Groundwater samples plotted among the river water samples and were close to the river water line, which indicated that similarity existed among these water samples. As groundwater (δD = 4.1δ18O − 27.3) comes from infiltrated precipitation and ice-melt water recharge, its isotopes are just between these two sources. Because the baseflow (δD = 5.7δ18O − 16.0) has similar isotopes and total dissolved solids (TDS) as the precipitation and ice-melt water, it should not have experienced evaporation.
The isotopic ratios of precipitation in July or August are the most enriched, while the ratios of ice-melt water are the most depleted, and the ratios of the river lie among those of precipitation, ice-melt water, and groundwater (recharge points). Therefore, we can conclude that headstreams are composed of precipitation, ice-melt water, and groundwater, and the recharging ratio of groundwater changes gradually towards the downstream according to human activities. The impact of human activities in the Tarim River region includes deforestation of desert riparian forest, grassland damage due to digging herbs, damming the upstream (which results in a dramatic drop in groundwater levels), excessive reclamation, high salt farmland drainage into the river, as well as roads, dams, and other engineering measures. Using the average TDS and δ18O of groundwater, ice-snowmelt water, and precipitation as the three parameters, each ratio of the components that contribute to the river water could be calculated based on Equations (5) and (6).
The spatial results of the δ18O values showed that there was a significant difference between the four headstreams (Figure 5), with isotopic values in the river water ranging from −13.94‰ to −3.6‰. Compared with precipitation δ18O, which presents a large difference in value, the range of river isotopes is quite small. The Kaidu River shows an apparently enriched trend along the river flow direction, and it has a more depleted value in its mountain and oasis region, which indicates the recharge sources are probably ice-snowmelt water and precipitation with less evaporation. The other three headstreams have a similar isotope value in the mountain region, while the Aksu River has a more depleted water isotopic ratio in its oasis region. Along with the mainstream flow direction, the evaporation effect has a considerable influence on the surface water.
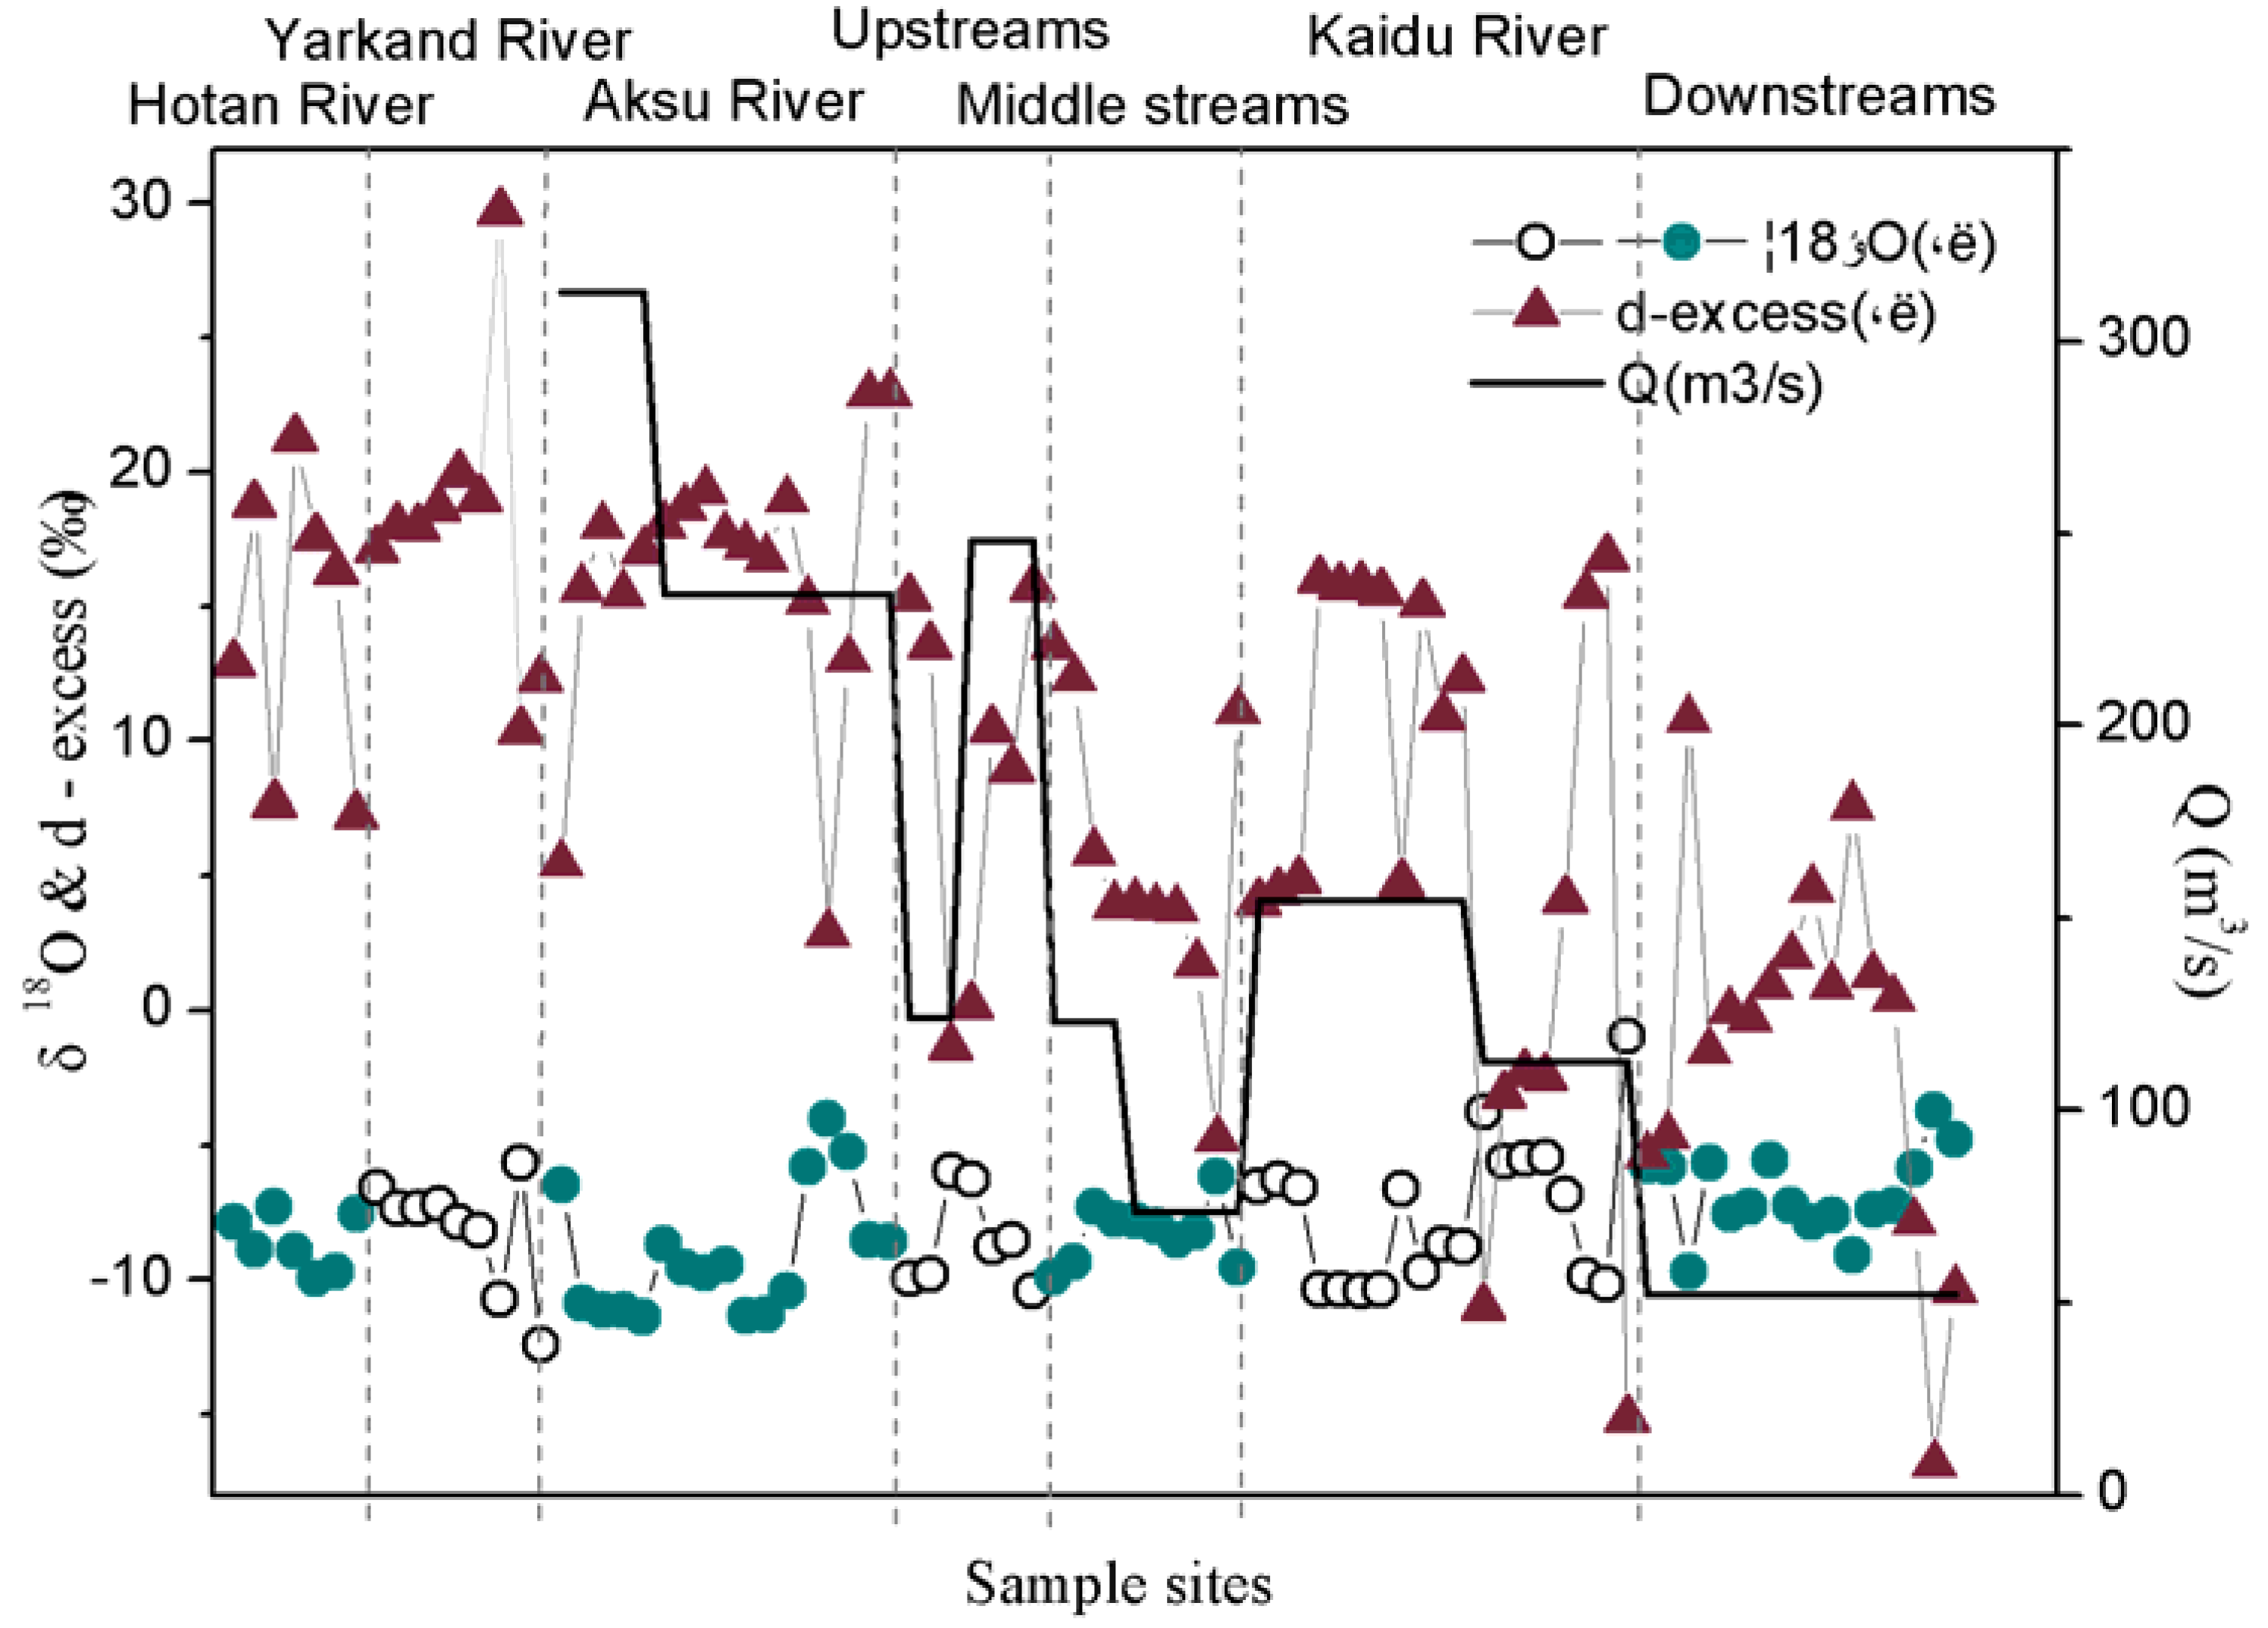
Deuterium excess (d-excess) is defined as d-excess = δD − 8δ18O by Dansgaard [22]. On the global scale, the d-excess values are about 10 for meteoric water [27]. Figure 6 show the variations in the d-excess of waters collected along the Tarim River during the investigation period. There is a marked elevation of variation in the d-excess values. The precipitation isotopic composition becomes enriched when clouds rain out but declines along the slope of a mountain. The annual mean value of the d-excess of stream waters from the upstream region is higher than that of stream waters from the lower region. This may be induced by different fractions of water component inputs in the stream flow. The concentration of heavy isotopes decreases after the clouds rise to a high altitude, which creates an altitude effect. The precipitation contains relatively low values of d-excess, the groundwater contains relatively intermediate values of d-excess, and the ice-snowmelt water contains relatively high values of d-excess. The results show the d-excess of waters from upper streams is higher than that of meteoric water but lower than that of ice-snowmelt water. This pattern of variability in the d-excess may be explained by the attenuation of the recharge signal of precipitation and ice-snowmelt water during the evaporation process. This result indicates that there is an inverse correlation between the d-excess value and the values of δ18O and δD for the water samples collected; Figure 6 shows the spatial variation of the d-excess decreases with altitude. The water isotope has a negative correlation with altitude and a positive correlation with temperature. The four headstreams have a humid climate, low evaporation rate and high d-excess, but as temperatures rise, evaporation intensity becomes strong and the d-excess will increase. There are two main reasons why the d-excess fluctuated along the river flow direction: one is the difference in water vapor sources, another is the dams along the basin that lead to increased evaporation, isotopic enrichment, and finally changes in the d-excess. The d-excess features can be explained by the lower input of ice-snowmelt water. Because the midstream and downstream far from the mountain region have a more complicated recharge effect, the transformation relationship between the surface and the groundwater is studied to determine the contributing rates of each water type to the river water.

4.3. Hydrograph Separation

Based on Equations (5) and (6), the contributions of rain, meltwater, and groundwater were computed with the hydrograph separation analysis. The contribution of ice-snowmelt water varied from 14% to 40%, and that of rain varied from 9% to 54% within different sub-watersheds. As shown in Table 2, there are considerable variations of ice-snowmelt water percentage among different watersheds, in virtue of the uneven distribution of glacier and precipitation amounts. The groundwater percentage of the Hotan River is 58.85%, which is higher than the little ice-snowmelt water. The previous months had high air temperatures; therefore, more ice-snowmelt infiltrated into the baseflow, delaying its discharge into the river. Conversely, the Yarkand River, which also originates from the Kunlun Mountains, has abundant ice-snowmelt, with similar air temperature, so the average percentage, i.e., 40.85% of runoff, is recharged by ice-snowmelt in the wet season. Using Equations (5) and (6), the calculated results of the percentage of surface water recharge to groundwater for the middle reaches of the Tarim River are shown in Table 2. It can be seen from the table that there was a marked increase for the fraction from 69.58% to 92.45% for the downstream. Some watersheds along the Tarim River were continuously pumped out into an impermeable canal for irrigation, which resulted in the decrease of infiltration from river water into groundwater and even transformed the interaction between surface water and groundwater. Here, we only study the average recharge percentage.

5. Discussion

5.1. Reasons for Spatial and Temporal Variations of δD and δ18O

In general, altitude effects, different water sources that rivers receive, and isotope fractionation caused by evaporation could be possible reasons for spatial and temporal variations in δD and δ18O.
For the rainy season, the role of rain as a water source was not ignored. Precipitation in Xinjiang also exhibits significant seasonal differences, with most precipitation occurring during the summer months. About 80% of the groundwater in the basin is recharged from the surface water [19]. Groundwater sampled in the wet season has a similar location as it recharges baseflow. Ice-snowmelt water with high deuterium excess recharging the baseflow also contributes to this feature. The baseflow thus does not only supply the river’s runoff during the rainless season but also recharges groundwater during the wet season [22].
In the mountains, the higher altitude areas receive 60% from ice-snowmelt water and groundwater (which mainly come from the conversion of baseflow), and the southern border mountains receive 50%–70%. About 98% of the Tarim River’s runoff is received from four headstreams in the upper mountain areas. Groundwater in the mountains is mainly recharged by precipitation in summer and autumn because of the seasonal precipitation pattern, and thus exhibits the feature of moisture recycling. In contrast, the plain areas have more uniform precipitation distribution throughout all four seasons, with spring or summer receiving slightly more. The plains in the middle and downstream regions of the basin receive less than 150 mm annual precipitation, and are mainly the diffusion and consumption areas, and generate little surface runoff [3].
Generally, the surface water sampled in the midstream and downstream regions should fall below the GMWL and LMWL. The opposite result occurred because samples that lie above the MWL received recharge from ice-snowmelt water that infiltrated rapidly through the highly permeable zone before significant loss by evaporation. For the water samples that fell above the LMWL (Figure 4), evaporation played an unimportant role in the fractionation of water isotopes. Take Kaidu River as an example; the spatial distribution of rain was imbalanced in the whole watershed, among which Kaidu River had relatively more precipitation, which was also proven by the largest contribution of rain (Table 2). This indicated that Kaidu River was affected slightly by the rain, and this river has the heaviest isotopes among these tributaries, resulting in high isotopic changes after flowing downstream of Tarim River (Figure 5). Therefore, altitude effects could be due to different isotope values; consequently, there was an obvious altitude effect along the river flow direction.

5.2. The Sensitivity of Glacier Rivers to Climate Change

In alpine catchments, the change of melted water in the total runoff is a direct response of water resources to climate change [30,31]. Therefore, calculating how much ice-snowmelt water there is in the total runoff can evaluate the effect of climate change.
There are 46,377 glaciers in China, covering a combined area of 59,425 km2 [32]. Based on this estimate, about one-third of China’s glaciers will disappear by 2050. However, the trend towards increasing precipitation in the mountains will offset the melting trend of glaciers to a certain extent. The northern slopes of the Tianshan water system have also changed. During the past several decades, the baseflow of Kaidu River has increased, while the baseflow index has begun to decrease gradually [19]. These changes in glaciers have a major impact on water resources. The runoff recharge proportions from glaciers will increase significantly in the short term, which will have a positive effect on water resources and the ecological environment. However, the accelerating melting rate will reduce the water resources over a longer period, which will then bring severe challenges to this region.
For Hotan River and Yarkand River, the groundwater contribution rates are more than 50% of the total runoff (Table 2). The important role that baseflow plays between ice-snowmelt water and groundwater before the mountain mouth should not be ignored. In addition, there is a large gap in elevation between the mountains and basins, which leads to flooding of low-altitude areas. Analysis of climate change in the Tarim River Basin over the past 50 years shows that the temperature and precipitation of the basin experienced a jump-point in the mid-1980s. It is predicted that if temperature rises by 1 °C, precipitation will increase by 10%, and the glacial runoff in Xinjiang will increase by 7.8%–12%. At the same time, glaciers will shrink by 4.3% [32]. Therefore, even if temperatures and precipitation both increase, the melting trend of glaciers cannot be completely offset.
Floods often occur in the Tarim Basin area, especially in the Tianshan and Kunlun Mountains [22]. The melt season also leads to the changing structure of water source recharge; the Hotan River, the Yarkand River, the midstream and downstream all exhibited a sudden decrease in BFI (Figure 2), which may be considered an impact of the increased flood frequency of rain-fed rivers on the baseflow rate. The mountains are experiencing increased warming, whereas humidity is rising in the plain region. Warming in the mountains will increase the probability of snow floods. However, the Tarim River, which is China’s largest inland river, experienced downstream water reduction from 13.5 × 10⁸ m3 in the 1950s to the current 2.84 × 10⁸ m3. The fragile ecological environment and limited available water supply in the desert areas heighten the conflict between the ecological utilization of water resources and the economy [33]. Nonetheless, in this battle, the ecological use of water should be of greater concern, as the sustainability of water resources is the key element in social and economic development.

6. Conclusions

In this paper, we implemented a stable isotope mass balance method to study isotopic characterization of the Tarim River Basin and to quantify the recharge proportion between water bodies of typical regions. Seasonality in the isotopic composition of river water was evident, where water in the dry season was further affected by processes such as the recycling of water vapor and secondary evaporation. The mountain area was recharged with snowmelt and precipitation, with the isotopic composition largely dependent on elevation. Groundwaters in the mid-stream and downstream regions were recharged by surface water directly. The contribution of ice-snowmelt water varied from 14.97% to 40.85%, and that of rain varied from 9.04% to 54.80%, while that of groundwater varied from 15.34% to 58.85%. Ice-snowmelt water was still the main contributor to the baseflow, so the Hotan River and the Yarkand River are melt water-dependent rivers. Seasonal precipitation is the main supplying water source of baseflow in the Aksu River and the Kaidu River. The importance of ice-snowmelt in runoff is determined by climate sensitivity, and a warming and drying climate may impose significant changes in the hydrology of the Tarim River basin, which may then influence the reasonable utilization of limited water resources in the future.

Acknowledgments

The authors wish to thank Yun Wang, Congjian Sun, Peng Yang for their precious work in field sampling and laboratory analyzing. This study was supported by National Natural Science Foundation of China (No. 41501050), the National Natural Science Foundation of China (No. 41471030), the Basic Research Operating Expenses of the Central-level Non-profit Research Institutes (IDM201504). We thank the anonymous reviewers for useful comments to improve the manuscript. We also thank LetPub for their linguistic assistance during the preparation of this manuscript.

Author Contributions

Both authors planned and carried out this research, and cooperated in the elaboration and interpretation of the achieved data.

Conflicts of Interest

The authors declare no conflict of interest.

References

  1. Barnett, T.P.; Adam, J.C.; Lettenmaier, D.P. Potential impacts of a warming climate on water availability in snow-dominated regions. Nature 2005, 438, 303–309. [Google Scholar] [CrossRef] [PubMed]
  2. Immerzeel, W.W.; van Beek, L.P.H.; Bierkens, M.F.P. Climate change will affect the Asian water towers. Science 2010, 328, 1382–1385. [Google Scholar] [CrossRef] [PubMed]
  3. Chen, Y.N.; Li, Z.; Fan, Y.T.; Wang, H.J.; Deng, H.J. Progress and prospects of climate change impacts on hydrology in the arid region of northwest China. Environ. Res. 2015, 139, 11–19. [Google Scholar] [CrossRef] [PubMed]
  4. Hagemann, S.; Chen, C.; Clark, D.B. Climate change impact on available water resources obtained using multiple global climate and hydrology models. Earth Syst. Dyn. Discuss. 2012, 3, 1321–1345. [Google Scholar] [CrossRef]
  5. Kong, Y.; Pang, Z. Isotope hydrograph separation in alpine catchments: A review. Sci. Cold Arid Reg. 2011, 3, 86–91. [Google Scholar]
  6. Gibson, J.; Edwards, T.; Birks, S.; Amour, N.; Buhay, W.; McEachern, P.; Wolfe, B.; Peters, D. Progress in isotope tracer hydrology in Canada. Hydrol. Process. 2005, 19, 303–327. [Google Scholar] [CrossRef]
  7. Fritz, P.; Cherry, J.A.; Weyer, K.U.; Sklash, M. Storm runoff analyses using environmental isotopes and major ions. Panel Proc. Ser. Int. Atom. Energy Agency (IAEA) 1976, 36, 13–24. [Google Scholar]
  8. Meng, Y.; Liu, G.; Li, M. Tracing the Sources and Processes of Groundwater in an Alpine Glacierized Region in Southwest China: Evidence from Environmental Isotopes. Water 2015, 7, 2673–2690. [Google Scholar] [CrossRef]
  9. Doveri, M.; Menichini, M.; Cerrina Feroni, A. Stable water isotopes as fundamental tool in karst aquifer studies: Some results from isotopic applications in the Apuan Alps carbonatic complexes (NW Tuscany). Ital. J. Eng. Geol. Environ. 2013, 1, 33–50. [Google Scholar]
  10. Merlivat, M.; Jouzel, J. Global climatic interpretation of the deuterium-oxygen-18 relationship for precipitation. Geophys. Res. 1979, 84, 5029–5033. [Google Scholar] [CrossRef]
  11. Eastoe, C.J.; Hutchison, W.R.; Hibbs, B.J.; Hawley, J.; Hogan, J.F. Interaction of a river with an alluvial basin aquifer: Stable isotopes, salinity and water budgets. J. Hydrol. 2010, 395, 67–78. [Google Scholar] [CrossRef]
  12. Gonfiantini, R.; Frohlich, K.; Araguas-Araguas, L.; Rozanski, K. Isotopes in groundwater hydrology. In Isotope Tracers in Catchment Hydrology; Elsevier Science B.V.: Amsterdam, The Netherlands, 1998; pp. 203–225. [Google Scholar]
  13. Meredith, K.; Hollins, S.; Hughes, C. The influence of groundwater/surface water exchange on stable water isotopic signatures along the Darling River, NSW, Australia. In Groundwater and Ecosystems; CRC Press: Boca Raton, FL, USA, 2013; p. 57. [Google Scholar]
  14. Kanduc, T.; Grassa, F.; McIntosh, J. A geochemical and stable isotope investigation of groundwater/surface−water interactions in the Velenje Basin, Slovenia. Hydrogeol. J. 2014, 22, 971–984. [Google Scholar] [CrossRef]
  15. De Graaf, I.E.M.; van Beek, L.P.H.; Wada, Y. Dynamic attribution of global water demand to surface water and groundwater resources: Effects of abstractions and return flows on river discharges. Adv. Water Resour. 2014, 64, 21–33. [Google Scholar] [CrossRef]
  16. Wheater, H.S. Hydrological processes, groundwater recharge and surface-water/groundwater interactions in arid and semi-arid areas. In Groundwater Modeling in Arid and Semi-Arid Areas, 1st ed.; Cambridge University Press: Cambridge, UK, 2010; pp. 5–37. [Google Scholar]
  17. Fan, Y.T.; Chen, Y.N.; Li, W.H. Characteristics of water isotopes and ice-snowmelt quantification in the Tizinafu River, North Kunlun Mountains, Central Asia. Quat. Int. 2014. [Google Scholar] [CrossRef]
  18. Hugenschmidt, C.; Ingwersen, J.; Sangchan, W. A three-component hydrograph separation based on geochemical tracers in a tropical mountainous headwater catchment in northern Thailand. Hydrol. Earth Syst. Sci. 2014, 18. [Google Scholar] [CrossRef]
  19. Xie, F.M.; Mao, W.Y.; Zhang, J.G. Analysis of streamflow from four source rivers to mainstream of the Tarim River. J. Glaciol. Geocryol. 2007, 29, 559–569. [Google Scholar]
  20. Fan, Y.T.; Chen, Y.N.; Liu, Y.B. Variation of Baseflows in the Headstreams of the Tarim River Basin during 1960–2007. J. Hydrol. 2013, 487, 98–108. [Google Scholar] [CrossRef]
  21. Fan, Y.T.; Chen, Y.N.; Li, W.H. Response of runoff to temperature and precipitation changes in Tarim River during the past 50 years. J. Arid Land 2011, 3, 220–230. [Google Scholar] [CrossRef]
  22. Dansgaard, W. Stable isotopes in precipitation. Tellus 1964, 16, 436–468. [Google Scholar] [CrossRef]
  23. Antonia, L.; Paolo, V. Baseflow index regionalization analysis in a mediterranean area and data scarcity context: Role of the catchment permeability index. J. Hydrol. 2008, 355, 63–75. [Google Scholar]
  24. Clark, I.D.; Fritz, P. Environmental Isotopes in Hydrogeology; CRC Press Lewis Publishers: Boca Raton, FL, USA, 1997. [Google Scholar]
  25. Craig, H. Isotope variations in meteoric waters. Science 1961, 133, 1702–1703. [Google Scholar] [CrossRef] [PubMed]
  26. Pang, Z.; Kong, Y.; Froehlich, K.; Huang, T.; Yuan, L.; Li, Z.; Wang, F. Processes affecting isotopes in precipitation of an arid region. Tellus 2011, 63, 352–359. [Google Scholar] [CrossRef]
  27. Froehlich, K.; Kralik, M.; Papesch, W.; Rank, D.; Scheifinger, H. Deuterium excess in precipitation of Alpine regions moisture recycling. Isot. Environ. Health Stud. 2008, 44, 61–70. [Google Scholar] [CrossRef] [PubMed]
  28. Zhao, Z.; Tian, L.; Fischer, E.; Li, Z.; Jiao, K. Study of chemical composition of precipitation at an alpine site and a rural site in Urumqi River Valley, Eastern Tien Shan, China. Atmos. Environ. 2008, 42, 8934–8942. [Google Scholar] [CrossRef]
  29. Sun, C.; Li, W.; Chen, Y.; Li, X.; Yang, Y. Isotopic and hydrochemical composition of runoff in the Urumqi River, Tianshan Mountains, China. Environ. Earth Sci. 2015, 74, 1–17. [Google Scholar]
  30. Lambrecht, A.; Kuhn, M. Glacier changes in the Austrian Alps during the last three decades, derived from the new Austrian glacier inventory. Ann. Glaciol. 2007, 46, 177–184. [Google Scholar] [CrossRef]
  31. Lambrecht, A.; Mayer, C. Temporal variability of the non-steady contribution from glaciers to water discharge in western Austria. J. Hydrol. 2009, 376, 353–361. [Google Scholar] [CrossRef]
  32. Shi, Y.; Liu, S. Estimation on the response of glaciers in China to the global warming in the 21st century. Chin. Sci. Bull. 2000, 45, 668–672. [Google Scholar] [CrossRef]
  33. Pang, Z.; Huang, T.; Chen, Y. Diminished groundwater recharge and circulation relative to degrading riparian vegetation in the middle Tarim River. Hydrol. Process. 2010, 24, 145–157. [Google Scholar]
Figure 1. Map showing the locations of sampling sites along the Tarim River, including geographical features in the Xinjiang Autonomous Region.
Water 08 00286 g001
Figure 2. Monthly variations of runoff and baseflow index in the Tarim River Basin. Data for runoff is from last 30 years and data for baseflow index is from 1972 to 2007.
Water 08 00286 g002
Figure 3. Box plots of spatial variations for runoff and BFI. Data sites were in the Hotan, Yarkand, Aksu, and Kaidu Rivers. The box plot has lines at the lower quartile, median, and upper quartile values. The whiskers of the box are lines extending from each end of the box to show the extent of the rest of the data. The outliers of the box are data with values beyond the ends of the whiskers.
Water 08 00286 g003
Figure 4. Water components’ relationship displayed by the bivariate plot of δD versus δ18O in Tarim River Basin, with river water, precipitation, ice-snowmelt water and groundwater relative to global meteoric water line (GMWL) [25] and local meteoric water line (LMWL) [26]. The isotopic composition of the surface water is plotted on a local evaporation line (LEL). Surface water lines of the four headstreams were fitted.
Water 08 00286 g004
Figure 5. The spatial variations of river water δ18O in Hotan River, Yarkand River, Aksu River and Kaidu River (Tarim River Basin) according to mass balance. Large variation of climatic conditions and human activities.
Water 08 00286 g005
Figure 6. Time series of discharge (solid line, m3/s) in the whole Tarim River at the hydrological stations, and fluctuations of δ18O (circles, ‰) and d-excess (triangles, ‰) sampled from the deep river water (at least 30 cm below the surface of the water) near the wells.
Water 08 00286 g006
Table 1. Isotopic data from water samples collected in the four headstreams, the middle stream and downstream from 2012 to 2014, analyzed at the State Key Laboratory of Desert and Oasis Ecology, Xinjiang Institute of Ecology and Geography, Chinese Academy of Sciences.
Sampling RegionWater TypeNo.δ18O (‰ V-SMOW)δD (‰ V-SMOW)D-excess
MaxMinMeanMaxMinMeanMean
Hotan RiverIce-snowmelt46−10.44−10.11−10.72−70.35−68.52−69.1416.62
Precipitation−6.29−2.41−2.55−45.88−30.28−25.65−5.25
River water−49.21−6.37−6.64−53.24−41.05−48.304.82
Groundwater−10.70−7.58−9.70−72.48−59.72−66.7910.81
Yarkand RiverIce-snowmelt32−19.12−11.02−11.19−140.25−70.56−72.2017.32
Precipitation−8.52−4.62−4.80−45.27−35.17−38.80−0.40
River water−12.10−7.67−8.78−80.68−58.28−59.8210.45
Groundwater−9.29−6.15−7.54−66.36−53.98−53.087.24
Aksu RiverIce-snowmelt45−18.50−10.23−11.17−147.91−70.24−72.7216.67
Precipitation−8.57−4.85−5.19−45.64−28.80−29.0612.45
River water−8.66−7.01−7.85−51.90−50.48−57.045.80
Groundwater−10.12−7.87−9.94−64.36−58.45−64.6614.83
Kaidu RiverIce-snowmelt68−16.50−10.23−11.17−119.30−74.13−73.6115.78
Precipitation−4.79−3.70−3.98−48.70−46.44−51.25−19.42
River water−10.76−5.49−7.52−68.90−46.23−57.402.78
Groundwater−11.37−7.75−10.58−72.72−58.12−66.0818.58
Middle StreamPrecipitation15−10.11−4.83−6.61−61.19−28.64−47.725.20
River water−13.94−8.52−9.53−97.96−59.22−65.2410.96
Groundwater−10.64−5.82−8.26−69.15−51.22−60.495.55
DownstreamPrecipitation18−6.29−3.65−3.87−45.88−19.20−29.061.87
River water−10.78−5.73−7.78−73.06−56.19−57.045.21
Groundwater−8.02−5.75−7.21−61.56−51.40−50.826.90
Table 2. The mean concentration of tracers in different water types and the fraction of water sources discharged to river runoff.
Sampling RegionRiver WaterRainfallGroundwaterIce-Snowmelt WaterEstimated Fractions (%)
18O, ‰)18O, ‰)18O, ‰)18O, ‰)RainfallGroundwaterIce-Snowmelt Water
Hotan River−6.64−2.55−9.70−10.7226.1858.8514.97
Yarkand River−8.78−4.80−7.54−11.199.0450.1040.85
Aksu River−7.85−5.19−9.94−11.1754.8020.5924.61
Kaidu River−7.52−3.98−10.58−11.1749.9115.3434.75
Middle Stream−9.53−6.61−8.26−17.91/−69.58/
Downstream−7.78−3.87−7.21−19.49/−92.45/
Notes: Input parameters: Precipitation TDS = 9.3 [28]; Aksu River: ice-snowmelt water TDS = 155.0 [29]; Groundwater: Hotan River TDS = 489.0, Yarkand River TDS = 456.0, Aksu River TDS = 568.0, Kaidu River TDS = 552.0; River water: Hotan River TDS = 222.0, Yarkand River TDS = 289.0, Aksu River TDS = 213.0, Kaidu River TDS = 222.0.