Article

Coping with Pluvial Floods by Private Households

1
Section 5.4 Hydrology, GFZ German Research Centre for Geosciences, Telegrafenberg, 14473 Potsdam, Germany
2
Deutsche Rückversicherung AG, Hansaallee 177, 40549 Düsseldorf, Germany
3
Institute of Earth and Environmental Science, University of Potsdam, Karl-Liebknecht-Strasse 24–25, 14476 Potsdam-Golm, Germany
4
Hydrotec GmbH, Bachstraße 62-64, 52066 Aachen, Germany
*
Author to whom correspondence should be addressed.
Water 2016, 8(7), 304; https://doi.org/10.3390/w8070304
Submission received: 1 June 2016 / Revised: 8 July 2016 / Accepted: 13 July 2016 / Published: 21 July 2016
(This article belongs to the Special Issue Urban Water Challenges)

Abstract

:
Pluvial floods have caused severe damage to urban areas in recent years. With a projected increase in extreme precipitation as well as an ongoing urbanization, pluvial flood damage is expected to increase in the future. Therefore, further insights, especially on the adverse consequences of pluvial floods and their mitigation, are needed. To gain more knowledge, empirical damage data from three different pluvial flood events in Germany were collected through computer-aided telephone interviews. Pluvial flood awareness as well as flood experience were found to be low before the respective flood events. The level of private precaution increased considerably after all events, but is mainly focused on measures that are easy to implement. Lower inundation depths, smaller potential losses as compared with fluvial floods, as well as the fact that pluvial flooding may occur everywhere, are expected to cause a shift in damage mitigation from precaution to emergency response. However, an effective implementation of emergency measures was constrained by a low dissemination of early warnings in the study areas. Further improvements of early warning systems including dissemination as well as a rise in pluvial flood preparedness are important to reduce future pluvial flood damage.

1. Introduction

Pluvial floods in urban areas are caused by storm events with exceptionally high rainfall rates, which lead to inundation of streets and buildings. Commonly, failure of the drainage system plays an important role. Often referred to as surface water flooding, many European cities experienced pluvial flooding in recent years, which caused considerable damage. Examples are the pluvial flood in the City of Hull in the UK in 2007, where more than 100 mm of rain over a 24 h period caused damage to 8600 residential buildings and 1300 businesses [1] and the pluvial flood in the city of Dortmund, Germany, in July 2008, where local rainfall rates of 200 mm over a time span of 3 h led to a total loss of Euro (EUR) 17.2 million [2]. Pluvial flood risk is expected to increase in the future. Due to climate change, it is expected that the frequency and intensity of heavy rainfall events increases, which should contribute to increases in precipitation-generated local flooding [3]. However, increasing exposure and vulnerability of cities also play a role [4,5]. Thus, for pluvial flooding, an efficient, integrated risk management following the risk management cycle is also necessary [6,7]. However, pluvial floods often occur at much smaller spatial and temporal scales than fluvial floods. They may occur anywhere, including in areas not obviously prone to flooding, which has important implications in terms of experience and preparedness of the population. Since pluvial floods are often related to convective storms, they have a high spatial and temporal dynamic, which challenges early warning systems [8]. As a result, lead times are short, i.e. only up to a few hours are available for undertaking response measures. While risk management and mitigation strategies for fluvial and tidal floods have been established over the last decades, effective strategies to face an increasing pluvial flood risk, were not developed to the same extent [9,10,11].
Case studies have shown that suitable risk reduction for pluvial flooding, which consists of preventive, protective and preparative measures, can be difficult to achieve. For instance, a case study in the city of Eindhoven in the Netherlands revealed that pluvial flood protection via a separation of sewer and storm water networks and an increase of urban water storage has a negative cost-benefit ratio [7]. Another study in the Greater Manchester area in the UK investigating pluvial flood events in 2004 and 2006 showed that the affected people were not well informed or prepared and even confused about the responsibilities before, during and after the events [12].
A focus in pluvial flood risk management is on early warning and response. Van Ootegem et al. [13] found that being aware of the pluvial flood risk before the water enters the building reduces content damage on average by 90% in the case of basement floods and by 77% in the case of ground floor floods. However, early warnings for pluvial floods are challenging, as they require the combination of heavy rainfall forecasts or at least nowcasts with a high spatial and temporal resolution as well as local information about the urban drainage system, topographic data, land use and soil moisture preconditions. Although pluvial flood early warning systems are often limited to rainfall forecasts with warning levels based on historical events or previous flood experience, more advanced systems have been implemented on different spatial scales in recent years [14,15]. The city of Marseille, France for example runs a warning system that links rainfall intensities with local flooding thresholds [16,17]. In the UK, a new system for extreme rainfall alerts and a surface water flooding forecast was introduced after the severe pluvial floods in 2007, which is currently further improved by implementing the Grid-to-Grid (G2G) model [18]. For the case study areas in Germany, pluvial flood warning is restricted to severe weather warnings on district level issued by the Deutscher Wetterdienst (DWD). These severe weather warnings have a maximum lead time of 12 h and mostly contain the expected maximum rainfall intensities for the respective district in case of a forecasted heavy rainfall event [19,20]. The effectiveness of flood early warning systems in reducing damage is mainly determined by lead times, water depths, and the availability and ability of people to undertake emergency measures effectively [21,22]. The commonly short lead times for pluvial floods are a challenge, in contrast to the generally shallow water levels, which allow a damage reduction by sealing the building or by moving contents higher, e.g., onto shelves or in higher stories. The ability to undertake effective measures is, for instance, supported by recent flood experience, good preparation and the availability of emergency plans [23,24]. Since flood experience may be commonly lacking due to the rare and local occurrence of pluvial flood events, specific risk communication seems to be decisive for increasing preparation and an effective implementation of emergency measures.
Damaging processes during pluvial flooding are distinguished from fluvial flooding as the sources of the excess water and flow processes are very different. Due to a lack of detailed damage data, there is not much information about damaging processes available. Results of decision-tree analysis show that insurance claim frequency related to torrential rain and pluvial flood damage to property is most strongly associated with maximum hourly rainfall intensity, followed by real estate value, ground floor area, household income, season and the age of the building [25]. A study on pluvial flood damage in Belgium found that, although flood depth is an important predictor of pluvial flood damage, indicators that are not related to flood characteristics, including building properties, behavioral predictors and income, are also important [13].
The objective of this paper is to gain better knowledge about the consequences of pluvial floods and their management. How private households during three different pluvial flood events in Germany were able to cope with the flooding is investigated. Following the phases of the risk management cycle, how private households contributed to damage mitigation and how preparedness, response and recovery are correlated to socio-economic variables, flood experience and flood impact is analyzed.

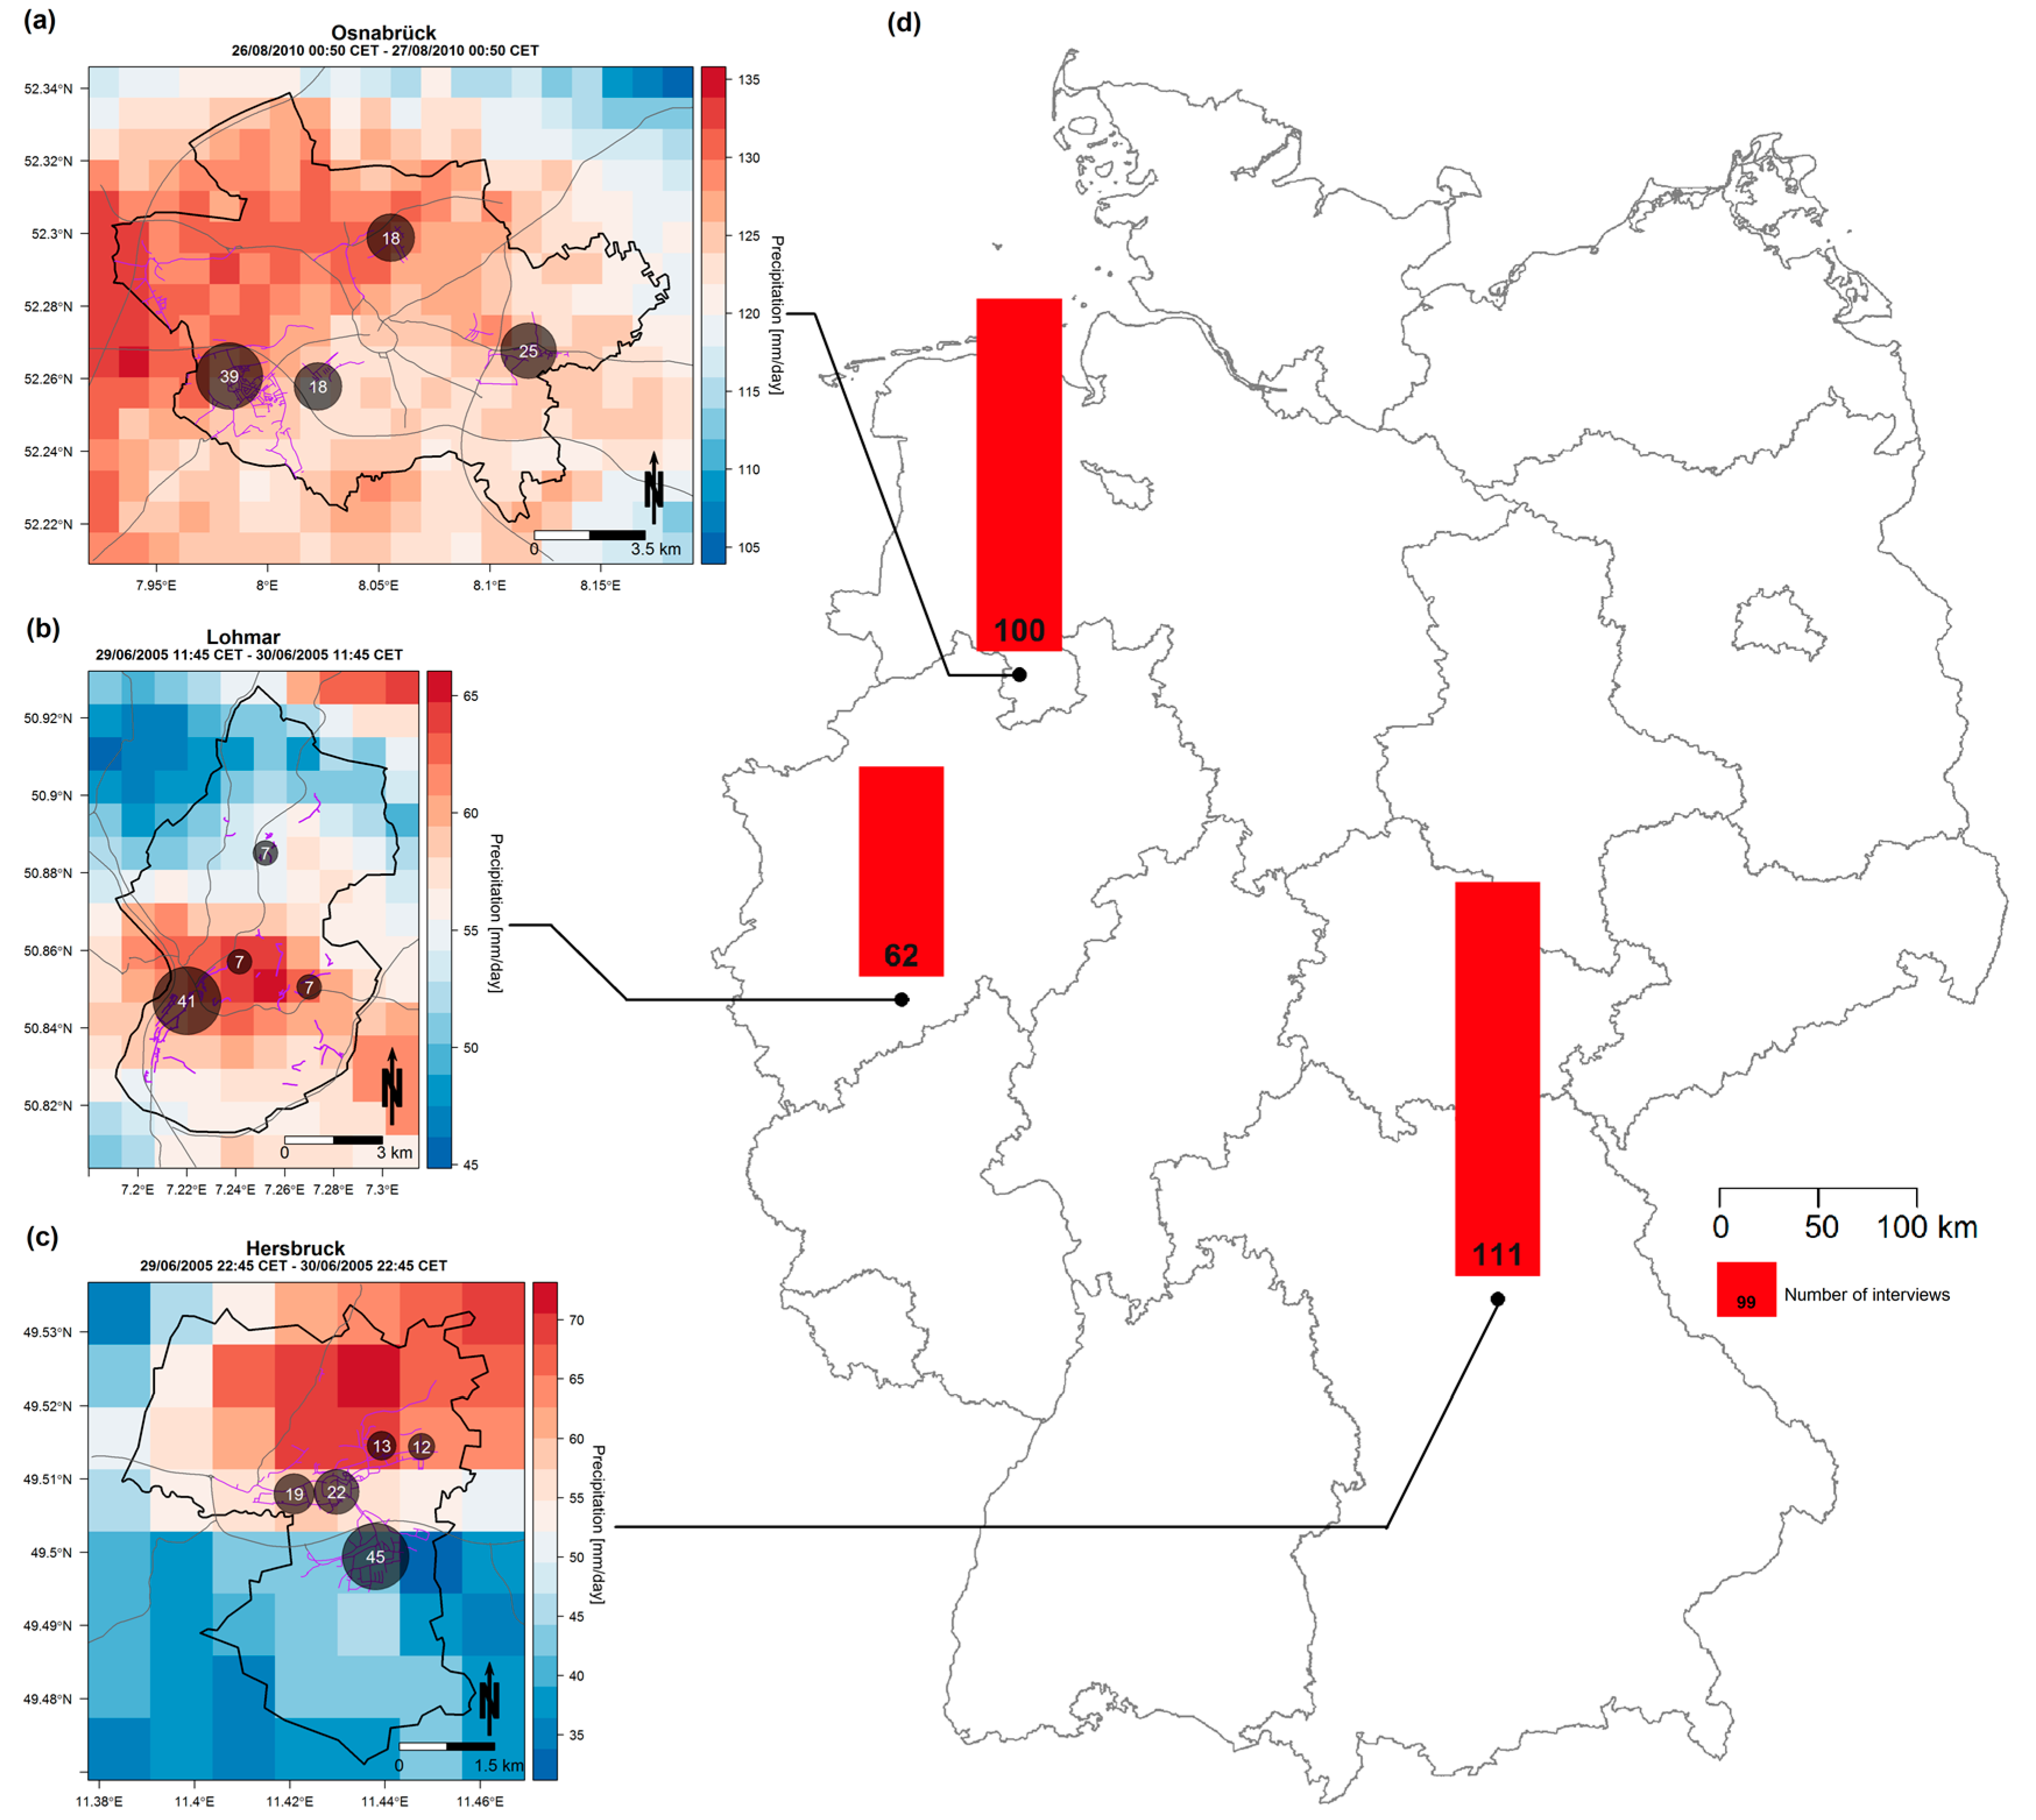
2. Pluvial Flood Events

2.1. Pluvial Flood Event in the Town of Hersbruck on 29 June 2005

At the end of June 2005, the weather in Western Europe was influenced by a surface low (named Yassin by Institute for Meteorology, FU Berlin, Germany) that emerged over Spain on 28 June, moved northeast, crossed France and reached Germany on 29 June. It brought warm humid subtropical air from the southwest of Europe. Along the boundary zone, due to cold and dry air masses from the north, the atmosphere became more and more unstable and thunderstorms with heavy rainfall, storm gusts, lightning strokes and hail developed mainly in the western (North Rhine-Westphalia, Hesse, Rhineland-Palatinate, and Saarland) and southern (Baden-Wuerttemberg and Bavaria) parts of Germany. Hersbruck, a town in Bavaria, 27 km northeast of Nuremberg, was also highly affected by torrential rain. The first moderate rainfall occurred from 8:00 A.M. to 11:00 A.M. (Central European Time) on 29 June. At about 10:00 P.M., rainfall started again with the highest intensity from 10:00 P.M. to 11:30 P.M. Until 7:30 A.M. on 30 June the meteorological station Hersbruck recorded 115.8 mm in 24 h, and until 7:30 A.M. on 1 July 117.3 mm within 48 h. Approximately 110 mm fell within only 1.5 h in the late evening on 29 June. The 1 h, 24 h and 48 h rainfall return periods exceeded 100 years [26].
The heavy rain caused widespread flooding and damages in the city of Hersbruck for various reasons. Flash floods with sludge and debris from unsealed areas outside the town damaged houses. Several small creeks overtopped the banks, whereas the rise of the water level of the River Pegnitz in Hersbruck did not cause any damages. At least two landslides occurred, one of them buried a street over a distance of about 50 m. The sewer system was hydraulically overloaded, and streets and underpasses were flooded. Some stormwater overflow structures were also overloaded and newly built reservoirs in Hersbruck-Weiher were heavily damaged. Approximately 300 houses (mainly the basements) were affected, and, in two cases, leaking heating oil contaminated the water. Several underground car parks were flooded and a number of cars were damaged. The total damage was estimated at approximately EUR 2.8 million. Besides the described event, several smaller pluvial floods in different parts of Hersbruck were reported for the years 1995–1997 and 1999 [26].

2.2. Pluvial Flood Event in the Town of Lohmar 29 June 2005

The weather situation that triggered the pluvial flood event in Hersbruck (see Section 2.1) was also responsible for the development of thunderstorms in the western part of Germany. Lohmar, a town in North Rhine Westphalia, 20 km southeast of Cologne, was also affected. Here, the first moderate rainfall occurred in the early morning hours (1:00 A.M. to 7:00 A.M. Central European Time) on 29 June. At about 6:00 P.M., rainfall started again until 4:00 A.M. on the next day, with the highest rainfall intensity between 9:00 P.M. (29 June) and 1:00 A.M. (30 June). Until 7:30 A.M. on 30 June, several meteorological stations in Lohmar and surroundings recorded 54 to 68 mm in 24 h. In the evening hours of 30 June until the morning of 1 July, thunderstorms once again brought heavy but less intense rainfall. Until 1 July (7:30 A.M.), rainfall accumulated to 86 to 112 mm within 48 h. Locally, the 48 h rainfall return period exceeded 100 years [26].
The heavy rain led to flooding in the city area of Lohmar and surrounding city districts, mainly from overflowing small creeks such as the Jabach, the Auelsbach and other very small unnamed creeks (tributaries to the River Agger) because of hydraulic surcharge, especially at throats like bridges or at culverts that were partly blocked with sludge and driftwood. The water level of the River Agger in Lohmar also rose but did not exceed the warning stages. Locally, the sewer system was overloaded and at some places water from the surrounding agricultural land flooded built-up areas. Some areas were flooded twice, initially in the night 29/30 June, and again approximately 24 h later (30 June/1 July). Besides the school center, the control center of the fire brigade of Lohmar was affected, and a temporary office had to be established. Generally, mainly basements, altogether 250 according to newspaper articles, were flooded. One affected company lost its whole archive. Most operations by the fire brigade and the Federal Agency for Technical Relief (THW) took place in the city area of Lohmar and in the surrounding districts Donrath and Wahlscheid. The total damage was estimated at approximately EUR 2.4 million. While there is no history of pluvial floods reported for Lohmar, the town has suffered from one reported fluvial flood before 2005, caused by the Auelsbach, a tributary of the River Agger in the year 2000 [27].

2.3. Pluvial Flood Event in the City of Osnabrück 27 August 2010

In all of Germany, August 2010 was the wettest August since 1881, when regular precipitation measurements started [28]. Locally, the monthly rainfall total exceeded the average amount by almost four times, e.g., in the city of Osnabrück, which is, with 156,000 inhabitants, the fourth biggest city in Lower-Saxony in the northwest of Germany (see Figure 1). In August 2010, it received rainfall totals of 273 mm, which is 385% of the reference value [29].
During the summer of 2010, the Northern Hemisphere jet stream was characterized by a strongly meandering pattern that remained locked in place for several weeks and brought extreme weather conditions to different regions in the Northern Hemisphere [30,31]. Low pressure systems repeatedly brought moist air with thunderstorms and heavy rain to Central Europe. While in the first half of the month (6 to 10 August), the most damaging flood event occurred at the River Neiße at the German–Polish–Czech border, heavy rainfall events between 26 August and 2 September led to major urban flooding in several places damaging a total of 8000 buildings claiming insured losses of EUR 35 million [32]. During this episode, the city of Osnabrück was the most severely hit district: while the average damage per affected building in late August 2010 was EUR 4840 in all of Germany, it was to EUR 6249 in Osnabrück [32]. The damage was caused by a severe weather system that dumped 128 mm of rain across the city on 26 August, which equals 47% of the mean monthly precipitation in August. As a result, the creeks Hase, Düte and Belmer Bach could not drain the water and inundated parts of the city, particularly the neighborhoods of Lüstringen, Hellern, Fledder, Atter and Atterfeld. For the first time since the Second World War, Osnabrück’s mayor declared a state of emergency. Although this event was the most severe flood recorded in the history of Osnabrück, there have been two smaller fluvial flood events caused by the River Nette in 1998 and by the River Hase in 2008 [33].

3. Data and Methods

3.1. Surveying Private Households Affected by Pluvial Flooding

The data for all three case studies were collected by computer-aided telephone interviews (CATI). Interviews were conducted among households in the flood affected areas of Lohmar and Hersbruck 17 months after the event. On the basis of information from fire brigades, street lists were compiled and the telephone numbers of residents, potentially affected by the pluvial flood, were searched from public telephone directories. In Lohmar, 742 telephone numbers could be identified, while, in Hersbruck, 534 were identified. During the survey period from 21 November to 19 December 2006, all telephone numbers were contacted. In total, 62 interviews in Lohmar and 111 in Hersbruck with affected residents were completed, which corresponds to 14% of the collected telephone numbers (1276). Fifty percent of the households called had not been affected by flooding at all, or the building was mainly used for commercial purposes; 25% did not want to participate in the survey; 10% were not reachable during the survey period; and 1% did not complete the interview. In the survey, the term “affected” was defined as a household that had suffered (financial) flood damage at the end of June 2005. Before the start of the telephone interviews, the public was informed about the campaign. Flyers with information on pluvial flooding in general and the campaign were distributed to all households in the affected areas in Lohmar and Hersbruck, and press releases were issued in the local media. In Lohmar, information was also available on the municipal website.
While the data from Lohmar and Hersbruck were gathered by a dedicated campaign within the project Urban Flash Floods (URBAS), the data from Osnabrück were part of a larger data collection campaign among private households, which suffered from property damage caused by flooding in August 2010 or January 2011 in Germany. The survey was conducted in February/March 2012, about nineteen months after the respective pluvial flood event. Lists of inundated streets were compiled on the basis of official flood and media reports as well as flood masks derived from satellite data (ZKI, Centre for Satellite-Based Crisis Information). With the help of these lists—which contained 143 street names from Osnabrück—phone numbers of all potentially affected residents were searched from the public telephone directory. In total 20,332 phone numbers were contacted. However, the percentage of successfully completed interviews was rather small in the end (3%). One reason for this was imprecise information on the (maximum) flood area and affected streets derived from this data, with the result that about 40% of households called had not been affected by flooding at all. Therefore, a more detailed documentation of the flood extent would be of great benefit for the overall sampling efficiency.
The survey campaign resulted in 658 completed interviews, of which 100 interviews were carried out with residents affected by torrential rainfall in the city of Osnabrück in August 2010. Their spatial distribution is displayed in Figure 1. A comprehensive analysis of the interviews in respect to the fluvial floods, that were excluded from this paper, can be found in Kienzler et al. [34].
The questionnaires used in both campaigns (2006 and 2012) were slightly modified versions of a questionnaire originally developed by Kreibich et al. [35] and Thieken et al. [23] for the 2002 flood in the Elbe and Danube catchments. The interviews lasted 25 to 30 min on average and the questionnaire consists of approximately 110 questions on the following topics (in the order of appearance):
  • Characteristics of the flood event;
  • Early warning and emergency measures;
  • Contamination of the floodwater;
  • Evacuation;
  • Clean-up work and recovery;
  • Physical and financial flood damage to the building and the household contents;
  • Building ownership and further information on the residential building (or the rented apartment);
  • Aid and financial compensation;
  • Long-term preventive and protective measures undertaken by the affected household and motivation (not) to do so;
  • Previously experienced flood and flood awareness; and
  • Socio-demographic information.
In a number of questions, people were asked to rank qualitative or descriptive variables on a scale from 1 to 6, where “1” described the best case and “6” the worst case. The meaning of the end points of the scales was given to the interviewee. The intermediate rankings could be used to graduate the evaluation. The surveys were conducted with the VOXCO software package by the Explorare market research institute. In all interviews, the person in the household that had the best knowledge about the flood damage was interviewed.

3.2. Pluvial Flooding Dataset

The total amount of 273 interviews in the dataset consists of 111 households for the town of Hersbruck, 100 households for the town of Osnabrück and 62 households for the town of Lohmar. With approximately 300 affected households in Hersbruck, 250 in Lohmar and 1100 in Osnabrück, sample fractions of 37%, 25% and 9%, respectively, were reached for the three subsets [26,36]. An overview of the characteristics for the three subsets regarding socio-economic and flood impact variables is shown in Table 1. Compared to recent census data, the mean age, household size, and mean living area is higher in the sample for all three subsets. This is also true for the homeowner rate, which is considerably higher compared to the census reference (see Table 1). As mentioned in a previous study by Kienzler et al. [34], this points towards a methodological bias of telephone interviews, where only phone numbers listed in the central telephone register are considered in the sample. An increasing use of cell phones and the fact that new landline numbers are not automatically added to the central telephone register, might lead to an overrepresentation of homeowners and long-established households.
Looking at education and income of the respondents, there is a considerable heterogeneity between the three study areas. While in Osnabrück 52% of the respondents stated to have a higher education, in Hersbruck this number is with 23% considerably lower. This is also reflected in the monthly net household income, where Osnabrück has the lowest fraction of low income households with less than EUR 1500 at 14% and Hersbruck the highest fraction with 25%. Regarding education and income the Lohmar sample lies just between the two other subsets.
Comparing the three subsets in respect to their flood impact characteristics, small differences can be seen for the median water level, mean flood duration, the flow velocity distribution and the fraction of contaminated households (see Table 1). Given the flood characteristics as well as the number of affected households, Osnabrück can be characterized as the most severe flood event among the three subsets.
The differences in the rainfall intensity and amount outlined in Section 2 between the events is also reflected in the water levels, where the median water level relative to the surface for Lohmar is 45 cm and 51 cm lower than in Hersbruck and Osnabrück, respectively (see Table 1). The negative mean and median water levels indicate the high fractions of households where only the basement was affected.
In contrast, the mean flood duration in Osnabrück was considerably longer than it was in Hersbruck and Lohmar. This is caused by the high number of affected households in Osnabrück compared to the smaller events in Hersbruck and Lohmar, which exceeded the coping capacities of the local emergency services. According to local newspaper reports, this led for some households to a delay of several hours, before their flooded basements could be pumped out by the emergency services [36].
In Lohmar, the fraction of respondents reporting high or very high flow velocities near their house is considerably higher than in Hersbruck and Osnabrück. Differences can also be observed for respondents, who reported contamination of their property during the flood. Osnabrück sticks out with 34% of the interviewed households reported a contamination of their property with either oil, sewage, gas or other chemicals.

4. Results and Discussion

The results presented in this section follow the widely used risk management cycle (see [23,41,42]), which addresses the following phases before, during and after a pluvial flood event:
  • Preparedness: This section discusses the previous flood experience of the respondents in all three subsets, the private precautionary measures they had taken to mitigate the flood risk and their motivation to undertake these measures.
  • Warning and response: This section discusses whether the respondents received a warning prior to the event and if they undertook any measures shortly before or during the event to reduce damage.
  • Flood damage: This section discusses the damage to buildings and contents caused by pluvial floods in the three study areas and possible factors that influence the amount of damage.
  • Recovery: This section discusses the process that lead to regaining the standard of living after the pluvial flood events compared to the pre-event conditions and the factors that influence the recovery after such an event.

4.1. Preparedness

Several studies have shown that flood experience and knowledge about the flood hazard (among other factors) are closely connected to the implementation of precautionary measures (e.g., [23,35,43,44,45]). Therefore, flood experience and preparedness, in the form of private precautionary measures, are considered together in this section.

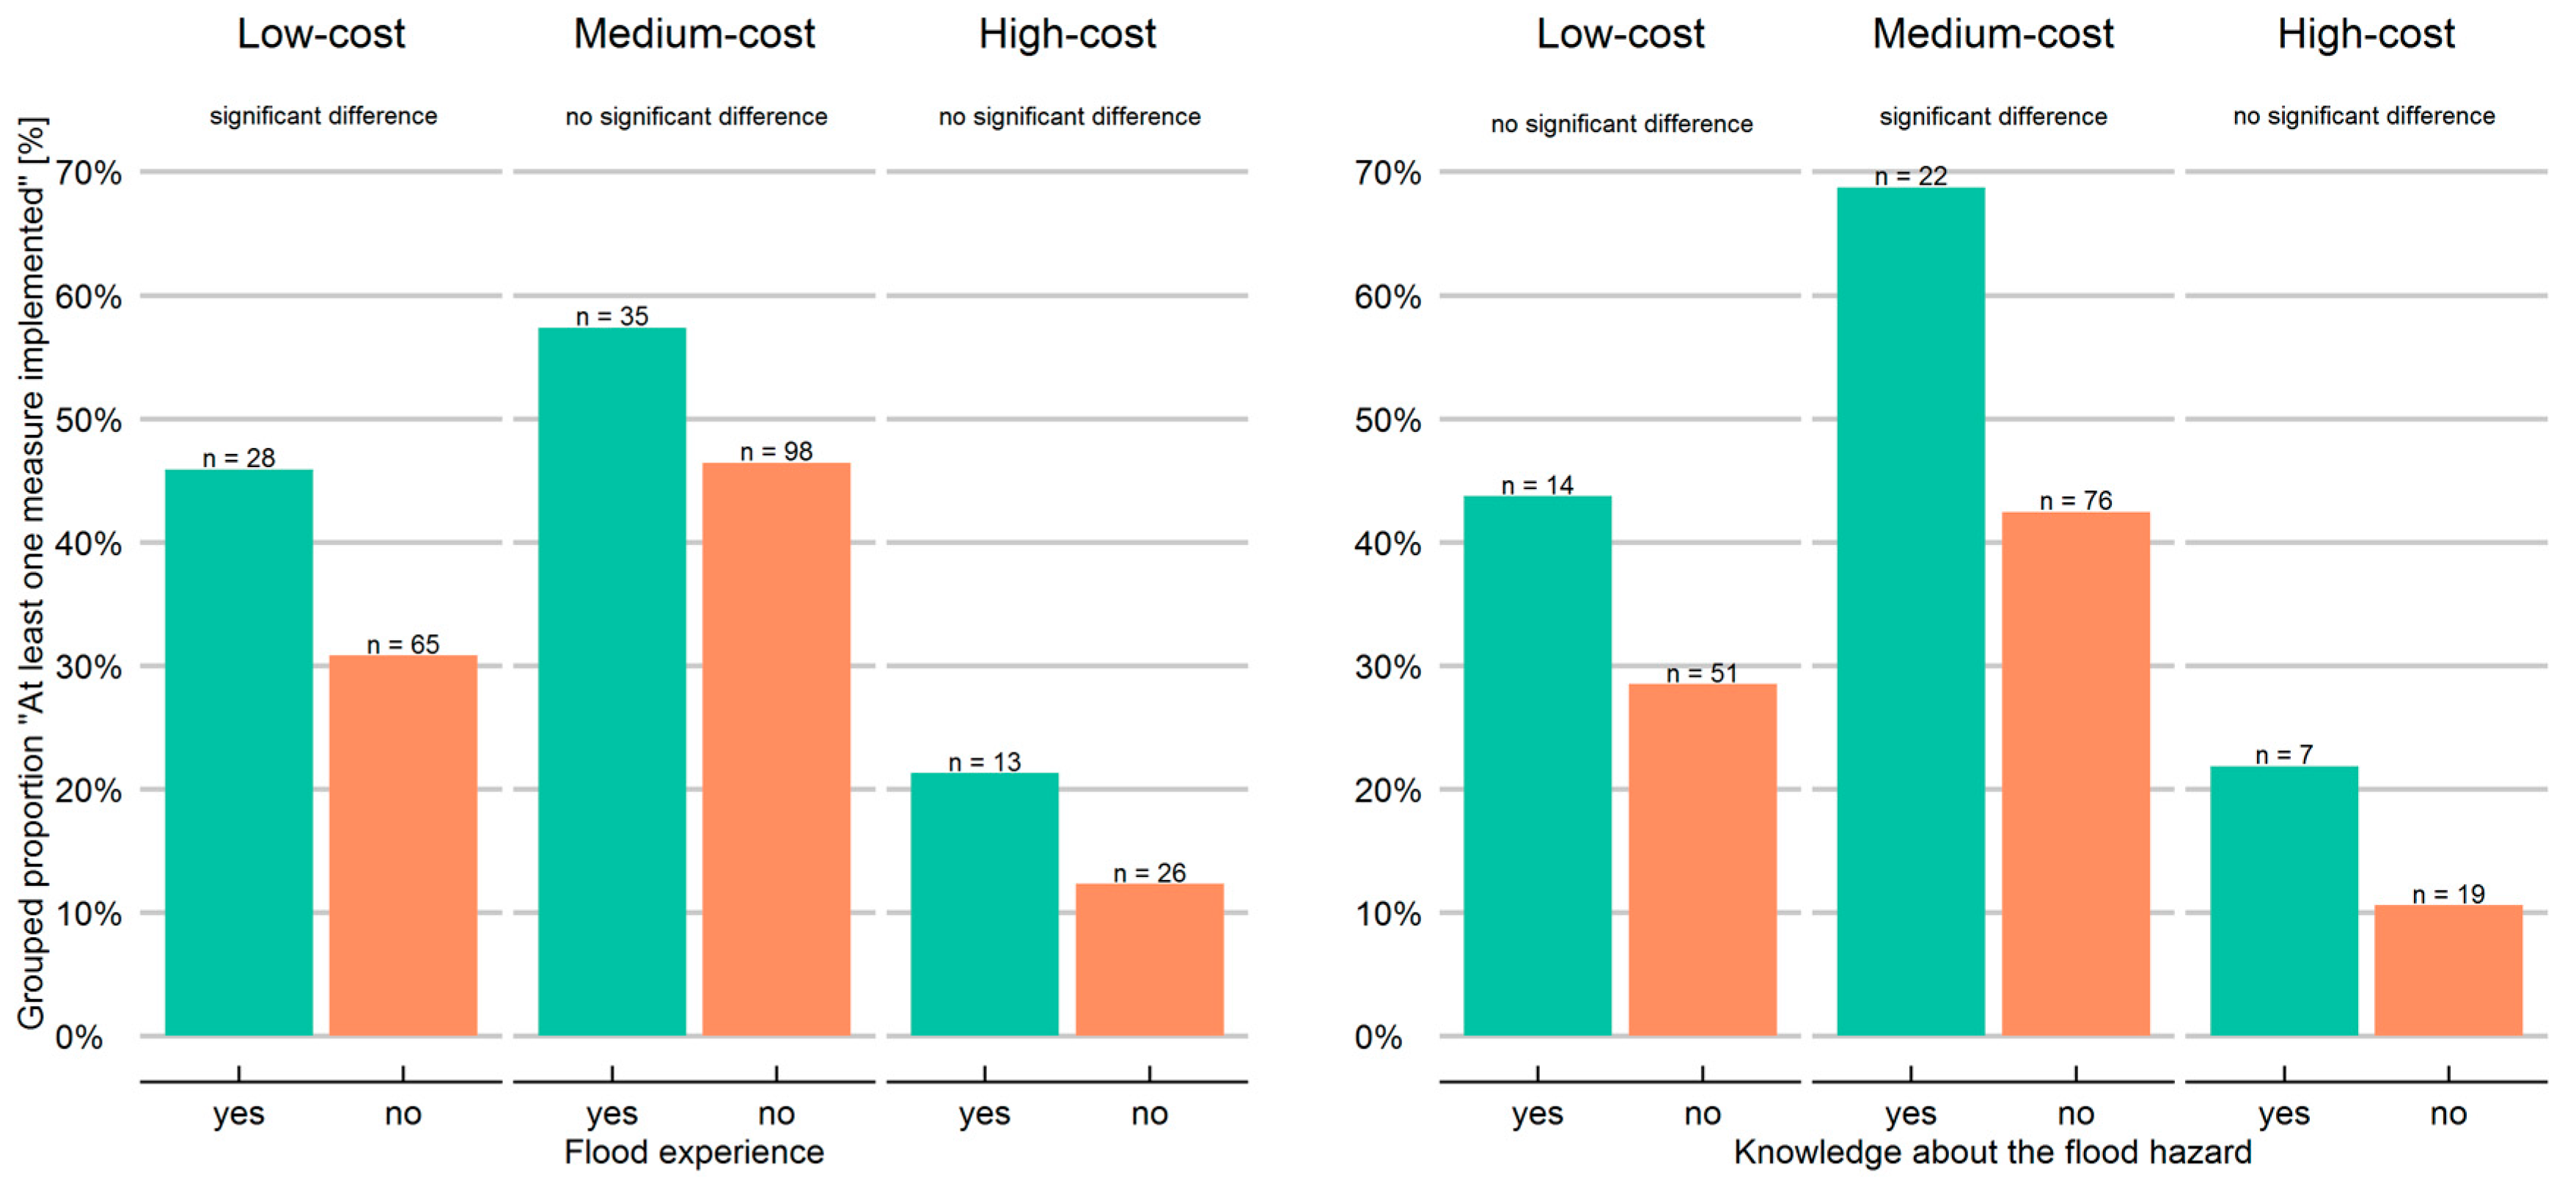
4.1.1. Flood Experience and Knowledge about the Flood Hazard

Looking at the overall flood experience, the fraction of respondents, who have experienced a flood before the respective events in 2005 and 2010, is rather low in all three case studies. The same is true for the knowledge about the flood hazard among the respondents, who had not experienced a flood before (see Table 2).
With only 16% of respondents having previous flood experience, the Lohmar subset has the lowest number of flood experienced respondents among the three case studies. When only taking floods into account that happened less than 10 years ago from the respective event, flood experience in Lohmar was almost non-existent with only 3%. Comparing the two simultaneous events in Lohmar and Hersbruck, a considerably higher amount of respondents in the latter area had experienced a flood before the 2005 event. There is also a higher amount of respondents in Hersbruck, which had knowledge about the flood hazard, although they had no previous flood experience.
Overall, the Hersbruck subset has the highest fraction of flood experienced respondents, as well as respondents with knowledge about the flood hazard among the three subsets. For the other two subsets, the flood experience differs considerably, while the knowledge about the flood hazard is equally low for Lohmar (10%) and Osnabrück (8%). Since pluvial floods also occur in areas not obviously prone to flooding and where flood maps are non-existent, these results seem to correspond with the flood history of the three study areas before the respective events (see Section 2).
Therefore adding information on pluvial flood risks to existing flood maps could help to increase the awareness of pluvial flood risk in the general public.

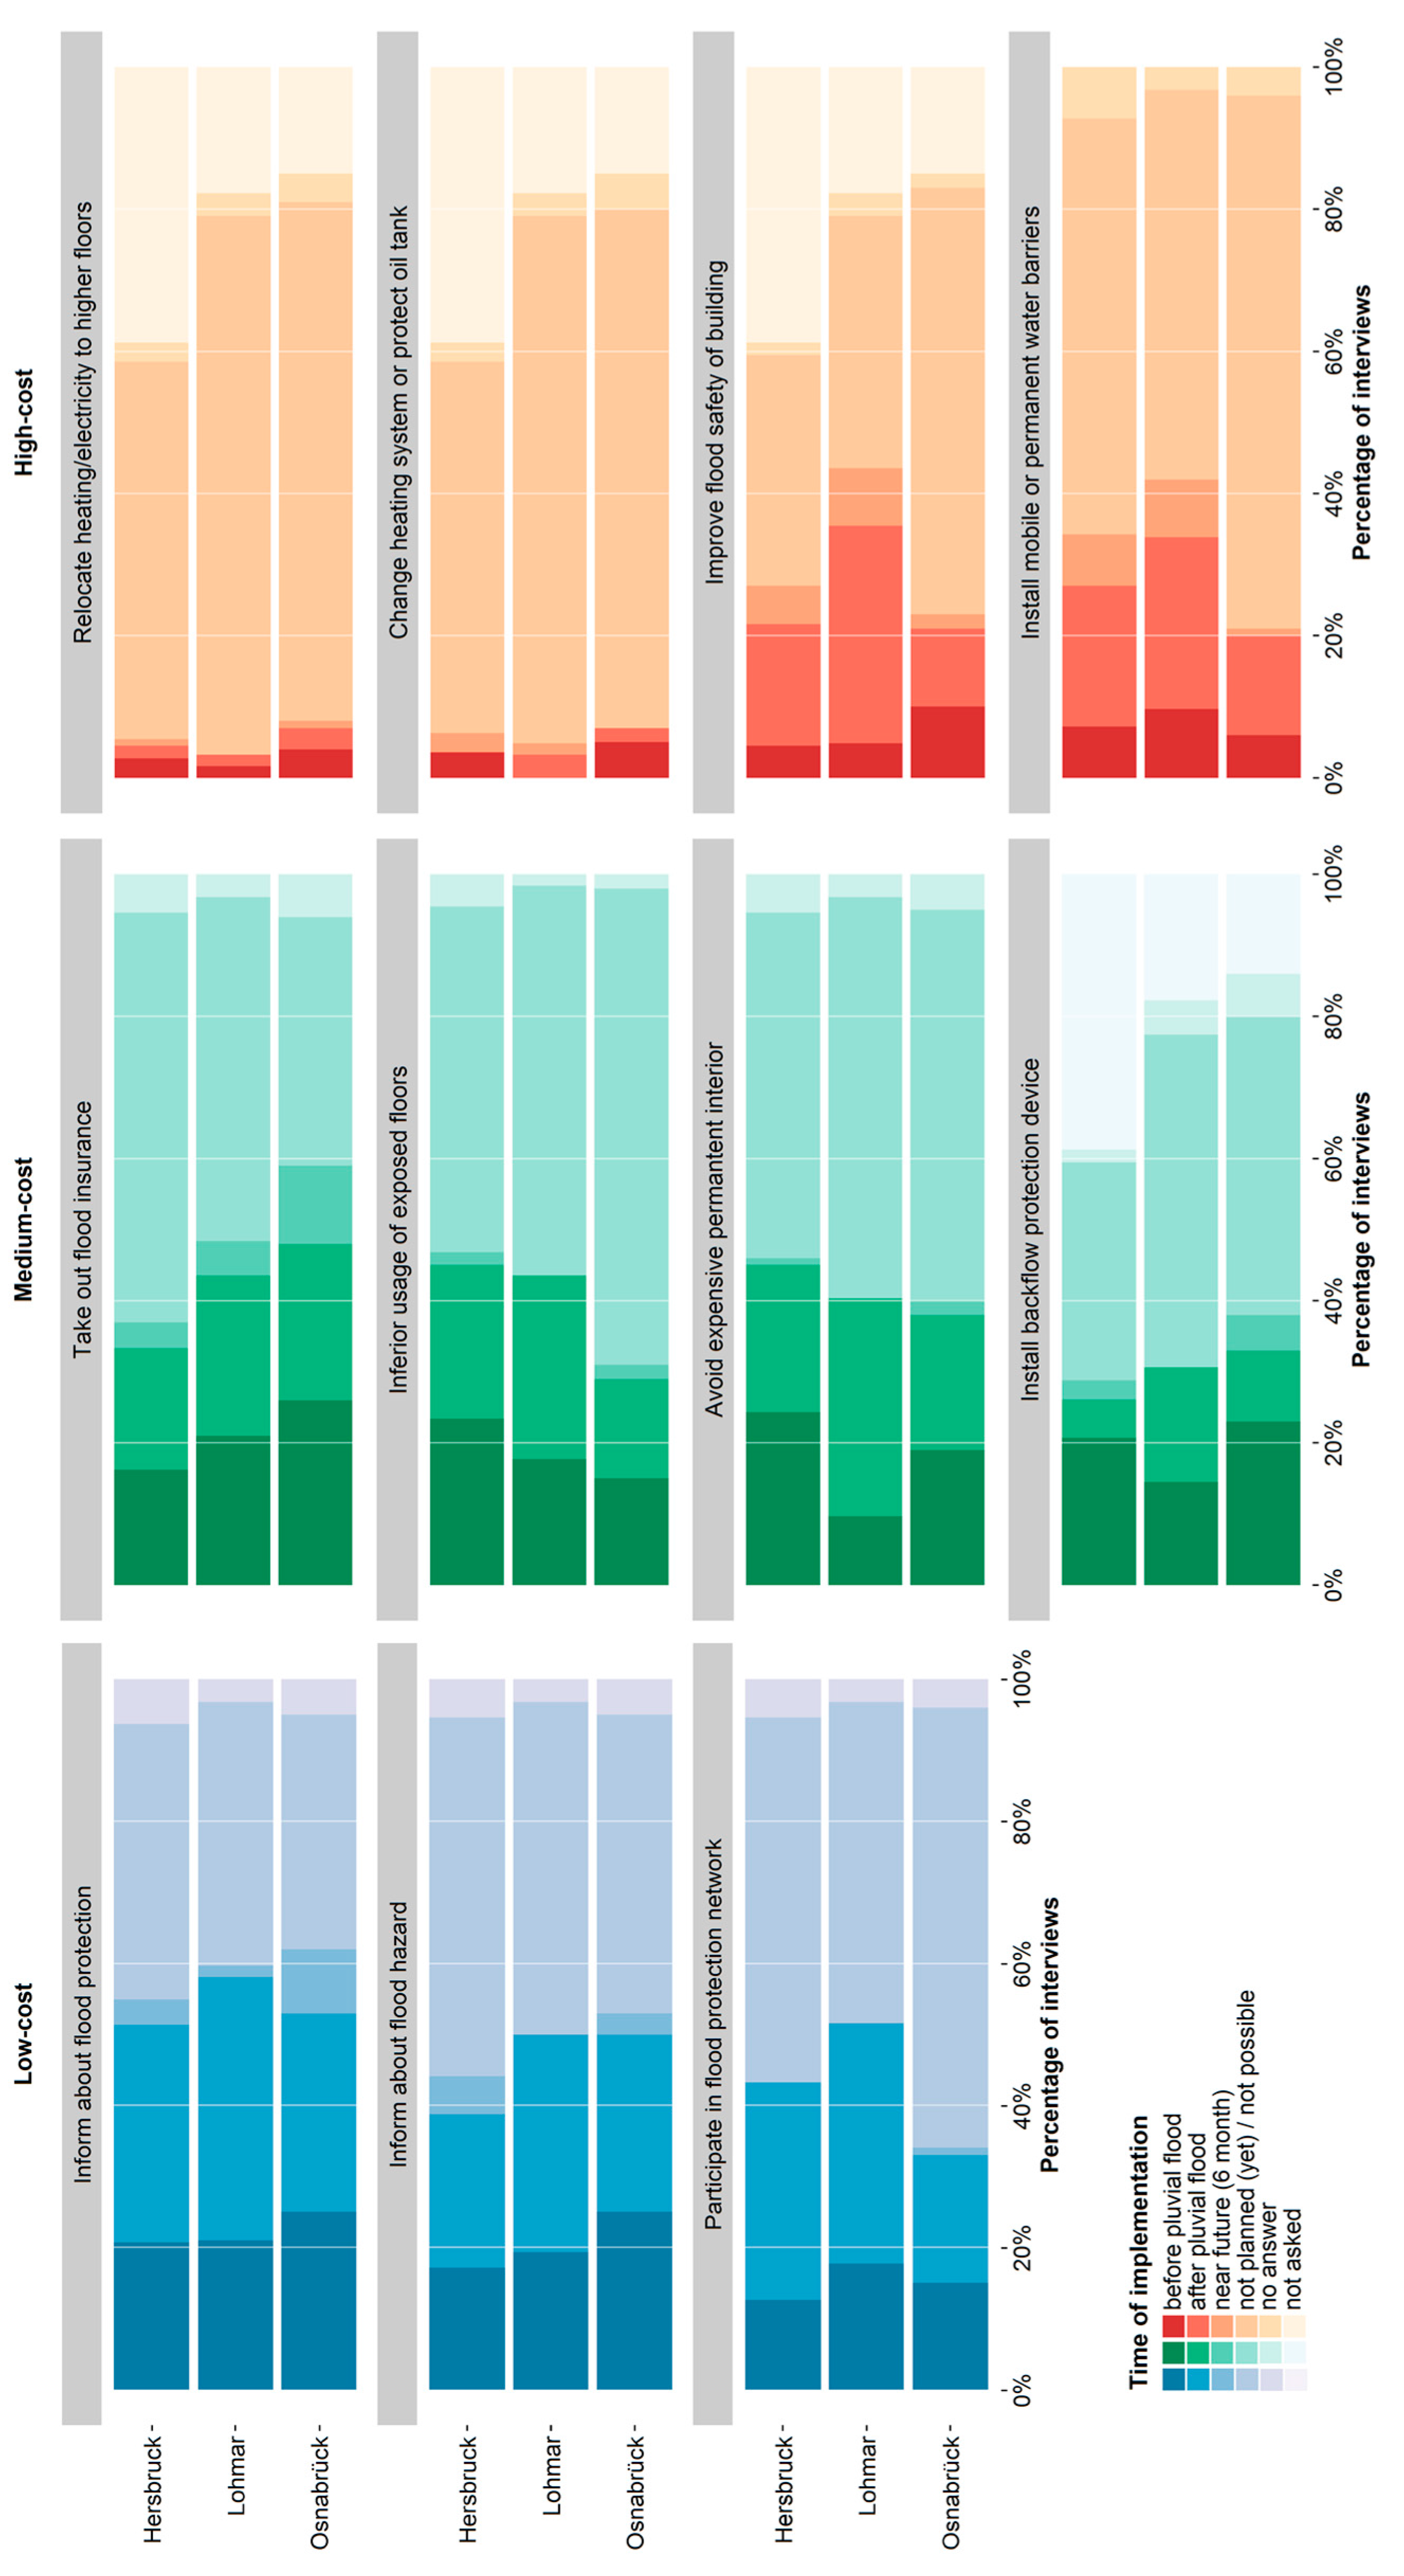
4.1.2. Precautionary Measures

Private precautionary measures are an important part of flood loss mitigation. The study comprises three different levels of precautionary behavior: (1) low-cost measures, such as acquiring information about flood protection; (2) medium-cost measures, such as an inferior use of exposed floors; and (3) high-cost measures, which involve structural changes to the building. In total, eleven precautionary measures, covering all three levels, were considered in the questionnaire (see Figure 2). The Osnabrück study contained three additional measures, which are, for the sake of comparability between the three subsets, not considered in this study. Although taking out flood insurance does not have a direct effect on flood loss mitigation, it helps to recover faster from a flood event and is therefore treated as a medium-cost measure in this study. For all measures, the respondents were asked to state whether the measure had been implemented before the flood, after the flood, is planned or will not be implemented. Measures that involve changes to the building structure were only answered by homeowners, as tenants are usually not able to implement these measures. In this section, the changes in preparedness before and after the respective event as well as the motivation to undertake precautionary measures will be discussed.

4.1.3. Preparedness before the Flood

Although the flood experience and knowledge about the flood hazard was low (see Section 4.1.1), the overall preparedness for pluvial floods in terms of respondents who did undertake at least one precautionary measure before the flood events in 2005 and 2010 was with 60% surprisingly high. Compared to similar analysis by Kienzler et al. [34] for fluvial floods where 90% of all respondents did undertake at least one precautionary measure before the flood, the value can still be seen as high against the backdrop of the lower flood awareness of the general public for pluvial floods [46]. However, differences in preparedness between the three subsets can be observed. In Osnabrück, 67% of the respondents undertook at least one measure before the flood, while the values for Hersbruck (59%) and Lohmar (48%) are lower. Interestingly, the flood experience and knowledge in Osnabrück was lower, than in Hersbruck, but still resulted in a higher fraction of households who undertook precautionary measures.
Regarding the different precautionary measures implemented by the interviewed households, an overview is given in Figure 2. Mostly low-cost and medium-cost measures were undertaken before the event. Among the households of all three subsets, collecting information about flood protection (22%), collecting information about the flood hazard (21%) and effecting flood insurance (21%) were the most common precautionary measures undertaken before the respective flood event. Although collecting information about the flood hazard and how to protect against floods, as well as contracting a flood insurance have no direct effect on the reduction of flood damage, the high fraction of low-cost measures must be seen in context of cost-effectiveness in regard to flood probability and expected damage [47]. While high-cost measures are often economically “reasonable” in relation to the expected damage for fluvial floods with short return periods, small pluvial floods with typically lower amounts of loss call for a shift from expensive precautionary measures to less costly solutions [48]. This is also true for measures that are able to directly reduce damage, where medium-cost measures, such as adapted building use were more common than expensive changes to the building structure. Among the medium cost-measures, installation of a backflow preventer (20%) and avoiding expensive permanent interior on floors at risk (19%) were the most popular measures to mitigate flood damage. With 3% to 7% of all respondents, high-cost measures were only considered by a minority.
When looking at the three subsets separately, only smaller differences in precautionary behavior can be identified. Overall, the level of precaution for Osnabrück was slightly higher than for the events in Lohmar and Hersbruck. For seven out of eleven measures, the fraction of respondents who did implement this measure before the flood was higher in Osnabrück than in Lohmar and Hersbruck (see Figure 2). This includes all high-cost measures, except for the installation of permanent or mobile water barriers. When looking only at the Lohmar and Hersbruck subsets, it is interesting to see, that although Lohmar had a higher number of respondents who informed themselves about the flood hazard, how to protect against floods and who joined a flood network, these measures did not translate to the same extent into actual damage mitigation measures. Hersbruck, on the other hand, shows lower or equal numbers for measures that involve acquiring information about pluvial floods, but has higher values than Lohmar for almost all measures involving adapted building use and changing the building structure. For the two adapted building use measures “inferior use of exposed floors” and “avoidance of expensive permanent interior on floors at risk”, the values of 23% and 24%, respectively, are even higher than in Osnabrück. In comparison with a similar study on fluvial floods by Kienzler et al. [34], the values for all three study areas are in the range of the 2002 flood along the River Elbe, where the preparedness level was considered low. Interestingly the recent history of pluvial flood events in Hersbruck (see Section 2.1) did not seem to have an effect on the implementation of precautionary measures, as the values for almost all of the measures are equally low as for the other two study areas, where no recent pluvial flood events prior to the events of 2005 and 2010 were reported. However, the low flood experience (see Table 2) indicates that during past events other areas of Hersbruck were affected, remaining the households that were hit in 2005 unaware of the risk. This highlights the local extent of pluvial floods, which make an adequate preparedness challenging for private households as well as for local authorities.

4.1.4. Changes in Preparedness after the Flooding

For all three subsets, the respondents were not only asked about what precautionary measures they have undertaken before they were flooded, but also whether they changed their precautionary behavior in the aftermath of the flooding. Implementing precautionary measures in the aftermath of a flood is not only a comprehensible behavior, but can also be understood from an economic perspective, as implementing these measures alongside the restoration of a damaged building is seen as very cost-effective [35]. Grothmann and Reusswig reported that homeowners often implement mitigation measures when they renovate or repair the building—for any other reason [49]. Therefore, it is not surprising that a significant rise in precautionary behavior after all three events can be observed. The strongest absolute increases subsequent to the flooding can again be mainly seen for low- and medium-cost measures. With 31% in total for all three subsets, informing about flood protection was the most popular measure undertaken after the flood. However, the strongest relative increases can be observed for improving the flood safety of the building (this includes structural changes to the buildings as well as installing flood proof basement doors and windows) and installing mobile or permanent water barriers. While the latter two were implemented by only 7% of all respondents before the flood, this value rose by 19% for installing mobile water barriers and 18% for improving the flood safety of the building subsequent to the flooding. Very expensive measures such as relocating the heating system and fuse box to higher floors or completely changing the heating system, was only considered by very few respondents (<5%) before the flood and did not change much after the flood.
When looking at the three subsets individually, Lohmar showed for most of the measures a considerably higher increase after the flood, than Hersbruck and Osnabrück. Being the least prepared subset before the flood, Lohmar shows the highest absolute values of respondents who informed themselves about flood protection (57%), participated in flood protection networks (52%), improved flood safety of their building (31%) and installed permanent or mobile water barriers (34%) after the pluvial flood. Nevertheless, for all three subsets, the number of respondents who reported the implementation of a measure doubled for most of measures after the flood event.

4.1.5. Motivation to Undertake Precautionary Measures

In order to analyze whether flood experience or knowledge about the flood hazard has a significant influence on implementing precautionary measures as stated by several studies on fluvial floods [43], Chi-squared tests with a 0.05 significance level were performed. Therefore the interviewed households were separated into groups depending on whether they have implemented no or at least one precautionary measure for each cost-level (low-, medium- and high-cost measures) (Figure 3). Looking at the flood experience, only low cost-measures were significantly more often implemented by households who had experienced at least one previous flood. On the other hand, only medium-cost measures were significantly more often implemented by households who have knowledge about the flood hazard but no previous flood experience. A possible explanation could be that households who had been flooded before considered inexpensive measures as sufficient given the flood probability and expected future damage. Households with only knowledge about the flood hazard might assess the risk as well as the expected damage higher and therefore considers larger investments in private flood precaution as feasible.
When asked about the general effectiveness of precautionary measures on a scale from (1), meaning “very effective” to (6), meaning “very ineffective”, a majority of 69% in all three subsets evaluates precautionary measures as rather effective, giving numbers from (1) to (3). Among these, 24% consider private precautionary measures as “very effective”. The differences between the three subsets are in accordance with the fraction of precautionary behavior shown in Figure 2: with 32% of respondents rating precautionary measures as “very effective” and 81% giving grades from 1 to 3, Osnabrück showed the highest fraction of respondents with positive attitude toward precautionary behavior (Figure 4). This is followed by Lohmar (rating (1): 24%; rating (1) to (3): 66%) and Hersbruck (rating (1): 17%; rating (1) to (3): 61%). Only a minority of 3% in Osnabrück, 5% in Lohmar and 8% in Hersbruck evaluates precautionary measures as very ineffective.
The low motivation to implement high-cost measures, the lacking influence of flood experience and knowledge about the flood hazard, and the fact that precautionary measures were assessed as effective by most households suggest that cost and effort for a measure may influence the decision about precautionary measures. However, further research especially in the context of flood coping appraisal is needed to gain a deeper understanding on the influencing factors of private pluvial flood precaution [50].
Overall, the level of precautionary behavior before the flood was rather low in all three subsets. Possible reasons are lacking flood experience and knowledge about the flood hazard. Although precautionary measures were evaluated as a rather effective way to mitigate pluvial flood damage in general, mainly inexpensive and easy to implement measures were considered by households in all three study areas. These measures do not necessarily help to directly reduce damage, but must be seen against the backdrop of low risk awareness and the relation between costs of implementation and expected damage associated with pluvial floods. However, in consequence of the flooding, the fraction of respondents showing precautionary behavior more than doubled for many measures after the flood, and thus improving the preparedness of Lohmar, Hersbruck and Osnabrück for possible future floods.

4.2. Warning and Response to Pluvial Flooding

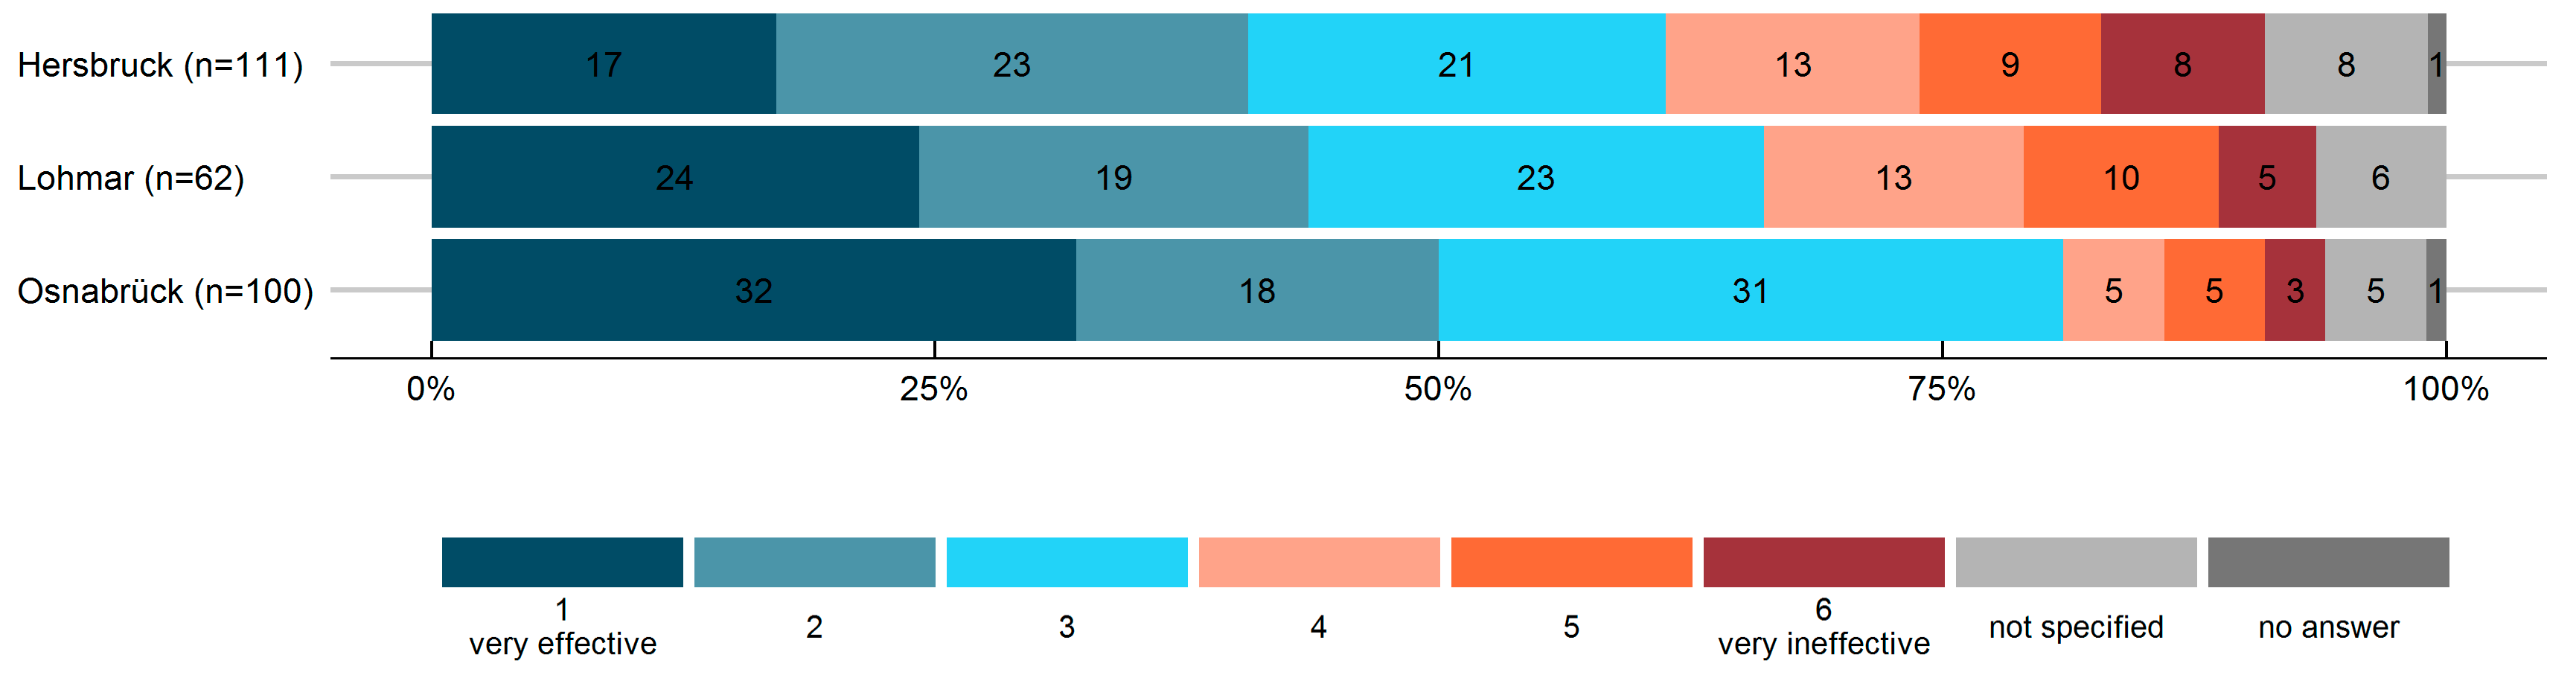
4.2.1. Early Warning

Receiving a warning prior to a pluvial flood increases the chances to adequately protect lives and assets at risk, by implementing emergency measures such as moving values to higher grounds, protect oil tanks or directly safeguard the building from inflowing water. In order to have enough time to implement these measures, the lead time as well as the content of the warning concerning affected areas and expected severity of the events, are critical. As outlined in Section 1, official early warnings for pluvial floods are challenging and limited to severe weather warnings released by the DWD [19]. Other warnings including warnings by friends or relatives, general news coverage or direct observation of the weather, are often uncertain and usually have considerably lower lead times compared to official warnings. For Hersbruck, Lohmar and Osnabrück, several severe weather warnings with maximum lead times of 17 h, 15 h and 16 h (meaning the time between the release of the warning and the flooding of the building), respectively, were released by the DWD. These warnings contained time, affected district and information about the expected amount of rainfall. Although for all three subsets official severe weather warnings were issued prior to the flooding, 68% of the interviewed households stated that they did not receive any warning (see Table 3). Among the respondents who reported that they have received a warning, with 19% most of them referred to own observations of the weather, the flooding of their direct surroundings or already smaller leakages inside their homes. This type of warning resulted in very short average lead times of less than two hours, which limits the emergency response to basic damage reducing measures, such as moving valuables to higher grounds or pumping out the water that already entered the building. Only 8% of all respondents received the official severe weather warning with an average lead time of nine hours prior to the event. The low number of recipients as well as the rather high delay of six to eight hours between the possible maximum lead time and the average lead time, indicates weaknesses in the dissemination of severe weather warnings. Meanwhile, the DWD has further improved the dissemination of warnings including various media channels such as Short Message Service (SMS), YouTube videos and an updated website design [8].
The number of respondents who did not receive a warning was particularly high in Hersbruck and Lohmar, where in both cases 77% reported that the flood hit them without any warning. With 53% of respondents remaining unwarned, the value for Osnabrück was considerably lower.

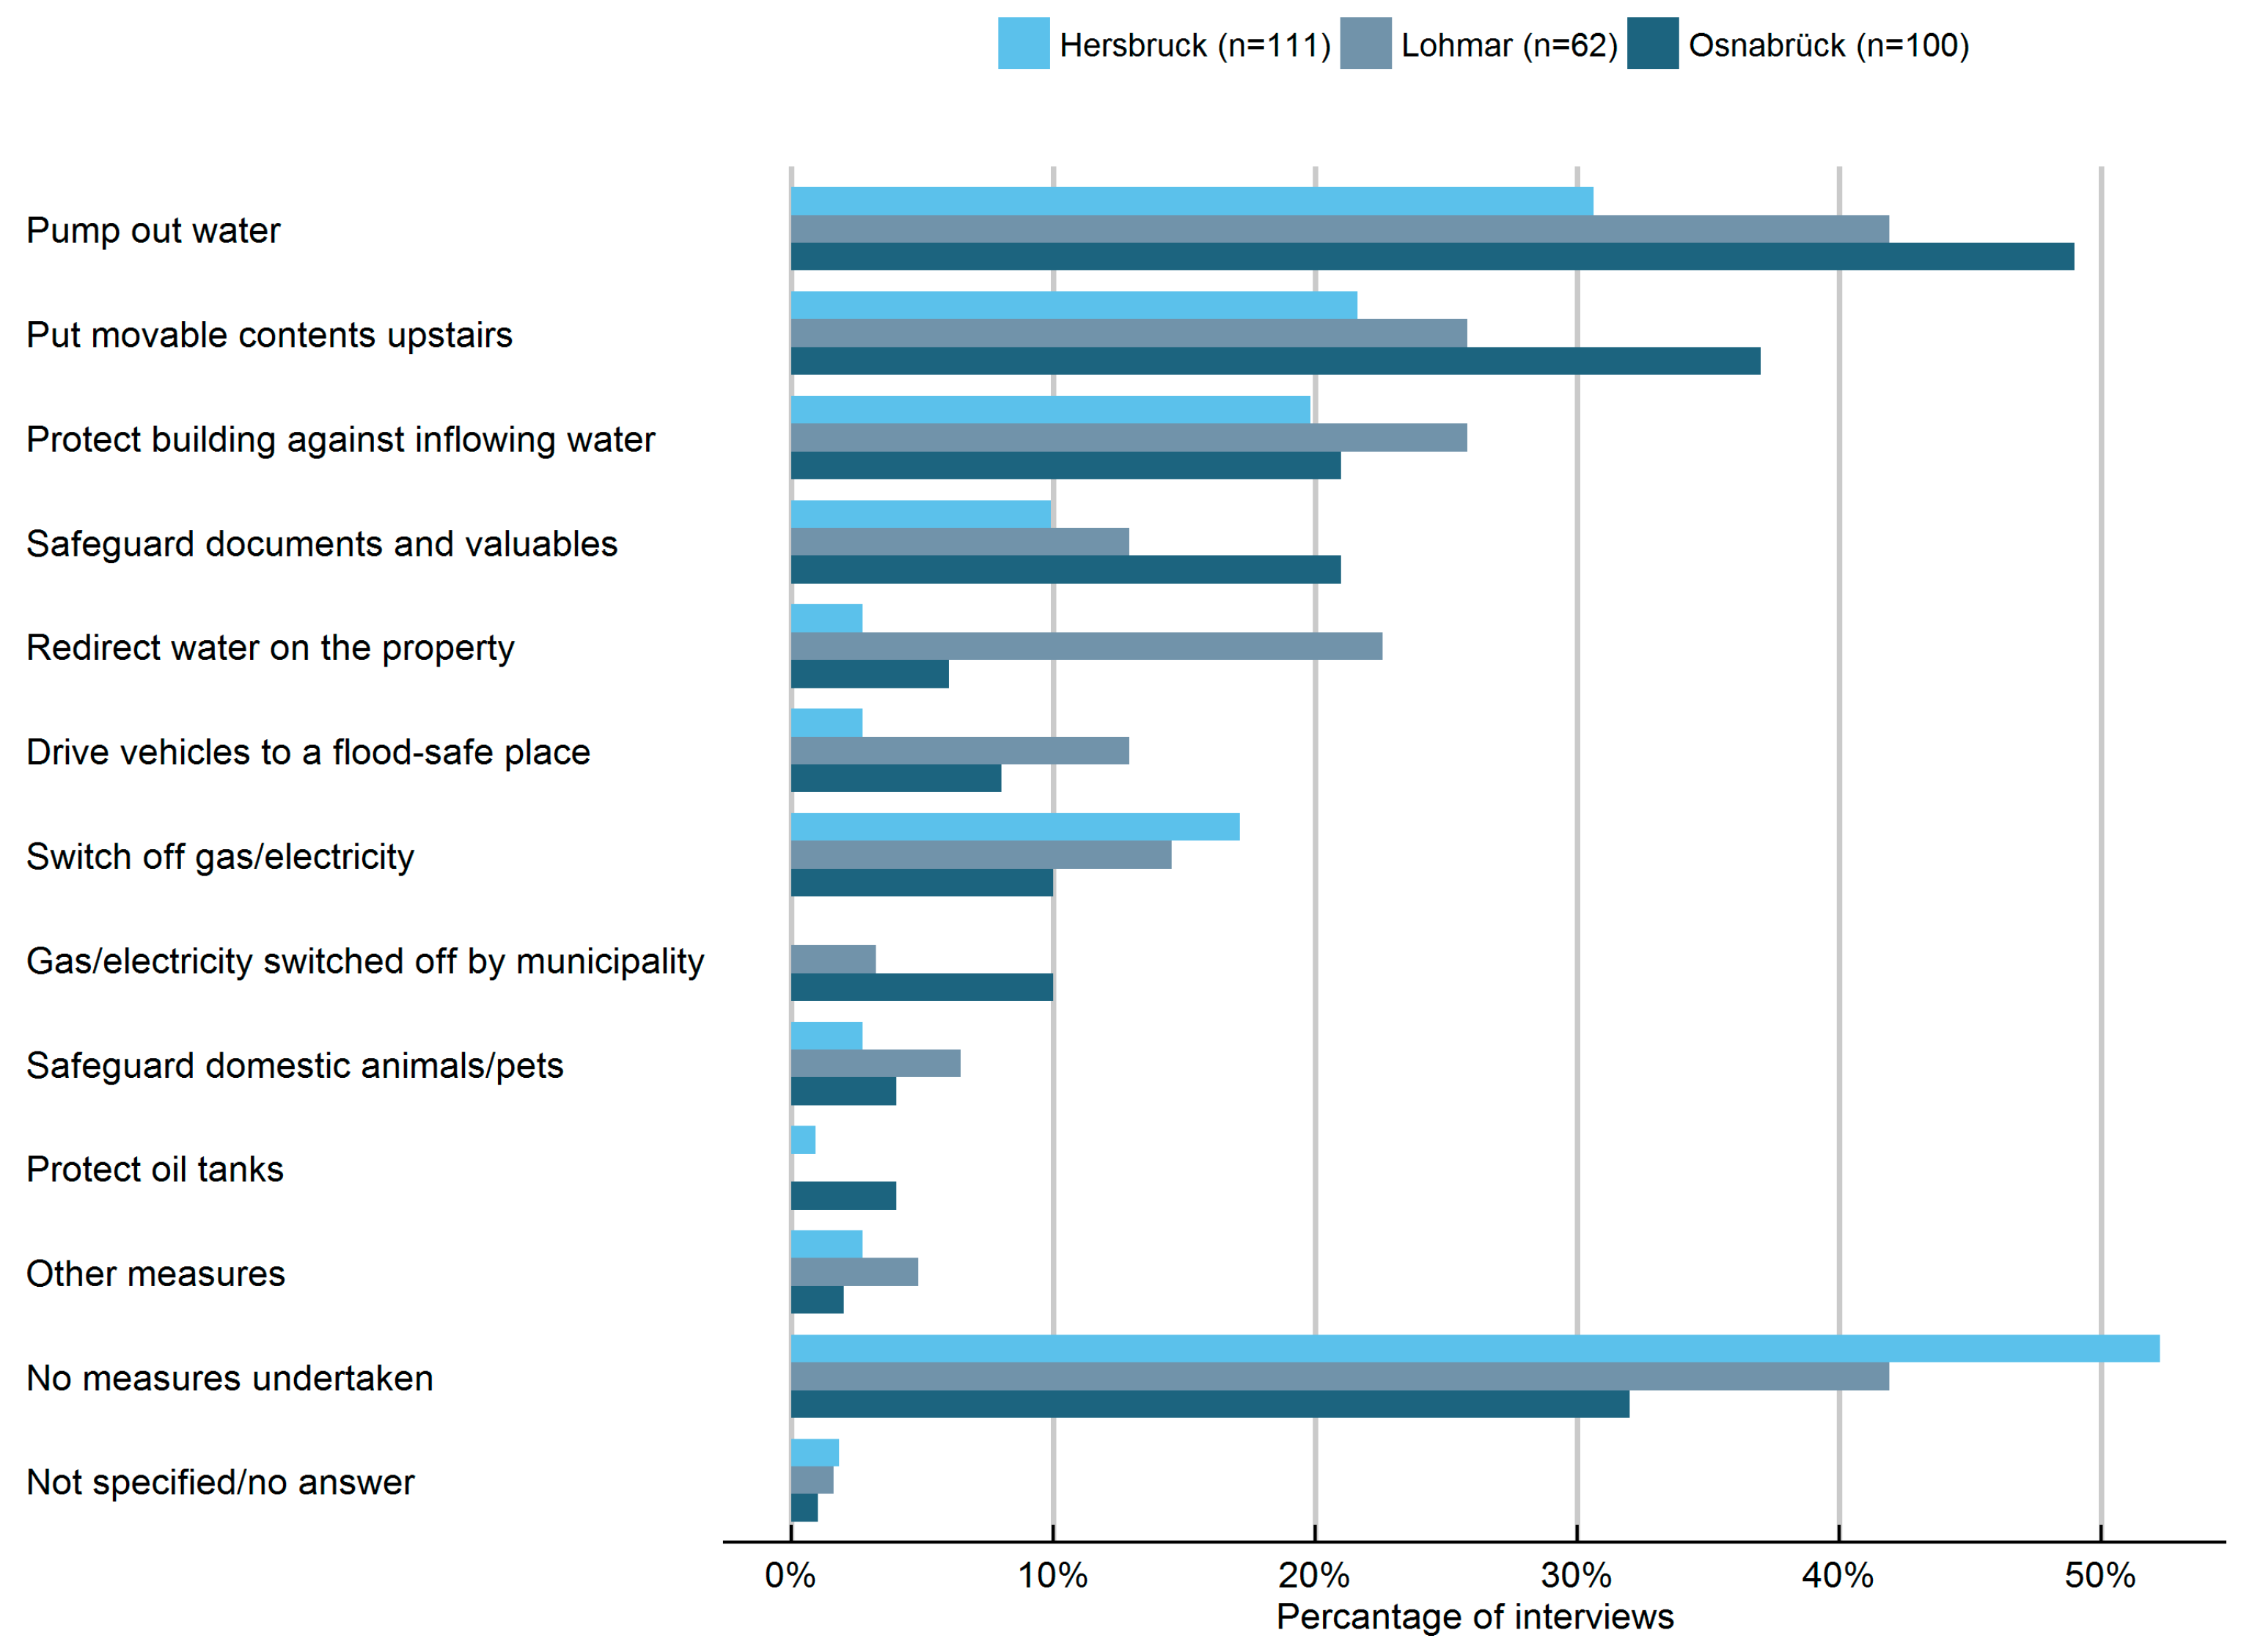
4.2.2. Emergency Measures Undertaken

Emergency measures are actions that are taken shortly before or during a flood event to mitigate potential loss and damage [51]. In the context of pluvial floods, emergency measures are expected to play an important role in damage reduction, as typically lower water levels compared to fluvial floods are assumed to make these measures particularly effective. However, the effectiveness of a particular measure in terms of damage reduction depends on a large number of factors, including the type of warning, lead time, the person implementing the measure, etc., and is still hardly understood [52]. For this study, the flood affected households in Lohmar, Hersbruck and Osnabrück were asked to report on the emergency measures they had undertaken and how they assess the effectiveness of these measures in order to reduce damage.
In total, 58% of all respondents reported to have implemented at least one emergency measure shortly before or during the pluvial flood. Among the eleven most common emergency measures asked, pumping the water out of the building (41%), putting movable contents upstairs (28%) and protecting the building from inflowing water (22%) were most often implemented by households in all three study areas. Although the relative popularity of each measure follows a very similar pattern in all study areas, considerable differences in the number of households implementing emergency measures in each study area were found. While in Osnabrück 68% of the households implemented at least one emergency measure, the numbers for Lohmar (58%) and Hersbruck (48%) are substantially lower. The most popular measures, such as pumping the water out of the building and putting movable content to higher floors, were particularly often implemented in Osnabrück. Besides switching off the gas and electricity supply in the building, Hersbruck falls behind the other two subsets for all other measures. However, the slightly higher number of households in Hersbruck who switched off their gas and electricity supply is probably due to the fact that apparently the municipality of Hersbruck did not switch it off centrally in the affected neighborhoods (see Figure 5). Compared to the other two subsets, a relative high percentage of households in Lohmar implemented measures such as protecting the building against inflowing water, driving vehicles to a flood-safe place and redirecting the water on the property. Unlike damage mitigation measures such as pumping out the water, the latter are often implemented with the goal to completely avoid losses by preventing water intrusion into the building or vehicle in the first place. A reason for this difference might be related to the hazard characteristics, as lower rainfall intensities (see Section 2) in Lohmar may have led to more households considering damage prevention as feasible.
The affected households in all three study areas were directly asked to assess the effectiveness of each emergency measure they have implemented on a scale from (1), meaning “very effective” to (6) meaning “very ineffective”. For the three study areas, the average effectiveness of each measure is shown in Figure 6. Due to no or very few observations in the three study areas, “protecting oil tanks” was excluded as a measure from this analysis. With an overall average of (2) and averages ranging from (1) to (3.3) for each measure, the majority of the respondents assessed the implemented emergency measures as rather effective. Among the three study areas the measures implemented by households in Osnabrück were evaluated the most effective. When comparing the different measures, the ones that do not require special knowledge such as safeguarding documents and valuables or putting movable content upstairs are evaluated as more effectively compared to technical measures such as redirecting the water on the property or protecting the building from inflowing water. It is assumed that these differences are also related to the fact that the proper implementation of more elaborate emergency measures was constrained by short lead times in most cases.

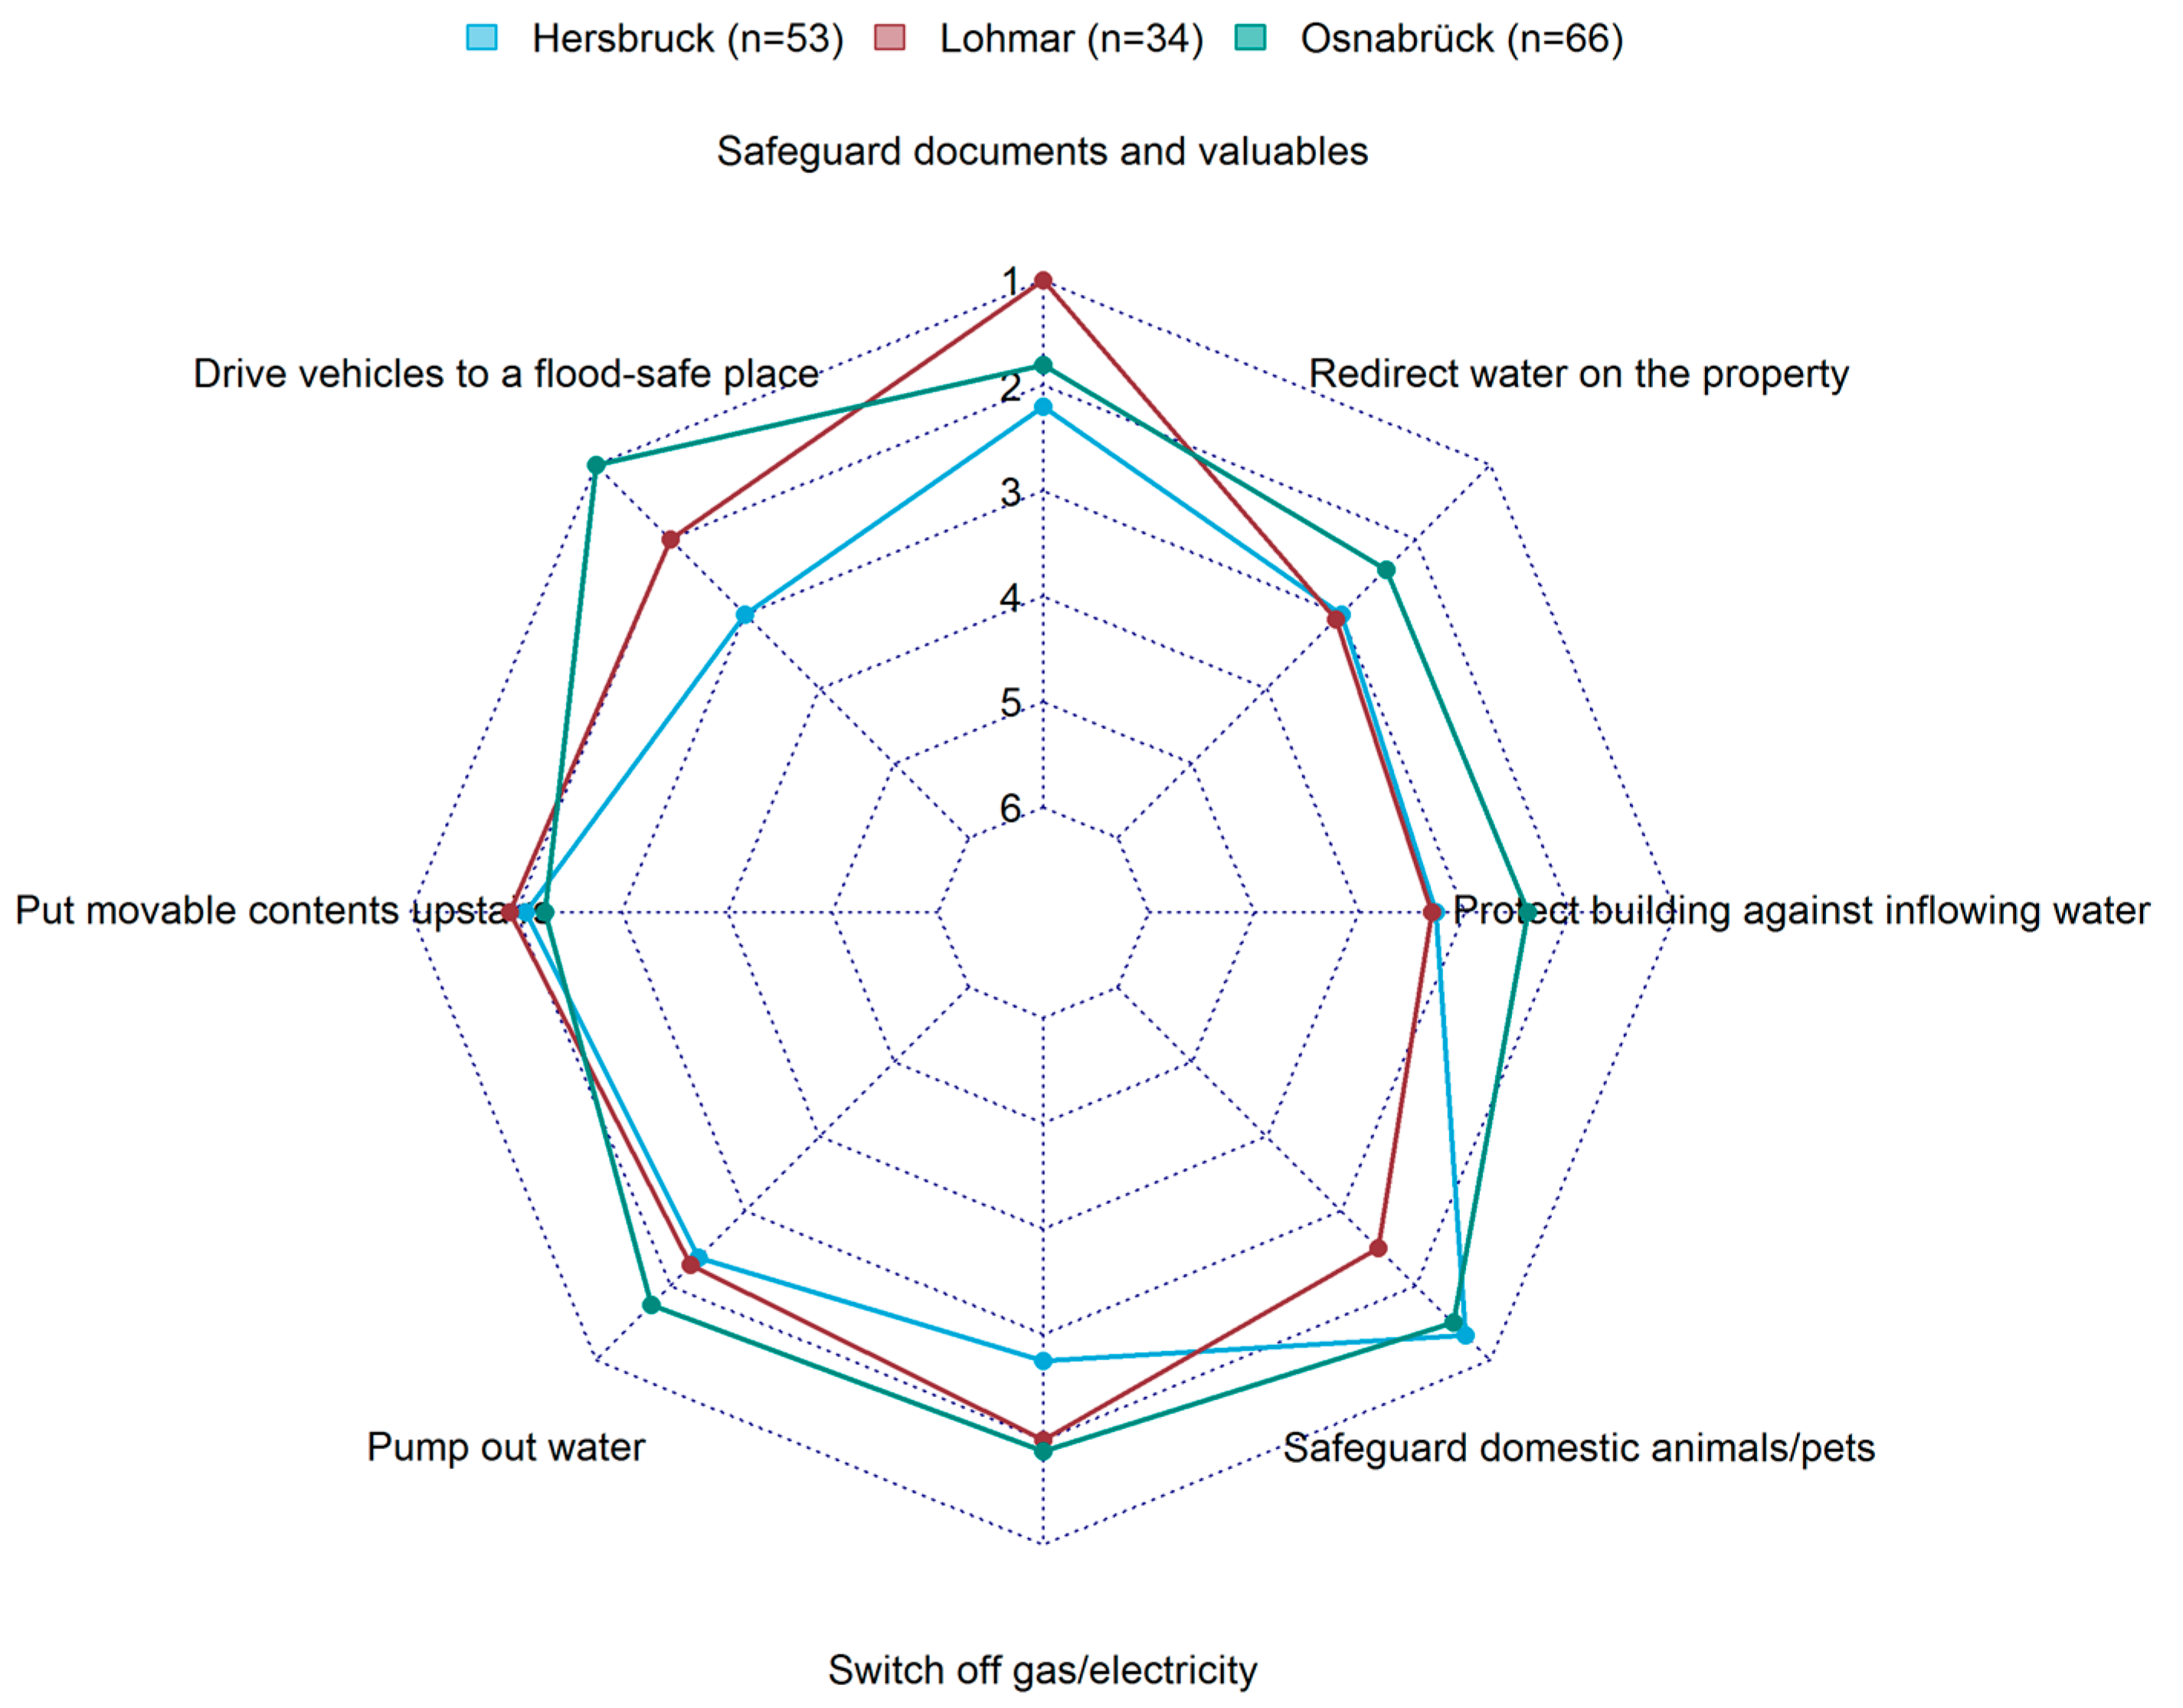
4.2.3. Response to Warning

In the case a household did not receive a warning at all, the lead time drops to zero making the proper implementation of emergency measures particularly difficult to almost impossible. In order to analyze if receiving an early warning (regardless of the lead time) influences the implementation of emergency measures, the fractions of respondents implementing at least one emergency measure were compared between groups who did or did not have received a warning prior to the respective flood event (see Table 4). A Chi-squared test between the proportions of all three study areas showed on a 0.05 significance level that significantly more households implemented at least one emergency measure when they had received an early warning. Looking at each event separately, one can see that for all three subsets the proportion of households who implemented at least one emergency measure is larger when a warning was received, compared to the group that did not receive a warning (Table 4). However, a significant influence on a 0.05 confidence level of receiving a warning on the implementation of emergency measures could only be confirmed for the Hersbruck subset. This indicates that not only the receipt of a warning is important for implementing emergency measures, but other factors such as the information provided in the warning, the flood experience and the capability of the respondent to implement measures are also important. Furthermore, the uncertainty that comes with severe weather warnings and forecasts in general, is often difficult to assess for private households and local authorities alike. Unlike fluvial floods, no clear thresholds are defined, when emergency services start implementing damage mitigation measures [53,54].
In summary, the dissemination of the issued official early warnings was low in all three subsets, leading to short lead times for emergency response in most cases. Although in Osnabrück more people received a warning and implemented emergency measures than in the other two subsets, a significant influence of early warning on the implementation of emergency measures was not found for this subset. This shows that receiving an early warning is only a first step in pluvial flood damage mitigation. Therefore improving “(pluvial) flood intelligence” [55], meaning the ability to properly respond to a warning, is equally important to improving the dissemination of early warnings in order to reduce future pluvial flood losses.

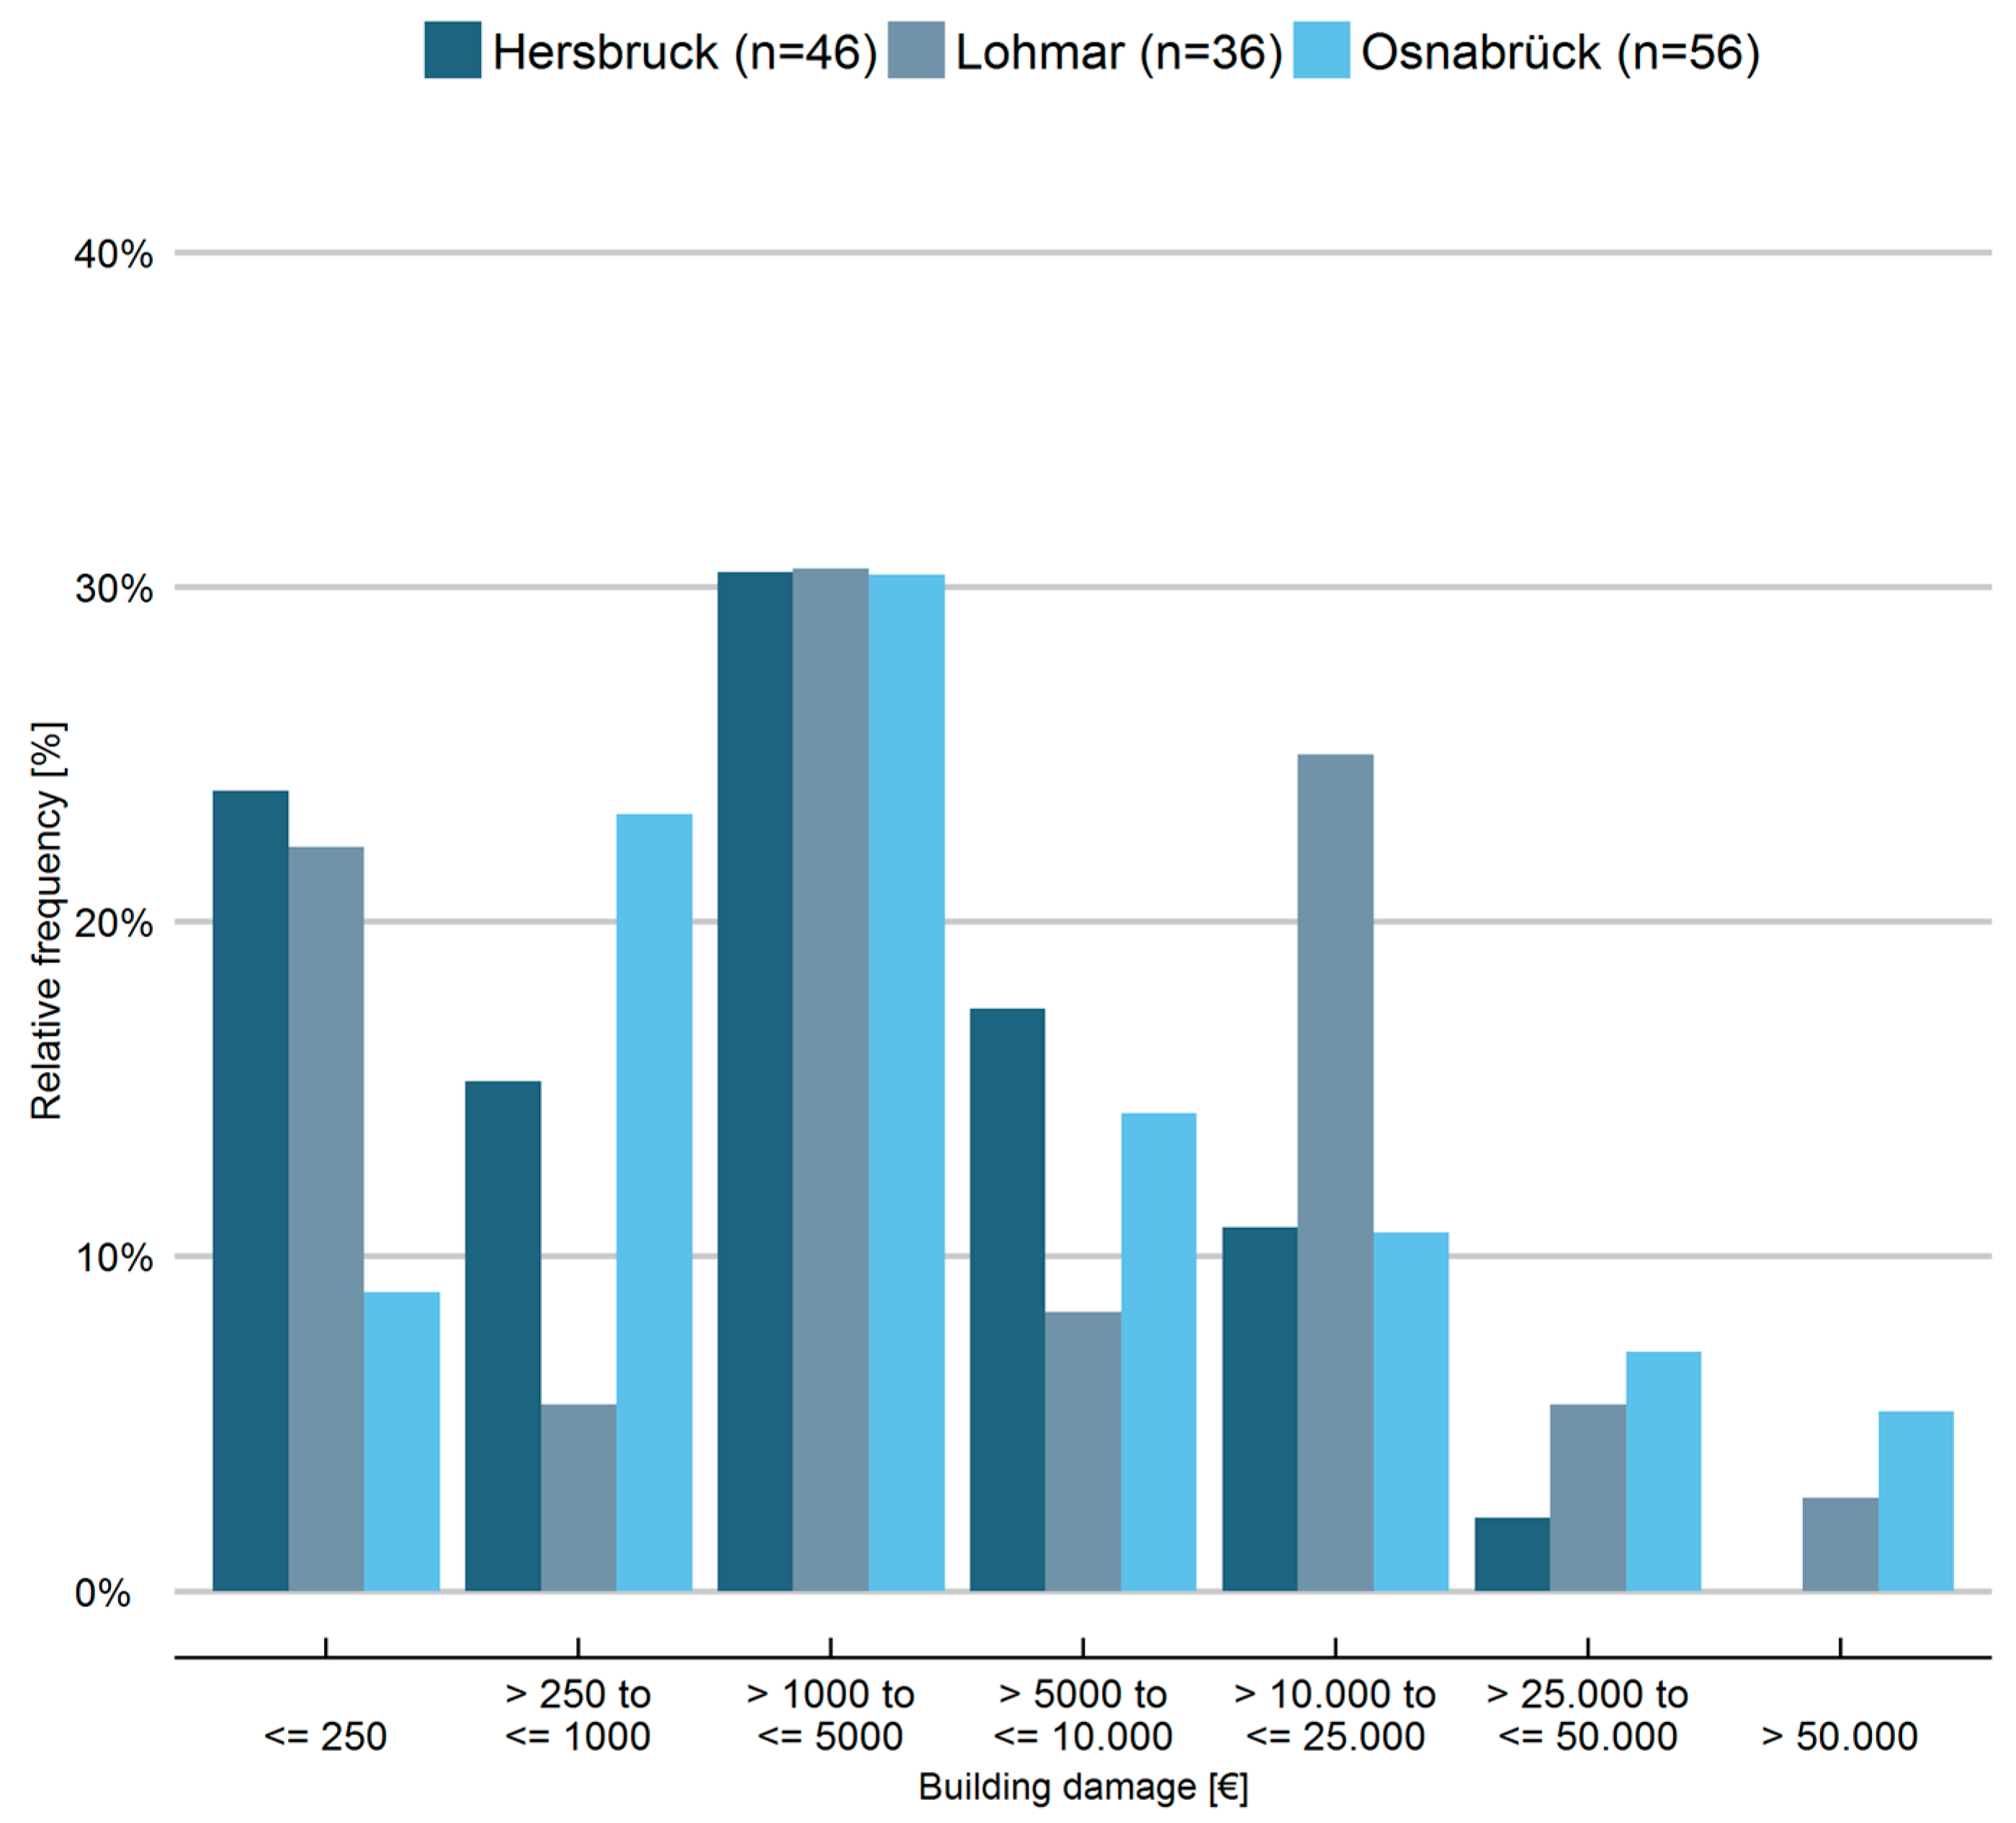
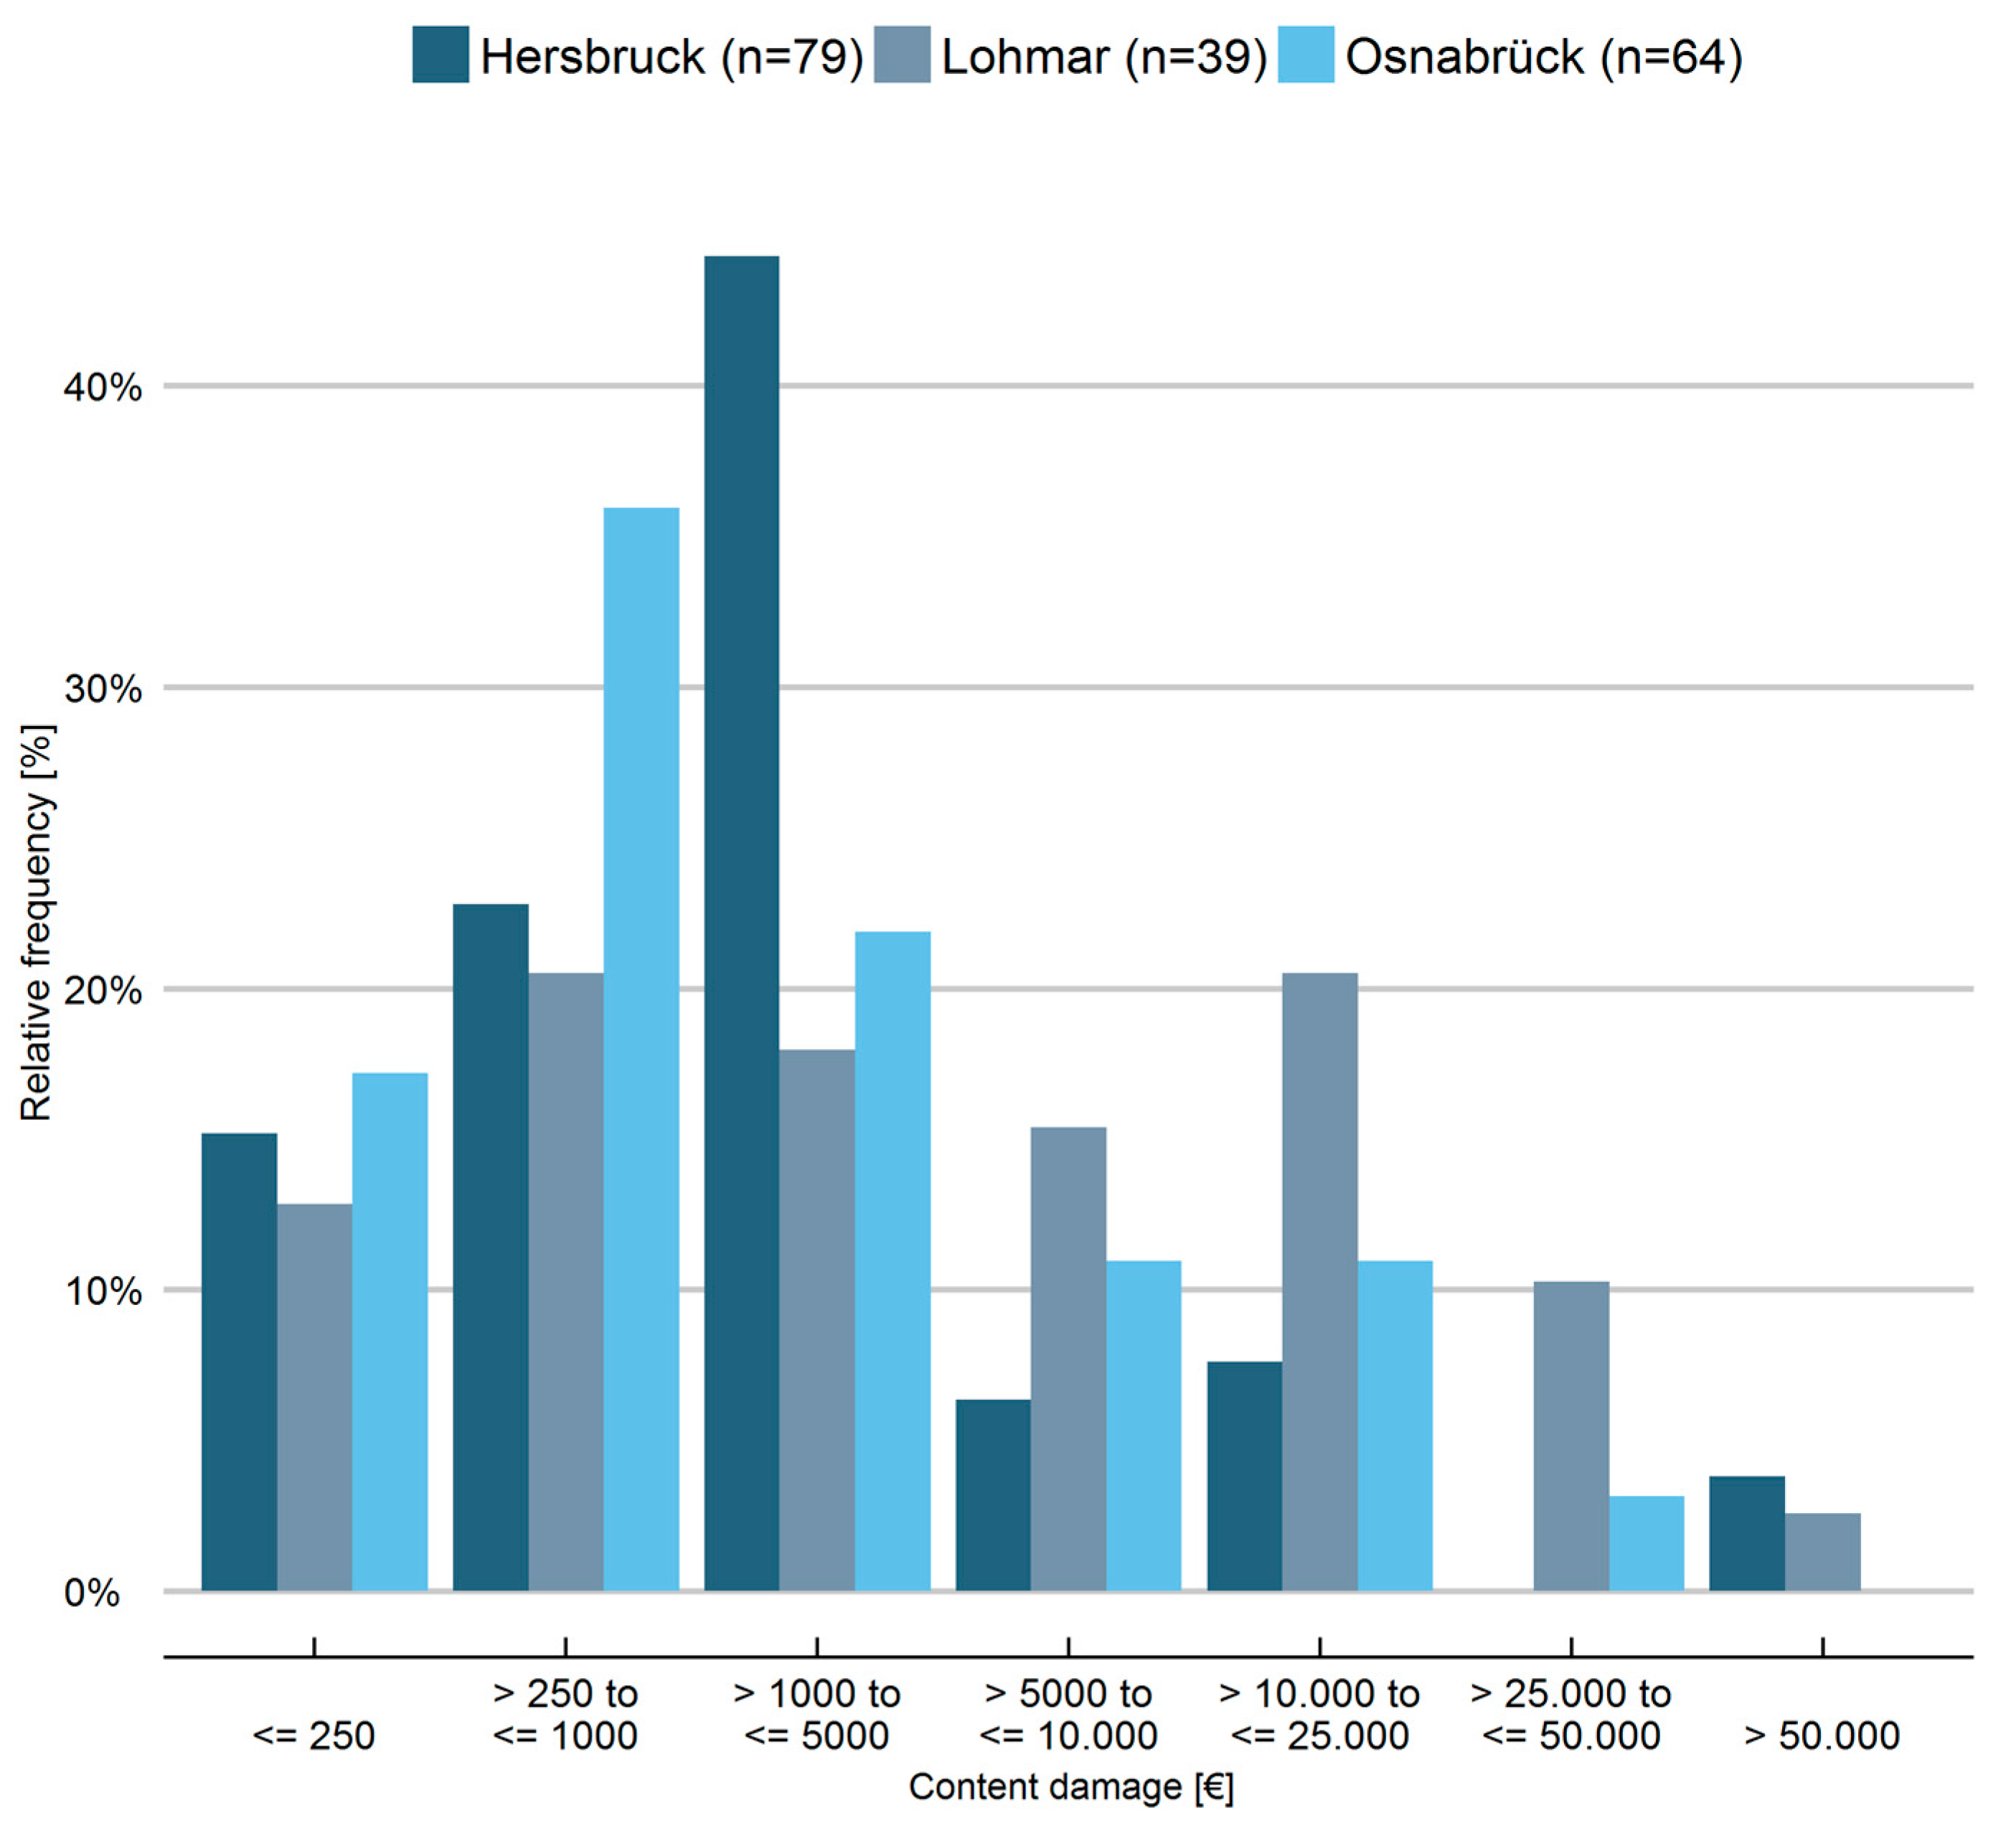
4.3. Flood Impact Characteristics and Resulting Damage

Due to the high concentration of people and assets in urban areas, the potential damage caused by pluvial floods can be particularly high. Adverse effects caused by floods range from direct economic damage, when valuables get directly in contact with water to negative long-term health effects, such as trauma. Therefore flood damage is often categorized in direct and indirect damage as well tangible and intangible damage. First introduced by Parker and Green [56] this scheme is frequently used in literature as a basis to classify different types of damage (e.g., [57,58]). This study focuses on the direct tangible damage to private households in terms of replacement values for building structure and contents. Respondents were only considered as “damage cases”, when they reported monetary damage. For cases, were reported damage was only minor (e.g., “repainting the basement wall”) and respondents were not able to quantify the damage, a flat-rate damage of EUR 250 was assumed.
Among the three subsets, 51% of the respondents reported damage to their residential building and 67% reported damage to contents. With 41% building damage and 71% content damage, the Hersbruck subset has the lowest fraction of respondents with building damage, but the highest fraction of respondents reporting content damage. The difference compared to the two other, for that matter, very similar datasets, is probably caused by the considerably lower homeowner rate in the Hersbruck subset (see Table 1). While homeowners are responsible for damage to their building as well as the contents, tenants can only be affected by content damage. However, in all three subsets the number of households reporting content damage is higher than the number of households reporting building damage. Compared to a similar study by Kienzler et al. [34] on fluvial floods, a clear difference in damage characteristics between pluvial and fluvial floods can be observed. While more people suffered from building damage, than from content damage, in all five fluvial flood case studies analyzed by Kienzler et al. [34], the numbers on pluvial floods just show the opposite. It can be assumed, that lower water levels during pluvial floods are not so harmful to building structures. Additionally, a lower preparedness in terms of adapted (basement) use in the case of pluvial floods, may lead to more damage to contents.
Table 5 shows the mean and median damage to building and contents for each event. To make the damage of the 2005 subsets comparable to the 2010 subset, the reported building and content damage for each household were corrected by the building price index and the consumer price index for consumer products excluding food for the year 2010, respectively [59,60]. When comparing the mean and median damage for each event, as well as for contents and building damage, one can see that in all cases the mean values are higher than the median, indicating a positive skew of the damage distributions with higher damage frequencies on the lower range of the damage spectrum (Figure 7 and Figure 8). The strongest difference between mean and median damage of EUR 12,322 can be found for building damage in Osnabrück (Table 5). This is partly caused by an overall shift of the damage distribution towards higher damage (see Figure 7), but mainly the effect of a few outliers with building damage over EUR 100,000. This can also be seen by comparing the corrected median building damage values for Lohmar and Osnabrück. Although the corrected mean building damage value for Osnabrück is almost twice as high as for Lohmar, the corrected median values are almost equal. Looking at the corrected average contents and building damage for each event separately, the results show, that average building damage in Osnabrück were high, while the average content damage is the lowest of the three subsets. Although Hersbruck and Osnabrück had similar hazard characteristics in terms of water levels and flow velocities (Table 1), the average building damage in Hersbruck was considerably lower, while the average content damage was slightly higher than in Osnabrück. Several factors, such as flood duration, contamination of the storm water, precaution, early warning and emergency response and flood experience have to be taken into account to explain these differences. However, content damage was lower in study areas where preparedness was higher, more households had flood experience, and received early warnings and/or implemented emergency measures. When comparing the three different subsets it can also be observed, that building damage seems to depend stronger on hazard characteristics such as flood duration, flow velocity or contamination of the flood water and is therefore more difficult to mitigate by non-structural precautionary measures and emergency measures.

4.4. Recovery

As far as the physical flood damage is concerned, results show that a large share of the respondents have fully recovered from flood damage at the time of the interview. Fifty-nine percent of the respondents in Osnabrück, 64% in Hersbruck and 57% in Lohmar reported that damage to their building was fully repaired about 17 to 18 months after the flood. Another 20% in Osnabrück (14% and 16% in Hersbruck and Lohmar, respectively) indicated the second best answer category on a six-point answering scale. Only 2% of the respondents in Osnabrück and Hersbruck stated that their building still showed considerable deficits, while this answer category was not chosen by households in Lohmar. Very similar findings are reported by Kienzler et al. [34], who find that 77% of respondents affected by fluvial flooding stated a very good or good building status 13 to 18 months after the event. As far as the damage to contents is concerned, physical recovery appears to be somewhat slower. Here, only 35% of the households in Osnabrück, 49% in Hersbruck and 40% in Lohmar reported that their damaged contents were fully replaced. The second best answer category was chosen by another 12% in Osnabrück, 9% in Hersbruck and 17% in Lohmar. In line with the findings for building damage, only a minor share of 2% to 7% of the respondents reported that their contents still showed considerable deficits. Findings are again in line with Kienzler et al. [34], who also report a slower physical recovery for contents compared with the building status for people affected by fluvial flooding. In addition, respondents were also asked whether they received financial compensation. Results show that only 21% of respondents in Osnabrück received financial compensation for the damage they had suffered. Slightly lower values were found for Hersbruck (13.5%) and Lohmar (13%). Two to ten percent of the respondents chose the “don’t know/no answer” category and the rest did not receive compensation. Those who received compensation reported a mean value of EUR 7021 (standard deviation: EUR 10,868; median: EUR 2000) in Osnabrück and a similar mean value of EUR 7700 in Lohmar (standard deviation: EUR 7852; median: EUR 5500). In Hersbruck, mean compensation is significantly higher with EUR 25,595 (standard deviation: EUR 73,923; median: EUR 3525). However, it has to be noted that this higher mean is caused by an outlier that reported a compensation of EUR 260,000. Moreover, it should be taken into account that the number of observations is very low for this specific aspect, ranging from eight in Lohmar, 15 in Hersbruck to 21 in Osnabrück and findings thus need to be carefully interpreted. The large majority of the respondents in Osnabrück (19 out of 21) received financial compensation from their insurer. Only three respondents indicated that they had received financial support from the flood relief fund of the government (“Soforthilfe”). For Hersbruck and Lohmar, this information is not available. The results furthermore show that the few respondents who received compensation evaluated the damage-compensation process mostly positively, with 57% and 14% choosing the best and second best out of five answer categories in Osnabrück. This indicates that insurance can be an effective mean to cover damage caused by heavy rain events. In Hersbruck and Lohmar, satisfaction with the compensation process was somewhat lower with 33% and 37% choosing the highest answer category, respectively. Contrary, 9.5% of the households in Osnabrück indicated the two lowest answer categories. The share of the respondents that is not satisfied with the compensation process—indicated by the two lowest answer categories—is considerably higher in Hersbruck and Lohmar with 27% and 37%, respectively. However, these findings should again be carefully interpreted given the low number of observations for this aspect.
In the present paper, recovery exclusively referred to the replacement and repairs of physical flood damage. It should be noted, though, that this is merely one aspect of recovery. In addition, floods can also have a large and more long-term impact on the psychological well-being of those affected [61], which needs be accounted for in policies and measures that aim at supporting the recovery process of disaster stricken areas.

5. Conclusions

Pluvial floods are often described as the “invisible hazard”, since they may occur everywhere [46]. The majority of private households in all three study areas were not aware of the pluvial flood risk. The preparedness level of affected households improved considerably in the three study areas after the flood. However, raising awareness for pluvial floods remains challenging and, so far, risk management strategies in the three study areas and elsewhere are mainly focused on fluvial floods. This was particularly observed in the Hersbruck study area, where smaller previous pluvial and fluvial flood events in other parts of the city and the availability of flood maps did not seem to have an effect on the preparedness before the 2005 pluvial flood event. Thus, future risk communication and management strategies should take into account that the preparedness of private households for pluvial floods is low in most areas. The majority of households who either have experienced a flood before or had knowledge about the flood hazard see precautionary measures as an effective way to reduce pluvial flood damage. However, only very few were willing to invest in expensive building retro-fitting. Apparently, the different hazard characteristics of pluvial floods compared to fluvial floods lead to a shift in private damage mitigation strategies from costly and elaborate private precautionary measures to an effective emergency response. By comparing the pluvial flood damage in all three study areas, it seems that especially for content damage, preparedness and the implementation of emergency measures in particular, play important roles in damage mitigation. In Osnabrück, for instance, a considerably higher fraction of households received an early warning and successfully implemented emergency measures. This led to the lowest average content damage even though flood characteristics were the most severe in all of the three subsets. In line with the results by Van Ootegem et al. [13], it can be concluded that receiving an early warning in time and knowing how to respond to this warning can effectively reduce damage caused by pluvial floods. While in all three study areas severe weather warnings with lead times of several hours were released, only a minority of households actually received the warning. Thus, not only a higher awareness and preparedness through adequate risk communication is needed, but also improved early warning systems. This includes a location specific warning, a warning chain with clear thresholds and information on suitable emergency measures, as well as an effective dissemination. The latter is constantly improved by including various media channels such as SMS, social media platforms, smartphone applications and improved websites.
The comparison between the three case studies revealed that damage caused by pluvial floods is the result of complex interactions between hazard characteristics, precaution, warning, emergency response and other influencing factors. Therefore, further research and pluvial flood damage models are needed to better understand the damaging processes as well as to improve risk analyses.

Acknowledgments

The research presented in this paper was mainly conducted under the framework of the project “EVUS—Real-Time Prediction of Pluvial Floods and Induced Water Contamination in Urban Areas” (BMBF, 03G0846B). The telephone interviews after the pluvial floods in Lohmar and Hersbruck in 2005 were undertaken within the project “URBAS—urban flash floods”; we thank the German Ministry of Education and Research (BMBF; 0330701C) for financial support. The telephone interviews after the pluvial flood in Osnabrück in 2010 were funded by the University of Potsdam, the German Research Centre for Geosciences GFZ, and the Deutsche Rückversicherung AG.

Author Contributions

Viktor Rözer analyzed the data for Section 3.2 to Section 4.3, interpreted the results, generated all figures and tables in this paper, wrote Section 3.2 to Section 4.3 and Section 5 and was responsible for writing the paper; Meike Müller and Oliver Buchholz designed and conducted the survey of flood-affected households in Hersbruck and Lohmar; Meike Müller wrote Section 2.1 and Section 2.2; Annegret Thieken, Heidi Kreibich and Meike Müller designed and conducted the survey of flood-affected households in Osnabrück; Heidi Kreibich wrote Section 1, contributed to Section 5 and contributed to the interpretation of the results; Annegret Thieken wrote Section 2.3; Philip Bubeck performed all analysis in Section 4.4, as well as wrote Section 4.4; Sarah Kienzler wrote Section 3.1; Kai Schröter contributed to Section 1 and Section 5 and contributed to the interpretation of the results; and Ina Pech prepared the survey data used in this analysis and contributed to Section 3.1.

Conflicts of Interest

The authors declare no conflict of interest.

References

  1. Coulthard, T.; Frostick, L. The hull floods of 2007: Implications for the governance and management of urban drainage systems. J. Flood Risk Manag. 2010, 3, 223–231. [Google Scholar] [CrossRef]
  2. Grünewald, U. Gutachten zu Entstehung und Verlauf des extremen Niederschlag-Abfluss-Ereignisses am 26.07.2008 im Stadtgebiet von Dortmund. 2009. Available online: http://www.gruene-luedo.de/download/gutachten_neu.pdf (accessed on 31 May 2016).
  3. Kundzewicz, Z.W.; Kanae, S.; Seneviratne, S.I.; Handmer, J.; Nicholls, N.; Peduzzi, P.; Mechler, R.; Bouwer, L.M.; Arnell, N.; Mach, K. Flood risk and climate change: Global and regional perspectives. Hydrol. Sci. J. 2014, 59, 1–28. [Google Scholar] [CrossRef]
  4. Semadeni-Davies, A.; Hernebring, C.; Svensson, G.; Gustafsson, L.-G. The impacts of climate change and urbanisation on drainage in Helsingborg, Sweden: Combined sewer system. J. Hydrol. 2008, 350, 100–113. [Google Scholar] [CrossRef]
  5. Kaspersen, P.S.; Høegh Ravn, N.; Arnbjerg-Nielsen, K.; Madsen, H.; Drews, M. Influence of urban land cover changes and climate change for the exposure of european cities to flooding during high-intensity precipitation. Proc. Int. Assoc. Hydrol. Sci. (IAHS) 2015, 370, 21–27. [Google Scholar]
  6. Kreibich, H.; van den Bergh, J.C.; Bouwer, L.M.; Bubeck, P.; Ciavola, P.; Green, C.; Hallegatte, S.; Logar, I.; Meyer, V.; Schwarze, R. Costing natural hazards. Nat. Clim. Chang. 2014, 4, 303–306. [Google Scholar] [CrossRef]
  7. Sušnik, J.; Strehl, C.; Postmes, L.A.; Vamvakeridou-Lyroudia, L.S.; Mälzer, H.-J.; Savić, D.A.; Kapelan, Z. Assessing financial loss due to pluvial flooding and the efficacy of risk-reduction measures in the residential property sector. Water Resour. Manag. 2015, 29, 161–179. [Google Scholar] [CrossRef] [Green Version]
  8. German Committee for Disaster Prevention (DKKV). Das Hochwasser im Juni 2013–Bewährungsprobe für das Hochwasserrisikomanagement in Deutschland; DKKV Schriftreihe 53: Berlin, Germany, 2015; p. 207. [Google Scholar]
  9. Zhou, Q.; Mikkelsen, P.S.; Halsnæs, K.; Arnbjerg-Nielsen, K. Framework for economic pluvial flood risk assessment considering climate change effects and adaptation benefits. J. Hydrol. 2012, 414, 539–549. [Google Scholar] [CrossRef]
  10. Hammond, M.J.; Chen, A.S.; Djordjević, S.; Butler, D.; Mark, O. Urban flood impact assessment: A state-of-the-art review. Urban Water J. 2015, 12, 14–29. [Google Scholar] [CrossRef]
  11. Penning-Rowsell, E.C. The Benefits of Flood and Coastal Risk Management: A Handbook of Assessment Techniques 2010; Flood Hazard Research Centre: London, UK, 2010. [Google Scholar]
  12. Douglas, I.; Garvin, S.; Lawson, N.; Richards, J.; Tippett, J.; White, I. Urban pluvial flooding: A qualitative case study of cause, effect and nonstructural mitigation. J. Flood Risk Manag. 2010, 3, 112–125. [Google Scholar] [CrossRef]
  13. Van Ootegem, L.; Verhofstadt, E.; Van Herck, K.; Creten, T. Multivariate pluvial flood damage models. Environ. Impact Assess. Rev. 2015, 54, 91–100. [Google Scholar] [CrossRef]
  14. Henonin, J.; Russo, B.; Mark, O.; Gourbesville, P. Real-time urban flood forecasting and modelling—A state of the art. J. Hydroinform. 2013, 15, 717–736. [Google Scholar] [CrossRef]
  15. Leitão, J.; Simões, N.; Maksimović, Č.; Ferreira, F.; Prodanović, D.; Matos, J.; Marques, A.S. Real-time forecasting urban drainage models: Full or simplified networks? Water Sci. Technol. 2010, 62, 2106–2114. [Google Scholar] [CrossRef] [PubMed]
  16. Parker, D.J.; Priest, S.J.; McCarthy, S. Surface water flood warnings requirements and potential in England and Wales. Appl. Geogr. 2011, 31, 891–900. [Google Scholar] [CrossRef]
  17. Deshons, P. Urban flood forecast adn monitoring—Experience of Marseille city. Houille Blanche 2002, 2, 56–59. [Google Scholar] [CrossRef]
  18. Ochoa-Rodríguez, S.; Wang, L.-P.; Thraves, L.; Johnston, A.; Onof, C. Surface Water Flood Warnings in England: Overview, Assessment and Recommendations Based on Survey Responses and Workshops. J. Flood Risk Manag. 2015. Available online: http://onlinelibrary.wiley.com/doi/10.1111/jfr3.12195/abstract (accessed on 7 July 2016).
  19. German Weather Service. Die Wetterwarnungen des Deutschen Wetterdienstes—Amtlich, Zuverlässig und aus Einer Hand; Deutscher Wetterdienst (DWD): Offenbach, Germany, 2016. [Google Scholar]
  20. German Weather Service. Konvektive Entwicklung (KONRAD). Available online: http://www.dwd.de/DE/forschung/wettervorhersage/met_fachverfahren/nowcasting/konrad_node.html (accessed on 31 May 2016).
  21. Penning-Rowsell, E.; Green, C. New insights into the appraisal of flood-alleviation benefits: (1) flood damage and flood loss information. Water Environ. J. 2000, 14, 347–353. [Google Scholar] [CrossRef]
  22. Kreibich, H.; Merz, B. Lessons learned from the Elbe river floods in August 2002-with a special focus on flood warning. In Extreme Hydrological Events: New Concepts for Security; Springer: New York, NY, USA, 2007; pp. 69–80. [Google Scholar]
  23. Thieken, A.H.; Kreibich, H.; Müller, M.; Merz, B. Coping with floods: Preparedness, response and recovery of flood-affected residents in Germany in 2002. Hydrol. Sci. J. 2007, 52, 1016–1037. [Google Scholar] [CrossRef]
  24. Kreibich, H.; Müller, M.; Thieken, A.H.; Merz, B. Flood precaution of companies and their ability to cope with the flood in August 2002 in Saxony, Germany. Water Resour. Res. 2007, 43, W03408. [Google Scholar] [CrossRef]
  25. Spekkers, M.; Kok, M.; Clemens, F.; Ten Veldhuis, J. Decision-tree analysis of factors influencing rainfall-related building structure and content damage. Nat. Hazards Earth Syst. Sci. 2014, 14, 2531–2547. [Google Scholar] [CrossRef]
  26. URBAS. Fallstudien und Untersuchungsschwerpunkte Hamburg bis Lohmar; BMBF: Aachen, Germany, 2008; Available online: http://www.urbanesturzfluten.de/schlussbericht/fallstudien%20Hamburg%20bis%20Lohmar/download (accessed on 31 May 2016).
  27. City of Lohmar. Stadtporträt—25 Jahre Stadt Lohmar. Available online: http://www.lohmar.de/stadtportraet/25-jahre-stadt-lohmar/ (accessed on 7 July 2016).
  28. Booß, A.; Lefebvre, C.; Löpmeier, G.; Müller-Westermeier, S.; Pietzsch, S.; Riecke, W.; Schmittd, H.-H. Die Witterung in Deutschland 2010; DWD: Offenbach, Germany, 2011; pp. 7–36. [Google Scholar]
  29. Lower Saxon State Department for Waterway, Coastal and Nature Conservation (NLWKN). Gewässerkundlicher Monatsbericht August 2010; NLWKN: Norden, Germany, 2010. [Google Scholar]
  30. Schubert, S.; Wang, H.; Suarez, M. Warm season subseasonal variability and climate extremes in the northern hemisphere: The role of stationary rossby waves. J. Clim. 2011, 24, 4773–4792. [Google Scholar] [CrossRef]
  31. Coumou, D.; Rahmstorf, S. A decade of weather extremes. Nat. Clim. Chang. 2012, 2, 491–496. [Google Scholar] [CrossRef]
  32. German Insurance Association (GDV). Naturgefahrenreport 2012—Naturgefahren und Versicherte Schäden in Deutschland—Eine Statistische Übersicht von 1970 bis 2011; Gesamtverband der Deutschen Versicherungswirtschaft e.V.: Berlin, Germany, 2012. [Google Scholar]
  33. City of Osnabrück. Hochwasserschutz in Osnabrück. Available online: http://www.osnabrueck.de/hochwasser.html (accessed on 6 July 2016).
  34. Kienzler, S.; Pech, I.; Kreibich, H.; Müller, M.; Thieken, A. After the extreme flood in 2002: Changes in preparedness, response and recovery of flood-affected residents in germany between 2005 and 2011. Nat. Hazards Earth Syst. Sci. 2015, 15, 505–526. [Google Scholar] [CrossRef]
  35. Kreibich, H.; Thieken, A.H.; Petrow, T.; Müller, M.; Merz, B. Flood loss reduction of private households due to building precautionary measures—Lessons learned from the elbe flood in august 2002. Nat. Hazards Earth Syst. Sci. 2005, 5, 117–126. [Google Scholar] [CrossRef]
  36. Local Newspaper (NOZ). Chronologie: Das War Die Flut in der Region. Neue Osnabrücker Zeitung. Available online: http://www.noz.de/artikel/47234/chronologie-das-war-die-flut-in-der-region#gallery&5281&0&47234 (accessed on 31 May 2016).
  37. Bavarian State Office for Statistics (LfStat). Statistik Kommunal 2014—Stadt Hersbruck; Bayrisches Landesamt für Statistik Munich: Munich, Germany, 2015. [Google Scholar]
  38. City of Lohmar. Bevölkerungsentwicklung—Lohmar. Available online: http://www.lohmar.de/stadtportraet/zahlen-daten-fakten/bevoelkerungs-entwicklung/ (accessed on 31 May 2016).
  39. City of Osnabrück. Statistische Informationen—Stadt Osnabrück Bevölkerungsprognose 2013–2030. Avialiable online: http://www.osnabrueck.de/fileadmin/user_upload/Bevoelkerungsprognose_2013_bis_2030.pdf (accessed on 31 May 2016).
  40. Federal Office of Statistics (DESTATIS). Zensus 2011—Zensusdatenbank. Available online: https://ergebnisse.zensus2011.de/#MapContent:00,D1 (accessed on 31 May 2016).
  41. German Committee for Disaster Prevention (DKKV). Hochwasservorsorge in Deutschland—Lernen aus der Katastrophe 2002 im Elbegebiet; German Committee for Disaster Prevention: Bonn, Germany, 2003. [Google Scholar]
  42. Silver, M.L. International best practices in disaster mitigation and management recommended for Mongolia. In Disaster Management Conference; UNDP, Ed.; Gov. of Mongolia: Ulaanbaatar, Mongolia, 2001; pp. 1–9. [Google Scholar]
  43. Bubeck, P.; Botzen, W.J.; Aerts, J.C. A review of risk perceptions and other factors that influence flood mitigation behavior. Risk Anal. 2012, 32, 1481–1495. [Google Scholar] [CrossRef] [PubMed] [Green Version]
  44. Kreibich, H.; Seifert, I.; Thieken, A.H.; Lindquist, E.; Wagner, K.; Merz, B. Recent changes in flood preparedness of private households and businesses in Germany. Reg. Environ. Chang. 2011, 11, 59–71. [Google Scholar] [CrossRef]
  45. Siegrist, M.; Gutscher, H. Flooding risks: A comparison of lay people’s perceptions and expert’s assessments in Switzerland. Risk Anal. 2006, 26, 971–979. [Google Scholar] [CrossRef] [PubMed]
  46. Houston, D.; Werritty, A.; Bassett, D.; Geddes, A.; Hoolachan, A.; McMillan, M. Pluvial (Rain-Related) Flooding in Urban Areas: The Invisible hazard; University of Dundee: Dundee, UK, 2011. [Google Scholar]
  47. Kreibich, H.; Christenberger, S.; Schwarze, R. Economic motivation of households to undertake private precautionary measures against floods. Nat. Hazards Earth Syst. Sci. 2011, 11, 309–321. [Google Scholar] [CrossRef]
  48. Poussin, J.K.; Botzen, W.W.; Aerts, J.C. Effectiveness of flood damage mitigation measures: Empirical evidence from french flood disasters. Glob. Environ. Chang. 2015, 31, 74–84. [Google Scholar] [CrossRef]
  49. Grothmann, T.; Reusswig, F. People at risk of flooding: Why some residents take precautionary action while others do not. Nat. Hazards 2006, 38, 101–120. [Google Scholar] [CrossRef]
  50. Bubeck, P.; Botzen, W.; Kreibich, H.; Aerts, J. Detailed insights into the influence of flood-coping appraisals on mitigation behaviour. Global Environ. Chang. 2013, 23, 1327–1338. [Google Scholar] [CrossRef]
  51. Maskrey, A. Report on National and Local Capabilities for Early Warning; UN: Geneva, Switzerland, 1997. [Google Scholar]
  52. Molinari, D.; Ballio, F.; Menoni, S. Modelling the benefits of flood emergency management measures in reducing damages: A case study on Sondrio, Italy. Nat. Hazards Earth Syst. Sci. 2013, 13, 1913–1927. [Google Scholar] [CrossRef]
  53. Kox, T.; Gerhold, L.; Ulbrich, U. Perception and use of uncertainty in severe weather warnings by emergency services in Germany. Atmos. Res. 2015, 158, 292–301. [Google Scholar] [CrossRef]
  54. Kox, T.; Thieken, A. How dimensions of risk impact thresholds for protective action against severe weather. Weather Clim. Soc. 2016. under review. [Google Scholar]
  55. Keys, C. Flood planning, flood warnings and flood intelligence: A progress report. In 33rd Annual Conference of the NSW Flood Mitigation Authorities; New South Wales State Emergency Service: Taree, Australia, 1993. [Google Scholar]
  56. Parker, D.J.; Green, C.H. Urban Flood Protection Benefits. A Project Appraisal Guide; Gower Technical: Aldershot, UK, 1987. [Google Scholar]
  57. Jonkman, S.N. Loss of Life Estimation in Flood Risk Assessment; Theory and Applications; TU Delft University of Technology: Delft, The Netherlands, 2007. [Google Scholar]
  58. Merz, B.; Kreibich, H.; Schwarze, R.; Thieken, A. Review article “assessment of economic flood damage”. Nat. Hazards Earth Syst. Sci. 2010, 10, 1697–1724. [Google Scholar] [CrossRef]
  59. Federal Office of Statistics (DESTATIS). Preisindex für Die Bauwirtschaft; Bundesamt für Statistik: Wiesbaden, Germany, 2015. [Google Scholar]
  60. Federal Office of Statistics (DESTATIS). Preise—Verbraucherpreisindizes für Deutschland 2015; Bundesamt für Statistik, Ed.; Bundesamt für Statistik: Wiesbaden, Germany, 2015. [Google Scholar]
  61. Lamond, J.E.; Joseph, R.D.; Proverbs, D.G. An exploration of factors affecting the long term psychological impact and deterioration of mental health in flooded households. Environ. Res. 2015, 140, 325–334. [Google Scholar] [CrossRef] [PubMed]
Figure 1. Spatial distribution of rainfall amount (24 h precipitation radar data), affected streets (purple) and number per interviews per neighborhood (grey bubbles) for the study areas (a) Osnabrück; (b) Lohmar; (c) Hersbruck; (d) location of the study areas and number of completed interviews per study area.
Water 08 00304 g001
Figure 2. Private precautionary measures undertaken by event, time of implementation and costs.
Water 08 00304 g002
Figure 3. Percentage of households that implemented at least one precautionary measure split by flood experience and knowledge about the flood hazard for different cost levels.
Water 08 00304 g003
Figure 4. Perceived effectiveness of private precautionary measures for each of the three subsets on a scale from (1) very effective to (6) very ineffective.
Water 08 00304 g004
Figure 5. Fraction of interviewed households that performed emergency measures shortly before or during the pluvial flood event.
Water 08 00304 g005
Figure 6. Average effectiveness on a scale from (1) “very effective” to (6) “not at all effective”, evaluated by the respondents for each implemented measure. Data are shown for each study area.
Water 08 00304 g006
Figure 7. Distribution of classified building damage by study area based on inflation adjusted values.
Water 08 00304 g007
Figure 8. Distribution of classified content damage by study area based on inflation adjusted values.
Water 08 00304 g008
Table 1. Socio-economic variables and flood characteristics for the three study areas. The values in brackets show the reference values based on data from the census in 2011.
Pluvial Flood Event29 June 200527 August 2010
AreaHersbruckLohmarOsnabrück
Number of Interviews11162100
Number of Affected Households (Estimated)300 [26]250 [26]1100 [36]
Sample Size (%)37259
Total Population (Year of Flooding)12,000 [37]31,000 [38]156,000 [39]
Socio-Economic Variables
Mean Age of Respondents (Years)52 (44 [40])50 (43 [40])55 (42 [40])
Fraction of Respondents with Higher Education (%)23 (25 [40])39 (34 [40])52 (41 [40])
Mean Household Size [Number of People]2.6 (2.2 [40])3.0 (2.4 [40])2.6 (2.0 [40])
Households with Monthly Net Income <€1500 (%)251914
Mean Living Area (m2)106 (99 [40])126 (112 [40])112 (86 [40])
Home Owner (%)61 (54 [40])82 (66 [40])85 (35 [40])
Flood Impact Characteristics
Mean Flood Duration (h)101123
Mean Water Level Relative to Surface Level (cm)−108−138−108
Median Water Level Relative to Surface Level (cm)−136−181−30
Respondents Reported High/Very High Flow Velocities (%)183312
Respondents Reported Only the Basement Being Affected (%)808990
Respondents Reporting Contamination (Sewage, Oil, Gas, Other Chemicals) (%)252434
Table 2. Flood experience and knowledge about the flood hazard among private households in each study area.
Pluvial Flood Event29 June 200527 August 2010
HersbruckLohmarOsnabrück
Flood Experience Prior to The Respective Event
Respondents Who Experienced at Least One Previous Flood (%)261622
Respondents Who Experienced at Least One Previous Flood Less Than 10 Years Ago (%)17311
Respondents Who Have Not Experienced a Flood Prior to the Respective Event (%)738478
Respondents Who Have not Experienced a Previous Flood, But Have Knowledge About the Flood Hazard of Their Property (%)16108
Table 3. Number and fraction of households who received or did not receive an early warning prior to the pluvial flooding event.
Sample AreaHersbruckLohmarOsnabrückTotal
n%n%n%n%
No warning Received8677%4877%5353%18769%
Warning Received2422%1321%4545%8230%
  Severe Weather Warning87%35%1212%238%
  Own Observation1211%915%3131%5219%
  Other Warnings44%12%22%73%
No Information11%12%22%41%
Total111100%62100%100100%273100%
Table 4. Contingency table showing the number of respondents by implemented emergency measures and received warning (EM: emergency measure).
Emergency Measure(s) ImplementedWarning ReceivedTotal by Emergency Measure(s) Implemented
Total *YesNo
Yes5998157
No2789116
Hersbruck *YesNo
Yes173754
No84957
LohmarYesNo
Yes92736
No52126
OsnabrückYesNo
Yes333467
No141933
Note: * Proportions significantly different from each other based on Chi-squared test with 0.05 confidence level.
Table 5. Damage to building and contents in the three study areas.
Flood Eventn% Reporting DamageMean Damage (€)Median Damage (€)Mean corrected Damage for Reference Year 2010 (€)Median Corrected Damage for Reference Year 2010 (€)
Building Damage
Hersbruck4641412115004693 11708 1
Lohmar3658748630008527 13417 1
Osnabrück565615,322300015,322 13000 1
Contents Damage
Hersbruck7971635512006599 21246 2
Lohmar3963912730009477 23115 2
Osnabrück6464468510004685 21000 2
Notes: 1 Damage values were corrected for the year 2010 based on the building price index (“Preisindizes für den Neubau von Wohngebäuden einschl. Umsatzsteuer”) (Reference year 2010: 100 index points; 2005: 87.8 index points) published by Federal Office of Statistics (DESTATIS) [59]; 2 Damage values corrected for the year 2010 based on the consumer price index for consumer products excluding food (“Verbrauchs-und Gebrauchsgüter ohne Nahrungsmittel und ohne normalerweise nicht in der Wohnung gelagerte Güter”) (Reference year 2010: 100 index points; 2005: 96.3 index points) published by DESTATIS [60].

