Article

Water Age Responses to Weather Conditions in a Hyper-Eutrophic Channel Reservoir in Southern China

1
Key Laboratory of Integrated Regulation and Resources Development of Shallow Lakes of Ministry of Education, College of Environment, Hohai University, Nanjing 210098, China
2
Zhejiang Institute of Hydraulics & Estuary, Hangzhou 310020, China
3
Fujian Provincial Investigation, Design & Research Institute of Water Conservancy & Hydropower, Fuzhou 350001, China
4
College of Hydrology and Water Resources, Hohai University, Nanjing 210098, China
5
Desert Research Institution, Las Vegas, NV 89119, USA
6
Changjiang River Scientific Research Institute, Wuhan 430010, China
7
Water Resources Service Center of Jiangsu Province, Nanjing 210098, China
8
Division of Hydrologic Sciences, Desert Research Institute, Las Vegas, NV 89119, USA
*
Author to whom correspondence should be addressed.
Water 2016, 8(9), 372; https://doi.org/10.3390/w8090372
Submission received: 28 June 2016 / Revised: 8 August 2016 / Accepted: 19 August 2016 / Published: 30 August 2016
(This article belongs to the Special Issue Tackling Complex Water Problems in China under Changing Environment)

Abstract

:
Channel reservoirs have the characteristics of both rivers and lakes, in which hydrodynamic conditions and the factors affecting the eutrophication process are complex and highly affected by weather conditions. Water age at any location in the reservoir is used as an indicator for describing the spatial and temporal variations of water exchange and nutrient transport. The hyper-eutrophic Changtan Reservoir (CTR) in Southern China was investigated. Three weather conditions including wet, normal, and dry years were considered for assessing the response of water age by using the coupled watershed model Soil Water Assessment Tool (SWAT) and the three-dimensional hydrodynamic model Environmental Fluid Hydrodynamic Code (EFDC). The results showed that the water age in CTR varied tremendously under different weather conditions. The averaged water ages at the downstream of CTR were 3 d, 60 d, and 110 d, respectively in the three typical wet, normal, and dry years. The highest water ages at the main tributary were >70 d, >100 d, and >200 d, respectively. The spatial distribution of water ages in the tributaries and the reservoir were mainly affected by precipitation. This paper provides useful information on water exchange and transport pathways in channel reservoir, which will be helpful in understanding nutrient dynamics for controlling algal blooms.

1. Introduction

Channel reservoirs, which are different from normal reservoirs, have the characteristics of both rivers and lakes. The water depths and widths of channel reservoirs are often far less than their respective lengths, and their hydrodynamic conditions are complex and highly affected by the inflows. In dry years, due to reduction in inflows caused by less precipitation, water will stay in the reservoir for a longer time to meet a minimum requirement of storage, exhibiting the characteristic of lakes with relatively longer residence time. However, in wet years, the inflow from upstream is very large due to the large rainfall, and the water level in the reservoir is kept at a safe water level for the purpose of flood control, hence the outflows are often equal to the inflows, resulting in a shorter residence time and mimicking the characteristics of rivers. Therefore, the hydrodynamics in a channel reservoir can be highly affected by weather conditions. Previous research also showed that weather conditions (especially precipitation and temperature) have a marked influence on the discharge of a watershed [1,2,3]. In addition, since the inflow into a reservoir is highly associated with the duration and density of precipitation, and other weather factors such as winds, air, temperature, and humidity, it is essential to study the impact of weather conditions on the hydrodynamic process in a channel reservoir [3].
Recently, eutrophication has become one of the most serious environmental problems globally due to an increase in anthropogenic nutrients input [4,5,6]. It is observed even in reservoirs, which could directly affect human lives. Since a channel reservoir has dual properties of lakes and rivers, nutrient runoffs into the reservoir from upstream and local sources should be taken into consideration when studying the eutrophication process. Such studies usually require a large amount of observed data to determine amount and transport pattern of nutrients discharged into a reservoir. However, a long-term observed hydrology, meteorology, and water quality data are often hard to obtain, especially for remote areas. Hence it is necessary to find alternative approaches to supply the input data for hydrodynamic and water quality modeling of channel reservoir. Watershed modeling could provide an effective approach to predict the runoff hydrography which can supplement a shortage of long-term observed data.
When describing the impact of weather conditions on the hydrodynamic and eutrophication processes, it is important to find suitable parameters or timescale to determine the amount of nutrients discharged into a reservoir which can contribute to eutrophication due to their retention time. Many time scales have been introduced to quantify the exchange and transport processes and to assess the assimilative capacity of a water body. These time scales include age, transit time, residence time, turnover time, flushing time, etc. Timescales such as flushing time and mean residence time have often been used to estimate an overall retention time for a water body [4,7]; however, these steady-state approaches do not account for spatial and temporal variations in deep channels. In fact, timescale for a dissolved substance at a given location can be quantified by the use of the concept of water age (WA). The age of a particle of water body constituent is defined to be the time elapsed since the particle left the region, where its age is prescribed to be zero, or particularly, the time elapsed since a water particle is discharged from the headwater of a reservoir. In this study, the age is zero at the headwater of CTR and the age at any given location is representative of the time elapsed for a dissolved substance to be transported from its source to that location.
For decades, the concept of water age was widely used in simulating hydrodynamics and water quality in reservoirs, lakes, rivers, or estuaries under different weather conditions. Wang et al. [8] used the water age in Daliaohe Estuary using a 3D advection-diffusion model, and the impact of the runoff condition was taken into account through a series of numerical experiments. The water age distribution characteristics at the specific locations as responses to the runoff showed that the relationship between the average age at a specific position and the runoff could be expressed by a power function approximately. Xu et al. [9] also used a 3D hydrodynamic and eutrophication model to investigate the pollutant age distribution under different river discharges in the Pamlico River. Shen et al. [10] computed the water age using a 3D hydrodynamic model in Dahuofang Reservoir in China, especially different water layers. In the vertical direction, the age of the surface layers was higher than that of the bottom layers and the age difference between the surface and bottom layers decreased further downstream. Ren et al. [11] applied the water age concept to investigate the water exchange process in a large and densely stratified estuary, namely the Pearl River Estuary. The model was used to determine the WA distributions inside the Pearl River Estuary under various hydrodynamic conditions and it predicted that mean WA values during the dry and wet seasons are approximately 25 and 10 days, respectively. Gong et al. [12] investigated the effect of wind on transport time by using the concept of water age (WA) in the tidal Rappahannock River, a western tributary of the Chesapeake Bay, USA. The effect of wind on transport timescale depends strongly on the competition between the wind and buoyancy forcing, and on the pre-status of the circulation. Water age has several conceptual and practical benefits in evaluating hydrologic effects on environmental factors compared to the commonly used residence time (defined as volume/flow rate). Firstly, water age is calculated for each cell to show the spatial and temporal distribution in the study domain, while residence time only indicates the time taken for a particle to stay in a particular location. Secondly, water age accounts for the dynamic circulation of water within water bodies, whereas calculation of residence time from volumes and discharges assumes instantaneous mixing [13].
In this paper, water age was used as an indicator of flow residence and mixing to quantify the influence of weather conditions on the hydrodynamic and eutrophication processes. The main objectives of this paper are to: (1) develop a coupled modeling approach based on a watershed model and a hydrodynamic model for the hyper-eutrophic Changtan Reservoir in Guangdong Province, Southern China; (2) determine temporal and spatial distributions of water age in this channel reservoir under different weather conditions; and (3) analyze responses of water age to different weather conditions in a channel reservoir, and provide useful suggestions for the best water quality management based on the hydrodynamic process.

2. Methods and Materials
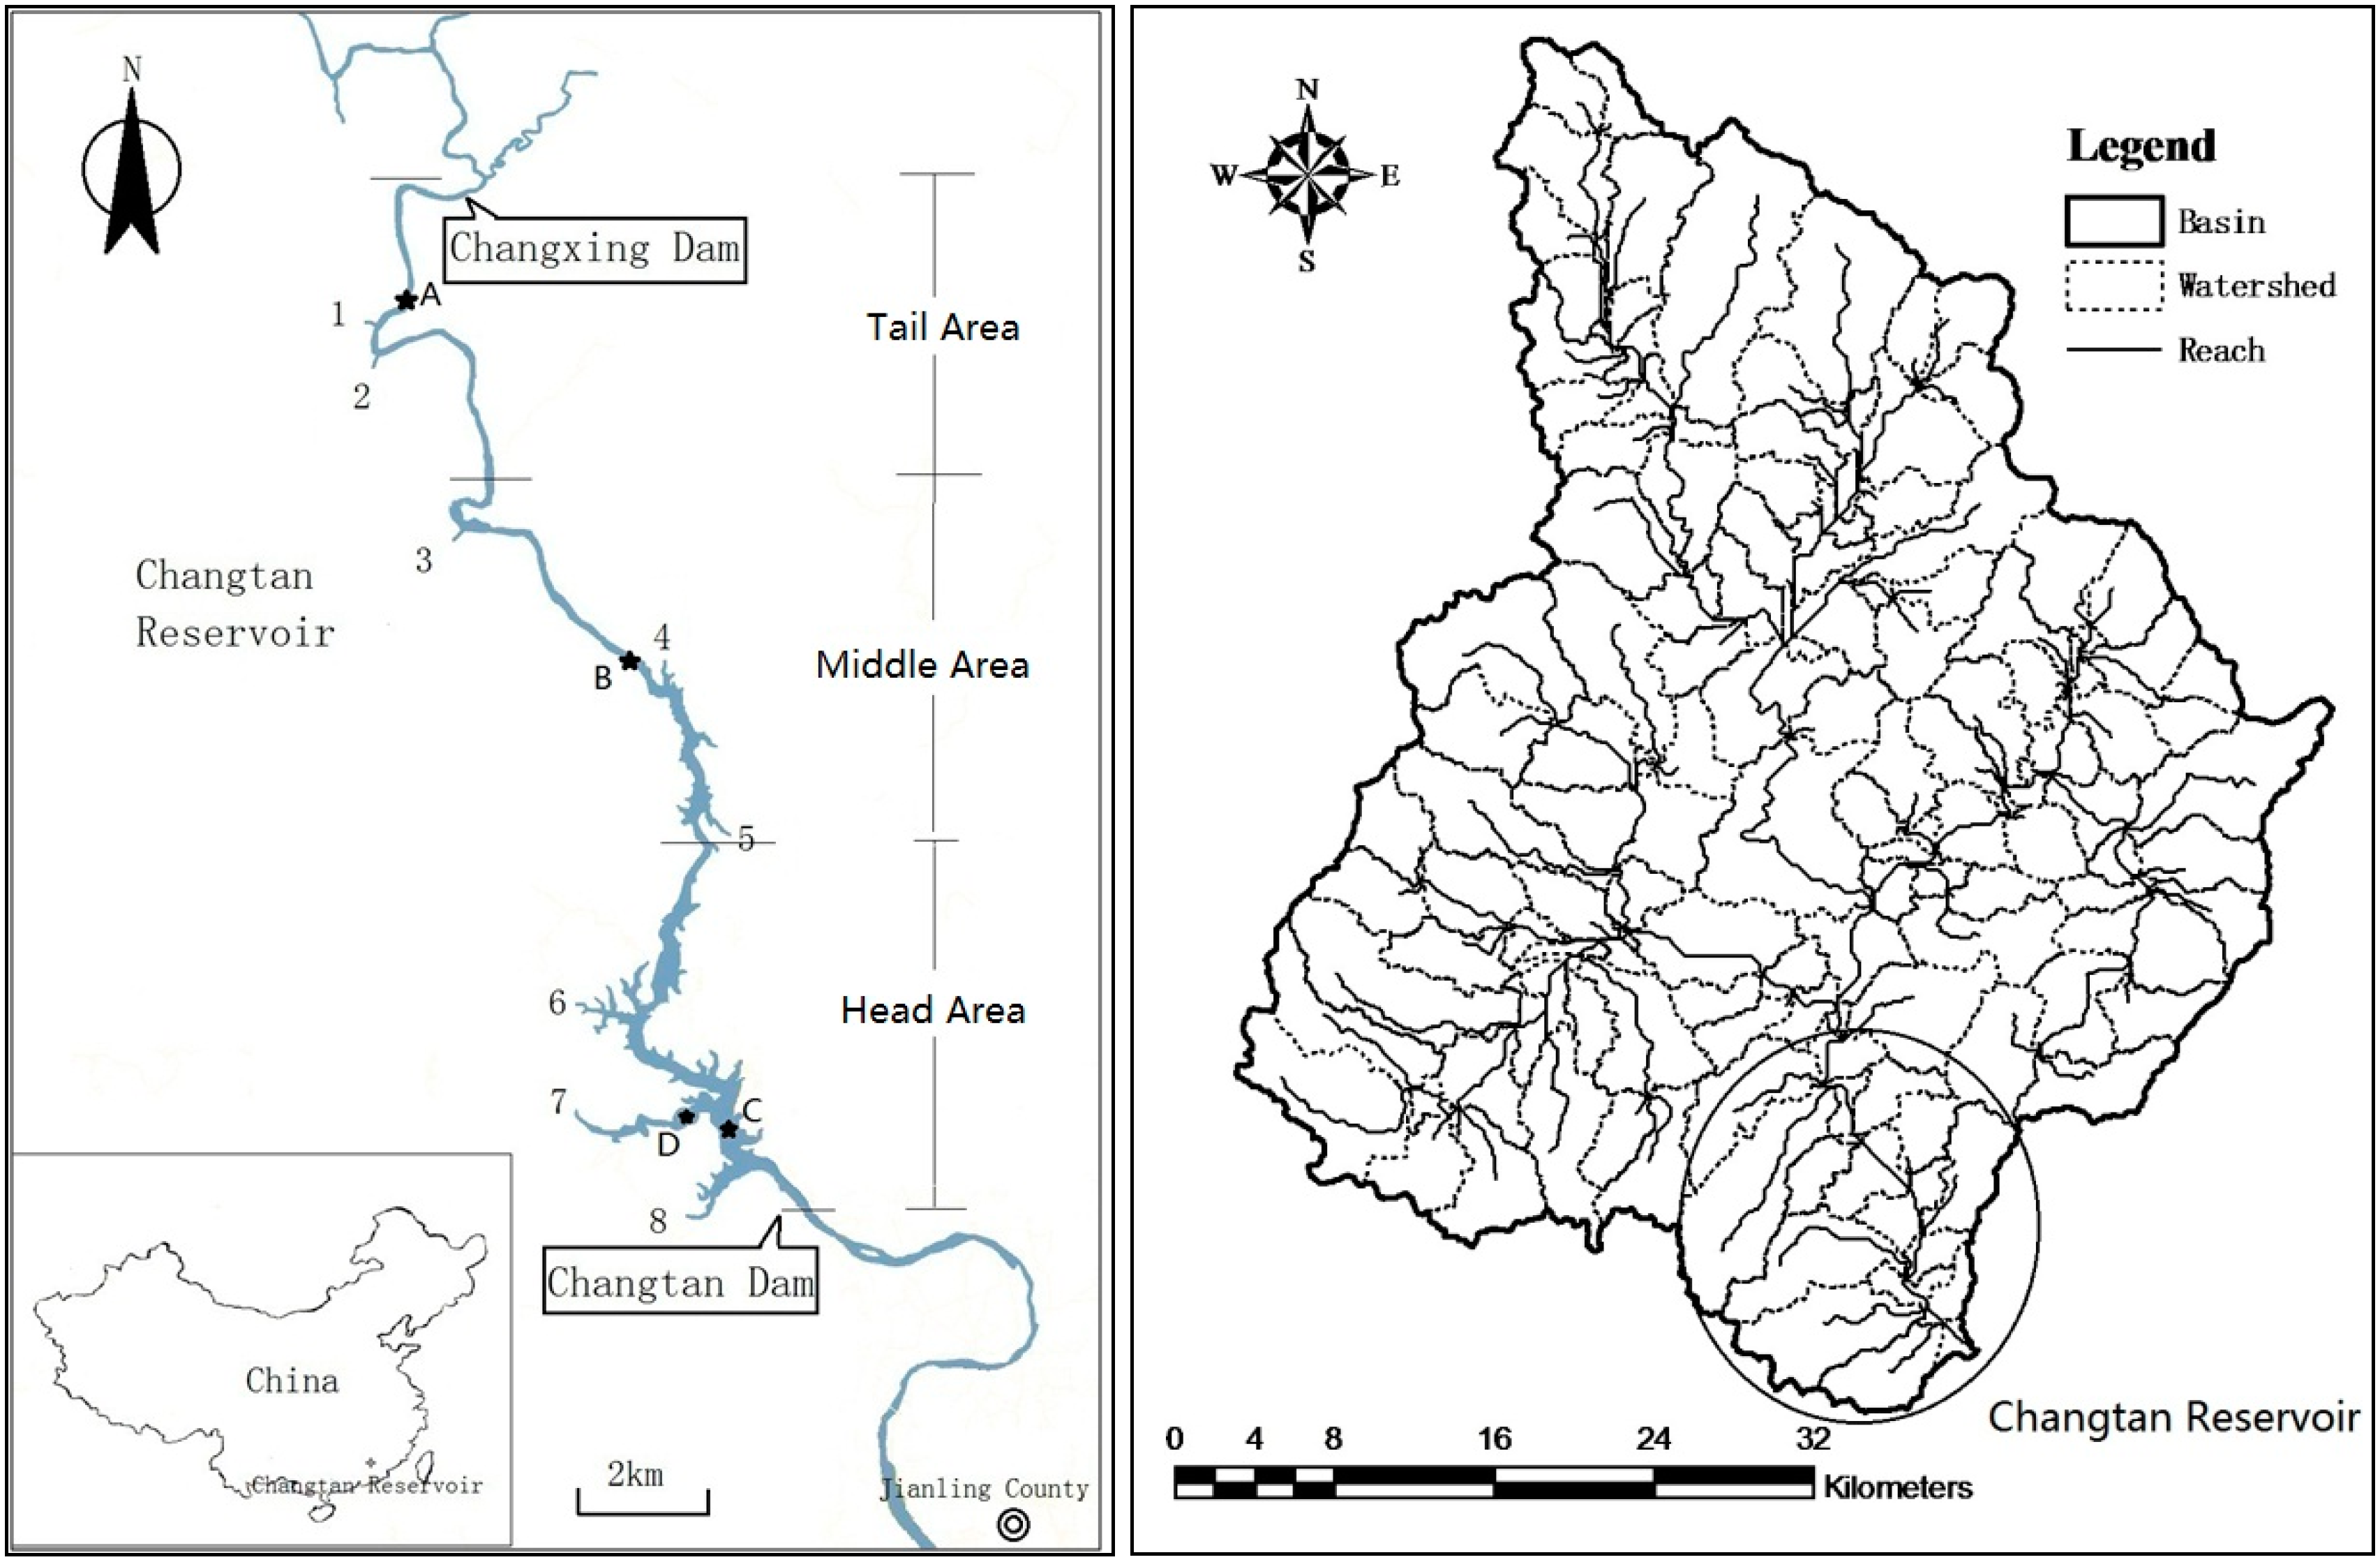
2.1. Study Area

This study area focuses on the Changtan Reservoir (CTR), a typical hyper-eutrophic channel reservoir located in the north valley of Jiaoling County, Guangdong Province in Southern China (Figure 1). The reservoir spans approximately 22.5 km from the Changxin Dam on the upstream (tail area) to the Changtan Dam on the downstream (head area), with a width of 150–300 m. It is the drinking water source for the 240,000 residents of a nearby city with a storage capacity of 114.5 million m3 [14]. The region surrounding the reservoir is a provincial Natural Preserve in the Guangdong Province with many rare wildlife species, where human activities are restricted. In recent years, CTR has become very eutrophic because of excess nutrients entering from the upstream areas. The reservoir saw a serious eutrophication in the summer of 2008 and 2010 [14]. The inflow to the reservoir mainly consists of a main channel and eight tributaries (Figure 1), the main channel originates from the Changxin Dam on the upstream, and eight tributaries are formed by sub-basins on both sides of CTR. The contributing area of CTR is 225.4 km2, while the upstream main channel of the river has a drainage area of 1794.7 km2. The main pollutants, produced by a huge number of cattle breeding industries on the upstream areas, are discharged into CTR along the main channel, resulting in a severe water pollution and algal bloom problem in the reservoir.
CTR has an average surface elevation of 143 m in wet years (annual rainfall > 1600 mm) and 138 m in dry years (annual rainfall < 1125 mm). The mean water depth is 35 m. There are three weather stations in this region and data for this study were collected from these stations. The annual mean rainfall of the region is 1594 mm; the main rainy season extends from April to September, and contributes 70% of the total rainfall in the year. The annual mean surface evaporation, temperature, and wind speed of the region are about 1000 mm, 21.2 °C, and 2.1 m/s respectively. The average discharge from upstream of CTR is 55.08 m3/s.

2.2. Model Description

There is no gauging station available for hydrological data at the tributaries to CTR, therefore a coupled model, however, was built to generate the corresponding information by linking the watershed hydrological model and the reservoir’s hydrodynamic model. Soil Water Assessment Tool (SWAT) and Environmental Fluid Dynamics Code (EFDC) were applied for watershed hydrological simulation and reservoir’s hydrodynamic simulation, respectively. The inflow rates of the eight tributaries, contributing to the reservoir, were simulated by the SWAT model, which were used to generate the missing hydrological data as the input boundary conditions for the hydrodynamic model.

2.2.1. Watershed Model (SWAT)

SWAT model is a public domain model developed by Arnold et al. [15]. It is a river basin, or watershed scale model which can predict the influence of long term climate conditions, varying soils and land use conditions on water, chemical load, and sediment in large complex watersheds [16]. Users should load the land use and soil datasets and determine land/soil/slope class combinations for the delineated watershed(s) and each respective sub-watershed. Hydrologic response units (HRUs) are used to describe spatial heterogeneity in SWAT [17].
The watershed of CTR was delineated by SWAT with a 30 m × 30 m Digital Elevation Model (DEM). The watershed was divided into 141 sub-basins (Figure 1). The land use data and soil data (including the proportions of clay, sand, loam and silt, the wilting point, field capacity, saturation, etc.) of the region were obtained from Global Land Cover Facility (GLCF) and International Soil Reference and Information Centre (ISRIC). The primary land use and soil type in CTR are FRST (Forest-Evergreen) and red earth. Sub-basin parameters such as slope gradient; slope length of the terrain; and the stream network characteristics such as channel slope, length, and width were derived from the DEM [18]. Land use is one of the most important factors that affect runoff; the dominant Hydrologic Response Units (HRUs) for the watershed were created by using land use and soil type maps. In this study, weather variables including daily rainfall, minimum and maximum temperature, wind speed and humidity in different typical reference years (See Figure 2 for relevant information. Note that average temperature was shown instead of minimum and maximum temperature ranges. The starting date in all figures in this paper is 1 January 2010) were used in the hydrologic simulation. The inflow of CTR was therefore simulated by the watershed model and fed into the hydrodynamic model.

2.2.2. Hydrodynamic Model of CTR

Environmental Fluid Dynamic Code (EFDC) model was used as the hydrodynamic model for simulating the water age, water level, and current. EFDC is a three-dimensional (3D) hydrodynamic model, initially developed at the Virginia Institute of Marine Science [19,20,21]. The details of the EFDC model were documented by Hamrick [19] and Craig [22]. The model has been extensively applied to simulate circulation, thermal stratification, sediment transport, water quality, and eutrophication processes in numerous lakes, rivers, and estuaries [23,24].
Water age is defined as “the time that has elapsed since the particle under consideration left the region in which its age is prescribed as being zero” [25,26]. Several methods have been introduced for computing water age. Delhez et al. [25] provided a method for using numerical models to compute spatially varying age distributions in a real estuarine environment based on a tracer and age concentrations. Assuming that there is only one tracer discharged into the water body and there are no other sources and sinks of the tracer within the water, the transport equations for calculating the tracer and the age concentrations can be written as follows [25]:
c ( t , x ) t + ( u c ( t , x ) ) K c ( t , x ) = 0
α ( t , x ) t + ( u α ( t , x ) ) K α ( t , x ) = c ( t , x )
where c is the tracer concentration, α is the age concentration, u is the velocity field in space and time domains, K is the diffusivity tensor, t is time, and x is the spatial coordinate. The Equation (1) is a normal form of the conservative material transport equation, including the advection and diffusion process. The Equation (2) is the age concentration equation.
The mean age “a” then can be calculated as:
a ( t , x ) = α ( t , x ) c ( t , x )
The study area of the reservoir was restricted to Changxin Dam in the upstream and Changtan Dam in the downstream. The boundary coordinates of the study area were extracted from Google Earth. The reservoir bathymetry (Figure 1) was specified using recently conducted side-scan sonar imagery. A Cartesian computational mesh was generated using the EFDC-Explorer 6 pre-processor and constructed in a horizontally rectangular and vertically sigma-stretched coordinate system. The mesh contained 11,214 cells in the horizontal plane with a uniform grid size of 20 m, and 10 equally divided vertical layers. Each vertical cell thickness was equal to the local water depth divided by the number of vertical layers (e.g., a 30 m water column would have 3 m layers, a 60 m water column would have 6 m layers).
The model was driven by boundary conditions including inflow tributaries and outflow from the dam release, surface wind stress, and atmospheric forcing. The inflow/outflow of tributaries were obtained from the simulated result from the watershed model. The wind and metrological data in the hydrodynamic model were the same as those in the watershed model. When running the model, a dynamic time step, ranging from 1.0 to 20.0 s, was used to improve efficiency and maintain numerical stability. A critical dry and wet water depth of 0.15 m was assigned for the wetting/drying process.

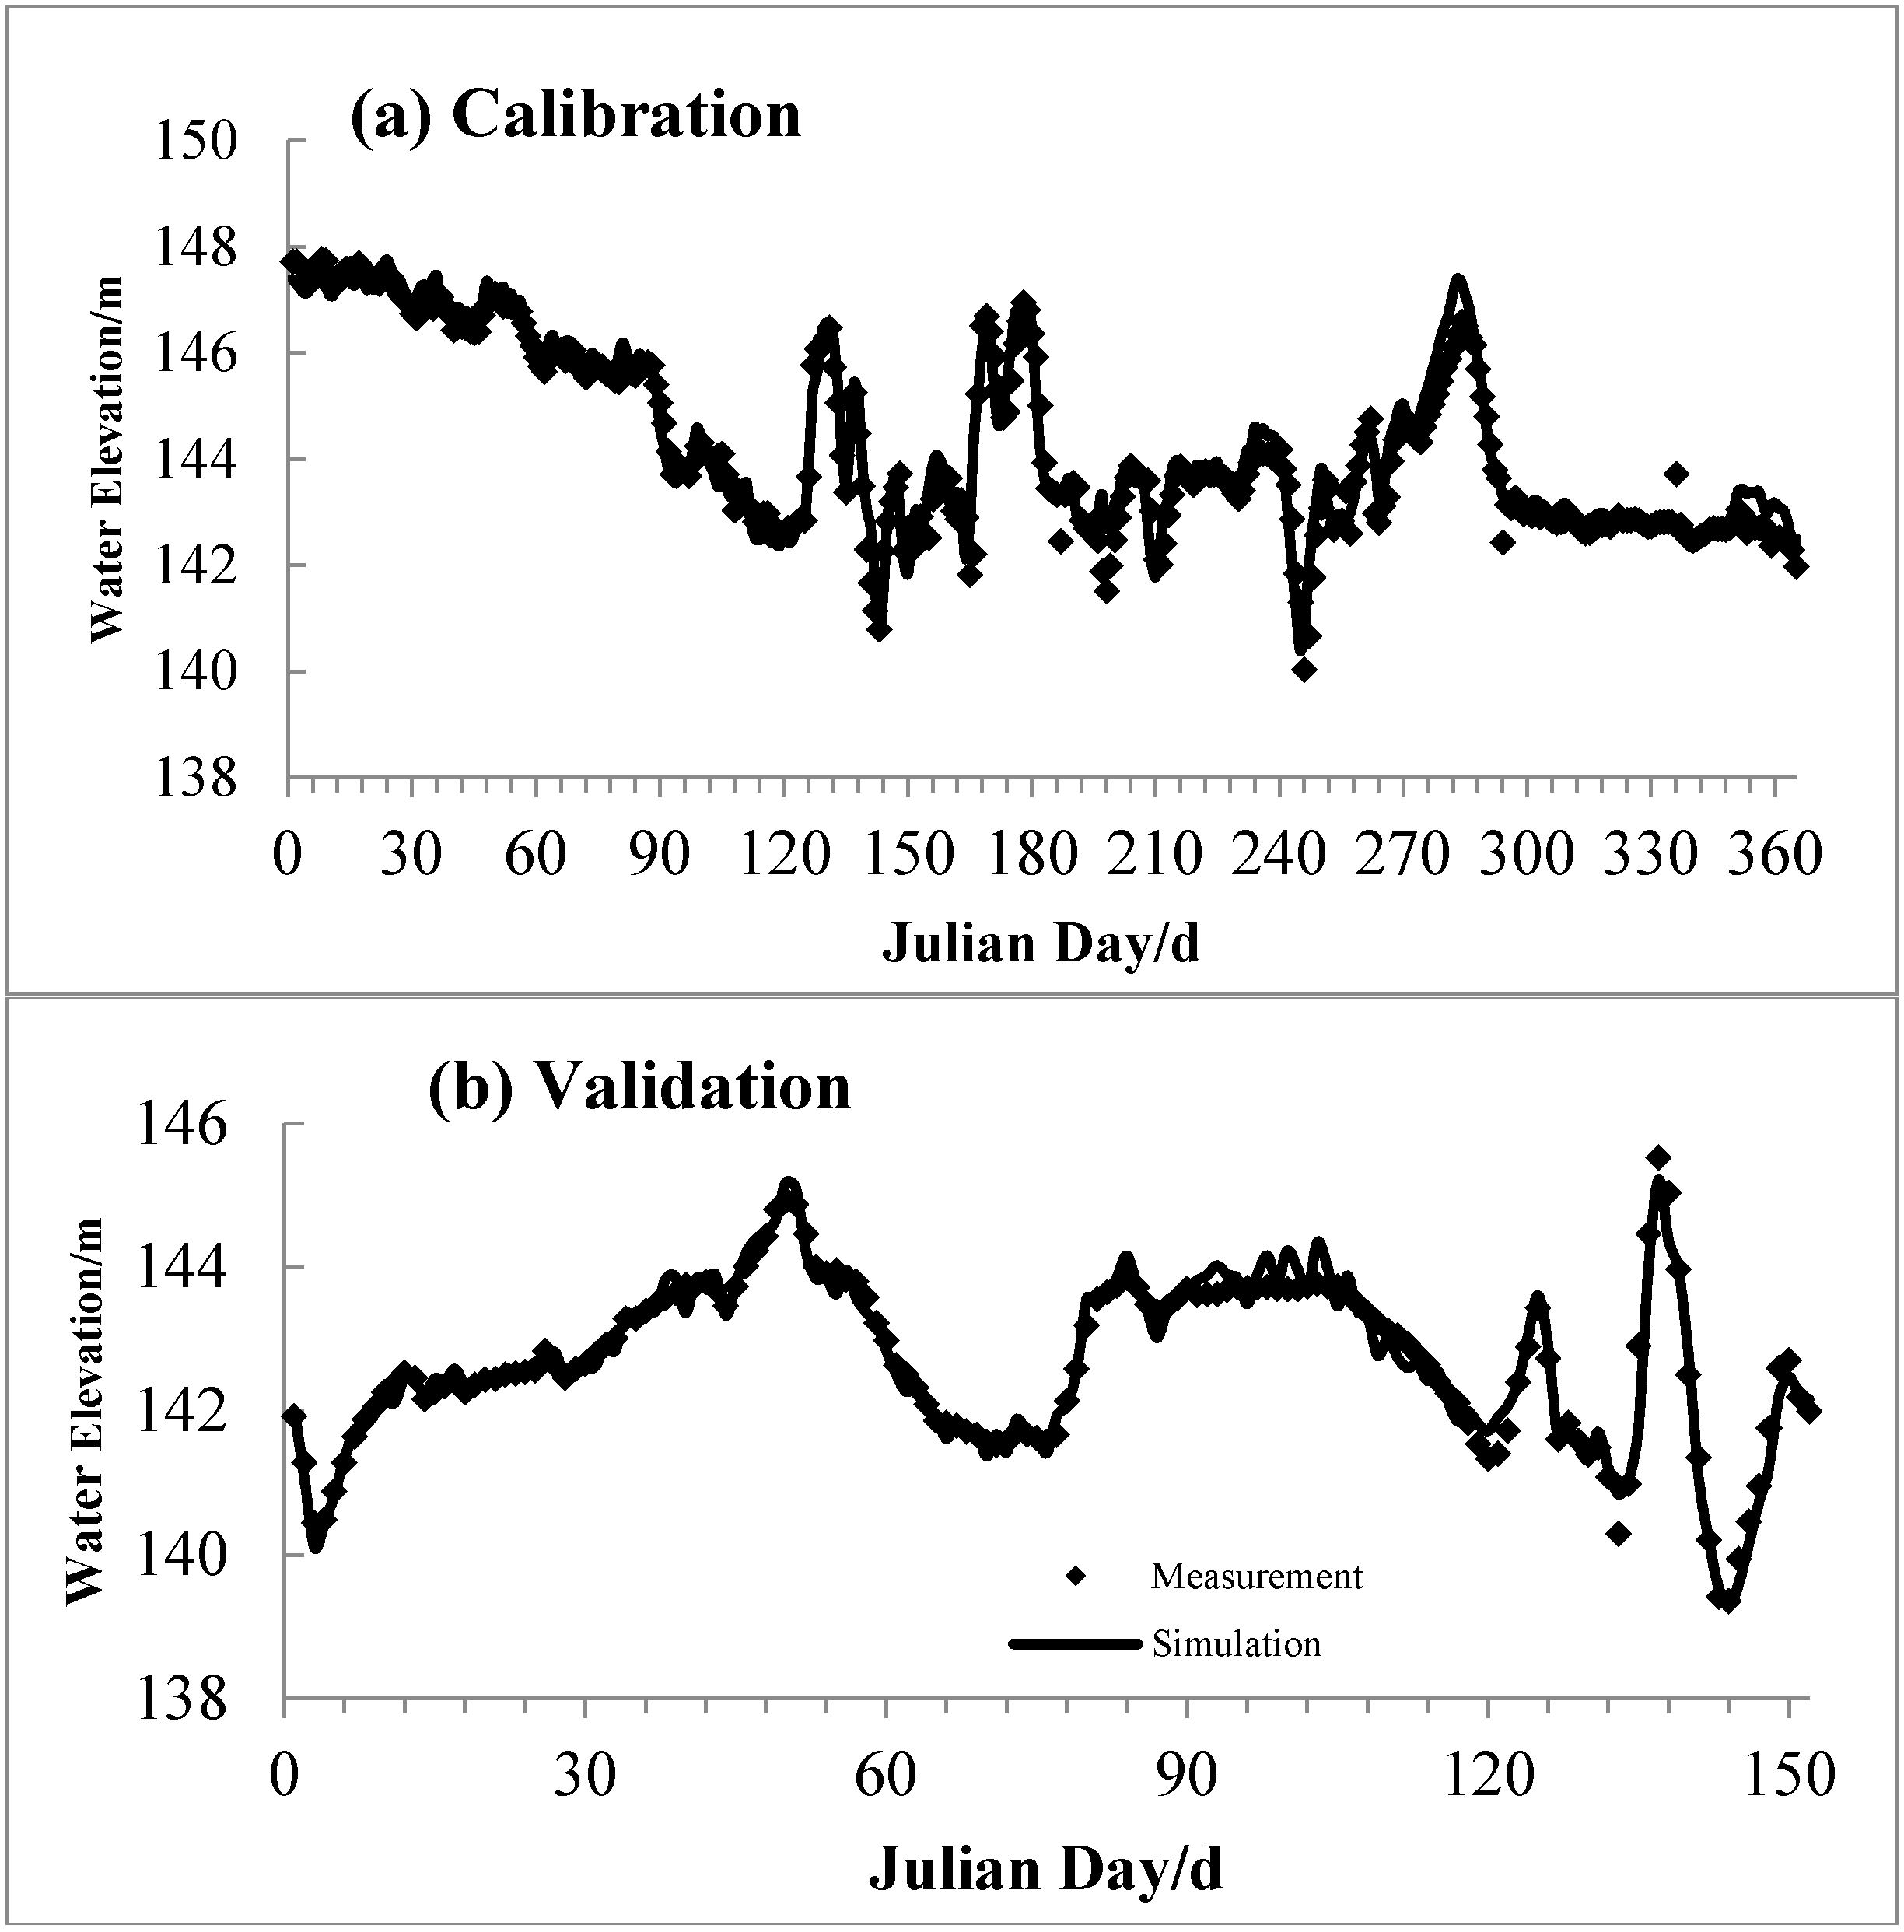
3. Calibration and Validation for the Coupled Watershed and Reservoir Model

Calibration of the coupled model was conducted by using observed daily flow discharge values of Changxin Dam and Changtan Dam, water surface elevation and velocity values in the year 2010 between 1 January and 31 May. The daily weather data including temperature, wind, and humidity were used to drive the watershed model and hydrodynamic model (Figure 2). The main calibrated parameters for reservoir model included horizontal and vertical eddy viscosities and diffusivities, bottom roughness height, the wind sheltering coefficient (which affects the hydrodynamic process), and several parameters related to the temperature simulation. The turbulence parameters related to the Mellor-Yamada turbulence model [27,28] were treated as constants and their values were consistent with those used widely in other hydrodynamic models, such as the Princeton Ocean model [29] and the Estuary, Coastal, and Ocean model [30]. The hydrodynamic model was calibrated by adjusting the bottom roughness height (Z0) to better simulate the water elevation at point C (see Figure 1) and the velocities along the centerline of CTR. The observed daily water elevations in 2010 and the observed velocities along CTR’s main channel on 7 July 2010 were compared to the simulated results. It could be seen that the simulated WSE and velocities agreed with the observed values well, which indicated that the hydrodynamic characteristics of CTR was well represented by the coupled model. Due to no conventional hydrological monitoring cross sections along the reservoir, the lack of a long sequence of hydrology, water quality monitoring data made it difficult to simulate the water ecological dynamic model. Using different reliability rainfall data and meteorological data, we could build watershed hydrological model to simulate storage of basin runoff and pollutant concentration of main tributaries, which could solve the problem of missing data to generate water ecological dynamic model in reservoir. SWAT model is a watershed scale model which can predict the influence of long term climate conditions. In this study, Digital Elevation Model (DEM), land use data, soil data, rainfall data, evaporation data, and other basic data were used in simulating SWAT model. At the same time, the watershed hydrological main parameters of Changtan Reservoir were also important in simulation. The main parameters selected are shown in Table 1 below.
The discharge data could be obtained by simulation of SWAT model, directly as the boundary condition of the EFDC hydrodynamic model. EFDC model was a mature application for hydrodynamic simulation, most of the physical parameters were not changed except some major hydrodynamic parameters, and the values selected are shown in Table 2.
A validation of the coupled calibrated model was conducted for the period of January to May in 2011. The measured daily WSE along CTR main channel on 15 May 2011 were available. It showed that the coupled model simulated satisfied the WSE in CTR during the validation period.
To quantify the errors and assess the performance of the calibrated model, the Mean Absolute Error (MAE), and Mean Relative Error (MRE) were used to assess the performance of the model.
MAE  =   | Modeled-Observed | number of observations
MRE  =   ( | Modeled-Observed | Observed ) number of observations × 100 %
The calculated MAE and MRE for water level errors were 0.31 m and 0.2%, respectively. The MAE and MRE for velocity were 0.04 m/s and 22%, respectively (Figure 3). The calibration and validation results showed that the simulation values agreed well with the observations, suggesting that the coupled SWAT and EFDC model of CTR could be used for simulating the hydrological and hydrodynamic process in the study area.

4. Application of the Coupled SWAT and EFDC Model in CTR

The calibrated model was applied to calculate hydrodynamic process in CTR under different weather conditions (precipitation, temperature) and inflow from the upstream. Since precipitation plays an important role on the inflow and water age in a channel reservoir [31], three typical years with different precipitation frequency based on the annual averaged precipitation frequency analysis from 1951 to 2010 were selected for water age simulation for our study in CTR. The three typical years were: (1) a wet year (1992) which has an annual precipitation greater than 80% of the recorded years; (2) an average year (1988) which has an annual precipitation greater than 50% of the recorded years; and (3) a dry year (2004) which has an annual precipitation greater than 10% of the recorded years. The annual averaged rainfalls of the three years were 2048 mm, 1771 mm, and 1035 mm, respectively, and the annual averaged temperature of the three years was approximately 21 °C. Time series of daily rainfall, temperature, wind forcing, and humidity in the three typical years were provided to drive the coupled watershed and reservoir model (Figure 4). The simulation period was a whole year (365 days) to ensure model stability and accuracy, as the water age changed with time before the arrival of head water to the specific location in the beginning of simulation. To assess the impact of weather conditions on the inflow and water age in the CTR, other input conditions (i.e., land use, soil classification, model parameters, time step) were kept constant for the three typical years as those used in the calibration scenario.

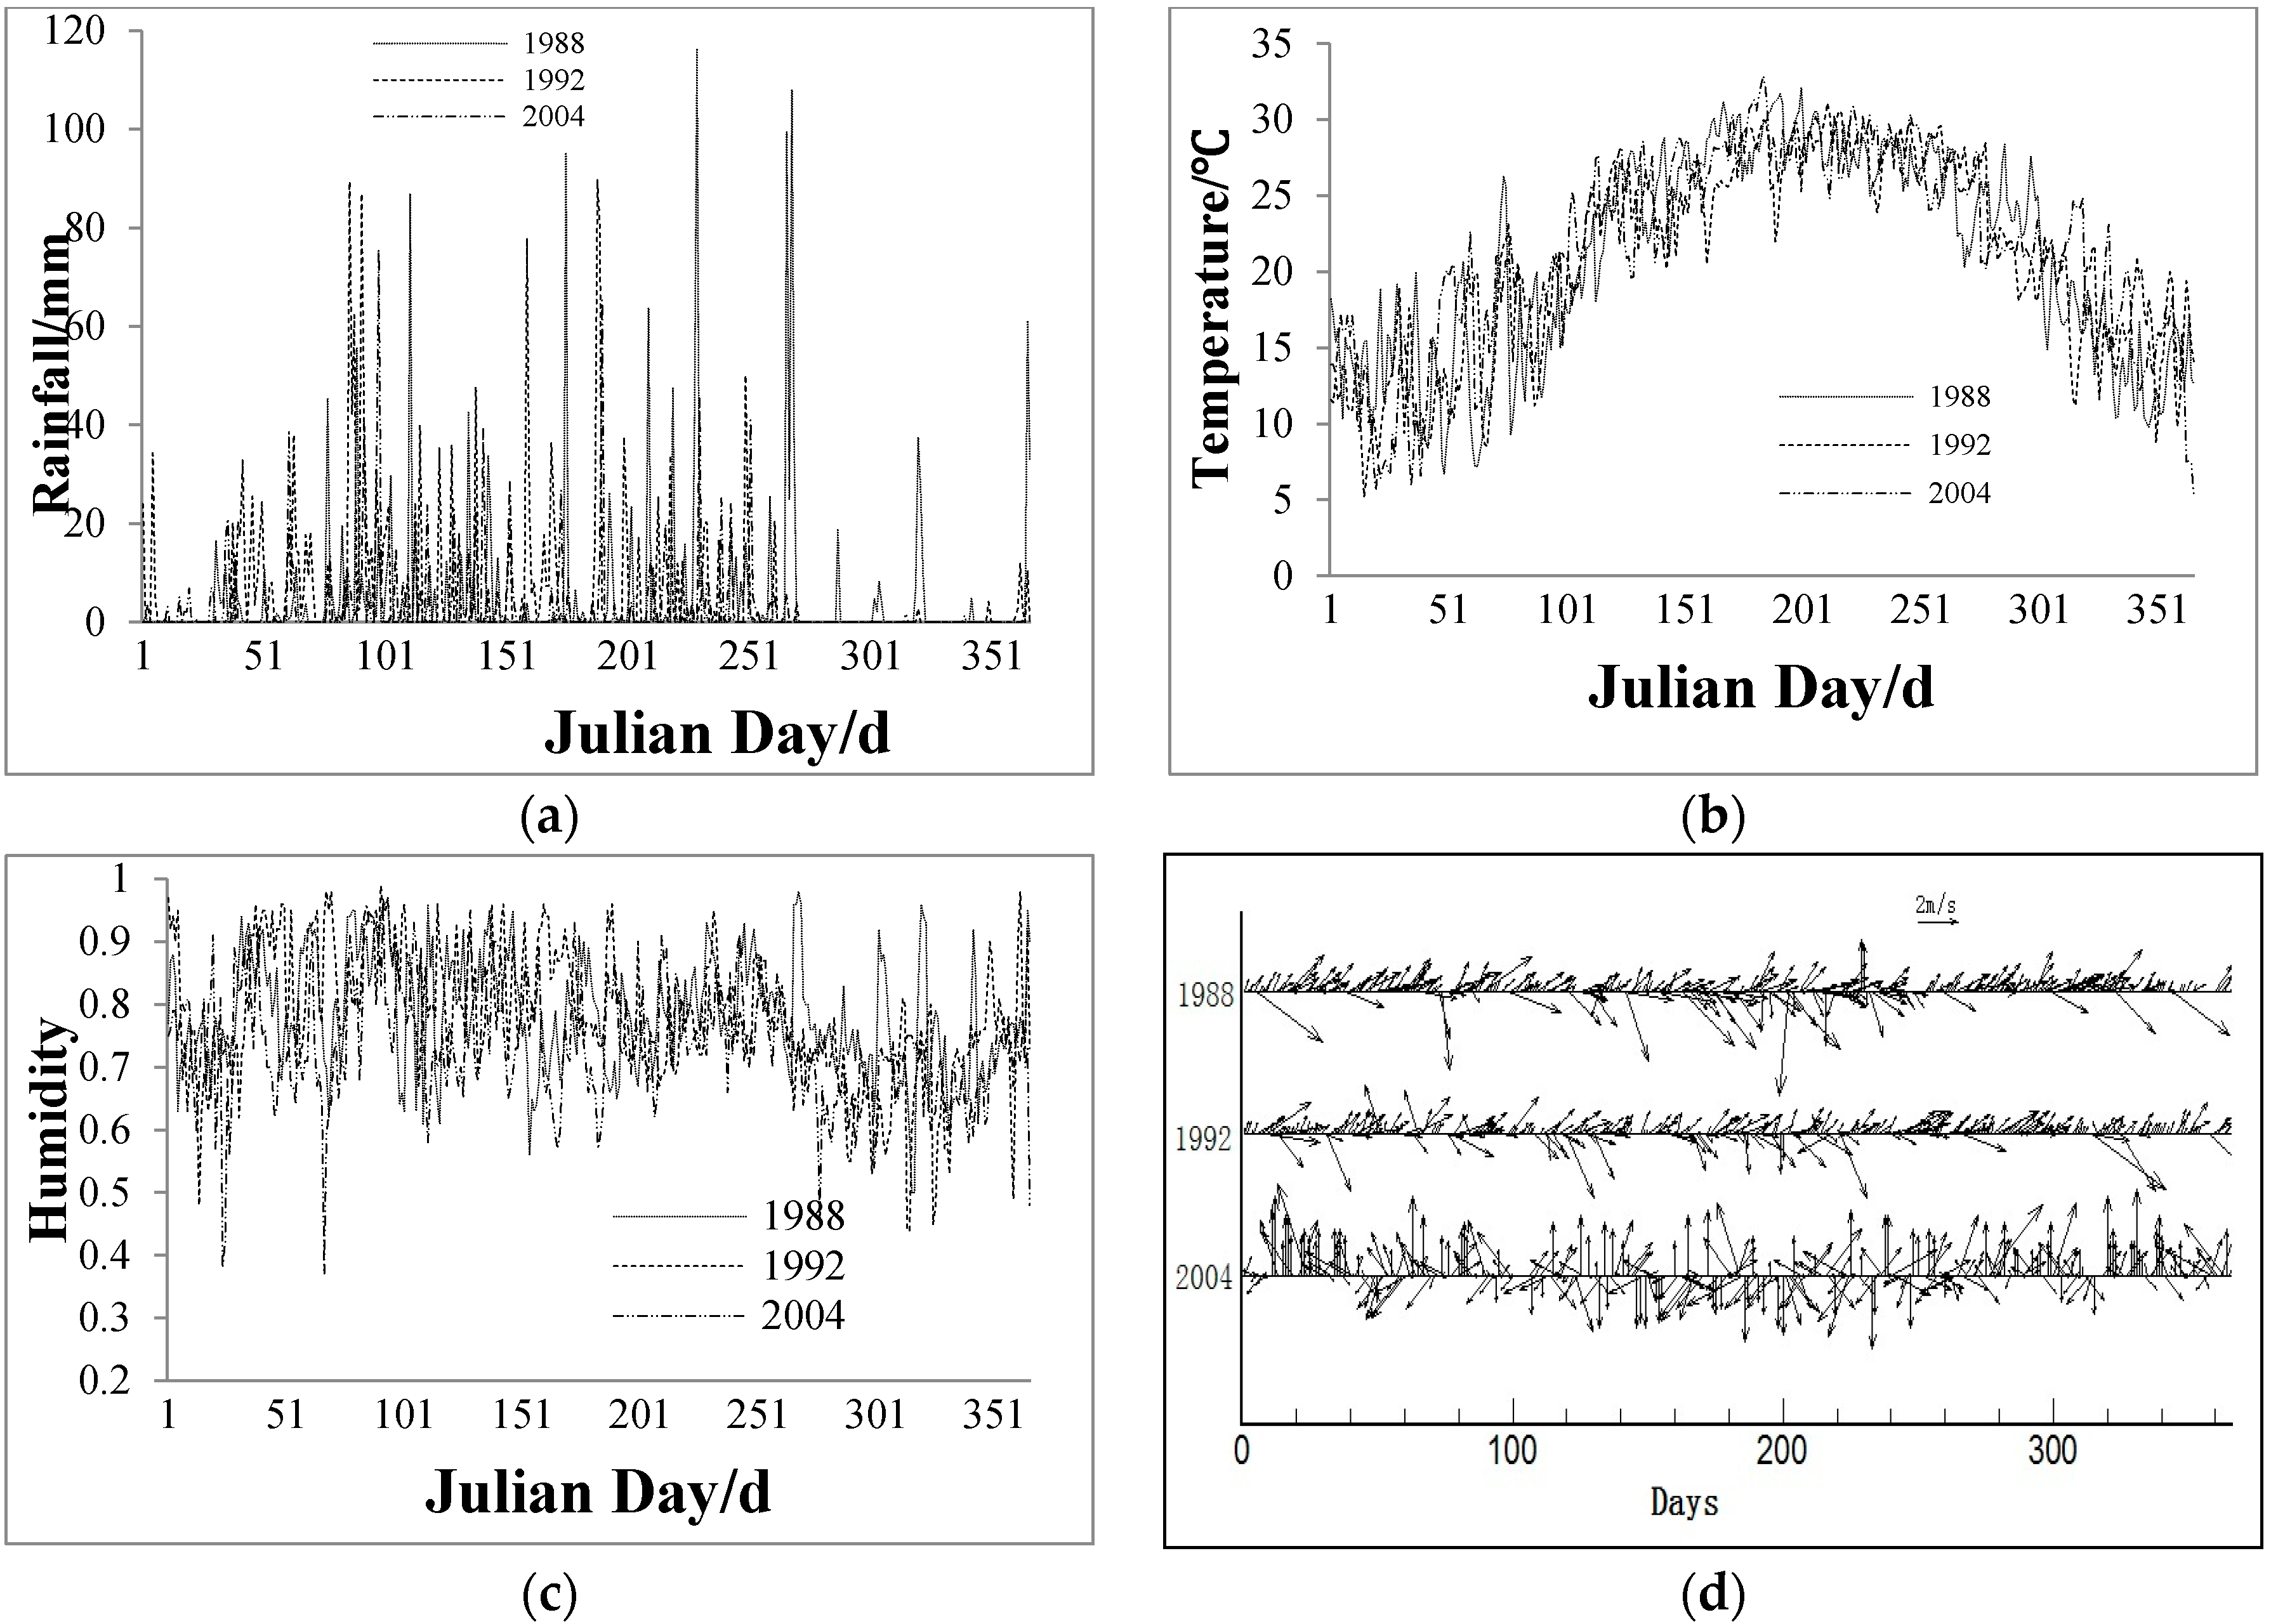
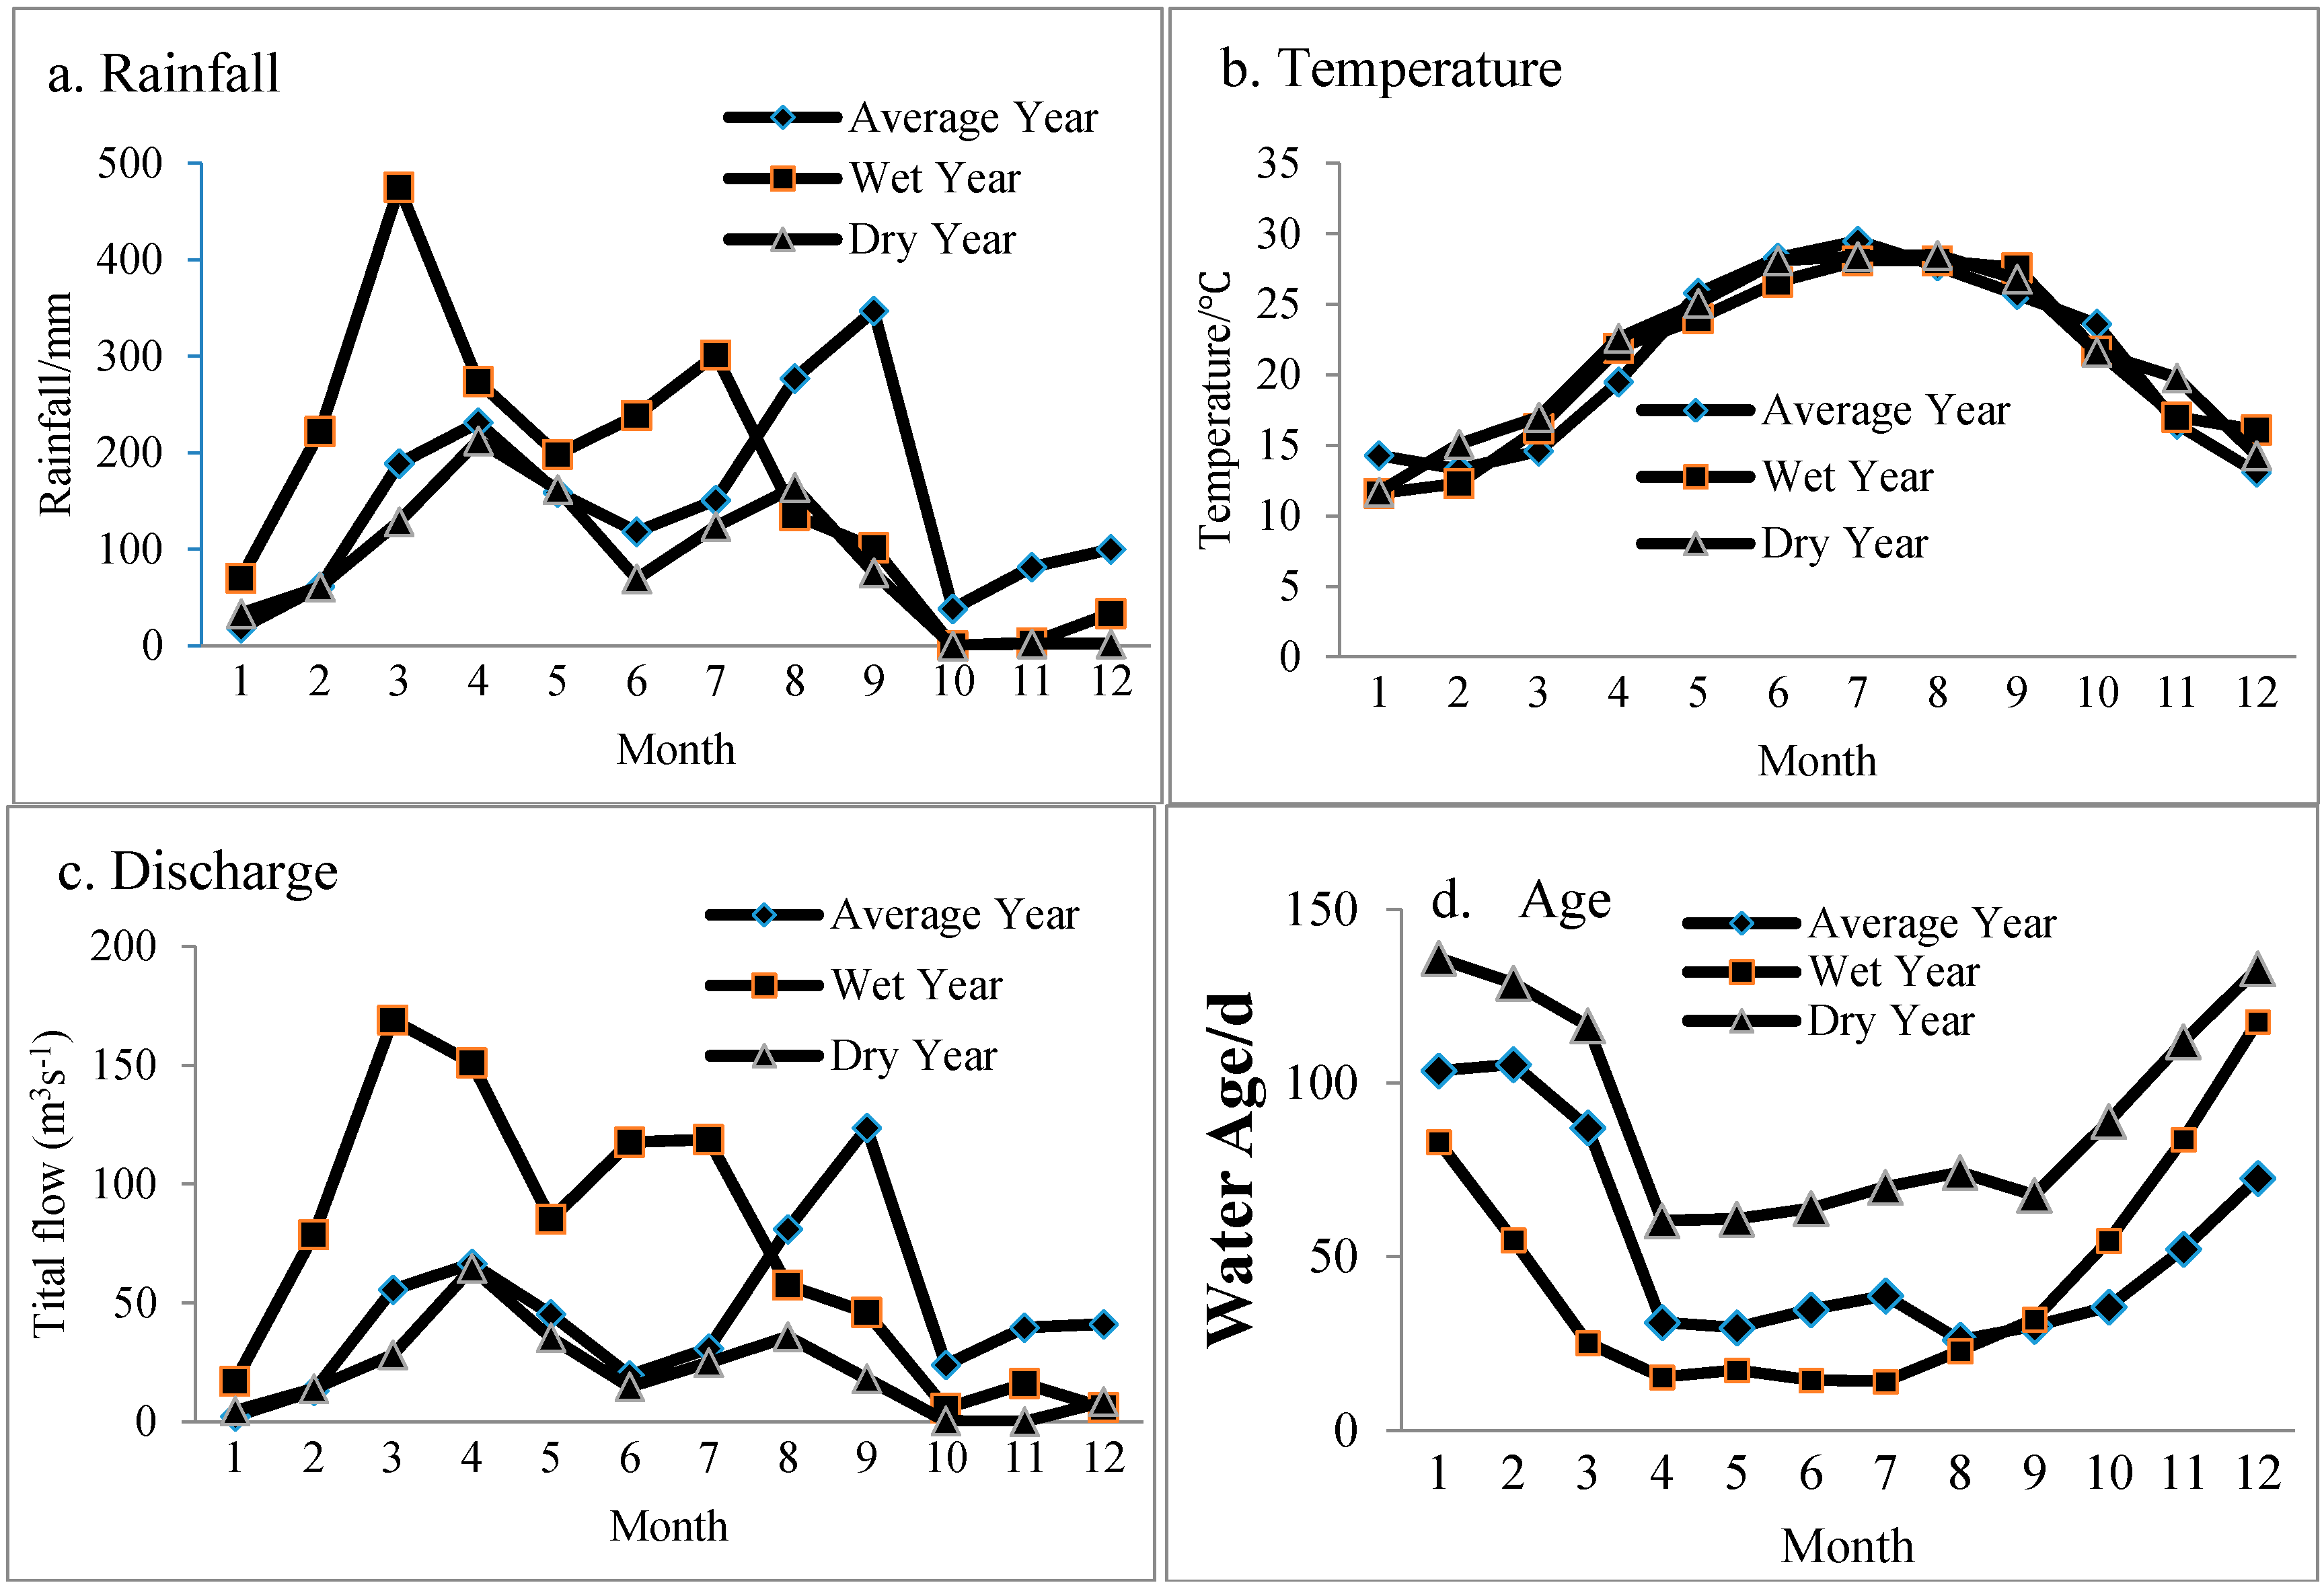
4.1. Temporal and Spatial Distribution of Water Age in Typical Wet, Average, and Dry Years

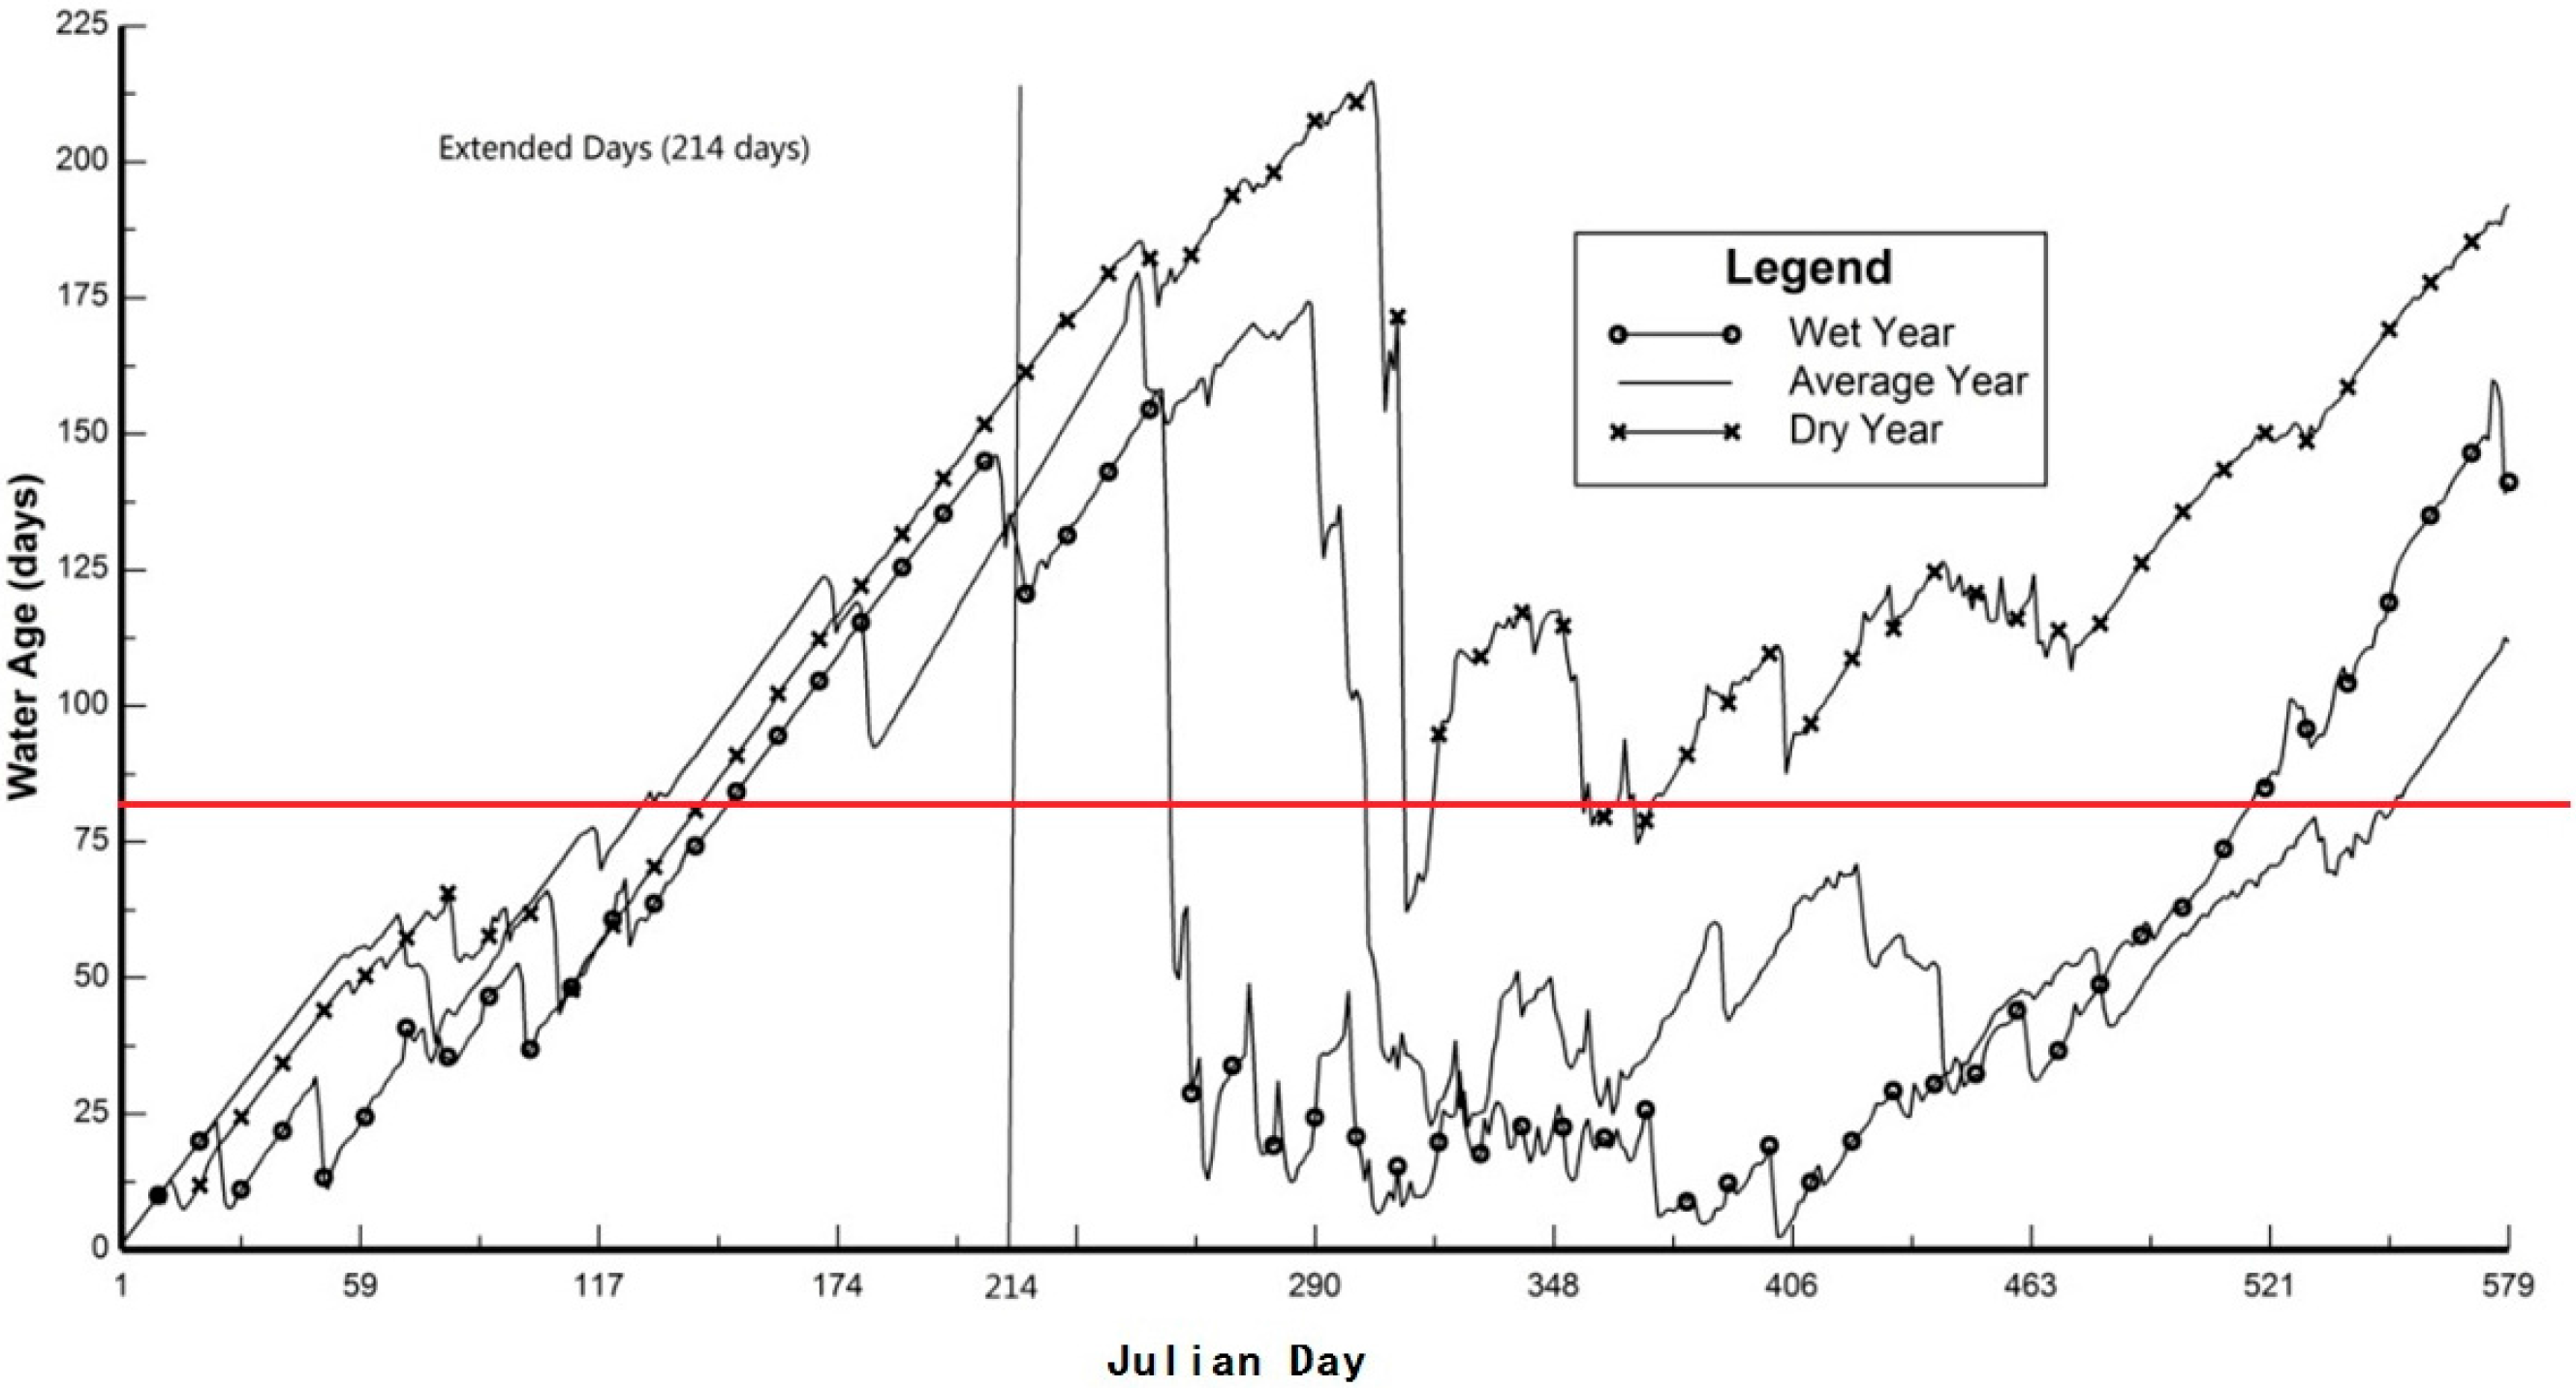
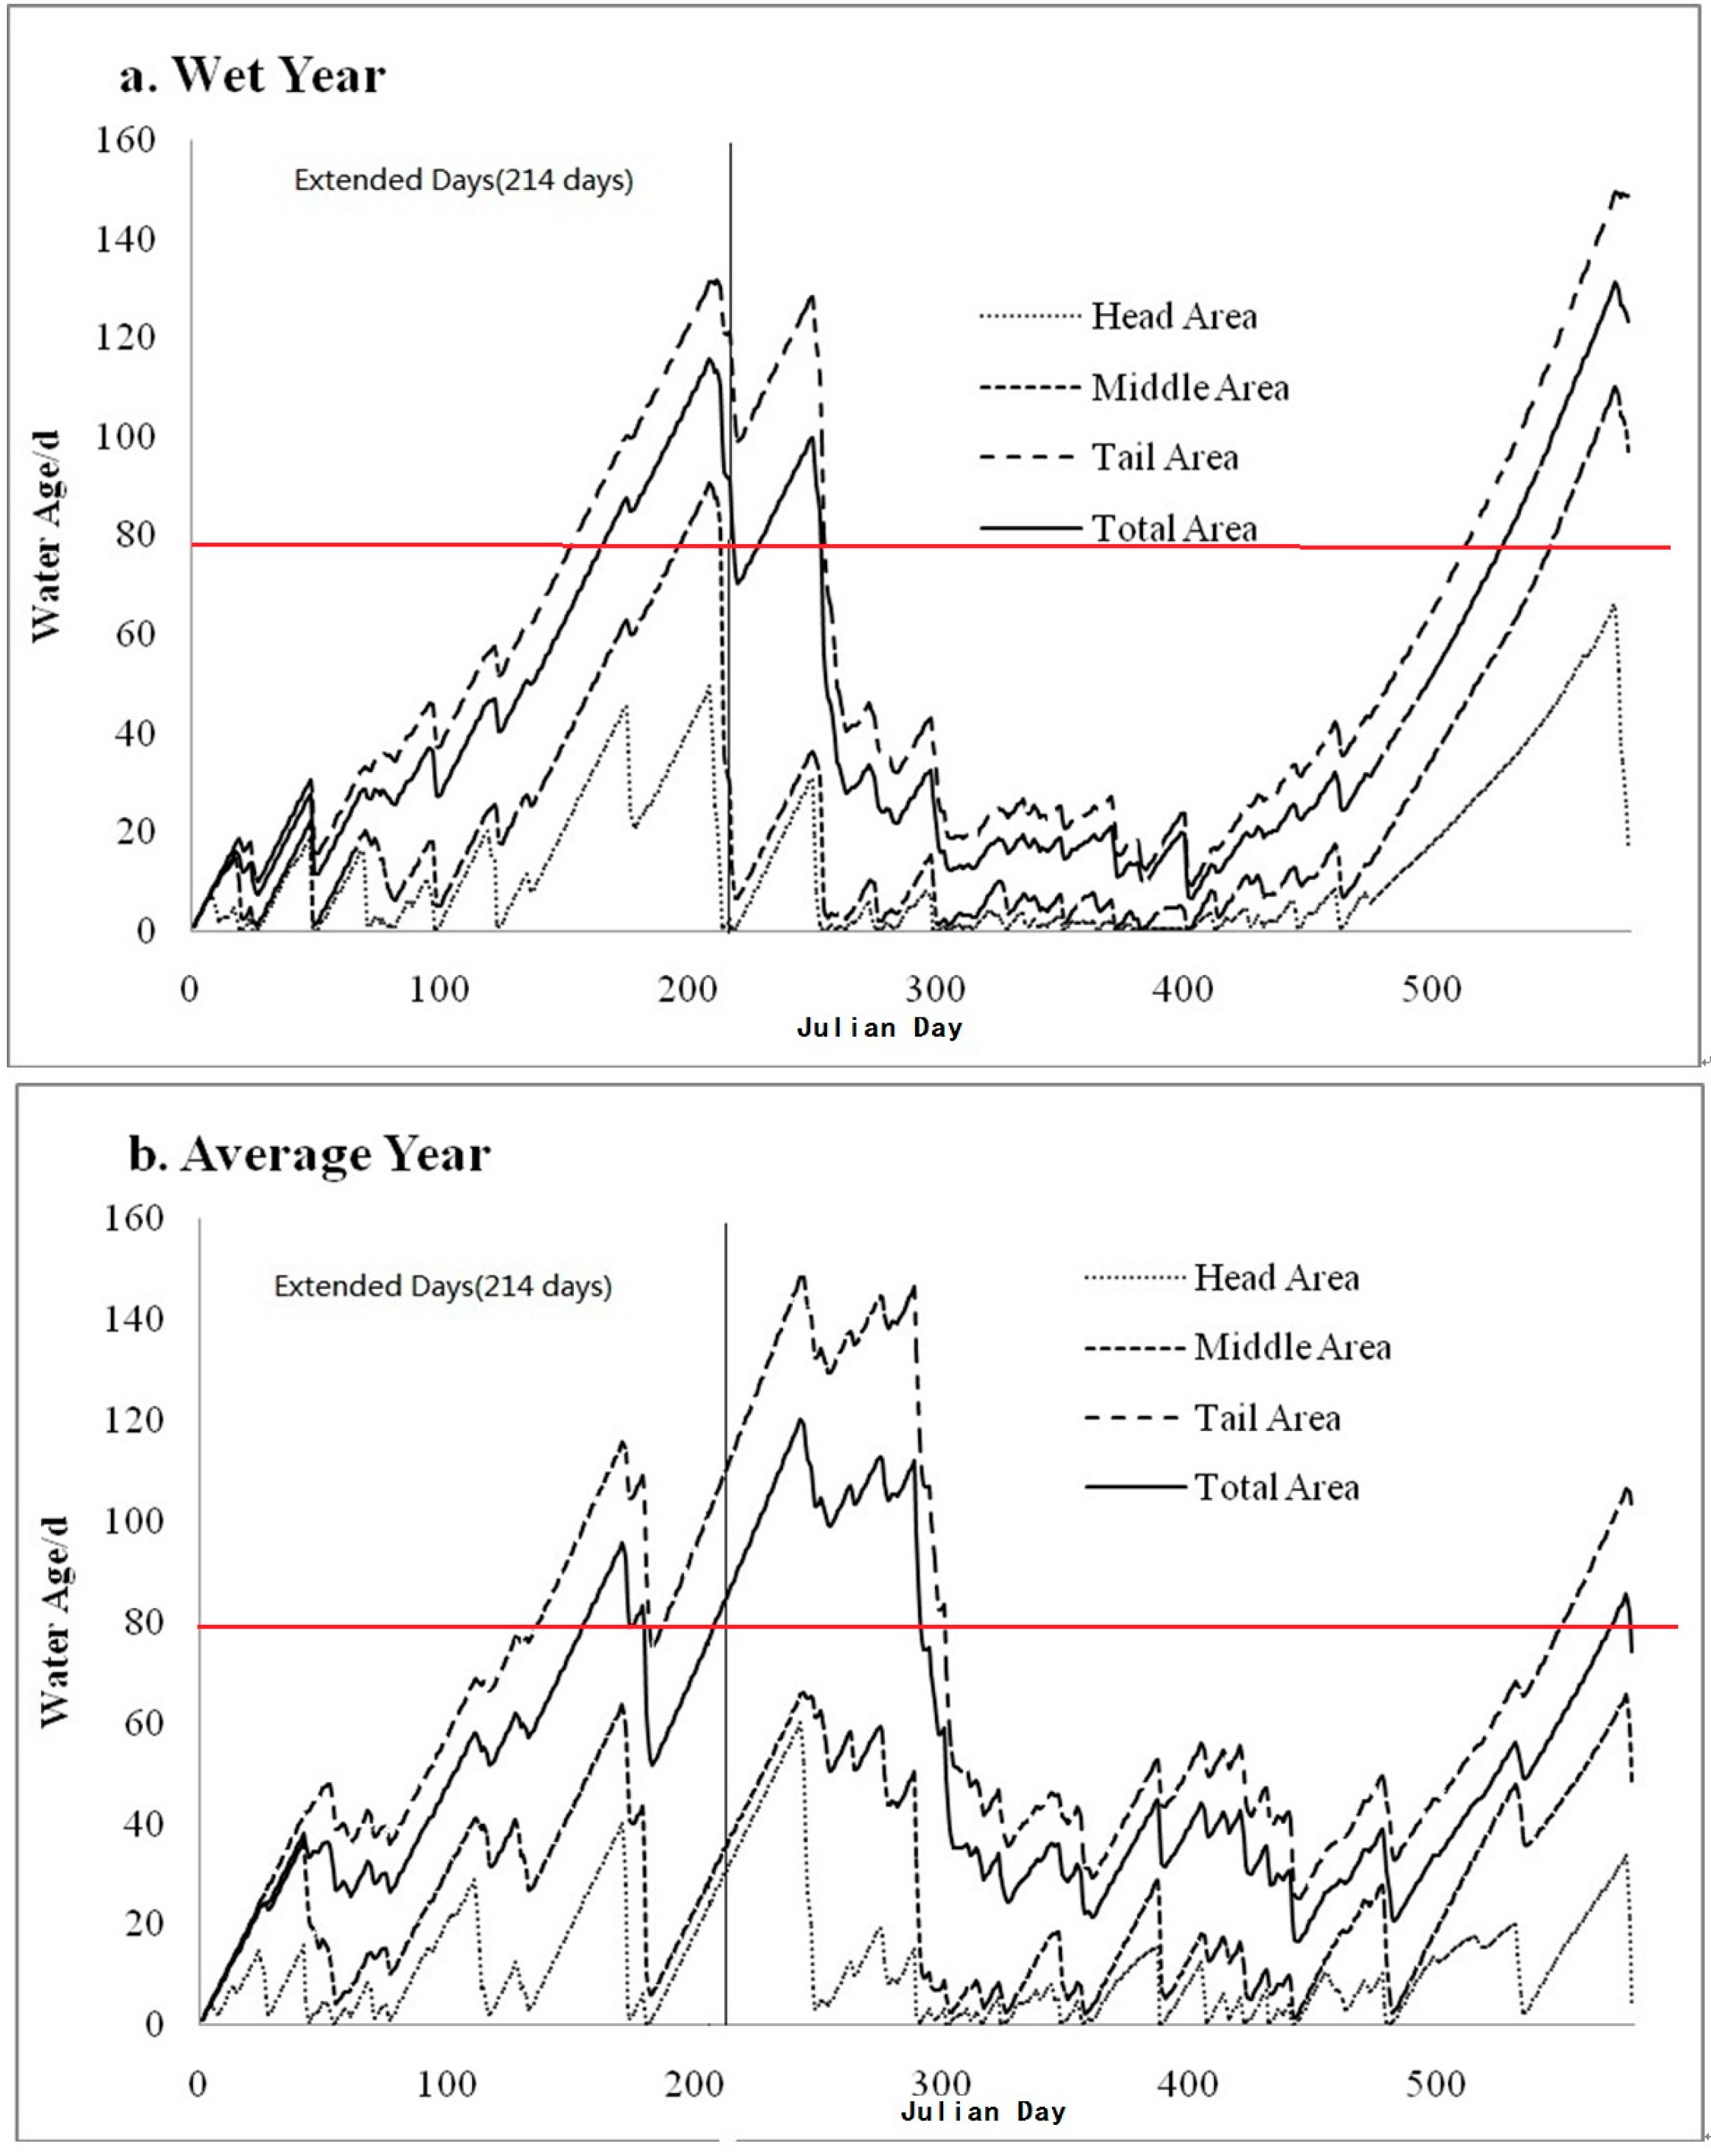
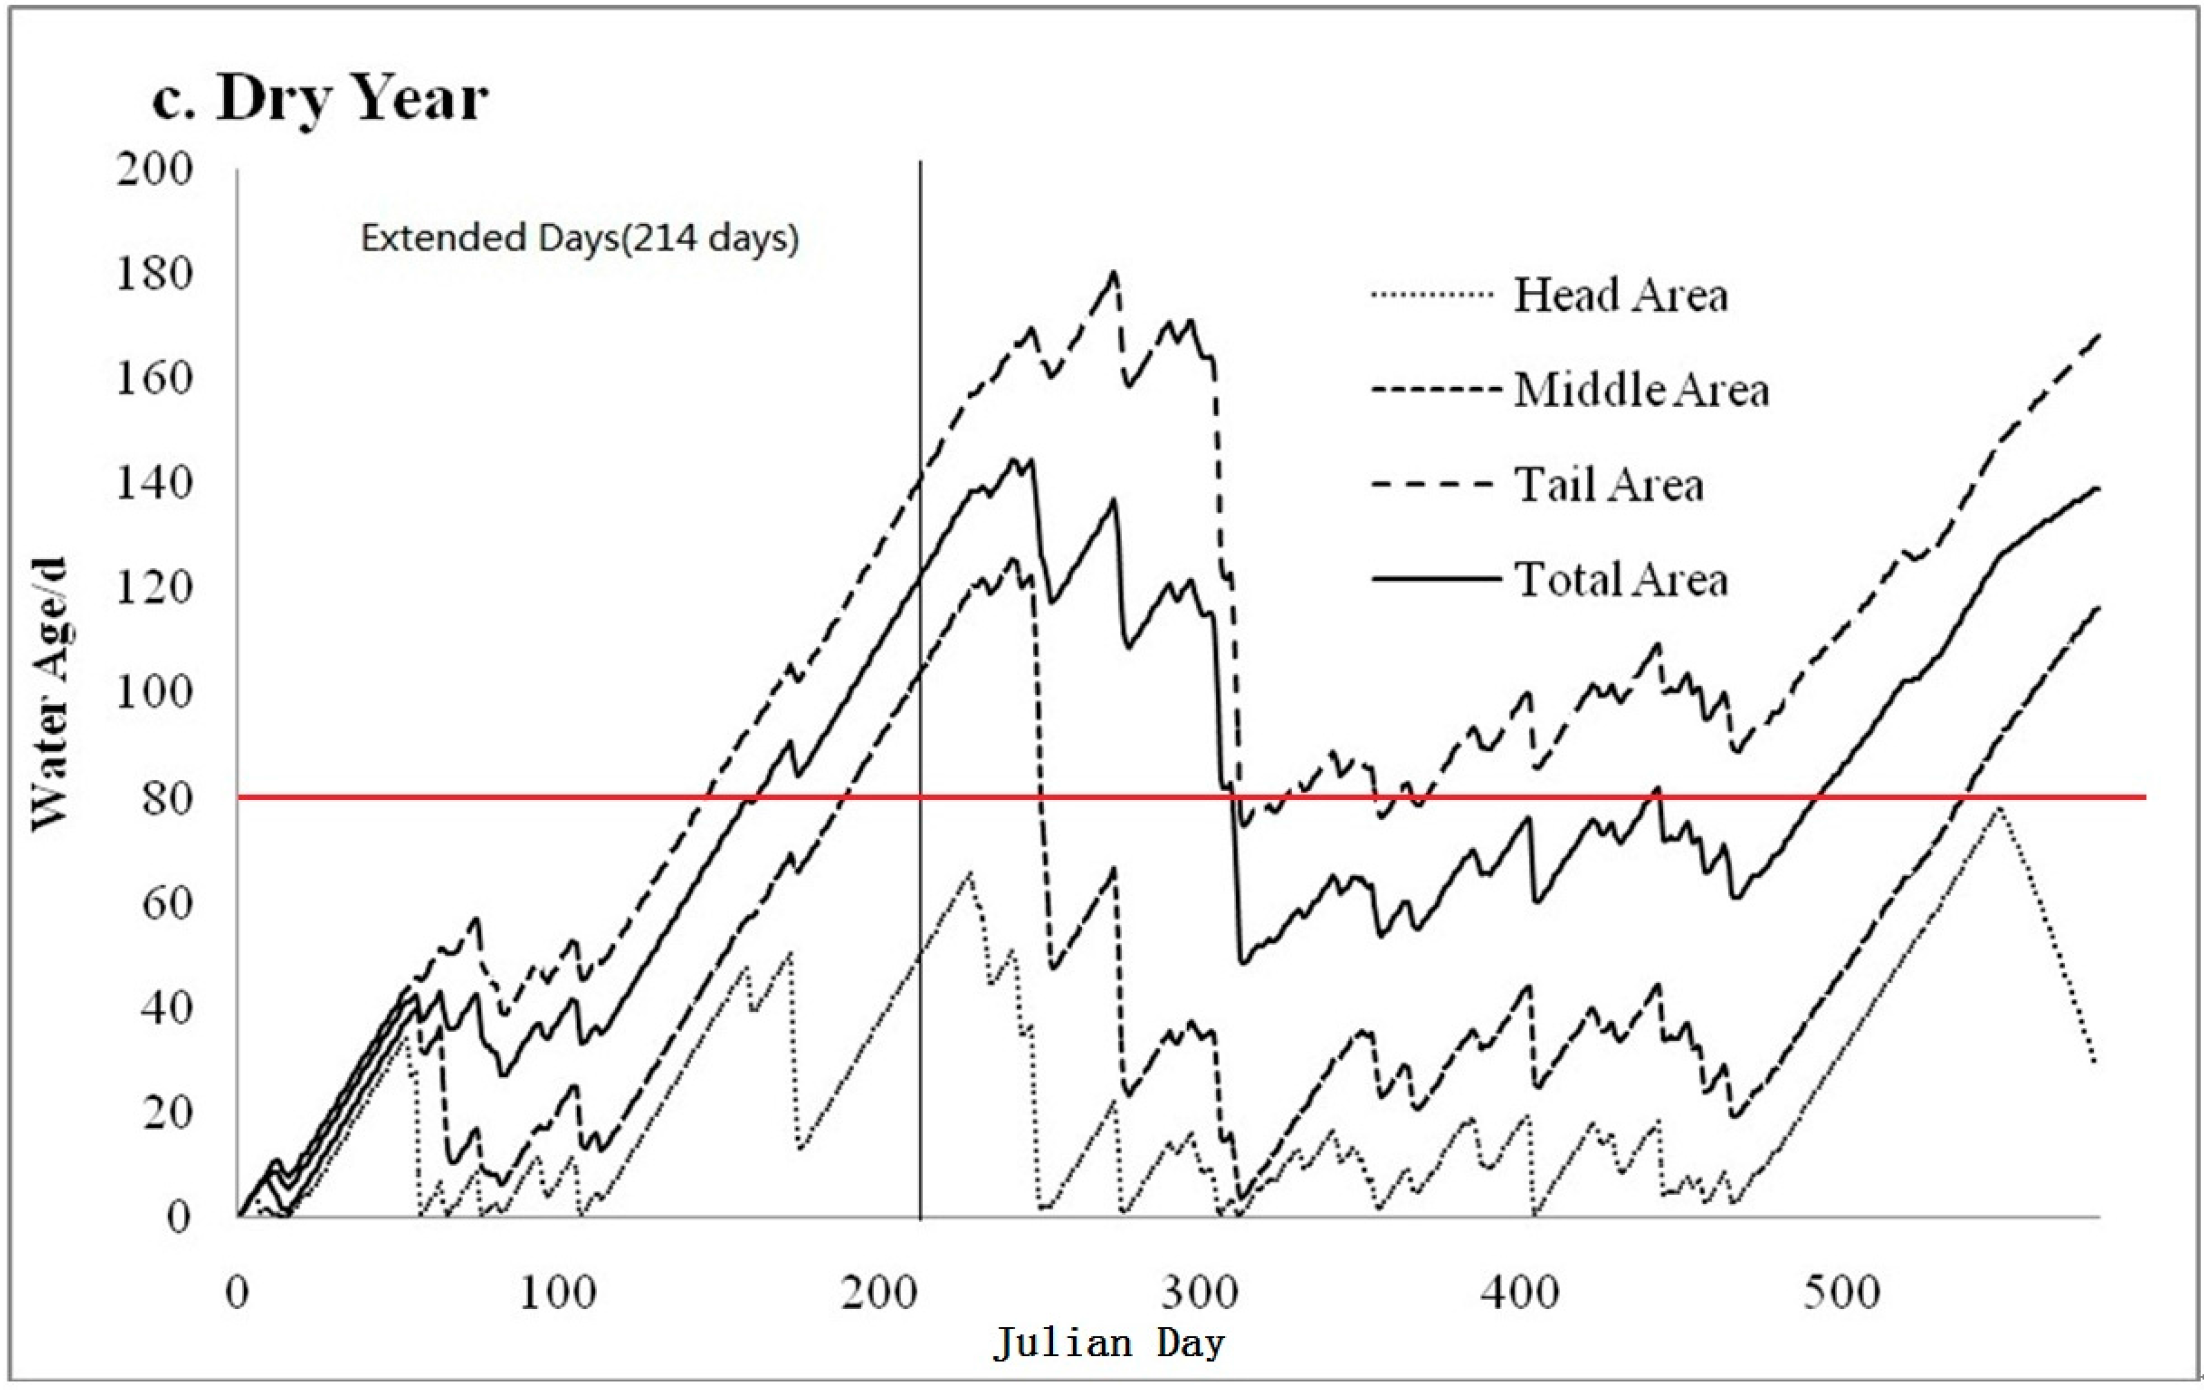
4.1.1. Changes of Water Age over Seasons in Typical Wet, Average, and Dry Years

Water age distribution is a function of flow discharge, air temperature, and wind in reservoirs, and it varies with time and space. To investigate spatial distributions of water age in the reservoir under different weather conditions, CTR was divided into three segments: the head, middle, and tail areas, each area spans approximately 7.5 km (Figure 1). As the head area (near the dam) of the reservoir is a potential eutrophication area where nutrient is rich and water moves slowly, more attention is paid to this area. Therefore, the water age at point C, shown in Figure 1, which is 200 m away from CTR dam in the head area, was selected for analysis and discussion. The temporal distribution of water ages in the three typical years are shown in Figure 5. The initial simulation period was used for model training until the water age reached 214 d to eliminate the impact of initial conditions. Therefore, the results from Day 215 to 579 (365 d in total) were used for assessing impacts of weather conditions on the water age. Generally, water age in the three typical precipitation years had the same variation trend over time. The water age reached the minimum in late Spring and early Summer, and a slight increase occurred in Fall, and the increasing trend maintained throughout the rest of the year. Comparing water ages in different weather conditions, the average water age in the dry year was 35–100 days more than the average year, and the average year was 10–50 days more than the wet year.

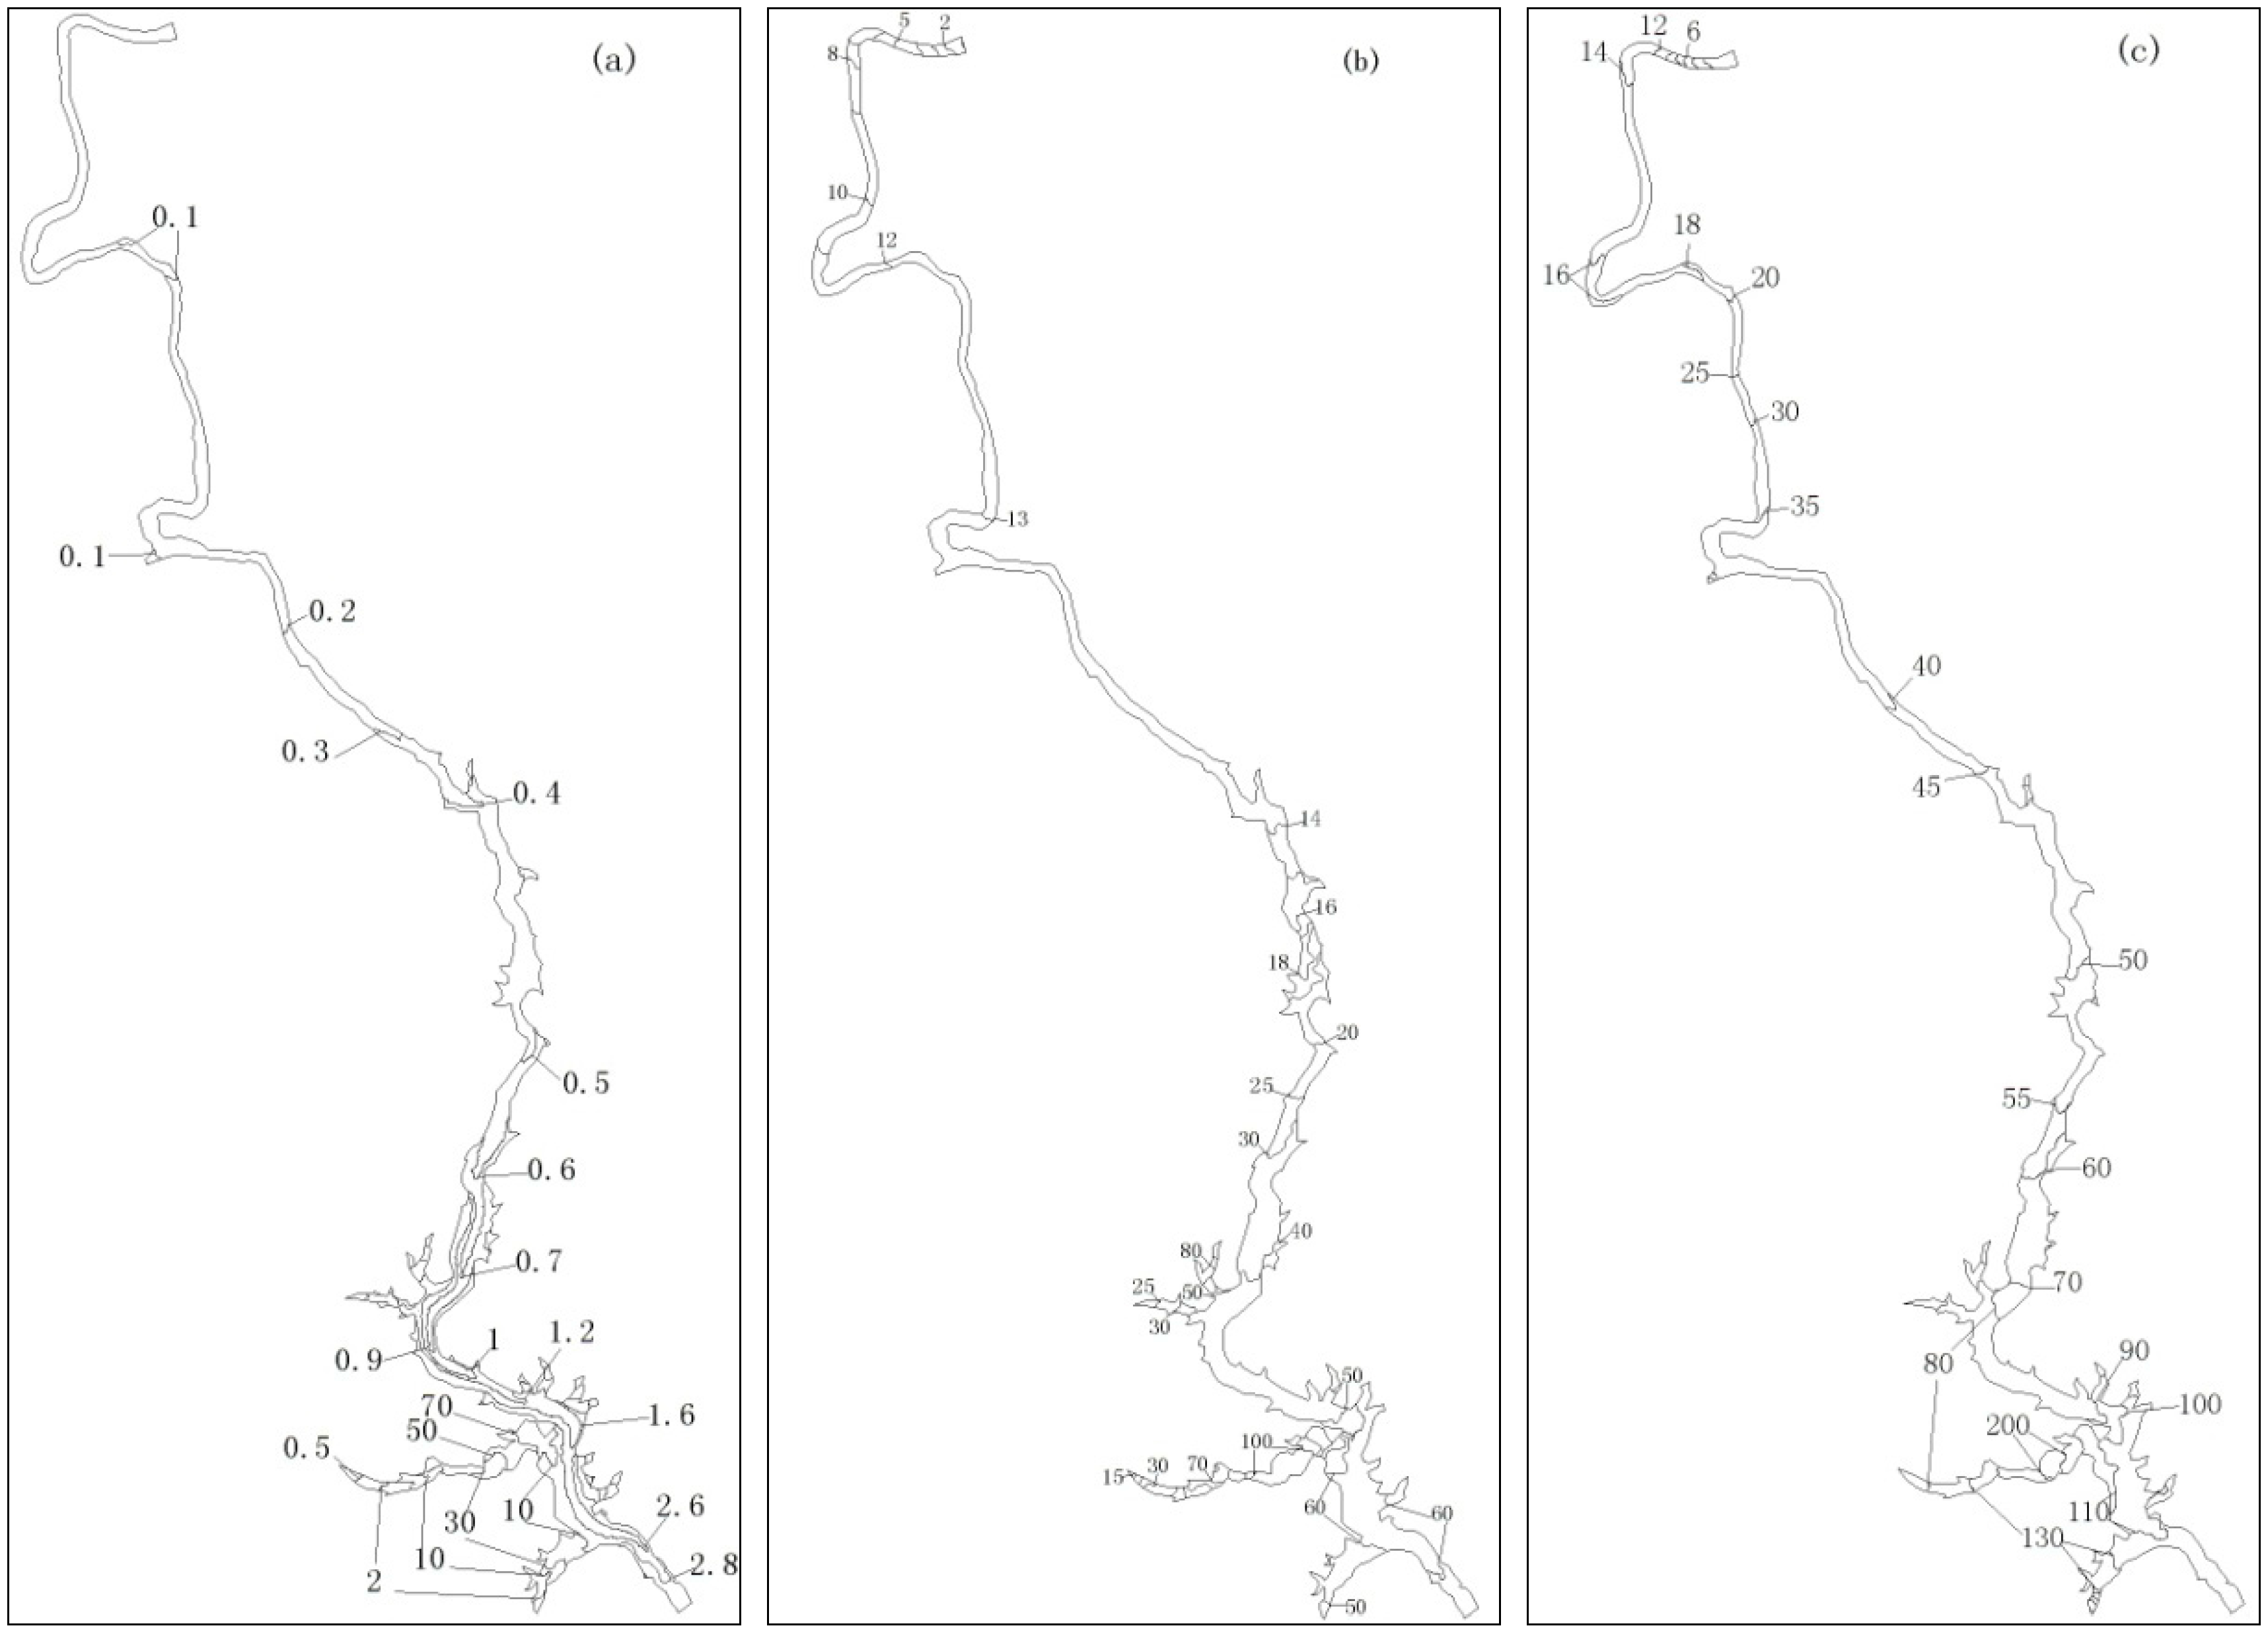
4.1.2. Spatial Distribution of Water Age in Typical Wet, Average, and Dry Years

In different areas of CTR, the water movement exhibited different spatial characteristics. The flow pattern in the tail area showed a similar flow characteristic as rivers, while the head area acted as lakes, and the middle areas had the characteristics of both rivers and lakes. In addition, the water ages in different areas changed with weather conditions (wet, average, and dry year) tremendously (Figure 6).
In order to understand the spatial distribution of water ages in wet, average and dry years, the 7th day of July was selected as a representative day in the algal bloom season for further analysis as shown in Figure 7. In a wet year, water age in the tail and middle area was less than 1 d, and ranged between 1 and 3 d in the head area. However, water age in the downstream of the tributaries connecting to the head area was much higher than that in the reservoir, reaching 70 d. Similarly, in average and dry years, water ages increased along the main channel from upstream to downstream and relatively higher water ages appeared in the head areas as well. However, the values of water ages in average and dry years were significantly higher than that in the wet year. For example, the water ages in the head areas ranged from 50 to 100 days in average year, and 90–200 days in dry year, respectively. Thus, weather condition had a great impact on the temporal and spatial distribution of water ages in the reservoir.
To better understand the relation between the water age and the weather conditions, the monthly rainfall, temperature, discharge from upstream, and average water ages in CTR in the three typical years were compared in Figure 8. The results showed that the water ages in CRT were highly associated with rainfall and flow discharge from upstream in all typical years. For example, in the wet year, with the increase of monthly rainfall in Changtan watershed from 70 mm in January to 475 mm in March (Figure 8a), the flow discharge from the upstream of CTR increased from 17 m3/s to 169 m3/s correspondingly, and the water ages decreased from 83 d to 25 d. From March to April, the rainfall and flow discharge decreased, but water ages decreased during this period. This suggests that subsurface (slow) runoffs can play a role in the water age dynamics. From May to December, the water ages changed closely following rainfall variation. In the average and dry years, the trend is similar. In addition, monthly water ages (Figure 8d) exhibited differences in three typical years. The water ages in the dry year were greater than those in the average year, which were also greater than those in the wet year. The higher rainfall resulted in the higher flow discharge in the reservoir, and thus led to lower water ages in CTR. The results also indicated that the water body in the reservoir renewed more frequently in the wet year than in the dry year.

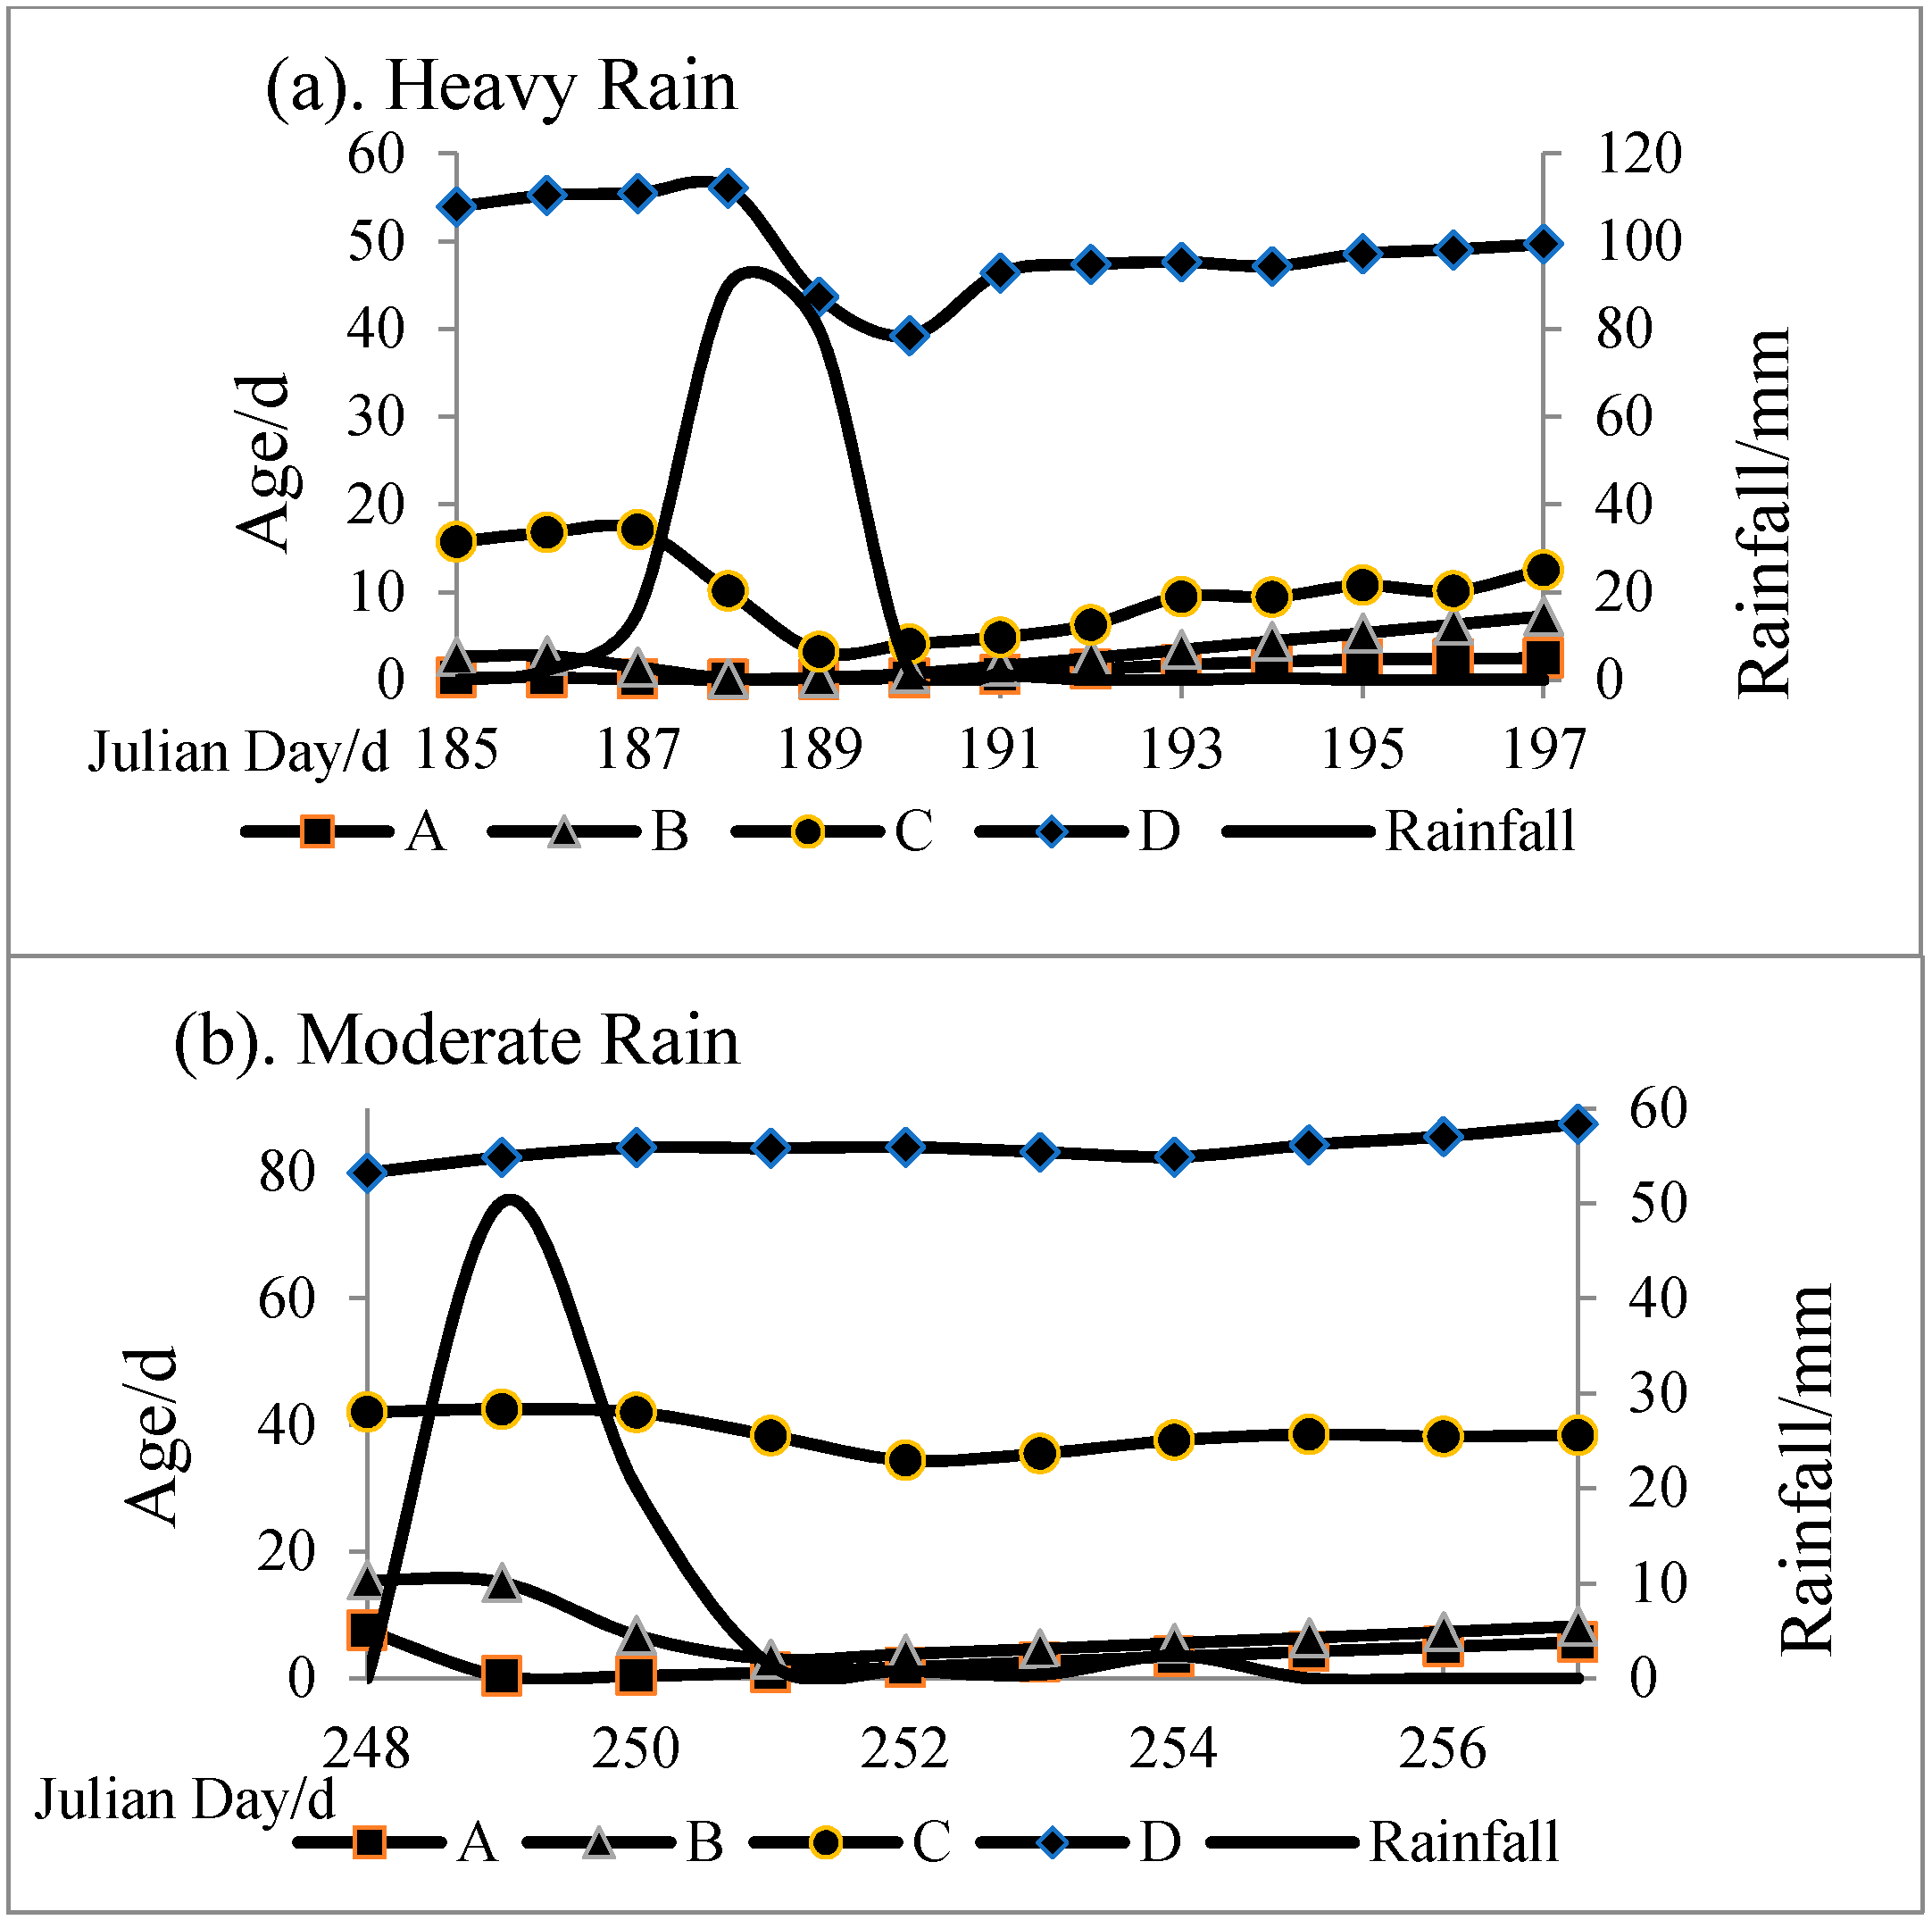
4.2. The Impact of Short-Term Weather Conditions on Water Age in CTR

As previously mentioned, the water ages were sensitive to discharge affected by rainfall and wind. Compared with uncertainty analysis and sensitivity analysis in Lake Taihu [32,33] and Lake Mead [34], the discharge and rainfall intensity parameters are more important and sensitive when simulating the hydrodynamic model than parameters such as the wind and temperature in Changtan Reservoir, which is a channel reservoir. The hydrodynamic conditions are complex and highly affected by the inflows. In order to analyze the influence of meteorology (especially rainfall and wind) on hydrodynamic conditions in CTR, several days in the three typical years were selected to analyze the contribution of the atmosphere to water age distribution.

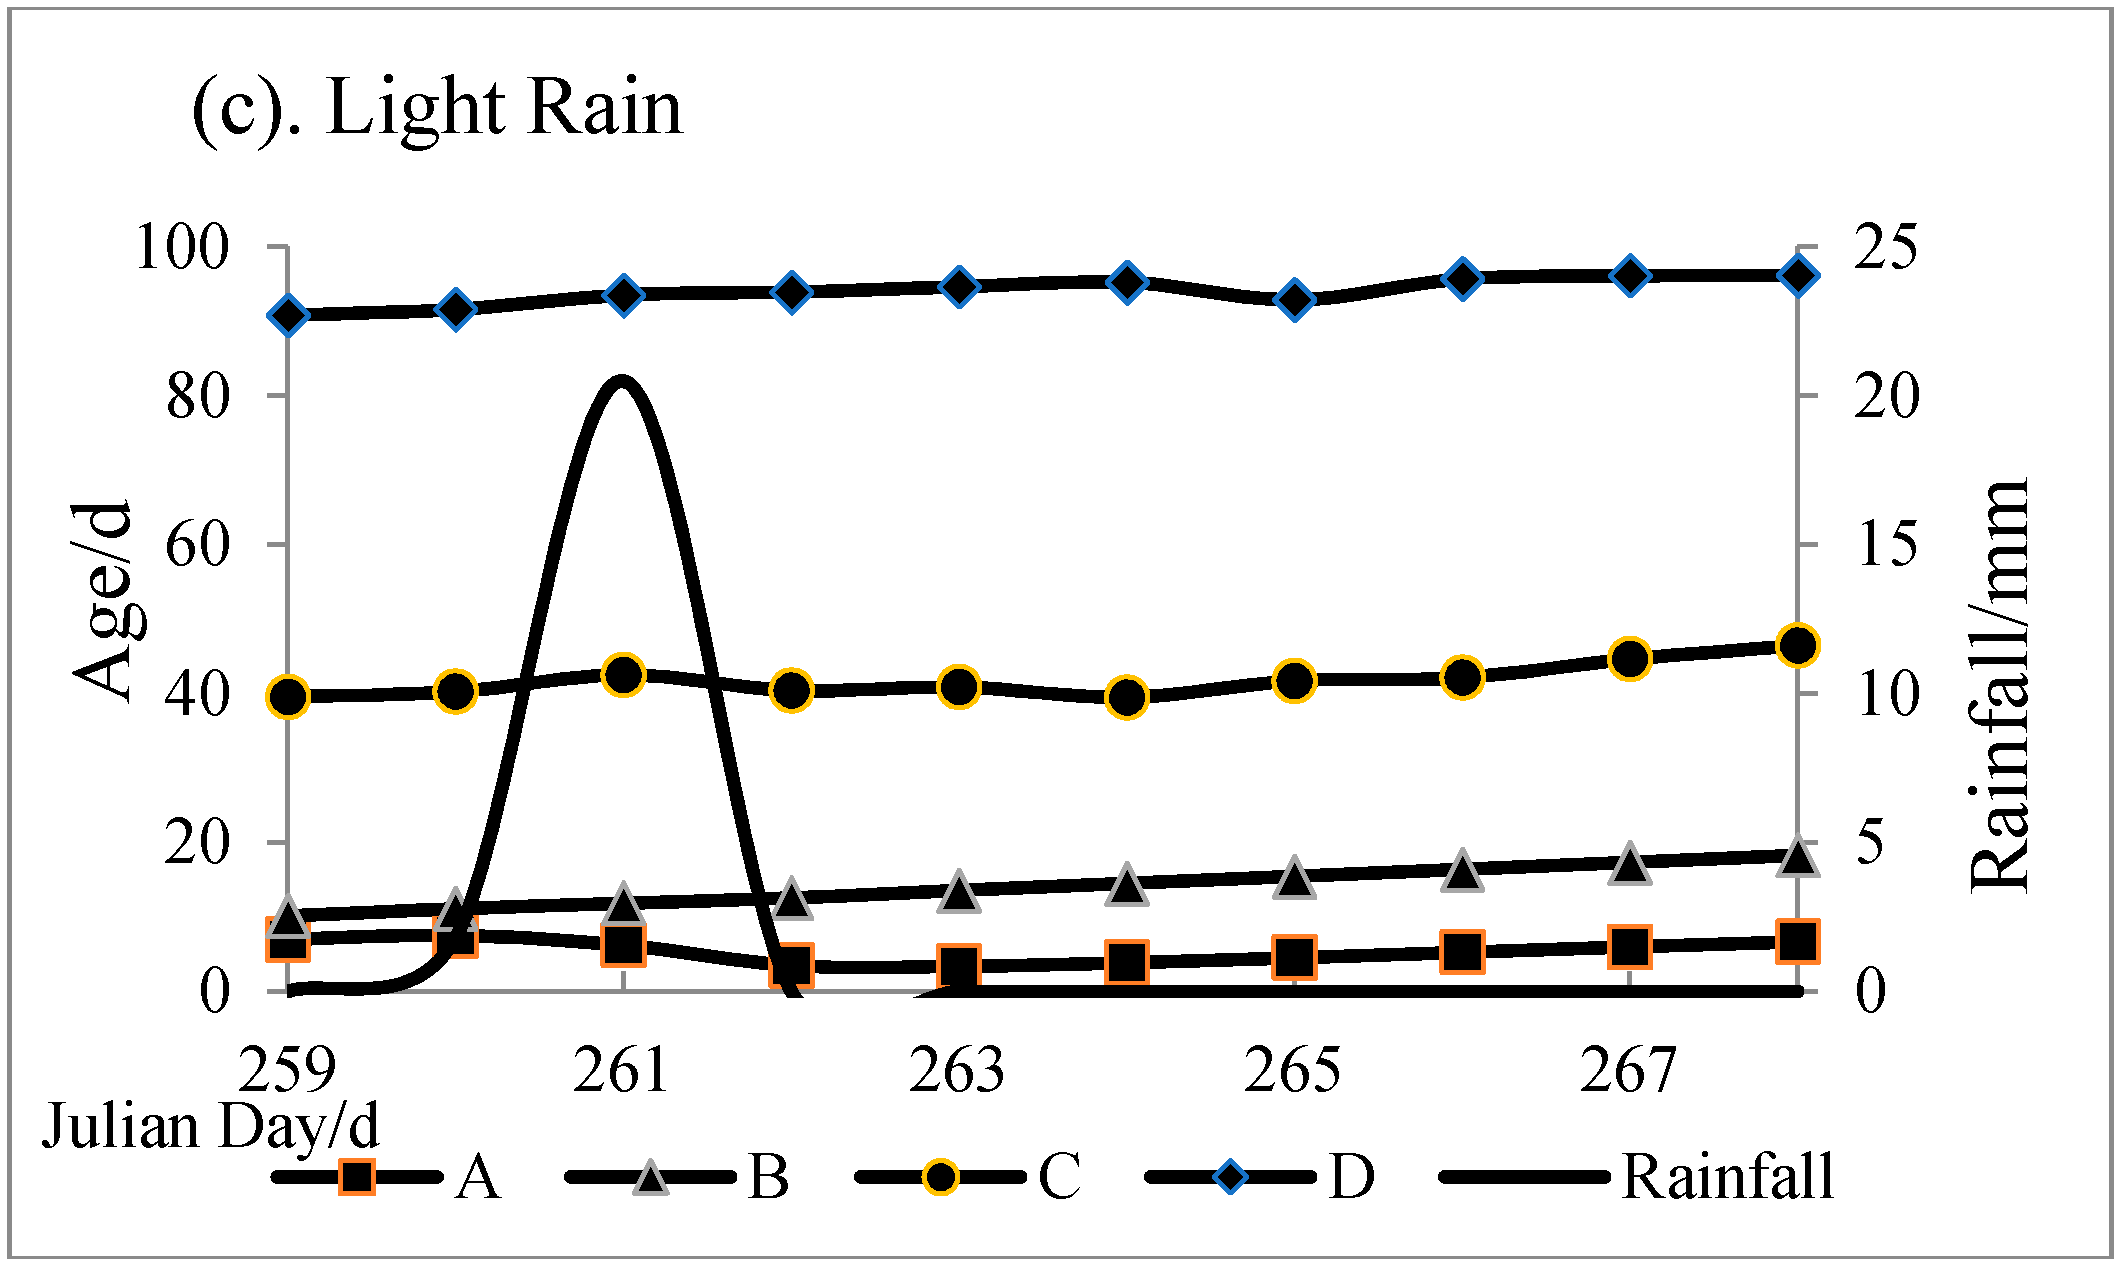
4.2.1. The Impact of Precipitation on Water Ages in CTR

According to the variation of rainfall and wind in the three typical years, three typical rainfall types were selected for analysis: (a) heavy rain from the 185th to 197th day in the wet year (3 July to 15 July in 1992); (b) moderate rain from 248th to 257th in wet year (4 September to 13 September in 1992); (c) light rain from 259th to 268th day in wet year (15 September to 24 September in 1992). Four representative points listed in Figure 1 in CTR were selected for analysis. Points A, B, C were located at tail, middle, and head areas of CTR respectively, while Point D was located at a tributary of CTR.
Water ages for different representative points and rainfalls during the corresponding period are listed in Figure 9. It can be seen that the water ages of CTR in all the four areas reduced substantially with a heavy rainfall, and the ages increased gradually after the rainfall (Figure 9a). However, the water age slightly changed at points A, B, and C with a moderate rain and was unchanged during a light rainfall in all areas. Water age of point A in the tail area and point B in the middle area decreased from 0.25 d to 0.03 d, and 2.63 to 0.17 d, respectively, when rainfall increased from 0 to 90 mm in the same day. Then ages at points A and B increased when rainfall stopped, and the response time for water age was in accordance with the rainy period. It was obvious that the response time at point C in the head area was delayed one day after the flush of rainfall. The main flow from upstream took one day to travel to point C. Water age of point D in the tributary was decreased to 2 d compared with points A and B. Comparing a moderate rain (Daily rainfall between 10 and 25 mm) with a heavy rain (Daily rainfall between 25 and 50 mm) (Figure 9b), water age of point A dropped from 7.5 to 0.3 d. However, water ages at points B and C decreased to 2 and 3 d respectively after the rainfall. Water age at point D seldom changed with a moderate rain. Compared to that in heavy rain, the response time at points B and C delayed by 2 d. In a light rain case, the decrease of water age only occurred at point A (the tail areas), and the decrement was less than that in the cases of heavy and moderate rains. Therefore, it was obvious that the water age was greatly dependent on rainfall intensity and channel distance. In addition, for the three typical years, the temporal and spatial distributions of water ages in the reservoir (Figure 8) showed that the ages in the main channel were lower than that in the tributary (location D). Therefore, water ages in the main channel were mainly affected by the flow from upstream, and the flow from tributaries only affected some areas near the river mouth.

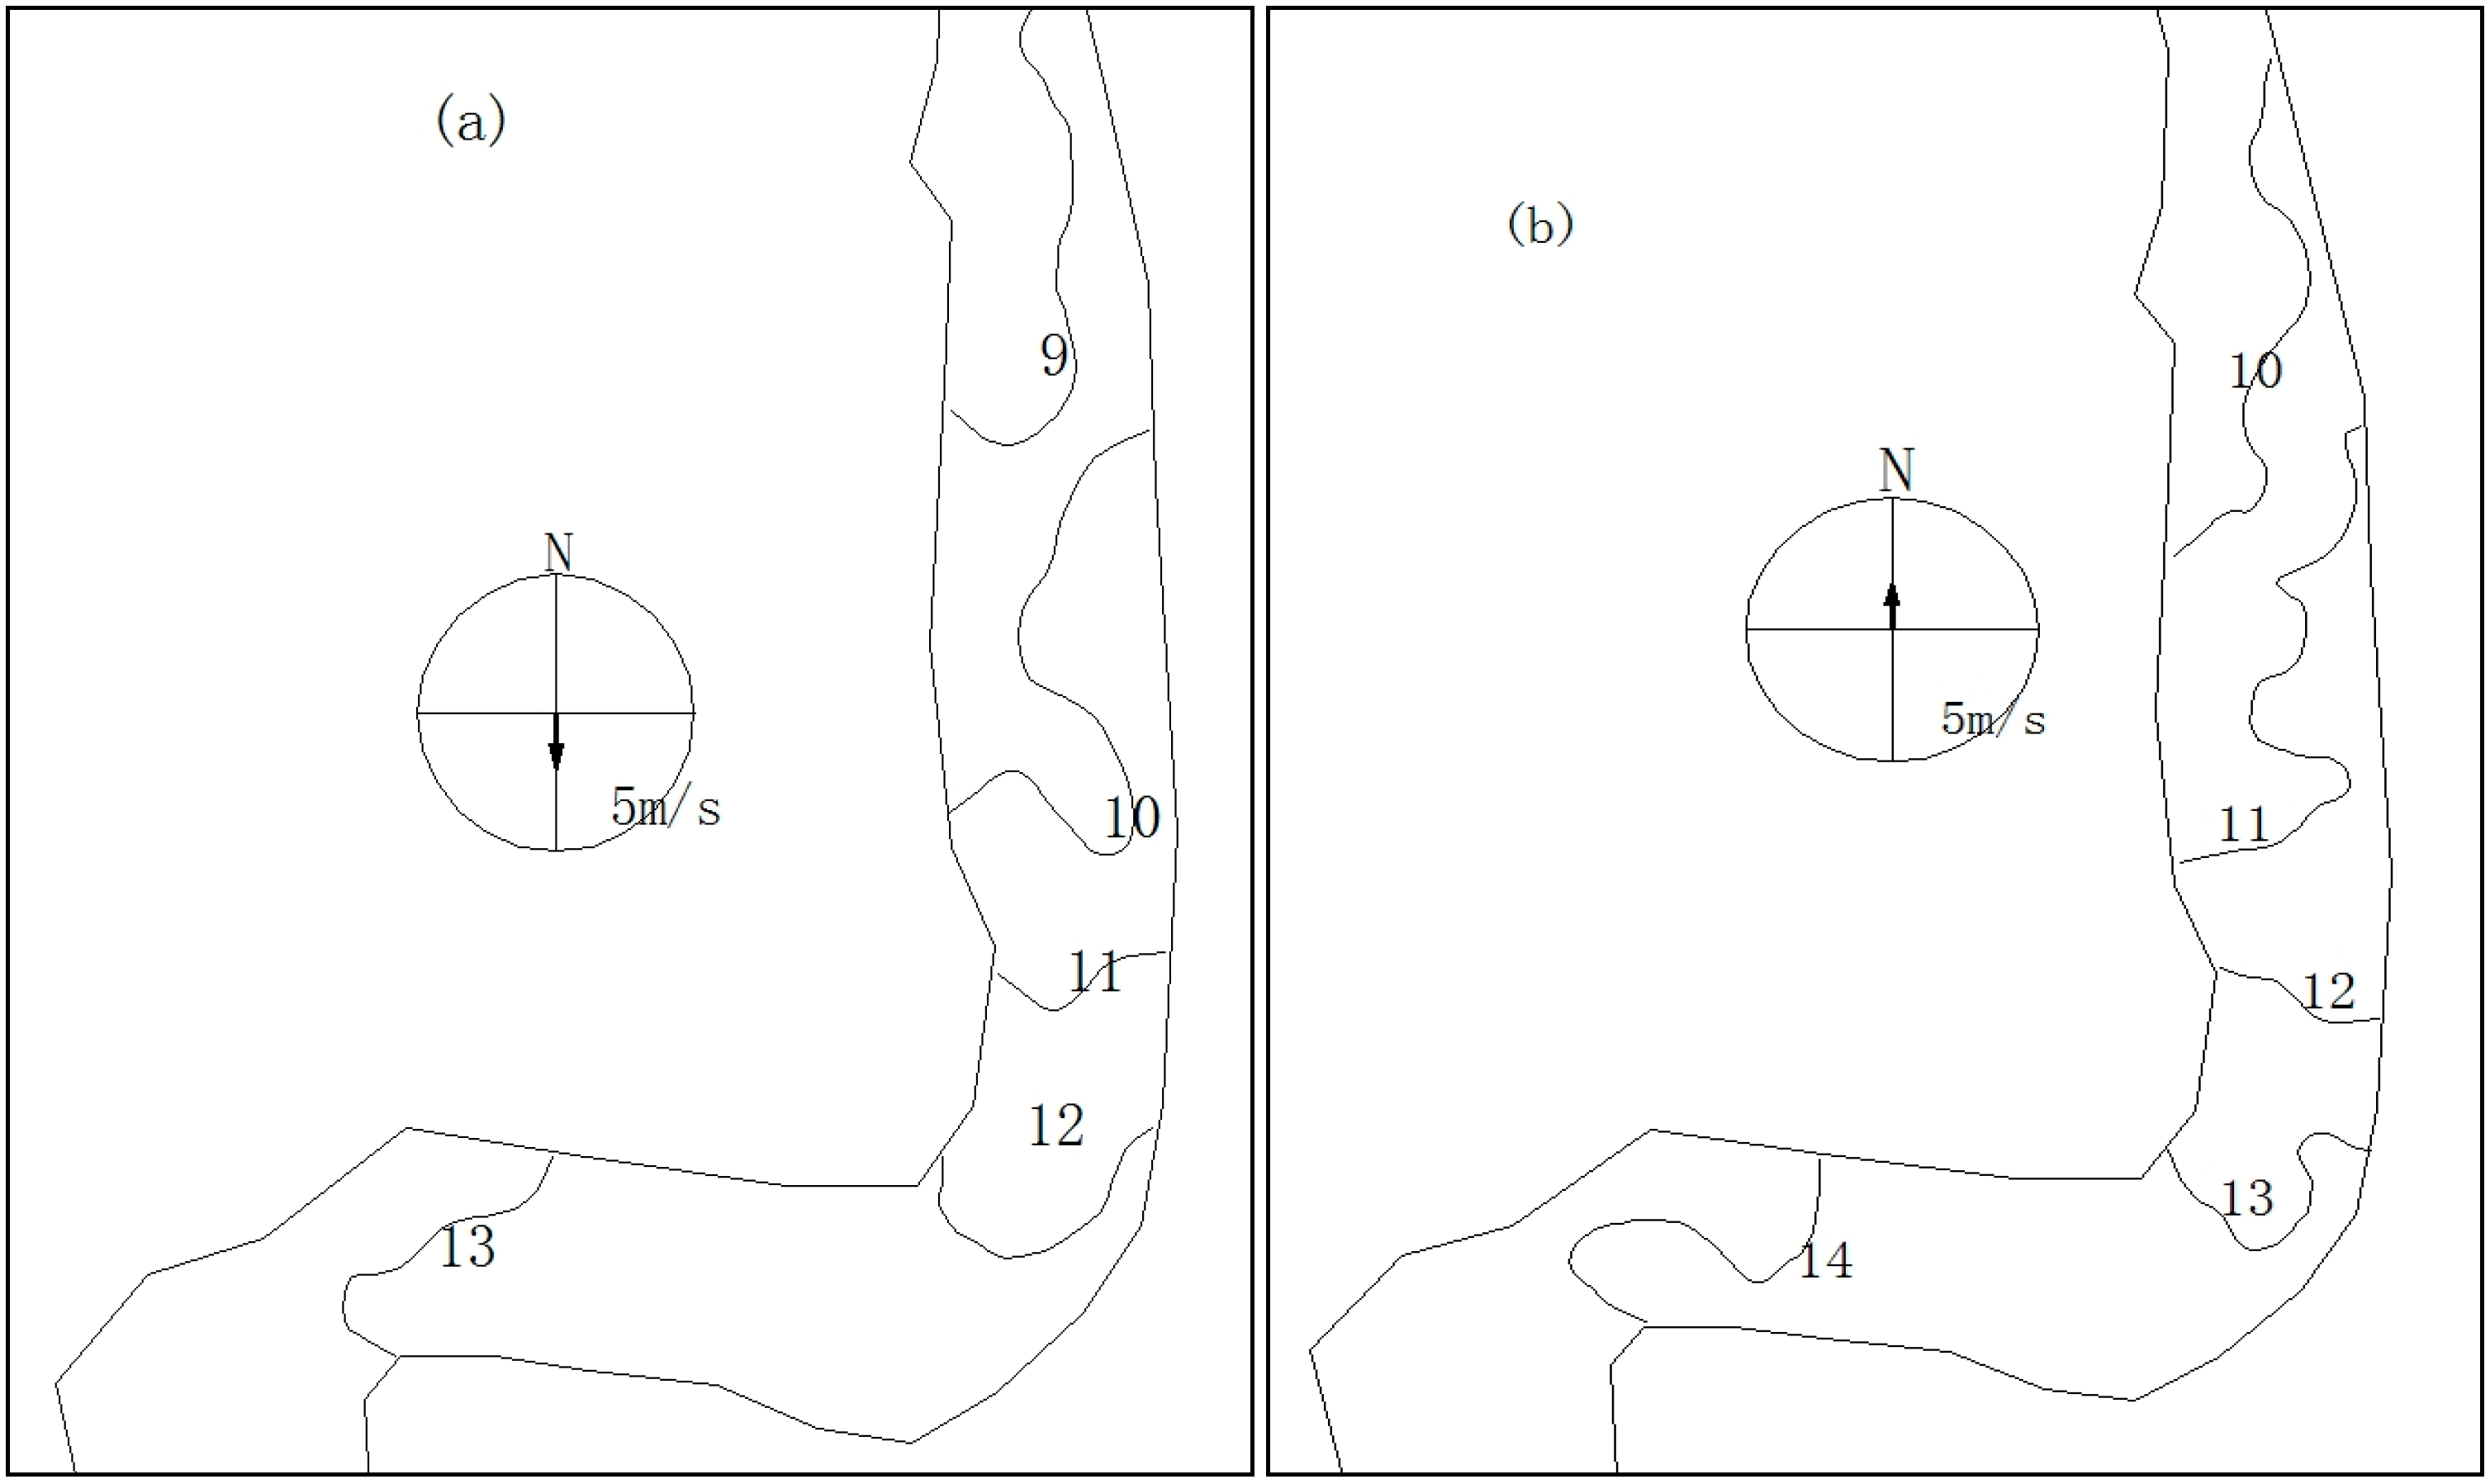
4.2.2. The Impact of Winds on Water Ages in CTR

Wind is also an important factor that can affect temporal and spatial variations of water age in the reservoir. In order to study the effect of winds on water age, the simulation results of water ages in two days in the dry year (3–4 September in 2004), based on the observed data, were selected for analysis. The average wind speed and prevailing wind direction were 2 m/s and from south for the first day (3 September), and 1.8 m/s and from north on the second day (4 September). No rainfall events occurred in these two days, hence rainfall effect was eliminated. The variation of water age within this period could be attributed to the winds. In CTR, the shape of tail area and middle area are long and narrow, while the head area widens gradually. For convenience, the water age at point A in the tail area and point C in the head area (see Figure 1) were selected to analyze the wind effect (Figure 10). The results showed that the impact of winds caused small variations in water age at the tail area (Figure 10a,b), and a relatively large variation at the head area (Figure 10c,d). Compared to the first day, water age in the second day decreased by 29% in the western part of the tail area, indicating that wind had some impact on the distribution of age in a wide area.

4.2.3. The Impact of Air Temperature and Humidity on Water Ages in CTR

Air temperature is an important weather factor effecting runoff. Temperature was considered during the simulation in both the watershed model and the hydrodynamic model. However, because of the greater variation of rainfall in the basin, the effect of temperature variations on runoff was imperceptible. The results also suggested that the variation of discharges and ages was significantly correlated to rainfall, and had nearly no relationship with temperature (Figure 5). Humidity did not affect rainfall and runoff according to our modeling results. Therefore, these weather variables (temperature and humidity) have little effect on water ages.

4.3. The Potential Area for the Risk of Algal Bloom in CTR

Usually, algal biomass (Chl-a) is lower under low water age—higher flow conditions and higher under higher water age—lower flow conditions. Therefore, water age (a measure of residence time) was chosen as the primary hydrologic variable to reflect algal biomass. Coveney et al. [35] reported that Chl-a increased until water age reached approximately 80 d in the lower St. Johns River, a freshwater river in Palatka, Florida, USA, but further increases in monthly mean water age resulted in little or no change in Chl-a concentration. Their definition of an algal bloom was a Chl-a concentration greater than 40 μg/L. Since CTR had similar characteristics, in terms of physical and chemical processes, as lower St. Johns River, 80 d was selected as the reference point for algal bloom growth. However, this value can be easily modified in analysis if a site-specific value is received from observation. From the spatial distribution of water ages in summer (Figure 7), we found that areas with a water age >80 d were located in the tributaries during the wet seasons, and in the head area and tributaries during the average and dry seasons. In general, the ages in downstream tributaries and reservoir bays were higher than those in the upstream channel, indicating that downstream tributaries and head area were the areas in the reservoir which were more susceptible to algal bloom or eutrophication. Using our approach, these areas can be more accurately delineated.

5. Discussion

5.1. The Impact of Weather Conditions on Reservoir Management

Rainfall intensity and catchment areas determine runoffs into a reservoir. When it experiences a heavy rainfall, concentration of nutrients in a reservoir would reach a peak in a short time due to high influx of pollutants. However, subsequent higher inflow would then reduce concentrations substantially. On the other hand, when it experiences a moderate or lighter rainfall, pollutants would stay longer in the reservoir, which would increase a risk of eutrophication and algal bloom. The same situation existed in CTR. During moderate rainfall, discharge from tributaries were lower and had a smaller impact on the hydrodynamic transportation, hence more attention should be paid to the flow discharge from the upstream for water quality management in reservoirs.
Winds had a limited impact on the water age variation in the channel reservoir in this study. When winds blew in the flow direction, the water age was lower. However, when wind blew in a direction opposite to the direction of the main flow, the water age was higher, which can result in higher risks of eutrophication or algal bloom in the reservoir.
Temperature did not have an obvious impact on the hydrodynamic conditions, but it is an important factor for algal growth. It should be noticed that temperature should be taken into consideration when selecting a threshold water age value for eutrophication.

5.2. Algal Bloom Response to Water Ages in Channel Reservoir

It was found that algal biomass (Chl-a) is lower when water age is lower and flow velocity is higher [27]. A possible explanation for this phenomenon is that phytoplankton in the reservoir could better utilize nutrients under long retention time to induce algal bloom. Furthermore, long retention times promote recycling of nutrients from sediments and nitrogen fixation if N is limited. In contrast, during short retention time–high flow periods, loading of nutrients in runoff is maximal but other constraints (such as light limitation) suppress the attainment of maximal algal standing stock, even with sufficient nutrient supply. In addition, a possible disconnect between nutrients and Chl-a could be better understood by examining short and long water age conditions separately. Relationships between algal biomass and water age could be complex because both coincident and antecedent flow conditions could affect algal growth. Algal blooms occurred annually during summers in CTR, although the magnitude and the exact timing varied. We suspect that these patterns are due to combined effects of annual and longer term oscillations in rainfall. The magnitude (and likely the duration) of summer algal blooms was related to summer water age.
In channel reservoirs, according to different residence times of the water body, flow behaves like both a river and a lake. Our study showed that temporal and spatial distributions of water age varied differently in different weather conditions, and the hydrodynamic transportation enhanced significantly in wet years. However, water age remained higher in the downstream tributaries and reservoir bays. Generally, it behaved like a river in the upstream and like a lake in the downstream area. Thus, more attention should be paid to the head areas for reservoir pollution control.

6. Conclusions

This study provides useful information for water exchange and transport processes in channel reservoirs, which will be helpful in understanding nutrient dynamics for controlling algal blooms. A coupled model involving the watershed model, SWAT, and the hydrodynamic model, EFDC, along with the concept of water age were applied to the Changtan Reservoir (CTR) to study the impact of weather conditions on the hydrodynamic processes and the potential consequence on water quality in the Changtan Reservoir (CTR). The concept of water age was applied to the CTR to assess the long-term transport timescales. The age calculation was formulated with the intention to provide spatial distributions of transport characteristics in a numerical model simulation. The results showed that water ages varied tremendously under different weather conditions. Rainfall was the dominant factor in controlling temporal and spatial distributions of water age. Wind has some impact on the distribution of age in the head areas, but it has limited impact on tributaries due to geometric features of the channel reservoir. Other weather conditions such as temperature and humidity had little effect on water age. In addition, water age was chosen as the primary hydrologic variable to reflect water exchange in the reservoir. The spatial distribution of water ages showed that the areas in the reservoir with high risks of algal bloom are located in the tributaries and the head area. This provides a simple approach to quantitatively estimate timing, area, and intensity of algae bloom in polluted water bodies. In addition, the coupled model combining a watershed model and a hydrodynamic model provides a useful approach for water quality prediction despite shortages of observed data.

Acknowledgments

The research was supported by the Ministry of Water Resources’ Special Funds for Scientific Research on Public Causes (Grant No. 201101020), Chinese National Science Foundation (51579071, 51379061, 41323001, 51539003), Jiangsu Province National Science Foundation (BK20131370), the Fundamental Research Funds for the Central Universities (2014B07314), and National Science Funds for Creative Research Groups of China (No. 51421006); the Innovation Program of Graduate Students in Jiangsu Province (2015B36614); the Priority Academic Program Development of Jiangsu Higher Education Institutions; the program of Dual Innovative Talents Plan and Innovative Research Team in Jiangsu Province, the Special Fund of State Key Laboratory of Hydrology-Water Resources and Hydraulic Engineering, and the Fundamental Research Funds for the Central Universities.

Author Contributions

Wei Du, Yiping Li, and Lei Hua conceived and designed the study. Chao Wang and Peifang Wang guided the operation of the models. Jingyu Wang, Ying Wang, Li Chen, Robert Bofah Buoh and Mercy Jepkirui performed the models. Wei Du and Lei Hua wrote the paper. Baozhu Pan, Yong Jiang, and Kumud Acharya reviewed and edited the manuscript. All authors read and approved the manuscript.

Conflicts of Interest

The authors declare no conflict of interest.

References

  1. Ficklin, D.L.; Luo, Y.Z.; Luedeling, E.; Zhang, M.H. Climate change sensitivity assessment of a highly agricultural watershed using SWAT. J. Hydrol. 2009, 374, 16–29. [Google Scholar] [CrossRef]
  2. Thodsen, H. The influence of climate change on stream flow in Danish rivers. J. Hydrol. 2007, 333, 226–238. [Google Scholar] [CrossRef]
  3. Kong, Y.L.; Pang, Z.H. Evaluating the sensitivity of glacier rivers to climate change based on hydrograph separation of discharge. J. Hydrol. 2012, 434–435, 121–129. [Google Scholar] [CrossRef]
  4. Liu, W.C.; Chen, W.B.; Hsu, M.H. Using a three-dimensional particle-tracking model to estimate the residence time and age of water in tidal estuary. Comput. Geosci. 2011, 37, 1148–1161. [Google Scholar] [CrossRef]
  5. Nyenje, P.M.; Foppen, J.W.; Uhlenbrook, S.; Kulabako, R.; Muwanga, A. Eutrophication and nutrient release in urban areas of sub-Saharan Africa—A review. Sci. Total Environ. 2010, 408, 447–455. [Google Scholar] [CrossRef] [PubMed]
  6. Kemp, W.M.; Boynton, W.R.; Adolf, J.E.; Boesch, D.F.; Boicourt, W.C.; Brush, G.; Cornwell, J.C.; Fisher, T.R.; Gilbert, P.M.; Hagy, J.D.; et al. Eutrophication of Chesapeake Bay: Historical trends and ecological interactions. Mar. Ecol. Prog. Ser. 2005, 303, 1–29. [Google Scholar] [CrossRef]
  7. Boynton, W.R.; Garber, J.H.; Summers, R.; Kemp, W.M. Inputs, transformations, and transport of nitrogen and phosphorus in Chesapeake Bay and selected tributaries. Estuaries 1995, 18, 285–314. [Google Scholar] [CrossRef]
  8. Wang, P.C.; Zhang, X.Q. Numerical study of water age influenced by tide and runoff in Daliaohe Estuary in China. J. Hydrodyn. 2013, 25, 39–47. [Google Scholar] [CrossRef]
  9. Xu, H.Z.; Lin, J.; Wang, D.X. Numerical study on pollutant transport in estuary based on age concept. Adv. Water Sci. 2009, 20, 92–98. (In Chinese) [Google Scholar]
  10. Shen, Y.M.; Wang, J.H.; Zheng, B.H.; Zhen, H.; Feng, Y.; Wang, Z.X.; Yang, X. Modeling study of residence time and water age in Dahuofang Reservoir in China. Sci. China Phys. Mech. Astron. 2011, 54, 127–142. [Google Scholar] [CrossRef]
  11. Ren, Y.H.; Lin, B.L.; Sun, J.; Pan, S.Q. Predicting water age distribution in the Pearl River Estuary using a three-dimensional model. J. Mar. Syst. 2014, 139, 276–287. [Google Scholar] [CrossRef]
  12. Gong, W.P.; Shen, J.; Hong, B. The influence of wind on the water age in the tidal Rappahannock River. Mar. Environ. Res. 2009, 68, 203–216. [Google Scholar] [CrossRef] [PubMed]
  13. Shen, J.; Wang, H.V. Determining the age of water and long-term transport timescale of the Chesapeake Bay. Estuar. Coast. Shelf Sci. 2007, 74, 585–598. [Google Scholar] [CrossRef]
  14. Wang, C.; Gao, Y.C.; Wang, P.F.; Zhang, S.H.; Hou, J.; Qian, J. Eutrophication and characteristics of phytoplankton distributions in Changtan Reservoir, Guangdong Province. J. Lake Sci. 2013, 25, 749–755. [Google Scholar]
  15. Arnold, J.G.; Srinivasan, R.; Muttiah, R.R.; Williams, J.R. Large area hydrologic modeling and assessment part I: Model development. J. Am. Water Resour. Assoc. 1998, 34, 73–89. [Google Scholar] [CrossRef]
  16. Neitsch, S.L.; Arnold, J.G.; Kiniry, J.R.; Williams, J.R. Soil and Water Assessment Tool, Theoretical Documentation: Version 2005; USDA Agricultural Research Service and Texas A&M Blackland Research Center: Temple, TX, USA, 2005.
  17. Neitsch, S.L.; Arnold, J.G.; Kiniry, J.R.; Williams, J.R. Soil and Water Assessment Tool, Input/Output File Documentation, Version 2009; Technical Report 365; Texas Water Resources Institute, Texas A&M University: College Station, TX, USA, 2011. [Google Scholar]
  18. Bijan, D.; Shimelis, G.S. Combined 3D hydrodynamic and watershed modelling of Lake Tana, Ethiopia. J. Hydrol. 2011, 398, 44–64. [Google Scholar]
  19. Hamrick, J.M. A Three-Dimensional Environmental Fluid Dynamics Computer Code: Theoretical and Computational Aspects; Special Report No. 317 in Applied Marine Science and Ocean Engineering; Virginia Institute of Marine Science: Gloucester Point, VA, USA, 1992; p. 64. [Google Scholar]
  20. Hamrick, J.M. Application of the EFDC, Environmental Fluid Dynamics Computer Code to SFWMD Water Conservation Area 2A; Report JMH-SFWMD-94-01; J.M. Hamrick and Associates: Williamsburg, VA, USA, 1994; p. 126. [Google Scholar]
  21. Hamrick, J.M. User’s Manual for the Environmental Fluid Dynamics Computer Code; Special Report No. 331 in Applied Marine Science and Ocean Engineering; Virginia Institute of Marine Science: Gloucester Point, VA, USA, 1996. [Google Scholar]
  22. Craig, P.M. User’s Manual for EFDC_Explorer: A Pre/Post Processor for the Environmental Fluid Dynamics Code; Dynamic Solutions-International, LLC: Knoxville, TN, USA, 2011. [Google Scholar]
  23. Ji, Z.G.; Hu, G.D.; Shen, J.A.; Wan, Y.S. Three-dimensional modeling of hydrodynamic processes in the St. Lucie Estuary. Estuar. Coast. Shelf Sci. 2007, 73, 188–200. [Google Scholar] [CrossRef]
  24. Li, Y.P.; Tang, C.Y.; Wang, C.; Anim, D.O.; Yu, Z.B.; Acharya, K. Improved Yangtze River Diversions: Are they helping to solve algal bloom problems in Lake Taihu, China? Ecol. Eng. 2013, 51, 104–116. [Google Scholar] [CrossRef]
  25. Delhez, E.J.M.; Campin, J.M.; Hirst, A.C.; Deleersnijder, E. Toward a general theory of the age in ocean modelling. Ocean Model. 1999, 1, 17–27. [Google Scholar] [CrossRef]
  26. Deleersnijder, E.; Campin, J.M.; Delhez, E.J.M. The concept of age in marine modelling: I. Theory and preliminary model results. J. Mar. Syst. 2001, 28, 229–267. [Google Scholar] [CrossRef]
  27. Mellor, G.L.; Yamada, T. Development of a Turbulence Closure-Model for Geophysical Fluid Problems. Rev. Geophys. 1982, 20, 851–875. [Google Scholar] [CrossRef]
  28. Galperin, B.; Kantha, L.H.; Hassid, S.; Rosati, A. A Quasi-Equilibrium Turbulent Energy-Model for Geophysical Flows. J. Atmos. Sci. 1988, 45, 55–62. [Google Scholar] [CrossRef]
  29. Mellor, G.L.; Ezer, T.; Oey, L.Y. The Pressure Gradient Conundrum of Sigma Coordinate Ocean Models. J. Atmos. Ocean. Technol. 1994, 11, 1126–1134. [Google Scholar] [CrossRef]
  30. HydroQual Inc. A Primer for ECOMSED, Version 1.2: User Manual; HydroQual, Inc.: Mahwah, NJ, USA, 2001; p. 179. [Google Scholar]
  31. Risbey, J.S.; Entekhabi, D. Observed Sacramento Basin streamflow response to precipitation and temperature changes and its relevance to climate impact studies. J. Hydrol. 1996, 184, 209–233. [Google Scholar] [CrossRef]
  32. Li, Y.P.; Tang, C.Y.; Zhu, J.T.; Pan, B.Z.; Anim, D.O.; Ji, Y.; Yu, Z.B.; Acharya, K. Parametric uncertainty and sensitivity analysis of hydrodynamic processes for a large shallow freshwater lake. Hydrol. Sci. J. 2015, 60, 1078–1095. [Google Scholar] [CrossRef]
  33. Li, Y.P.; Qiu, L.; Tang, C.Y.; Bu, M.S.; Tian, W.; Yu, Z.B.; Acharya, K. Uncertainty and sensitivity analysis of input conditions in large shallow lake hydrodynamic model. China Environ. Sci. 2014, 34, 410–416. [Google Scholar]
  34. Li, Y.P.; Acharya, K.; Chen, D.; Stone, M. Modeling water ages and thermal structure of Lake Mead under changing water levels. Lake Reserv. Manag. 2010, 26, 258–272. [Google Scholar] [CrossRef]
  35. Coveney, M.F.; Hendrickson, J.C.; Marzolf, E.R.; Fulton, R.S.; Di, J.J.; Neubauer, C.P.; Dobberfuhl, D.R.; Hall, G.B.; Paerl, H.W.; Phlips, E.J. Plankton; Technical Report; St. Johns River Water Management District: Palatka, FL, USA, 2011; pp. 8–46. [Google Scholar]
Figure 1. The map of CTR watershed and study area (Numbers 1–8 represent the tributaries, A–D represent the locations for analysis), Changxin Dam on the upstream is the tail area and Changtan Dam on the downstream is the head area in Changtan Reservoir.
Water 08 00372 g001
Figure 2. Time series of daily rainfall (a); temperature (b); winds (c); and humidity (d) from 1 January 2010 to 31 May 2011 nearby CTR (The base time for Julian date in all figures in this paper was 1 January 2010).
Water 08 00372 g002
Figure 3. The results for calibration and validation of water elevation in CTR: (a) Calibration; (b) Validation.
Water 08 00372 g003
Figure 4. Time series of daily rainfall (a); temperature (b); humidity (c); and wind forcing (d) in the years of 1992, 1988, and 2004 nearby CTR.
Water 08 00372 g004
Figure 5. The simulated daily water age in the years of 1992, 1988, and 2004 in CTR.
Water 08 00372 g005
Figure 6. Time series of simulated water age in the years of wet (a), average (b), and dry (c) in CTR.
Water 08 00372 g006aWater 08 00372 g006b
Figure 7. Time series of water age in different typical years, about 200 m far away from CTR dam. (a) the spatial distribution of water ages in wet year; (b) the spatial distribution of water ages in average year; (c) the spatial distribution of water ages in dry year.
Water 08 00372 g007
Figure 8. Monthly rainfall (a); temperature (b); discharge (c); and water age (d) in different years.
Water 08 00372 g008
Figure 9. Water ages at the point C (shown in Figure 1) and rainfall: (a) a heavy rain; (b) a moderate rain; (c) a light rain.
Water 08 00372 g009aWater 08 00372 g009b
Figure 10. Temporal and spatial distribution of water age in two days with opposed wind directions: (a) north wind in tail areas; (b) south wind in tail areas; (c) north wind in head area; (d) south wind in head area.
Water 08 00372 g010aWater 08 00372 g010b
Table 1. Main parameters of watershed hydrological model.
ParameterDefinitionValue
SURLAGSurface runoff lag coefficient0
ESCOSoil evaporation compensation factor0.95
AWCAvailable water capacity of the soil layer0.12
GW_REVAPGroundwater “revap” coefficient0.8
RCHRG_DPDeep aquifer percolation fraction0.35
GW-ALPHABase flow recession constant0.1
MSK_XMuskingum Method weighting factor0.2
Table 2. Main parameters of hydrodynamic model.
ParameterDefinitionValue
Z0Bottom roughness height (m)0.02
AHOConstant Horizontal Momentum and Mass Diffusivity (m2 s−1)1.0
AHDDimensionless Horizontal Momentum Diffusivity0.2
AVOBackground, Constant or Molecular Kinematic Viscosity (m2 s−1)0.001
ABOBackground, Constant or Molecular Diffusivity (m2 s−1)1 × 10⁻⁹
AVMNMinimum Kinematic Eddy Viscosity (m2 s−1)1 × 10⁴
ANMinimum Eddy Diffusivity (m2 s−1)1× 10⁸
WSCWind shelter coefficient1.0

