1. Introduction
The Fenhe River basin is an important area of Shanxi Province, China, with well-developed agriculture and centralized industry. With fertile soil and advanced irrigation, it has been an advantageous region for the growing of crops and cotton since ancient times. The irrigation area in the Fenhe River basin accounts for approximately 43.1% of Shanxi Province, and according to Main Functional Area Planning in China, the Fenhe River basin is an important part of the “seven district and twenty-three zones” in the national agricultural development strategy. In addition, it has an important role as a national energy and heavy chemical industrial base due to a rich coal seam. The mechanical and electronic industries in the basin have made rapid progress as a result of Western Development policies. Based on the Shanxi Statistical Yearbook, the coal produced in Shanxi Province supplies approximately 26 provinces and cities nationwide, accounting for approximately 70% of the nation’s actual deployment, and a large proportion of this coal is produced in the Fenhe River basin. From the perspective of food security and new industrialization, the Fenhe River basin holds a significant strategic position, connecting eastern and western China. However, the basin is not endowed with sufficient water resources, which restrains the development of the national economy. Since ancient times, drought events have occurred often in the Fenhe River basin, resulting in almost nine years of drought in every ten years. Continuous severe droughts have resulted in a barren and desolate environment. In addition, some fields in the area were used as burial grounds after events such as the great famine (1876–1878) in the Qing Dynasty, which was catastrophic for the people of Shanxi. With the additional influence of climate change and human activities, droughts are expected to become more widespread and more frequent. The extent of the damage and loss is also expected to increase. Therefore, to improve the economic and social development of this region, it is crucial to study the impacts of water scarcity on crop production, quality of life, and the ecological environment, and then propose strategies for coping with the frequent droughts in the Fenhe River basin. This is also necessary for guaranteeing food security and a healthy ecosystem.
Many studies have been performed on the impacts of drought. Research has focused on the impacts of drought on several aspects of the socio-economic and ecological systems in many areas of the world [
1]. Regarding the impacts of drought on socio-economic systems, researchers have distinguished droughts as a type of natural hazard and studied the associated impacts on capital and economic growth, specific sectors (such as agriculture and livestock farming, energy and industry, public water supply, etc.), households, and governments based on conceptual frameworks [
2], logistic regression models [
3], and economics analyses (such as income diversification, asset disposal, and loans/transfers) [
4]. In terms of the economic impact, studies of the effects on agriculture and domestic life are relatively common. For example, some researchers analyzed the effects of drought on rural livelihoods with an emphasis on the mediating role of household assets on the relationship between drought and livelihood outcomes using a sustainable livelihood approach [
5]. Other researchers analyzed the impact of drought on crops using a photosynthesis model approach [
6]. Regarding the impacts of drought on ecological systems, many studies have focused on the effect of water scarcity on the ecological environment, including studies of aquifers [
7], vegetation activity [
8], and biological species evolution [
9]. Additionally, remote sensing, multi-scale drought indicators or vegetation indexes, and hydrological models have been used for similar analyses [
10]. In terms of the ecological impact, many studies have focused on the impacts of drought on vegetation activity, especially forest growth. For example, some researchers have analyzed the impact of drought on tropical forests and found that droughts can weaken the tropical forest carbon sink, with resulting feedbacks related to future climate change [
11]. Other researchers studied the impact of a severe drought on tree growth, phenology, and net photosynthetic rate [
12] and used health and monitoring data to analyze the drought impact on forest growth and mortality [
13]. However, the impacts of drought on socio-economic and ecological systems are complicated, and further research is required. Moreover, drought impacts vary in different regions based on the actual regional scenarios and conditions.
This study determines drought characteristics in the Fenhe basin based on long-term meteorological and hydrological data. Moreover, the personal and financial effects of drought, as well as the impact on the ecological environment, are also investigated. Then, corresponding countermeasures are proposed, including engineering constructions and management systems.
2. Study Area and Data
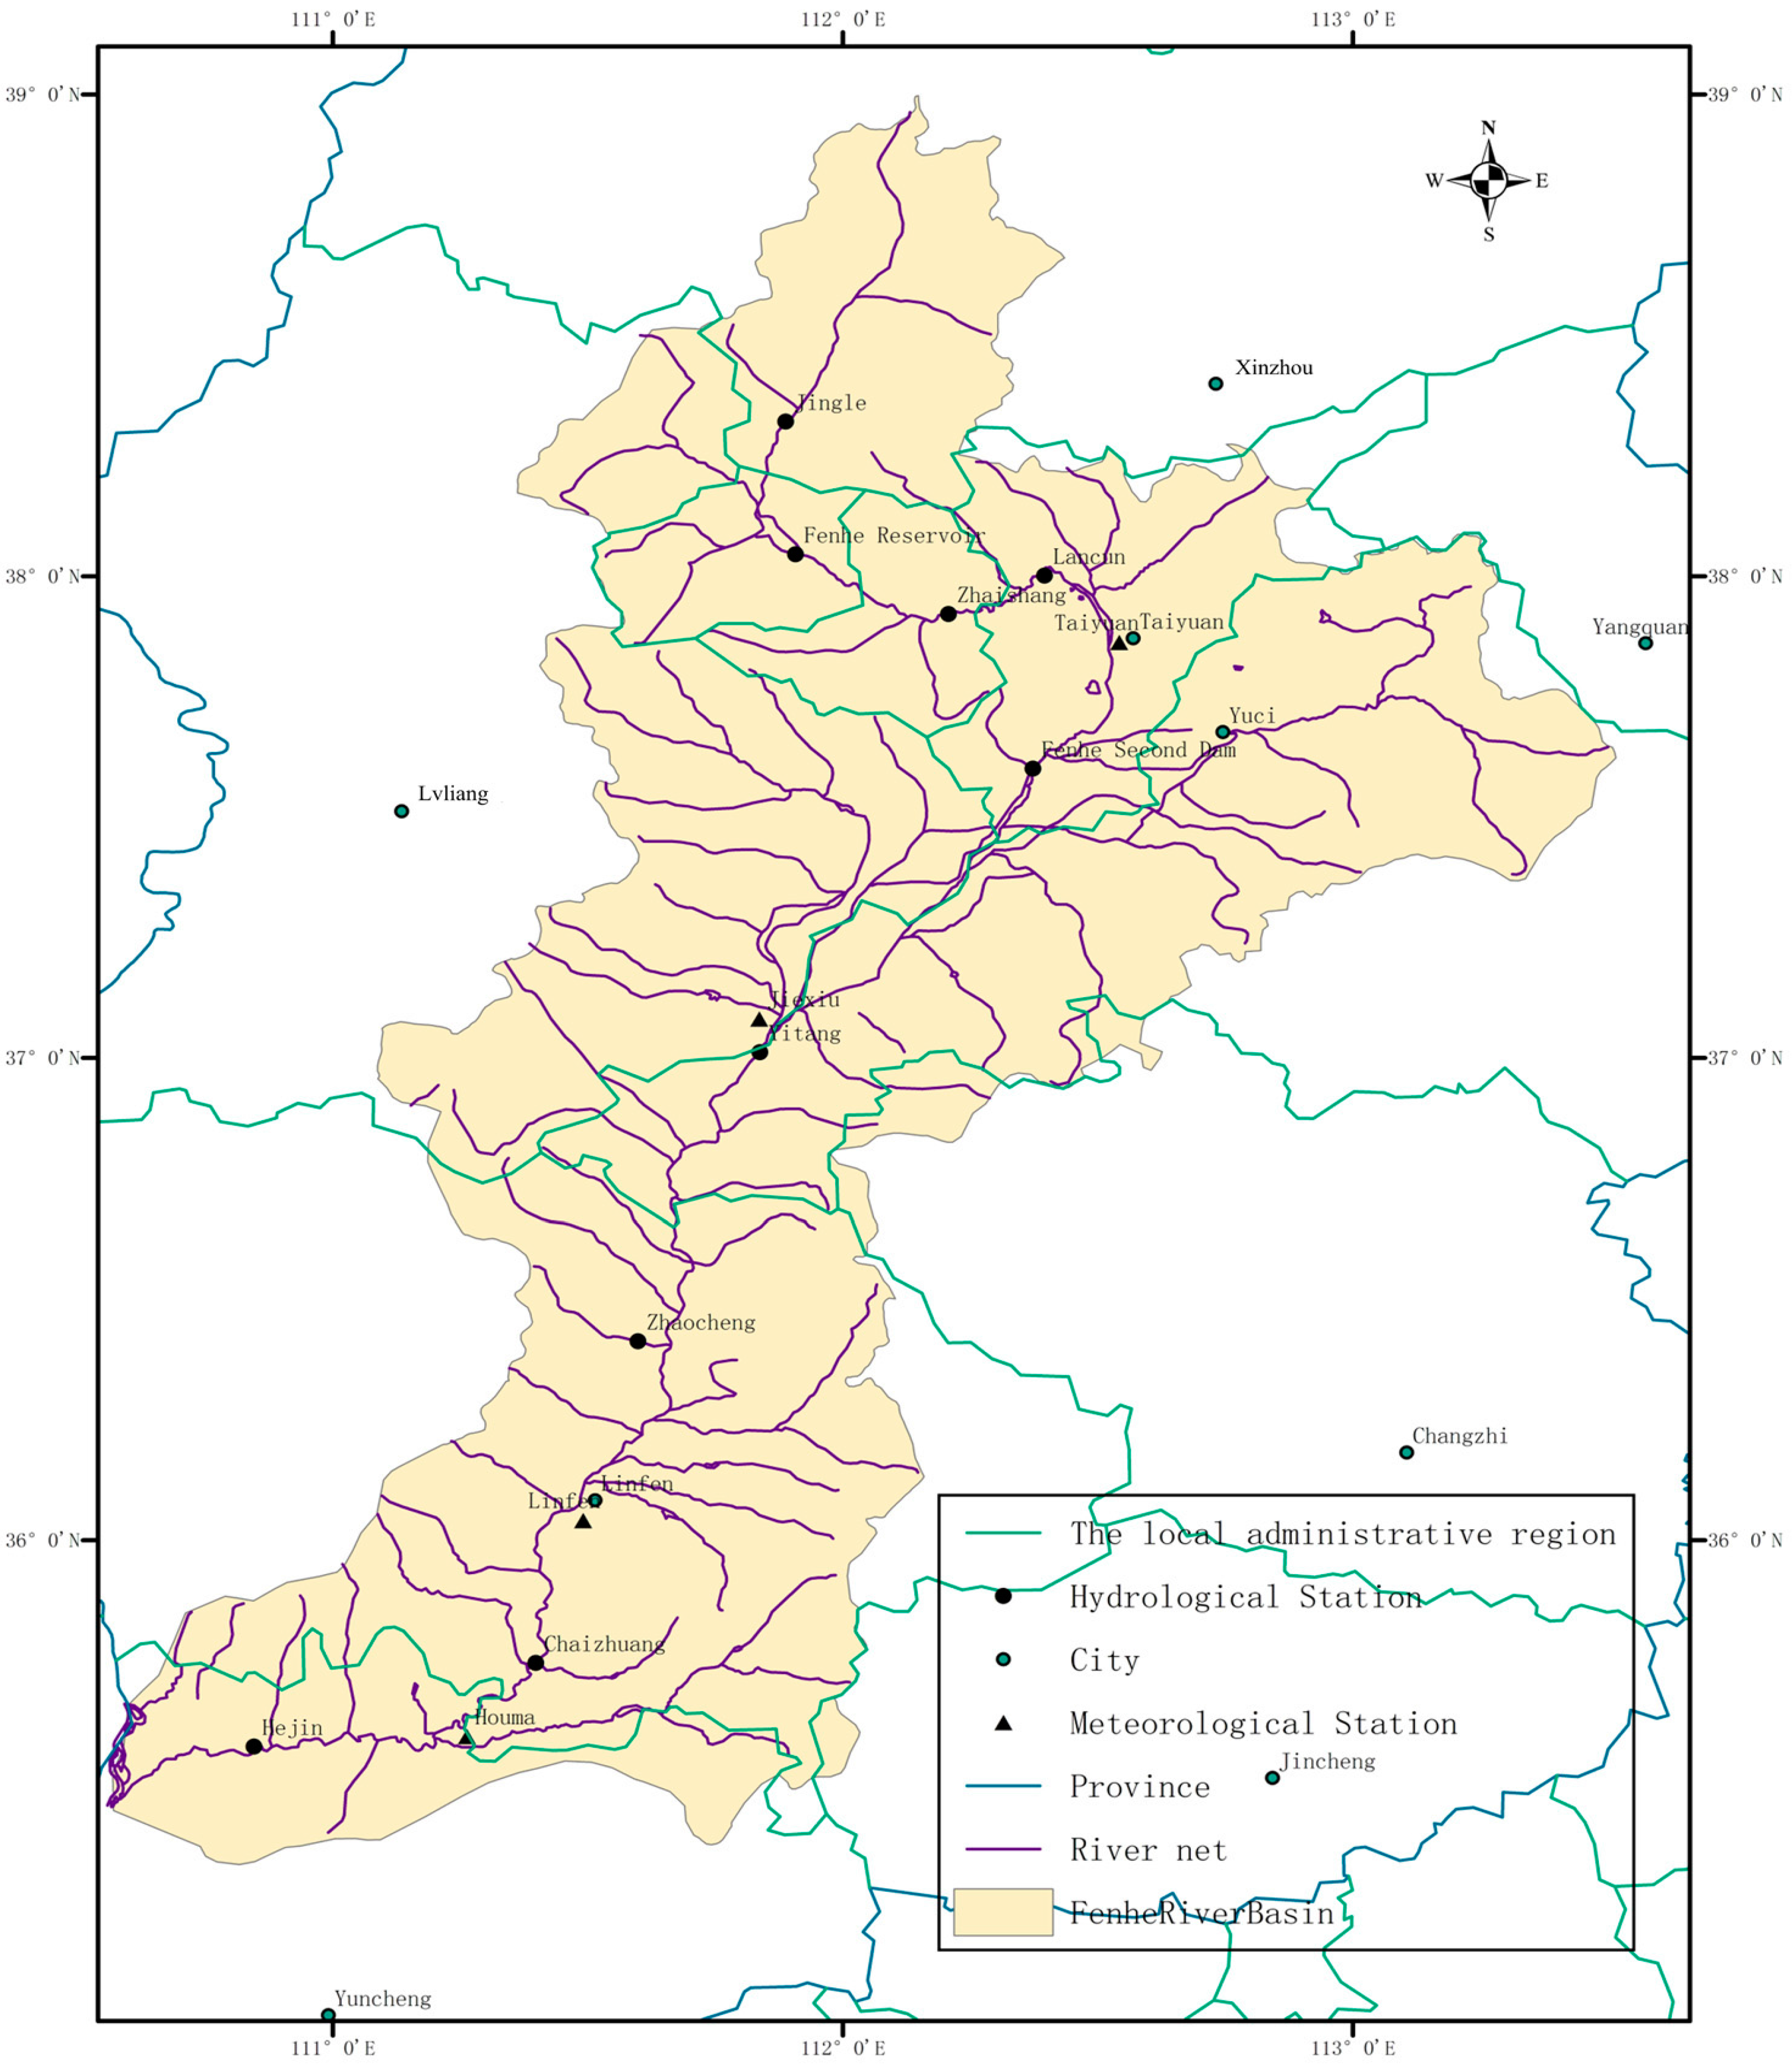
The Fenhe River, located in the center and southwest of Shanxi, is the largest river in Shanxi Province, as well as the second largest tributary of the Yellow River. There are several cities located within the Fenhe River basin, including Taiyuan, Xinzhou, Luliang, Jinzhong, Linfen, and Yuncheng. The basin covers a total area of 39,826 km
2, accounting for 25.3% of the total area of Shanxi, as shown in
Figure 1. The total population accounts for 39% of the whole province and the basin contributes 45% of the gross national product of Shanxi.
Data on meteorology, hydrology, ecology, droughts, and floods, as well as on society and the economy, were used in this study. Detailed information regarding historic drought events that occurred in the basin between 150 BC and 2012 was obtained from the Shanxi Provincial Department of Flood and Drought Disaster Board [
14], the Drought Disasters Editorial Board in the Yellow River Basin [
15] and the Yellow River Water Resources Bulletin [
16]. To evaluate meteorological and hydrological conditions, time series of annual precipitation data from four meteorological stations (Taiyuan, Jiexiu, Linfen, and Houma) were collected from the Shanxi Provincial Meteorological Center. The data periods of these four stations were as follows: Taiyuan 1951–2011, Jiexiu and Linfen 1954–2011, and Houma 1991–2010. In addition, from the Shanxi Provincial Bureau of hydrology and water resources, the annual runoff of the main stream of the Fenhe River was measured at the Jingle hydrological station from 1956 to 2005, average monthly runoff data were collected at the major hydrological stations from 1997 to 2006 (Zhaishang hydrological station, Fenhe reservoir, Lancun hydrological station, Fenhe second dam, Yitang hydrological station, Zhaocheng hydrological station, Chaizhuang hydrological station, and Hejin hydrological station), and data on the major karst springs were collected. Moreover, regional socio-economic information for 1997–2012 was collected (some data were only for 2012) from the
Shanxi Statistical Yearbook [
17], including the agricultural planting structure, crop yield, farmer incomes, industrial output values, and the water supply situation. In addition, remote sensing data for the 8 km NDVI (Normalized Difference Vegetation Index) of GIMMS (Global Inventory Modeling and Mapping Studies) was gathered from the long-term vegetation index dataset of China provided by the National Science Foundation of China and Western China Environment and Ecology Science Data Centre [
18]. This included NDVI data for 1982–2006, which had a temporal resolution of 15 days and a spatial resolution of 8 km.
3. Study Methods
This study examined the influence of droughts in the Fenhe River basin on food security, energy security, the ecological environment, and social stability. Moreover, coping strategies were proposed to aid in the prevention and control of droughts in the arid and semi-arid areas of China. The following main methods were used.
(1) History of Droughts. Based on a survey of historic drought events, the degree of influence of the drought events were analyzed using historical data, and a drought map of the basin was produced.
(2) Characteristics of Droughts. To analyze the features of meteorological droughts, the moving average and Mann–Kendall trend analysis methods were adopted.
The moving average method is the most basic technique for trend fitting. The method is equivalent to a low pass filter, and it reflects trend variations using smoothed values of the time series.
For time series analysis, the Mann–Kendall (MK) test is a non-parametric statistical test method recommended by the World Meteorological Organization (WMO) [
19]. The advantage of this method is that samples do not need to fit a certain distribution; thus, the calculation is not affected by individual outliers and is more convenient. Assuming that H is a time series (
,...
) of
n independent random variables with the distribution of samples, based on a bilateral inspection, for all
k or
j n and
k j, the distributions of
and
are not the same.The formula for the statistical variables
S is as follows:
where
S is the normal distribution with a mean of 0 and variance
Var(S) =
n(
n − 1)(2
n + 5)/18. When
n > 10, the standard normal statistical variables can be calculated using the following formula.
At a given confidence level
, if
, the former hypothesis does not hold; thus, the time series is characterized by an obvious upward or downward trend. If the statistical variableis greater than 0, the trend is increasing; if the value is less than 0, the trend is decreasing. Additionally, when the absolute value of
is greater than or equal to 1.28, 1.64 or 2.32, the trends have passed the significance test at confidence levels of 90%, 95% and 99%, respectively [
20].
The trend analysis was used to determine the trend of annual precipitation for Taiyuan, Jiexiu, Linfen, and Houma stations. Moreover, runoff data were analyzed to study the characteristics of hydrological droughts.
(3) Drought Mechanisms. Based on the analyses of natural geographical, hydrological and meteorological conditions in the Fenhe River basin and considering the influence of human activities, the cause of droughts can be summarized using five factors: terrain, climate, water resources, water conservation facilities, and human activities. Among these factors, terrain, climate and water resources are important background conditions in the Fenhe River basin, while water conservation facilities and human activities reflect the effects of human activities on the background conditions.
(4) Anthropogenic Effects of Droughts. Socio-economic data, including agricultural, industrial, and domestic data, were analyzed to determine how production and daily life are affected by droughts.
(5) Effect of Droughts on the Ecological Environment. For the surface water ecosystem, the effects of drought were analyzed for rivers, wetlands, and slope ecosystems. Because the long-term vegetation index is a powerful tool for analyzing changes in ecological and climatic processes [
21,
22], remote sensing data of GIMMS NDVI were used to determine the effects on slope ecosystems.
4. Results
4.1. History of Droughts
This study adopts the definition of drought from the
Meteorological Disasters Dictionary of China: Shanxi volume [
23], which states that long periods with no rain or little rain, air drying, and soil moisture dissipation can cause severe water deficits in plants; poor plant growth; plant wilting, curling, or death; crop yield reduction; and even crop failure. When serious, droughts can cause reservoirs and rivers to dry up and groundwater levels to decline, thereby limiting the amount of drinking water available for humans and livestock and affecting all aspects of socio-economic activities. Long-term drought can also lead to the excessive exploitation of groundwater, which can increase desertification and cause environmental deterioration. Because a large number of historical documents lack quantitative records, instead providing qualitative descriptions, this study combines the specific circumstances in the Fenhe River basin and qualitative descriptions from historical documents to study historical drought, including drought formation, duration, intensity and scope.
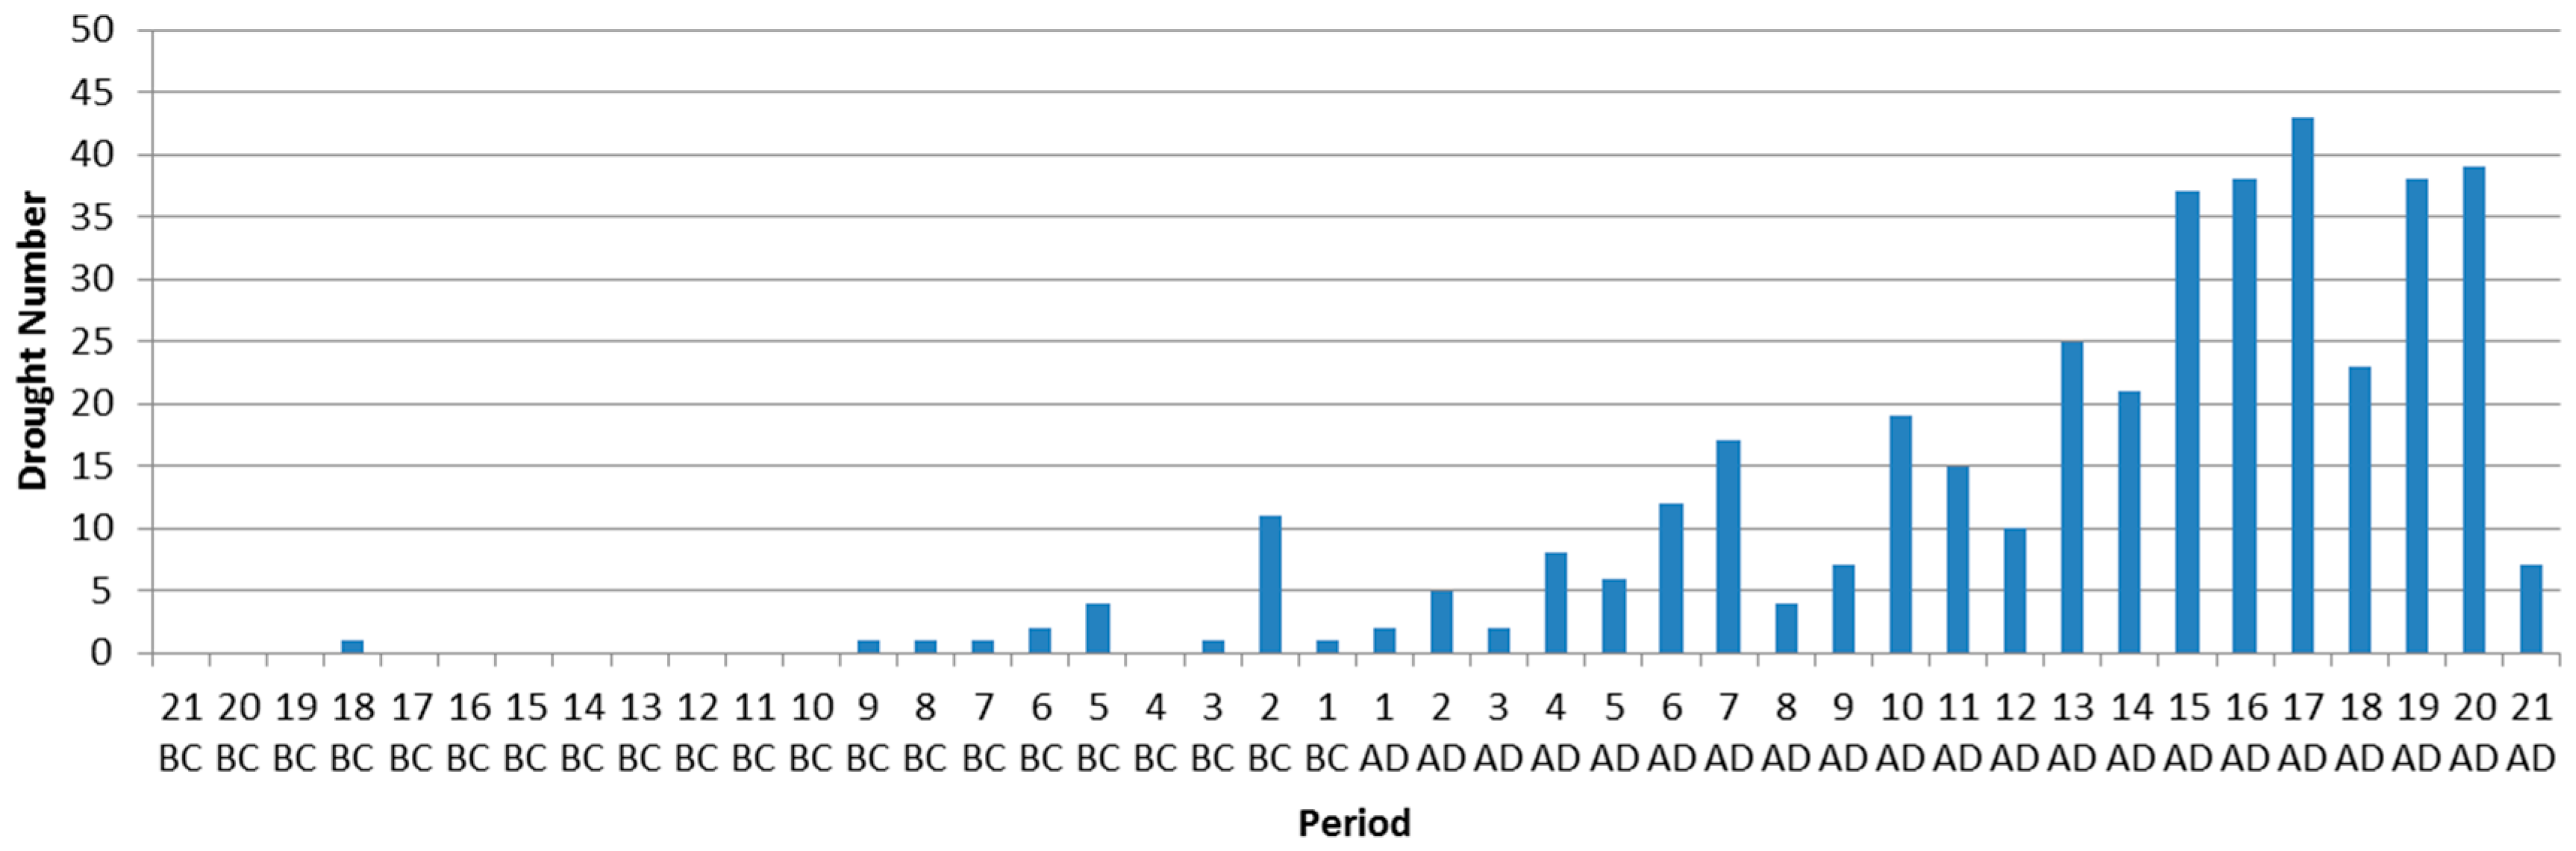
Historical drought event data for the basin [
14,
15,
23,
24,
25,
26] from the 18th century BC to 2012 show that 23 droughts and extreme drought events occurred before Christ, 371 events occurred between 1 AD and 2000, and seven events occurred between the beginning of the 21st century and 2012 (as shown in
Figure 2). Drought frequency has increased with time. From the 10th century BC to the 1st century BC, droughts occurred on average every 45 years; from the 1st century AD to the 9th century AD, droughts occurred on average every 14 years; from the 10th century AD to the 19th century AD, droughts occurred on average every 4 years; and from 1949 to 2005, they occurred on average every 1.1 years. Apart from the years 1954, 1956, and 1964, either large or small droughts have occurred every year since 1949 and have shown a tendency to increase in frequency [
14,
24,
27].
Based on the above data, the droughts in the Fenhe River basin can be divided into several categories according to the severity of their impact and the national standard stated in China’s Classification of Meteorological Drought [
15]: Grade 1 (normal or humid), Grade 2 (slight drought), Grade 3 (moderate drought), Grade 4 (severe drought), and Grade 5 (excessive drought). The effects of different drought levels on agriculture and the environment are as follows (
Table 1). According to the historical records, during some drought years, many people in the basin starved to death, and some even resorted to cannibalism. Therefore, it is necessary to add another level of drought that is higher than excessive drought: Grade 6 (extreme drought).
In addition, according to the annual precipitation data collected at the Taiyuan, Jiexiu, Linfen and Houma stations in the Fenhe River basin, the precipitation anomaly percentage method is used to perform a drought grade analysis of the Fenhe River basin since the 1950s. The percentage of precipitation anomaly is an indicator that can characterize the precipitation amount that is more or less than the normal value over a certain period. It can directly reflect the drought caused by the precipitation anomaly, and is generally used to evaluate drought events at monthly, seasonal and annual timescales, as shown in
Table 2 [
28,
29]. The precipitation anomaly percentage
in a certain period can be calculated according to the following formula:
where
p is the precipitation in the period (mm) and
is the mean precipitation in the calculation period (mm).
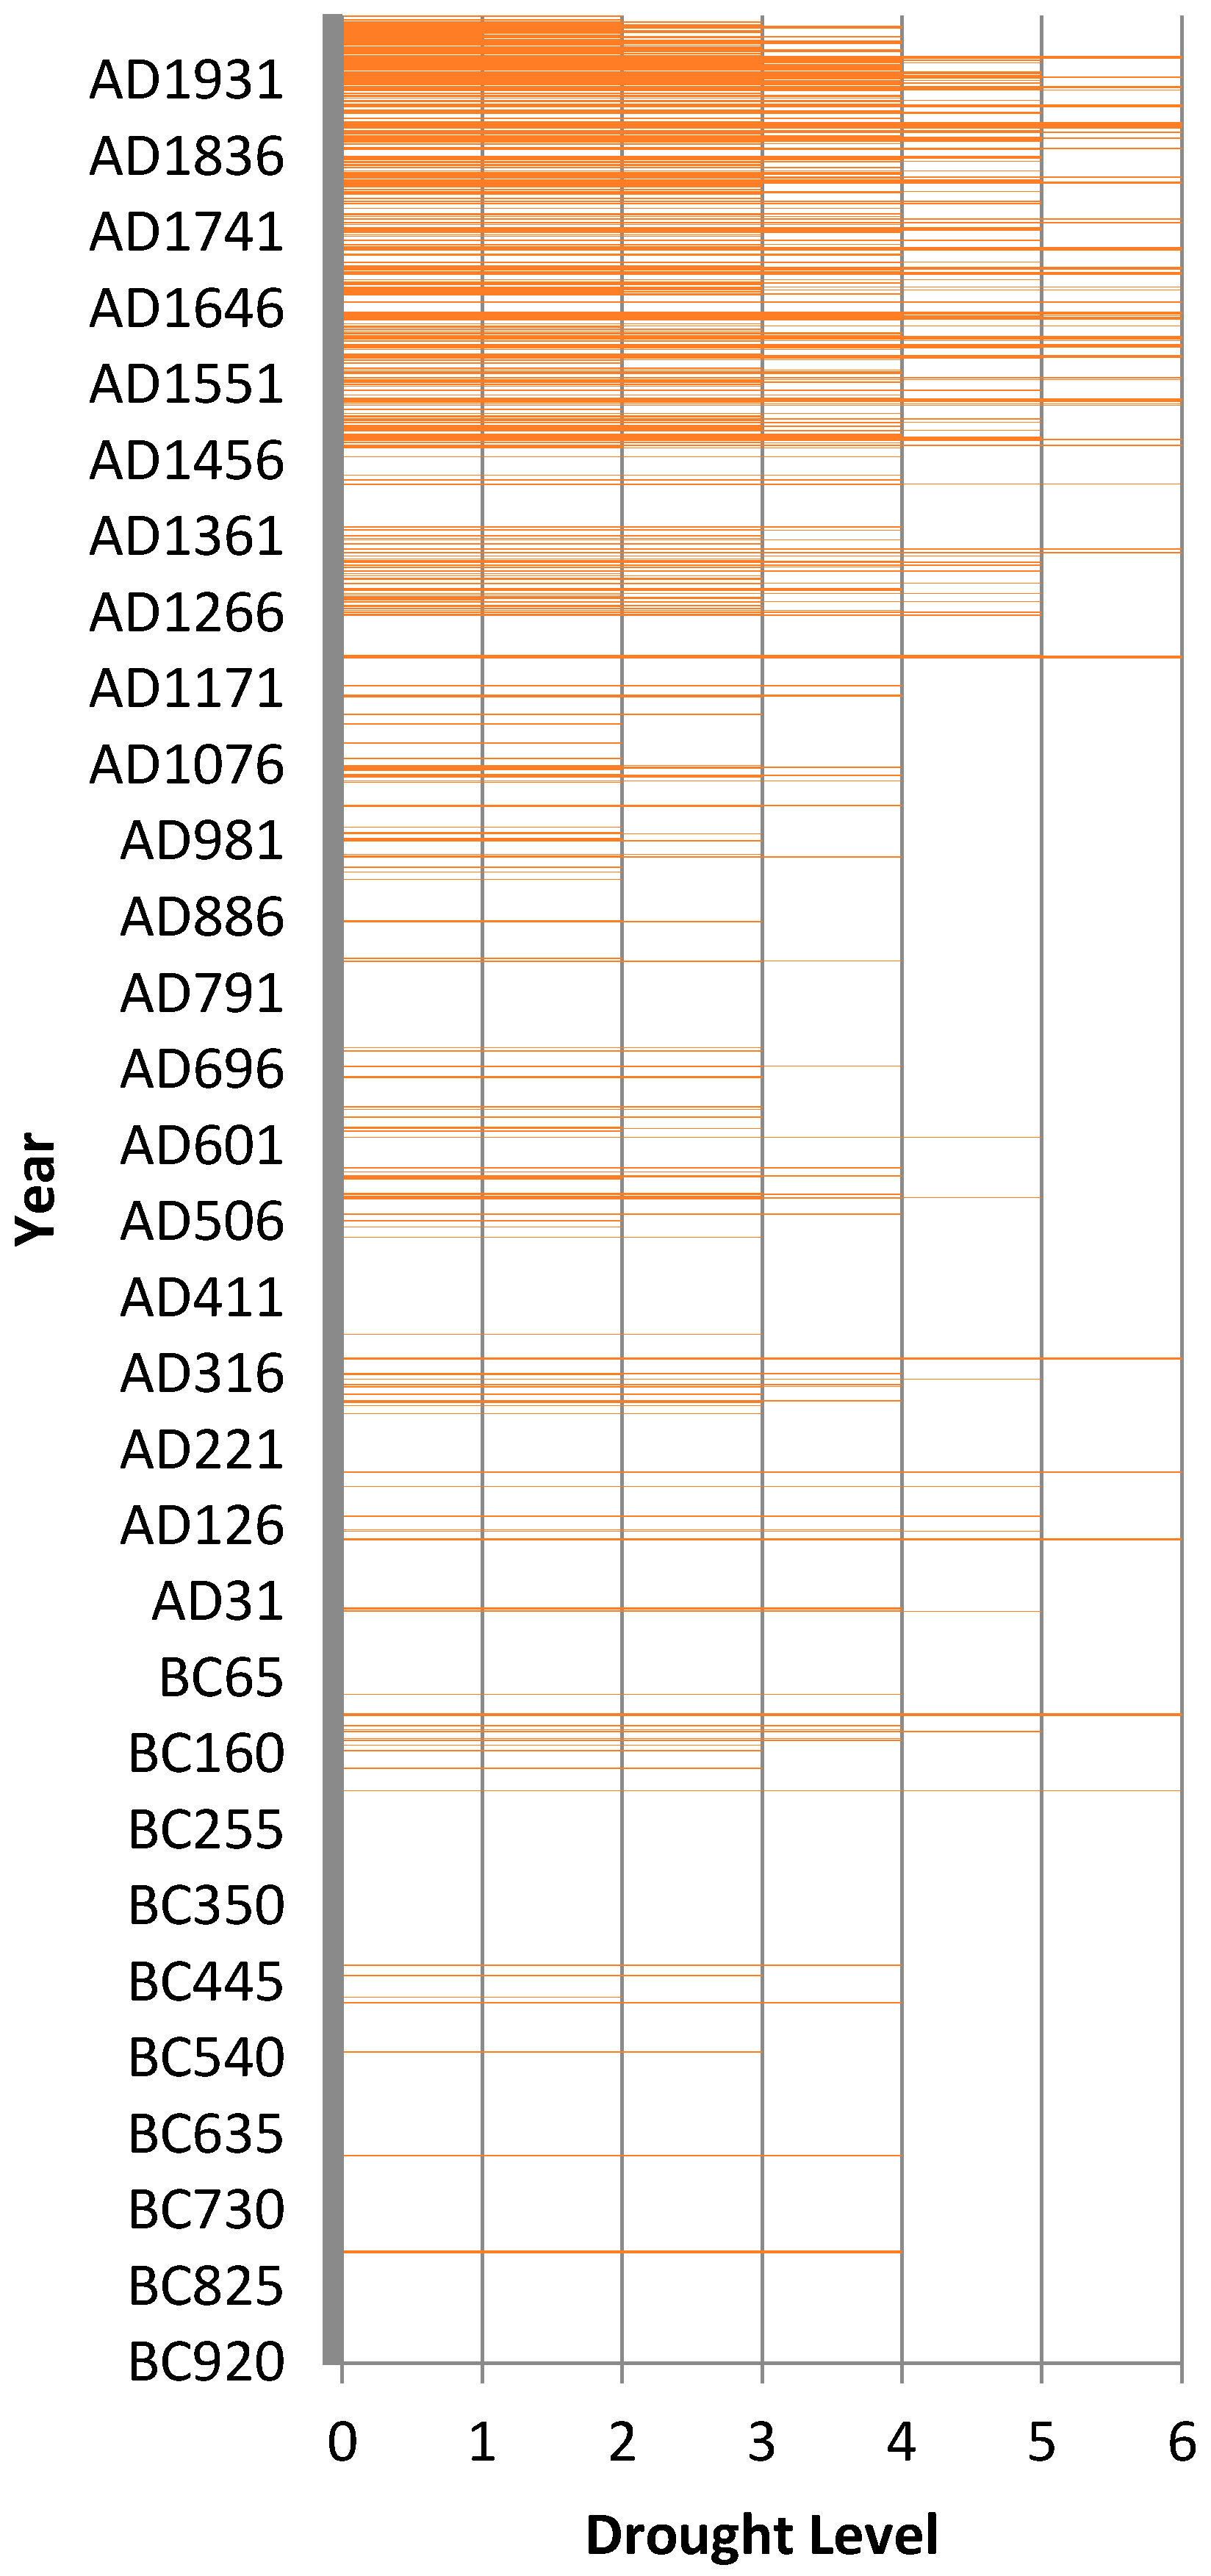
Based on historical data and precipitation anomaly analyses, a drought map was created (
Figure 3). From the 16th century AD to 2012, 46 years endured excessive drought or extreme drought (i.e., Grades 5 and 6), among which 11 successive droughts occurred, lasting 29 years altogether. In addition, drought frequency, especially extreme drought frequency, has increased with time.
4.2. Drought Characteristics
4.2.1. Meteorological Characteristics
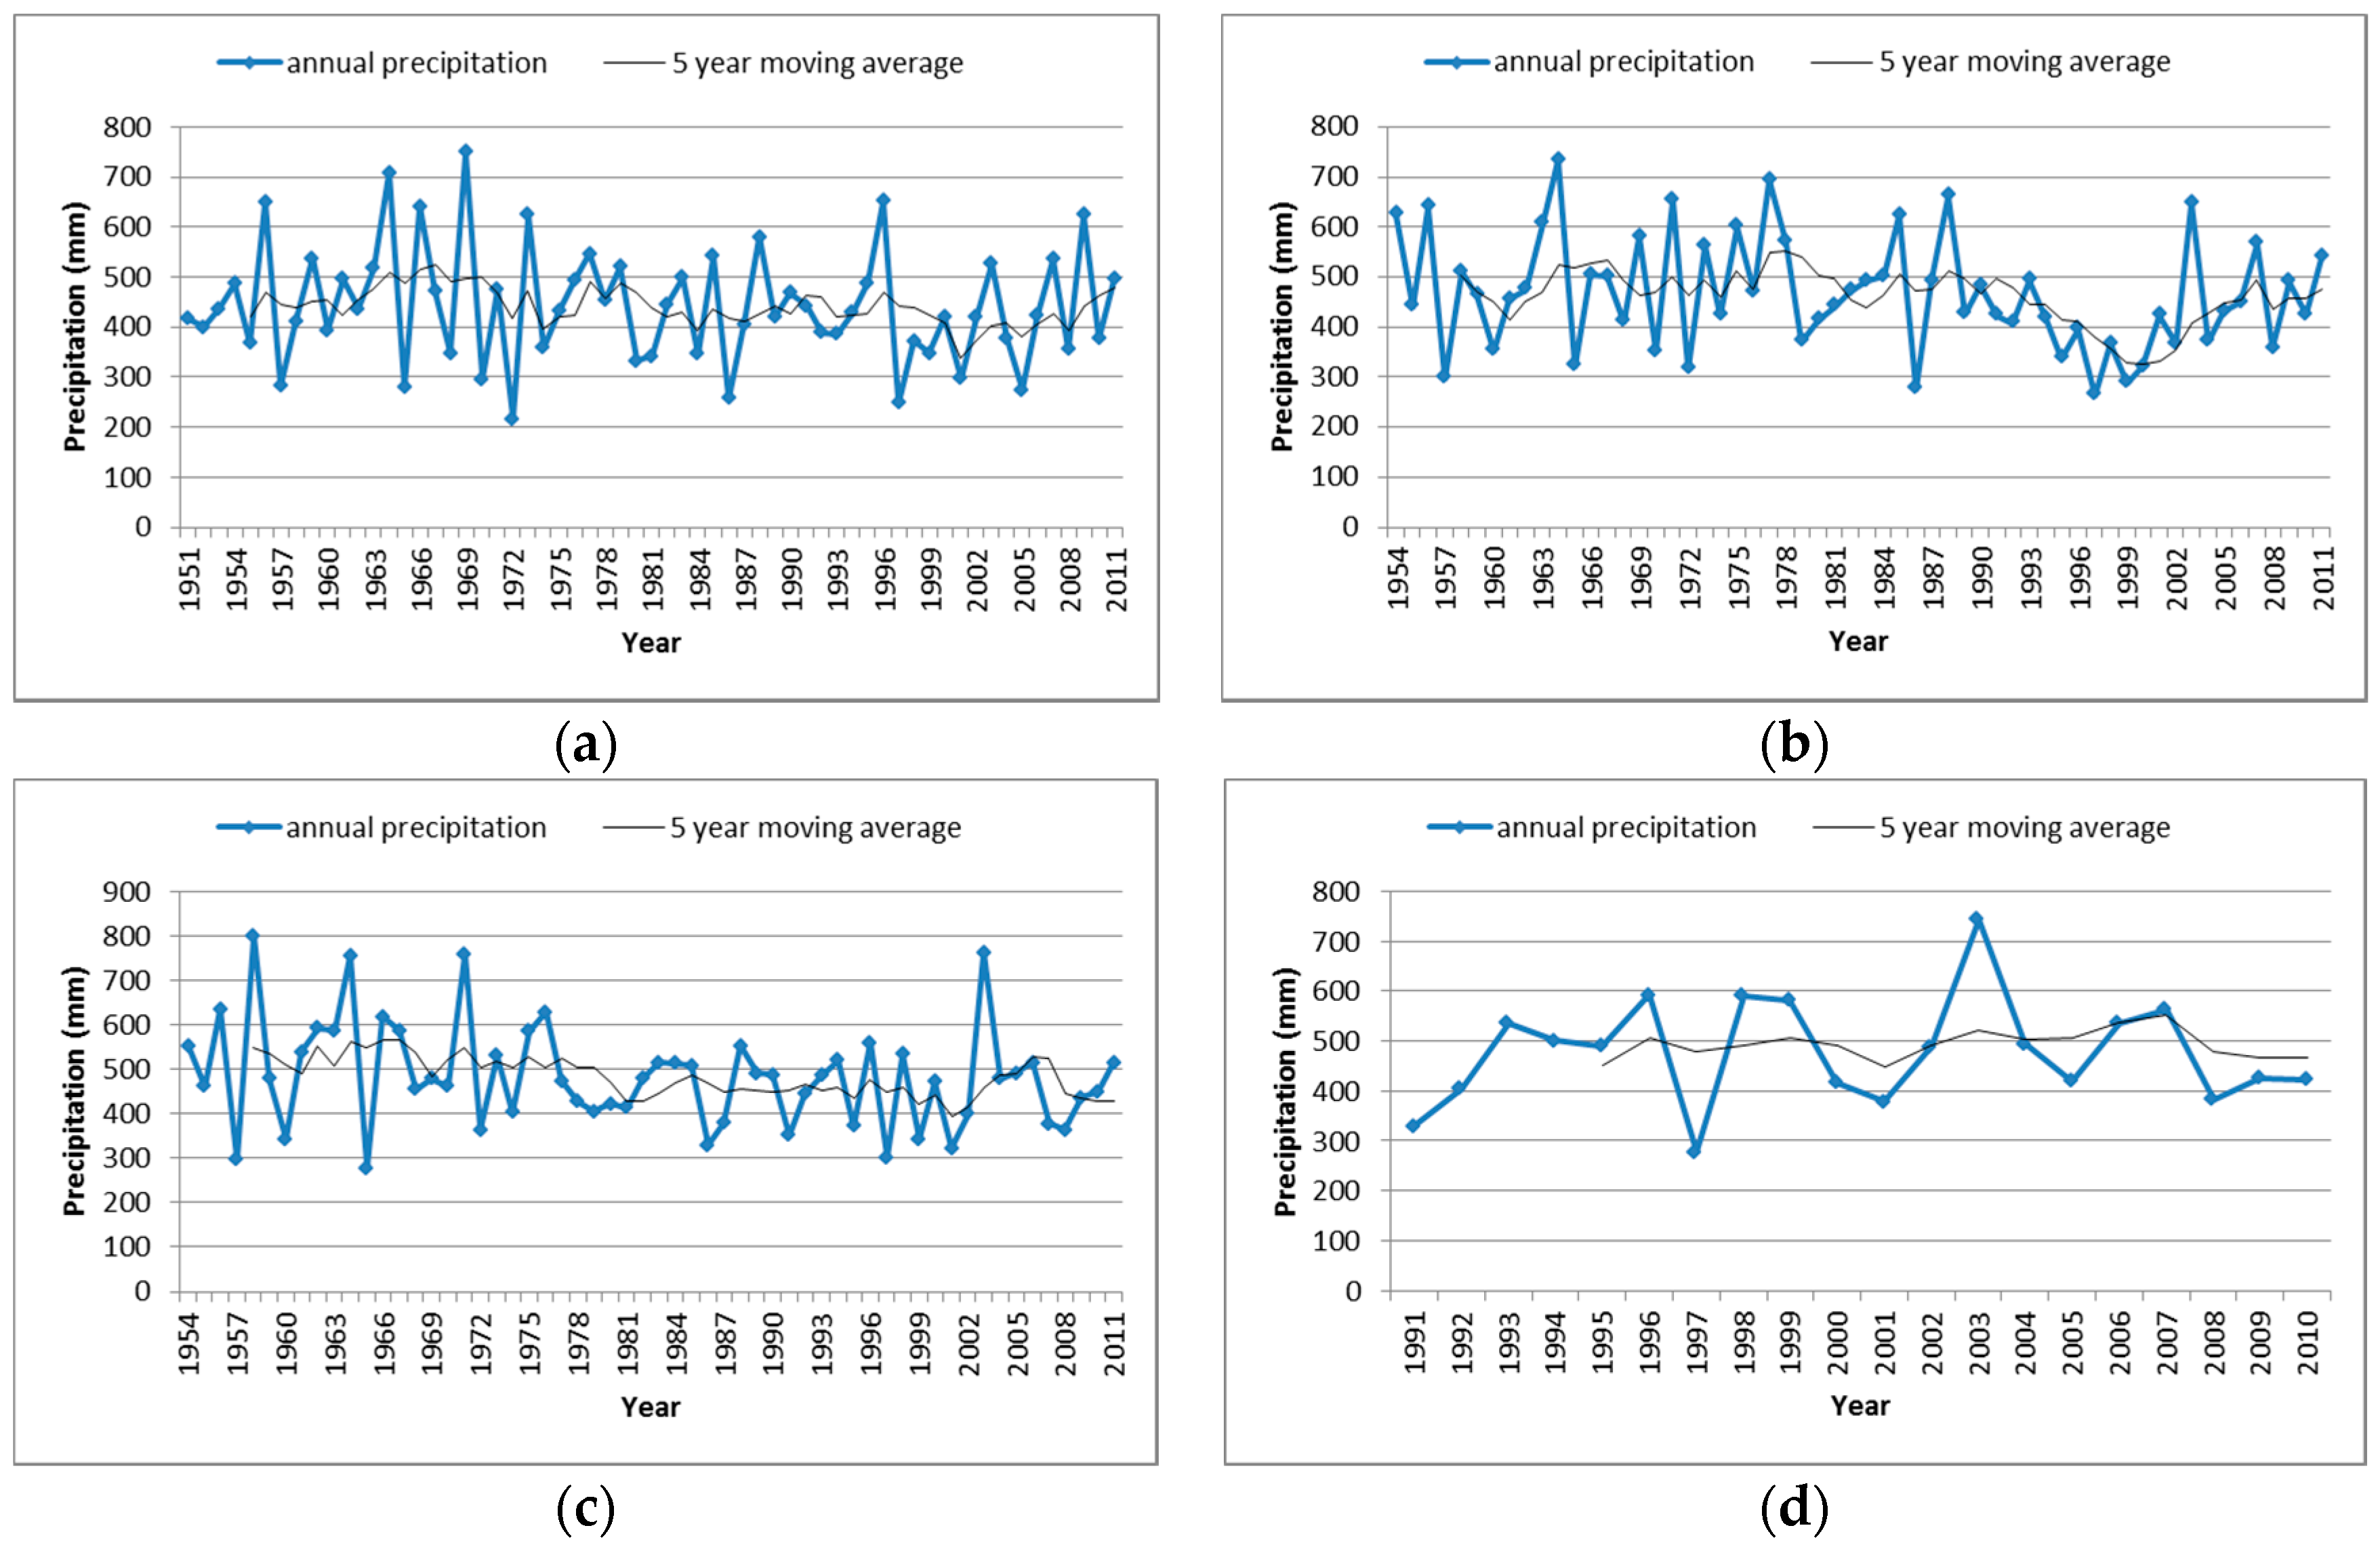
The precipitation variations in the Fenhe River basin are presented in
Figure 4 based on time-series precipitation data provided by four meteorological stations located in Taiyuan, Jiexiu, Linfen, and Houma. The precipitation in the Fenhe River basin exhibits small but significant inter-annual variation. The coefficients of variation at the Taiyuan, Jiexiu, Linfen, and Houma stations are 0.26, 0.24, 0.24, and 0.23, respectively.
Based on an analysis of the 5-year moving average trend of rainfall data and linear trend fitting, annual precipitation has decreased in Taiyuan, Jiexiu, and Linfen since the 1950s. Rainfall was calculated using the Mann–Kendall trend analysis method. The values of parameter Z for these stations are −0.747, −1.717, and −1.851, respectively, indicating decreasing rainfall in these three regions with time (
Table 3). However, the rainfall trend in Taiyuan is not as strong as that in Jiexiu and Linfen. The annual rainfall exhibited a significant downward trend based on the annual precipitation at the Jiexiu and Linfen stations at a confidence level of 95%. In addition, the trends of the three cities are all consistent with the linear trend. The annual precipitation in Houma, however, has increased since the 1990s, and the value of parameter Z, calculated using the Mann–Kendall trend analysis method, is 0.695. This suggests a slight increasing trend in annual rainfall in Houma, which is consistent with the linear trend. In conclusion, the precipitation in the basin has generally decreased over the last 60 years [
30,
31,
32].
4.2.2. Hydrological Characteristics
The statistical analysis of precipitation and natural runoff at the Jingle hydrological station on the Fenhe River shows that alternating wet and dry years occurred from 1956 to 2005. The precipitation and natural runoff trends are consistent. Generally, the 1950s were a period of relatively wet years. Rainfall and runoff gradually decreased from the 1960s to the 1980s and then increased from the 1990s to 2000. Precipitation during 2001 and 2005 was similar to that of the 1990s, while the runoff was smaller, as shown in
Table 4. As we know, runoff depends on a number of factors, including the relative area of impermeable surfaces, soil moisture content, short-term rainfall intensity and duration, vegetation cover, etc. Among these factors, the soil moisture content is an extremely important factor. The water storage capacity of the vadose zone in the soil was influenced by the extent of drought in the primary stage. Under similar rainfall conditions, the runoff values from dry areas were significantly smaller than those from wet areas in the initial stage in arid and semi-arid areas [
33,
34].
The basin has experienced a period of continuous rainfall shortage since the 1980s. Therefore, it is possible that the extent of decreased runoff in the early 21st century has surpassed that of other periods. Rainfall at the Jingle hydrological station over the past 60 years has fluctuated, with alternating wet and dry periods. In addition, short heavy rainfall has occurred sporadically, with no clear increase or decrease. Since runoff, precipitation, and rainfall intensity are closely connected, the reduction in annual runoff is mainly due to a continuous decrease in annual rainfall [
35]. Due to the long-term dry period, both the water storage capacity and the infiltration rate of the dry soil have increased, leading to the loss of rainfall into the ground [
36]. Compared to the 1950s, the runoff since the 1980s appeared to be reducing because of the larger rainfall loss due to more dry-year occurrences and larger soil storage capacity, which resulted from continuous drought.
4.3. Causes of Drought
A variety of complex factors result in droughts and water scarcity in the Fenhe River basin, including rainfall quantity, rainfall spatial distribution, temperature, soil properties, topography, water conservation facilities, and human activities, which are broadly summarized below.
4.3.1. Terrain
The main mountain ranges situated in the Fenhe River basin are the Taihang Mountains, Luliang Mountains, and Taiyue Mountains, which form a clear boundary between the North China Plain and the basin. The Taihang Mountains directly prevent warm and moist air currents from the Pacific and Indian Oceans from moving northward, reducing the chance of meeting cold polar continental air masses, while the Luliang Mountains have a direct impact on the southward movement of the cold polar continental air masses and Mongolian air masses [
37]. Because the surrounding mountains block air currents and the region is under the influence of a single climate, it is difficult to develop the necessary criteria for rainfall.
4.3.2. Climate
Precipitation in the Fenhe River basin is unevenly distributed and highly variable, with more rainfall in the southeast and less in the northwest. Meanwhile, the change in vertical height also has a large impact on precipitation, resulting in more rainfall in the mountains and less in the basins. Temperature and evaporation gradually increase from the mountains to the basin. The temporal distribution of precipitation is also uneven during the year. Although considerable variability exists, less rainfall occurs in winter and spring than in summer and autumn, resulting in a greater chance of droughts in winter and spring [
38]. Moreover, precipitation varies greatly from year to year, and often cannot meet the water demands of major crops in certain crucial growing periods, which can also lead to a degree of drought, even with high precipitation [
39].
4.3.3. Water Resources
Surface water resources are unevenly distributed. The midstream and upstream areas of the Fenhe River account for 18% of the total area of the province and 15% of the river runoff. The water resources cannot satisfy the demand, especially in Taiyuan and Gujiao. Similarly, the groundwater resources are unevenly distributed. The midstream and upstream areas account for 18% of the total groundwater resources. Meanwhile, the Jinxi area, where a tributary discharges into the Yellow River, accounts for 10% of the water resources [
40]. The main water source for industrial, agricultural, and residential uses is groundwater, which is becoming increasingly depleted. Cities such as Taiyuan and Jiexiu suffer from severe overexploitation and shortages of water for industrial and agricultural uses.
4.3.4. Water Conservation Facilities
Existing water conservation facilities are old and lack proper maintenance. The inadequate water supply provided by poor engineering is one of the prominent causes of water shortages. Water loss and soil erosion can lead to reduced reservoir capacity, thereby lowering the regulation and storage capabilities of the reservoir [
41]. During a wet period, the reservoir is incapable of retaining sufficient water, resulting in an ineffective solution for water shortages. Outdated ancillary irrigation structures and a low level of comprehensive management vastly reduce the water scheduling capabilities. Poor storage and water supply facilities and deficiencies in the water supply and transfer abilities are significant disadvantages when trying to eliminate droughts.
4.3.5. Human Activities
For historical reasons, large-scale reclamation and planting projects were carried out in the past. Large areas of trees were chopped down and lakes were transformed into farms. Forests and grasslands were severely damaged, which accelerated the water loss and soil erosion. The silting of rivers reduced reservoir storage capacity and led to river diversion. Numerous lakes were completely filled with silt, which lowered and in some cases eliminated their regulatory functions [
42]. Meanwhile, with social and economic advancement, the water demands for industrial, agricultural, and residential uses grew dramatically, which led to an increase in water scarcity. Therefore, the demand for water cannot be satisfied, causing severe regional water shortage problems [
43].
4.4. Anthropogenic Effects of Drought
4.4.1. Effects of Drought on Agriculture
According to statistics based on the Shanxi Statistical Yearbook, a drought in the Fenhe River basin (1950–1990) led to a decrease in grain production, with the total loss reaching 12,910,000 tonnes. The areas affected totaled 122,590,000 ha, which seriously impacted food security. The decrease in food caused by a hundred-year drought resulted in migration of part of the rural population, posing a potential threat to food security and social stability.
To some extent, droughts and water shortages have an impact on the choice of planting structure. Farmers can mitigate the effects of water scarcity by adjusting their crop planting structure. This is a subjective coping strategy, as well as a passive choice under arid conditions. In general, when water is scarce, famers are more likely to plant crops that are not as dependent on irrigation and have a low demand for water [
44]. A survey analysis showed that, compared with other regions, in areas short of water, such as Taiyuan and Xinzhou, the wheat acreage is relatively low, while the corn and bean acreages are higher (
Table 5). This is because corn and beans require less water than wheat [
45,
46,
47]. The crop structure is affected not only by water scarcity but also by the market, prices, policies, soil, and climate change. Therefore, it is reasonable to consider farmer reactions to water shortages, such as planting structure adjustments, when formulating policies to ease water shortage issues.
In addition, water scarcity also influences the income of local farmers to a certain extent because the high frequency of drought slows income growth. Overall, because of frequent droughts in recent years, stagnant agricultural incomes in the basin have greatly affected the majority of farmers, as well as their production enthusiasm. Agricultural outputs and incomes (1997–2012) in the Fenhe River basin are listed in
Table 6. The drought levels in the table were evaluated according to the precipitation anomaly percentage method (
Table 2). Continuous droughts (1997–2001) exerted a significant impact on food production during those years. The average farmer income growth rate was merely 4.8%. Although this was not very different from the national average rate, it was still low compared to the absolute value of the national average and those in developed regions. In particular, the average net income of farmers in the basin in 1999 was less than that in 1998. The growth rate was only 2.6% in 2001. Many factors may be responsible, but frequent droughts and water shortages were undoubtedly detrimental to income growth and the sustainable development of agriculture. Furthermore, under conditions of both severe drought and flooding, food production in the basin was significantly reduced. Compared to previous years, the income growth rate was relatively low.
4.4.2. Effects of Drought on Industry
The Fenhe River basin is an important base for energy and heavy chemical industries in China. Most of these industries are resource intensive. The four major industries, consisting of coal, electrical, chemical, and metallurgical industries, account for over 80% of the total industrial water consumption. Hence, the advancement of industrial production relies on a large amount of water. Moreover, most large and medium-sized enterprises are located in cities. The water demand in the area is centralized, which causes a discrepancy between demand and supply [
48]. The drought in 1960 caused production decreases in agriculture, aquaculture, and animal husbandry. It had a direct impact on the light industries whose raw materials relied on these industries, such as the textile, leather, food, and garment industries. In addition, it indirectly influenced some sectors of the national economy and all of the heavy industrial sectors. As stated in the
Shanxi Statistical Yearbook, the total industrial output in the basin dropped from 2.31 billion Yuan in 1960 to 1.1 billion Yuan in 1962, i.e., less than 48% of the original value.
A large number of industries were not approved because of water shortage. Therefore, the development of many mining related industries was limited, especially those with high water consumption rates, such as coal washing, thermal power, ore smelting, and the production of fine chemical products [
49]. As a result, the abundant mineral resources in the region have not been fully exploited. According to statistics, the development of new enterprises in Taiyuan faces obstacles related to water scarcity, causing an annual output loss of approximately 6.8 billion Yuan and an indirect loss of 17 billion Yuan [
50,
51]. Among the mining enterprises that have already reached production capacity, nearly 50% are subject to negative impacts from the severe water scarcity, and many are forced to narrow their production scale. Production lines have been shut down, and new equipment cannot be put into use. Furthermore, the coal in the basin is supplied to 26 provinces and cities all over the country, occupying a very important position in the national energy security strategy. Power plants situated within the mining areas in the basin are mostly pithead plants. If there is insufficient water for coalmines and power plants during a period of extreme drought, chain reactions will occur and directly influence the national energy supply and economic development, in turn jeopardizing national energy security.
4.4.3. Domestic Effects of Drought
With accelerated urbanization in the Fenhe River basin, the demand for water is increasing rapidly [
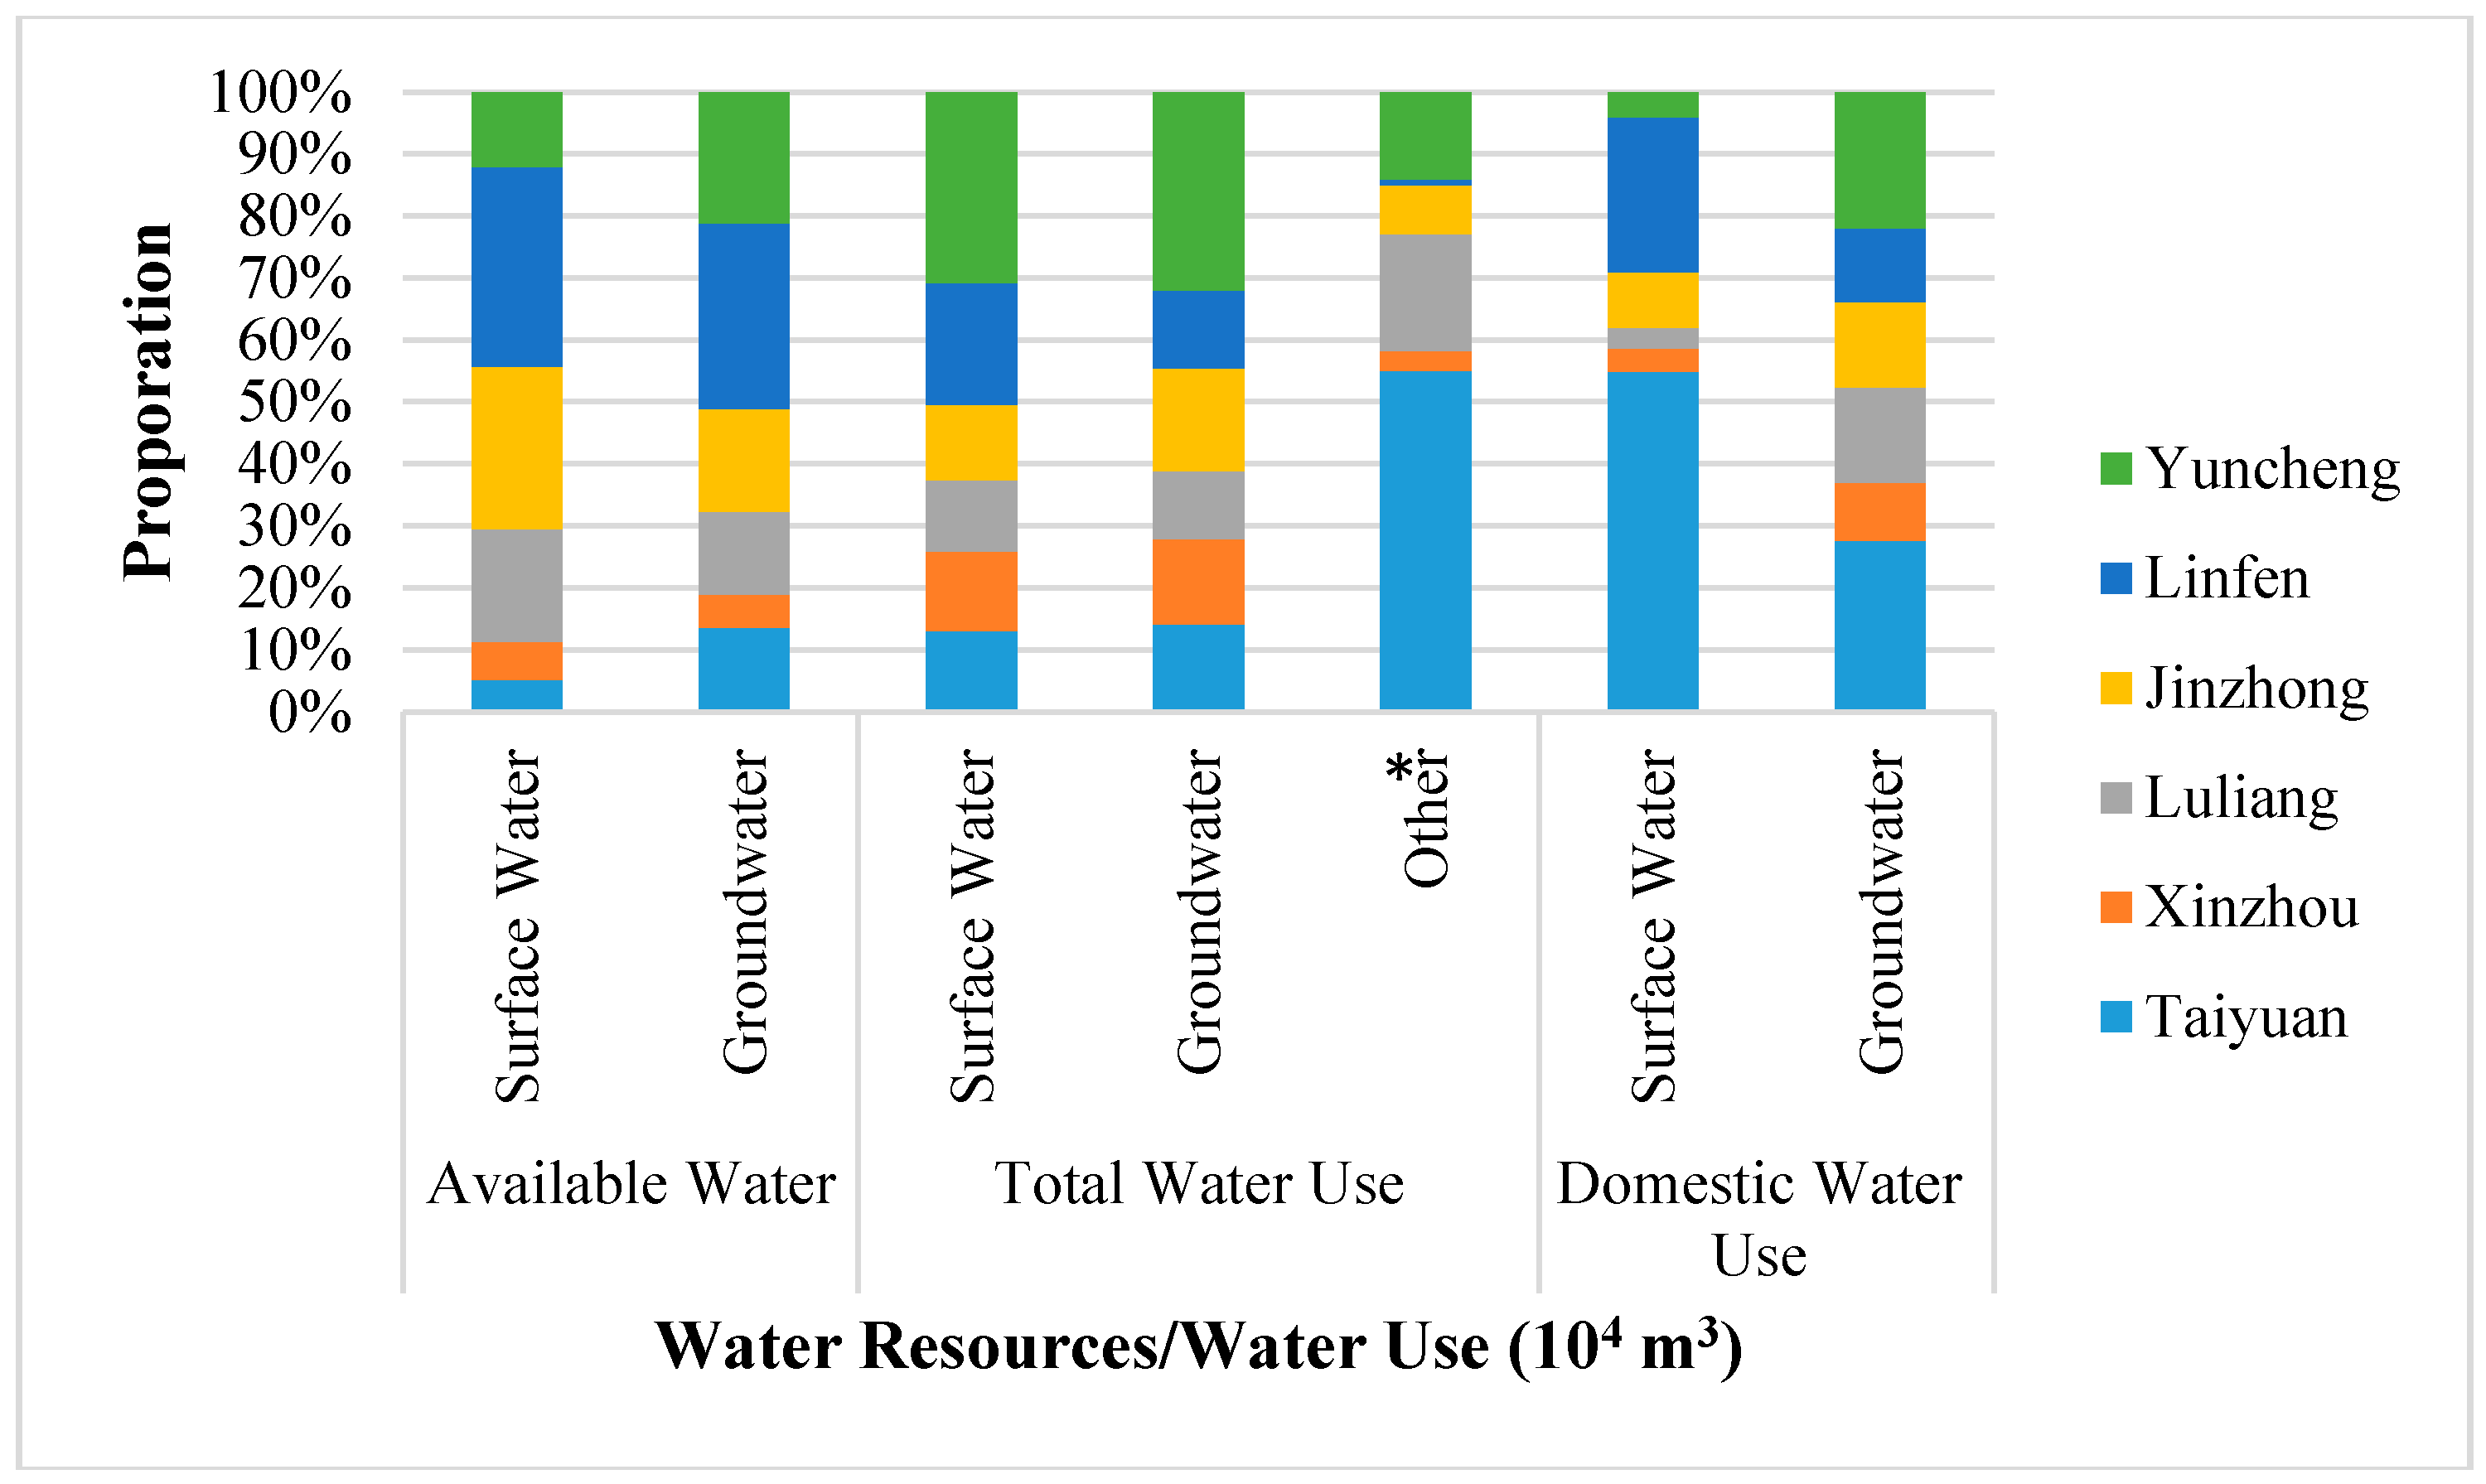
52]. Because the construction of water resource projects cannot keep up, the shortage of domestic water is becoming increasingly important. Based on the Water Resources Assessment for Shanxi Province, the exploitation of available water resources has almost reached a maximum in cities such as Taiyuan, Xinzhou, Luliang, Jinzhong, Linfen, and Yuncheng. Taiyuan and Yuncheng have greatly overexploited the available water resources. Domestic water in these cities mostly relies on local groundwater.
Figure 5 shows that guaranteed domestic water supply during drought years comes at the expense of the ecological environment. Furthermore, the domestic water supply is unreliable in extreme drought years.
Although the urban domestic water supply has the highest priority of all water uses, most cities in the basin are currently faced with water shortages, and 70% are suffering from severe water scarcity. Therefore, many cities are left with no choice but to limit the water supply. In years of extreme drought, people living in urban areas have to rely on water transported by trucks.
In terms of the domestic water supply in rural areas, the vast majority of regions in the basin have had to rely on extracting groundwater to solve the drinking supply problem because of natural conditions. As wells have to be dug progressively deeper to reach the groundwater, it is becoming increasingly difficult to solve the problem. A study showed that the deepest rural drinking water well in 1990 was located in Yuncheng, with a depth of 105–110 m. However, by 2005, the deepest well was located in Dongshan, Taiyuan, and reached 1118 m. All drinking water wells in the large cities of the basin are deeper than 500 m, as shown in
Table 7.
During an extreme drought, water scarcity will occur in most regions in the basin due to the drought itself, water leaks caused by mining, and high temperatures. This scarcity not only severely affects the lives of people in cities but also causes serious drinking water shortages for thousands of people in rural areas [
53]. Millions of people are forced to relocate because of water scarcity and food shortages. Groups may even fight over water resources, jeopardizing social stability and development [
54].
4.5. Ecological and Environmental Effects of Drought
4.5.1. Surface Water Ecosystems
(a) Rivers
Droughts cause severe damage to the aquatic ecosystem in the Fenhe River basin [
55]. From 1997 to 2006, except for Jingle Station, Binhe Reservoir Station and Zhaishang Station, all the other stations experienced periods of zero flow. Additionally, the river ecology is facing serious challenges [
42,
56]. The average main stream flow in the upstream and midstream areas of the Fenhe River for those ten years was 4.14–5.33 m
3/s, whereas the flow downstream of Zhaocheng was less than 9.6 m
3/s. Compared with the wet period, the flow observed in the main control sections drastically decreased. Taking the Jingle Station as an example, the annual average flow was 8.8 m
3/s during 1956–1979 but decreased to 4.7 m
3/s during 1997–2006 (
Table 8).
The environment in the basin has been seriously influenced by droughts. In addition to the reduced runoff, part of the river has dried up. According to the average monthly statistics provided by the hydrological stations for the past ~10 years (
Table 9), the Jingle station, Fenhe reservoir, Zhaishang station, and all other stations experienced days when the river dried up, posing a great threat to the ecological environment.
According to
Table 9, in the upstream region of the Fenhe River, no locations dried up except for the section with strong leakage. The midstream region showed the longest dry span, both in time and length. The 160-km-long river channel from the Lancun hydrological station to the Yitong hydrological station is essentially dry during periods of non-irrigation. The Lancun hydrological station each year was dry for more than 250 days from 2001 to 2006, while the Fenhe second dam and Yitong hydrological station were dry for more than 140 days. The length of time that the downstream area of the Fenhe River was dry was shorter but was concentrated between March and June, which was a crucial period for irrigation. At other times, the runoff was relatively high. Therefore, the main areas experiencing a dry river due to drought were the midstream and downstream areas of the basin. In particular, the midstream area suffered from a greater extent and duration of dry riverbed.
(b) Wetlands
The various types of wetlands in the Fenhe River cover a total area of 930.51 km
2, accounting for 25.43% of the wetlands in Shanxi Province [
57]. In accordance with the classification system provided by the Ramsar Convention, the main types of wetlands in the Fenhe River basin are listed in
Table 10 [
57].
Wetlands contain high biological diversity because of their special ecological environment [
58,
59]. Sea buckthorn communities are distributed in the upstream area of the Fenhe River. Reed communities and cattail communities are scattered along the watercourse and in ponding areas of the floodplain. The wetlands in Taiyuan tend to dry up because of progressive water scarcity, leading to
Tamarix chinensis communities,
Calamagrostis pseudophragmites communities, and
Artemisia communities.
Leymus secalinus communities,
Carex communities, and Bermuda grass communities are widely distributed in the floodplain [
57,
59]. Because of water scarcity, the advancement of industrial and agricultural production since the 1970s has encouraged enhanced exploitation of the wetlands, which have suffered increasing damage. The area of wetlands is shrinking and suffering a continuous reduction in ecological functions, diminishing biodiversity, and increased ecosystem vulnerability of the river corridor [
60].
(c) Slope Ecosystems
The vegetation index, which is a simple, effective, and empirical measure of the growth conditions of surface vegetation, is an important indicator for evaluating slope ecosystems, as well as the ecological environment [
61]. The NDVI is an optimal indicator of the growth conditions of plants and the vegetation coverage [
62], which has been widely used in related research on drought monitoring, ecological environment monitoring, climate change, and the characteristics of surface sensible heat [
63]. The vegetation in the Fenhe River basinis dominated by cold-resistant shrub grass. The natural grasses include
Leymus chinensis, and
Artemisia,
bluegrass,
orchids, wild
Oxytropis bcabrescens,
Euphorbia fisheriana, and
Lespedeza davurica are also present. Additionally, theshrubs include
yellow rosebush,
sea buckthorn,
Ostryopsis davidiana,
Prunus davidiana, and
Prunus armeniaca, and the trees include
poplar,
birch,
pine, and dryland
willow [
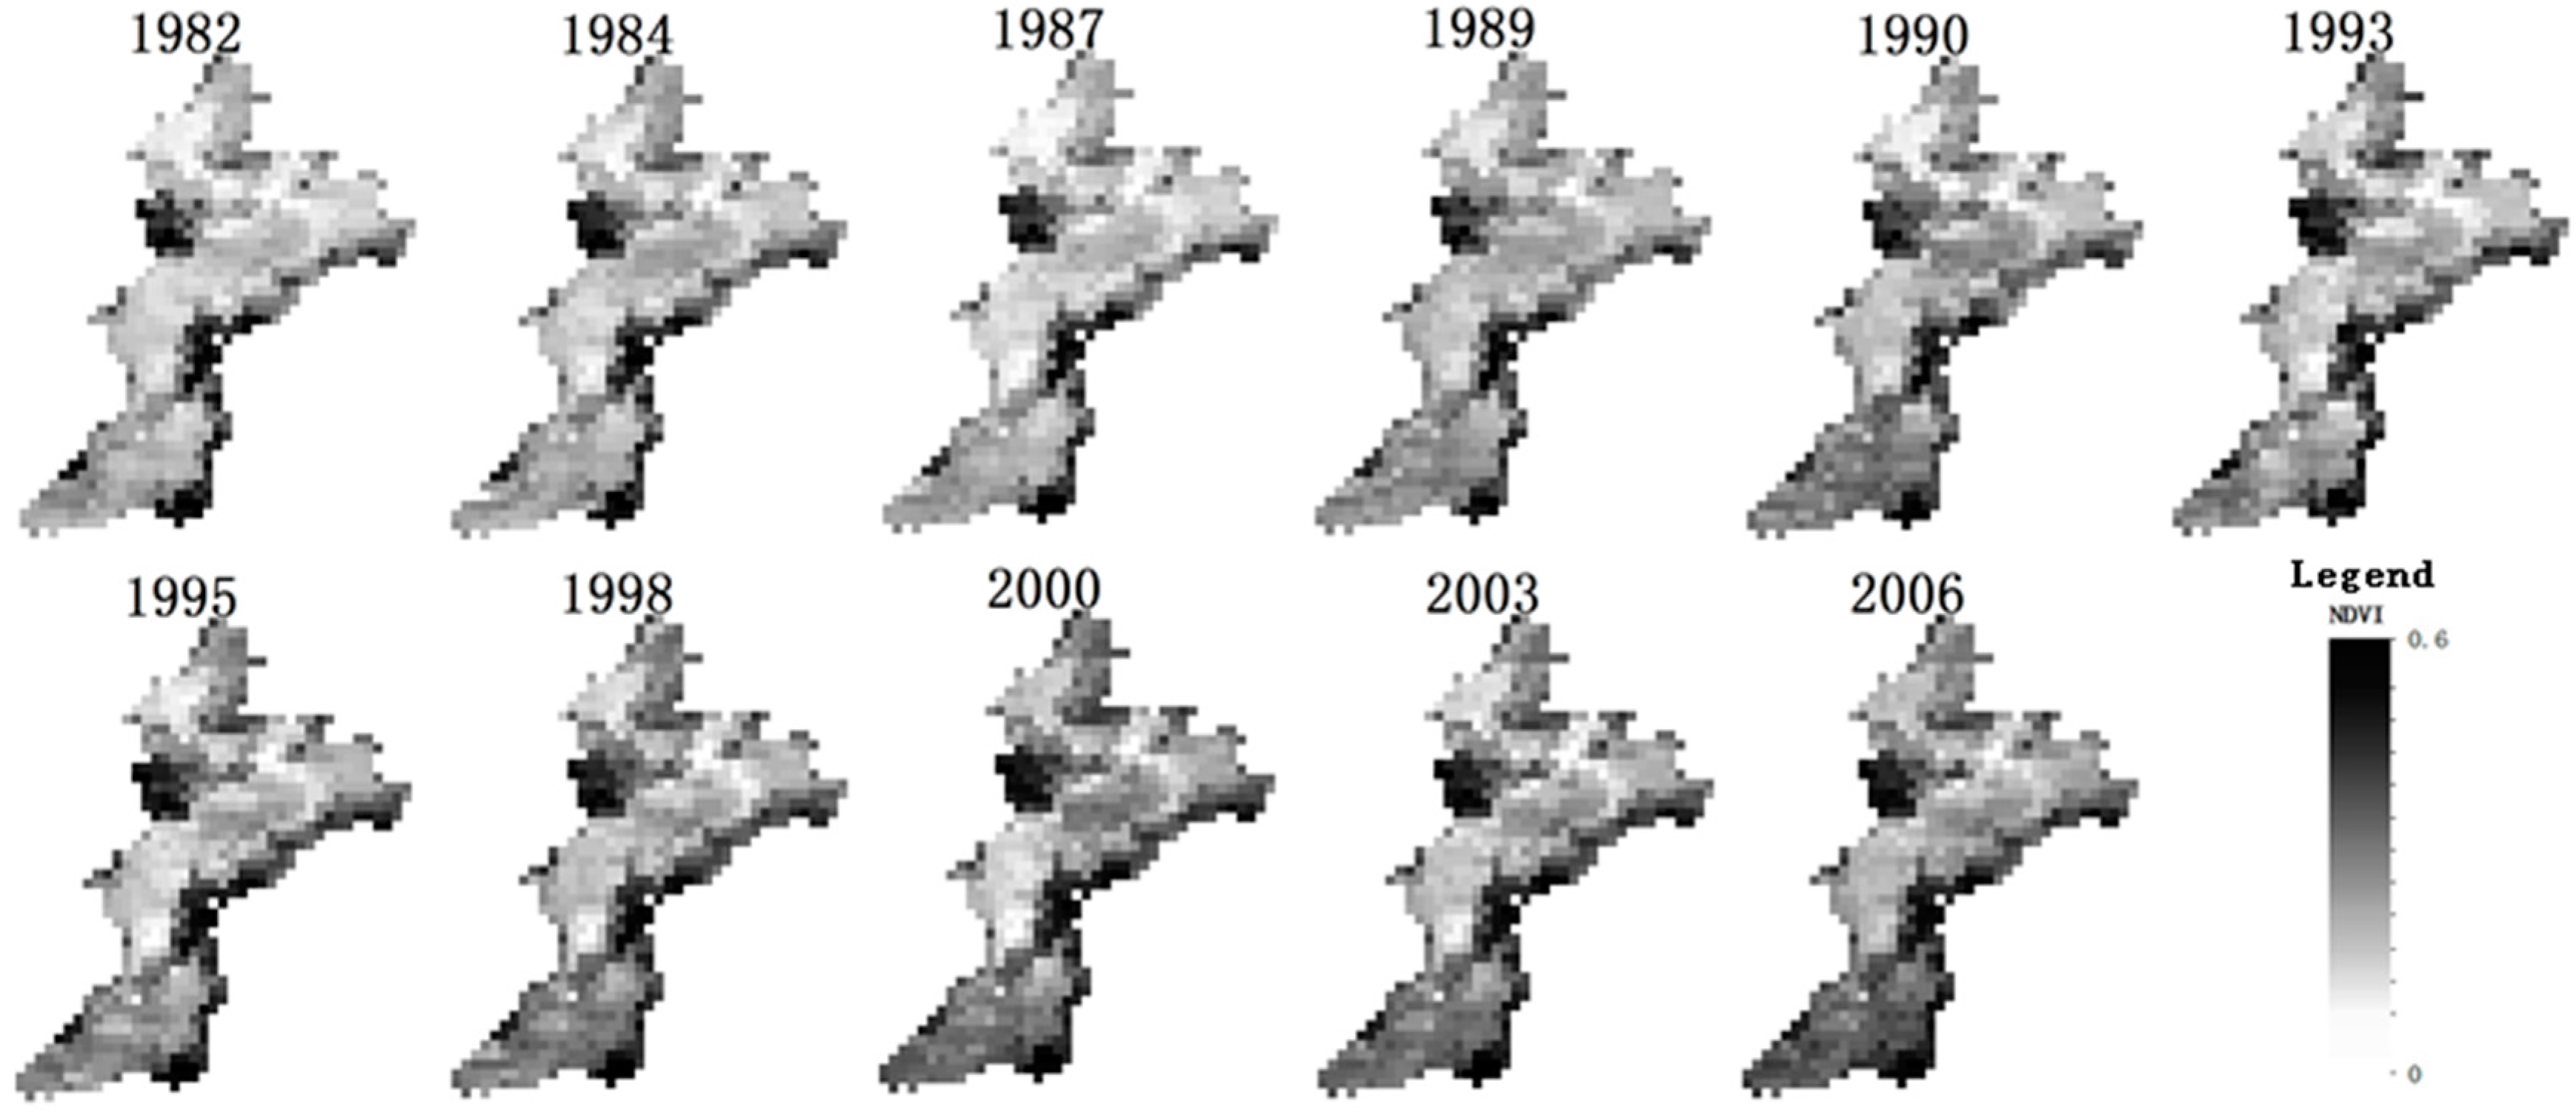
64].The GIMMS NDVI remote sensing data [
18] were used to obtain the annual NDVI of the Fenhe River basin from 1982 to 2006. The spatial distribution of the vegetation growth conditions indicated by the NDVI is shown in
Figure 6.
In general, combined with an analysis of the terrain and climate conditions in the basin, the annual NDVI is relatively low because the Taihang and Luliang Mountains block warm and wet air currents, as well as cold air currents, leading to low rainfall amounts. The NDVI values for the majority of the regions are approximately 0.2, with a maximum of approximately 0.5. The mountainous areas located in the east and west of the basin experience high precipitation. Consequently, the NDVI values are approximately 0.5 on the eastern and western edges of the basin, which is significantly higher than the values in the central plain areas. Because of the uneven spatial distribution of precipitation, with more rainfall in the southeast and less in the northwest, the NDVI values in the southeastern areas have generally been higher than those in the northwest for the last 25 years.
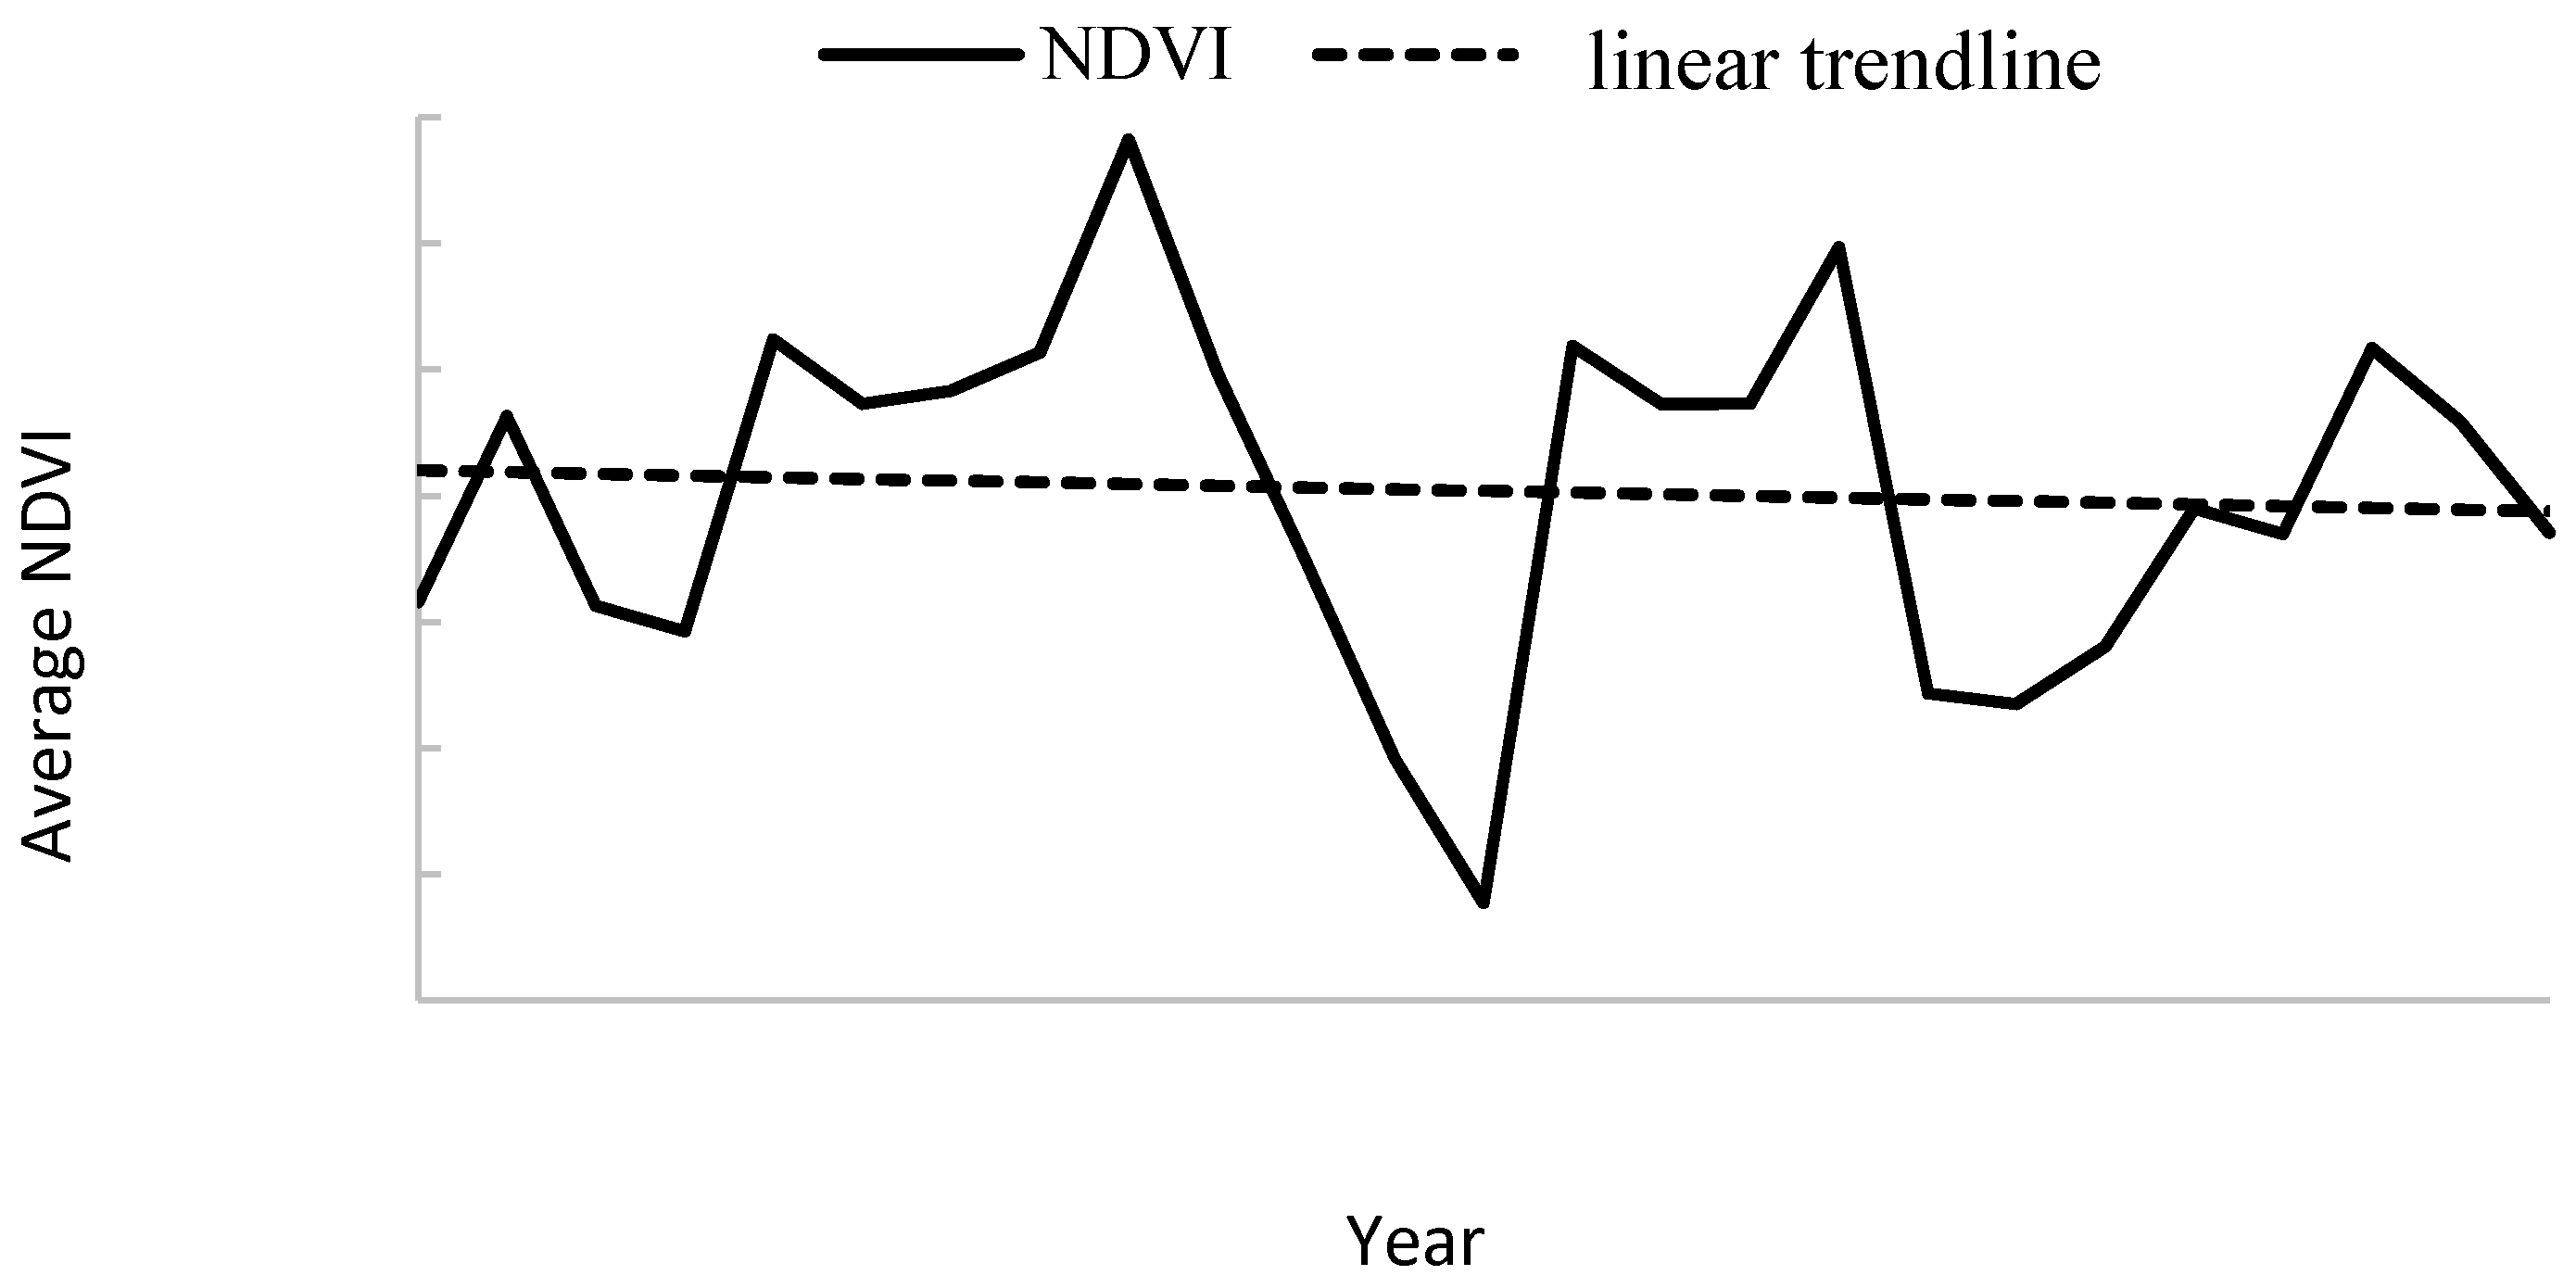
Figure 7 indicates gradual changes in the average NDVI value for the entire basin. The average NDVI was less than 0.2 from 1982 to 2006. The value has typically decreased, which is consistent with the declining precipitation. Hence, vegetation growth was under the direct influence of precipitation. The ecosystem in the basin is very fragile and vegetation growth is strongly dependent on water conditions [
65]; therefore, water scarcity significantly affected the healthy development of the ecological environment of slopes [
66,
67].
4.5.2. Groundwater Ecosystems
Droughts have also led to the serious degradation of groundwater aquatic ecosystems. Because of the rainfall shortage, groundwater in the basin has been heavily exploited, leading to large-scale water shortages in springs that have been difficult to overcome.
(a) Karst Springs
There are many karst springs in the Fenhe River basin, such as Leimingsi Spring, Lancun Spring, Jinci Spring, Hongshan Spring, Guozhuang Spring, Huoquan Spring (also known as Guangshengsi Spring), Longzici Spring, and Gudui Spring [
68]. With natural average flows of up to 28.7 m
3/s, resulting in a total annual runoff of 902 million m
3, the springs are an important part of the clean water runoff in the basin. While some of the karst springs are exploited by means of wells, the clean water runoff has decreased rapidly. Some springs have dried up during drought years, such as Jinci Spring in 1994 and Lancun Spring in 1990.
Table 11 describes the characteristics of the springs in the Fenhe River basin.
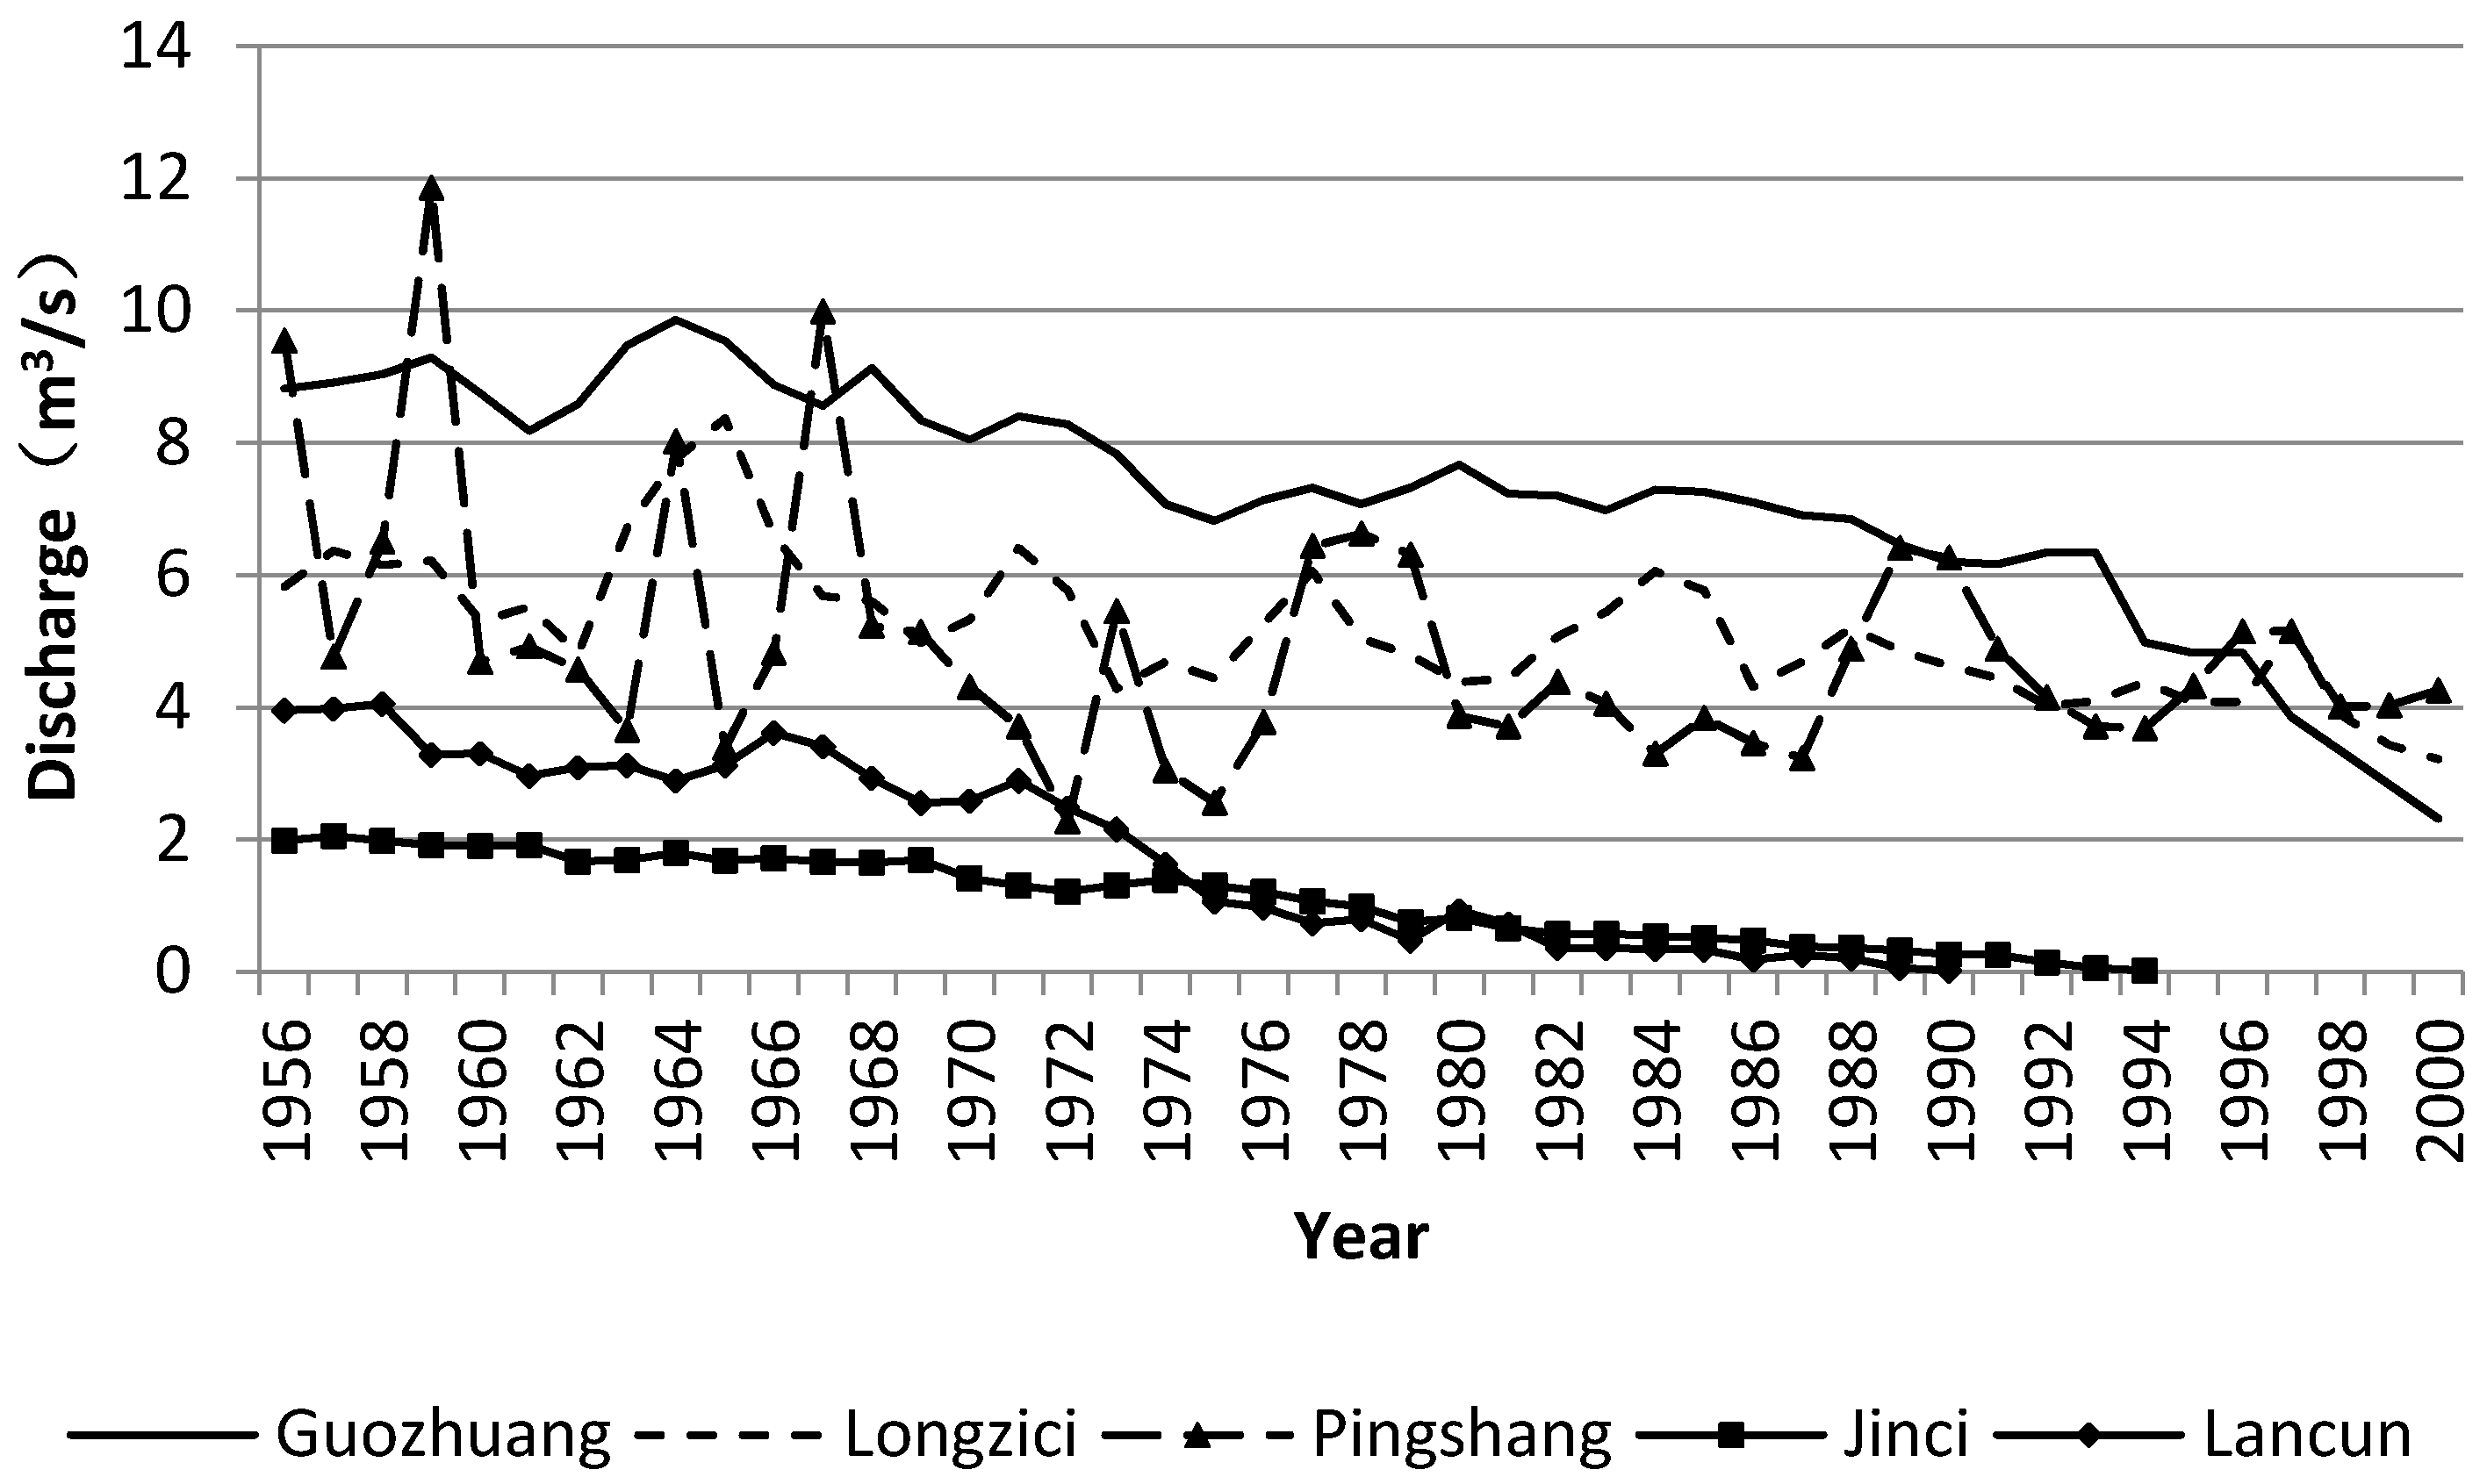
According to information provided by the Shanxi Provincial Hydrology and Water Resources Survey Bureau, the runoff in the spring areas changed from 1956 to 2000. The data indicate a gradual declining trend in runoff in recent years in springs such as Guozhuang, Jinci, Lancun, Hongshan, Longzici, Huoquan, Liulin, Xiamaquan, and Pingshang, as shown in
Figure 8. An analysis of the correlation between precipitation at the Jingle hydrological station in 1956–2000 and the average annual runoff of Jinci Spring and Lancun Spring, which are both close to the Jingle hydrological station, reveals correlation coefficients for Jinci Spring and Lancun Spring of 0.72 and 0.81, respectively. The decrease in the water of karst springs has therefore been significantly influenced by the arid climate and precipitation in recent years.
(b) Groundwater
An important feature of the water resources in the basin is that the surface water and groundwater occupy a large proportion of the total amount of water resources. According to the Water Resources Comprehensive Planning in the Yellow River basin, the total volume of water resources in the Fenhe River basin was 3.014 × 10
9 from 1980 to 2000, and the volumes of surface water, groundwater, and recycled surface water and groundwater resources were 1.715 × 10⁹ m
3, 2.29 × 10⁹ m
3, and 9.91 × 10
8 m
3, respectively. The amount of surface water will likely decline due to the impact of substantial groundwater exploitation, causing serious damage [
69]. According to the stratigraphic characteristics and hydraulic relationships in the basin, the type of the groundwater in the Fenhe River basin can be divided into loose rock pore medium water, clastic rock fissure water (including metamorphic rocks) and carbonate rock karst water. The carbonate rock karst water is generally confined and is the main source of groundwater in the Fenhe River basin [
70]. According to Emergency Water Resources Planning in Shanxi Province, published by the Water Resources Department of Shanxi Province in 2007, a total of 21 areas suffered from overexploitation in Shanxi Province in 2005, with the annual groundwater overexploitation amounting to 688 million m
3. Twelve of these areas are located in the Fenhe River basin, and the overexploitation in this basin reached 330 million m
3, accounting for 47% of the groundwater overexploitation in the province. Consequently, the water scarcity caused by both droughts and exploitation/overextraction is severe.
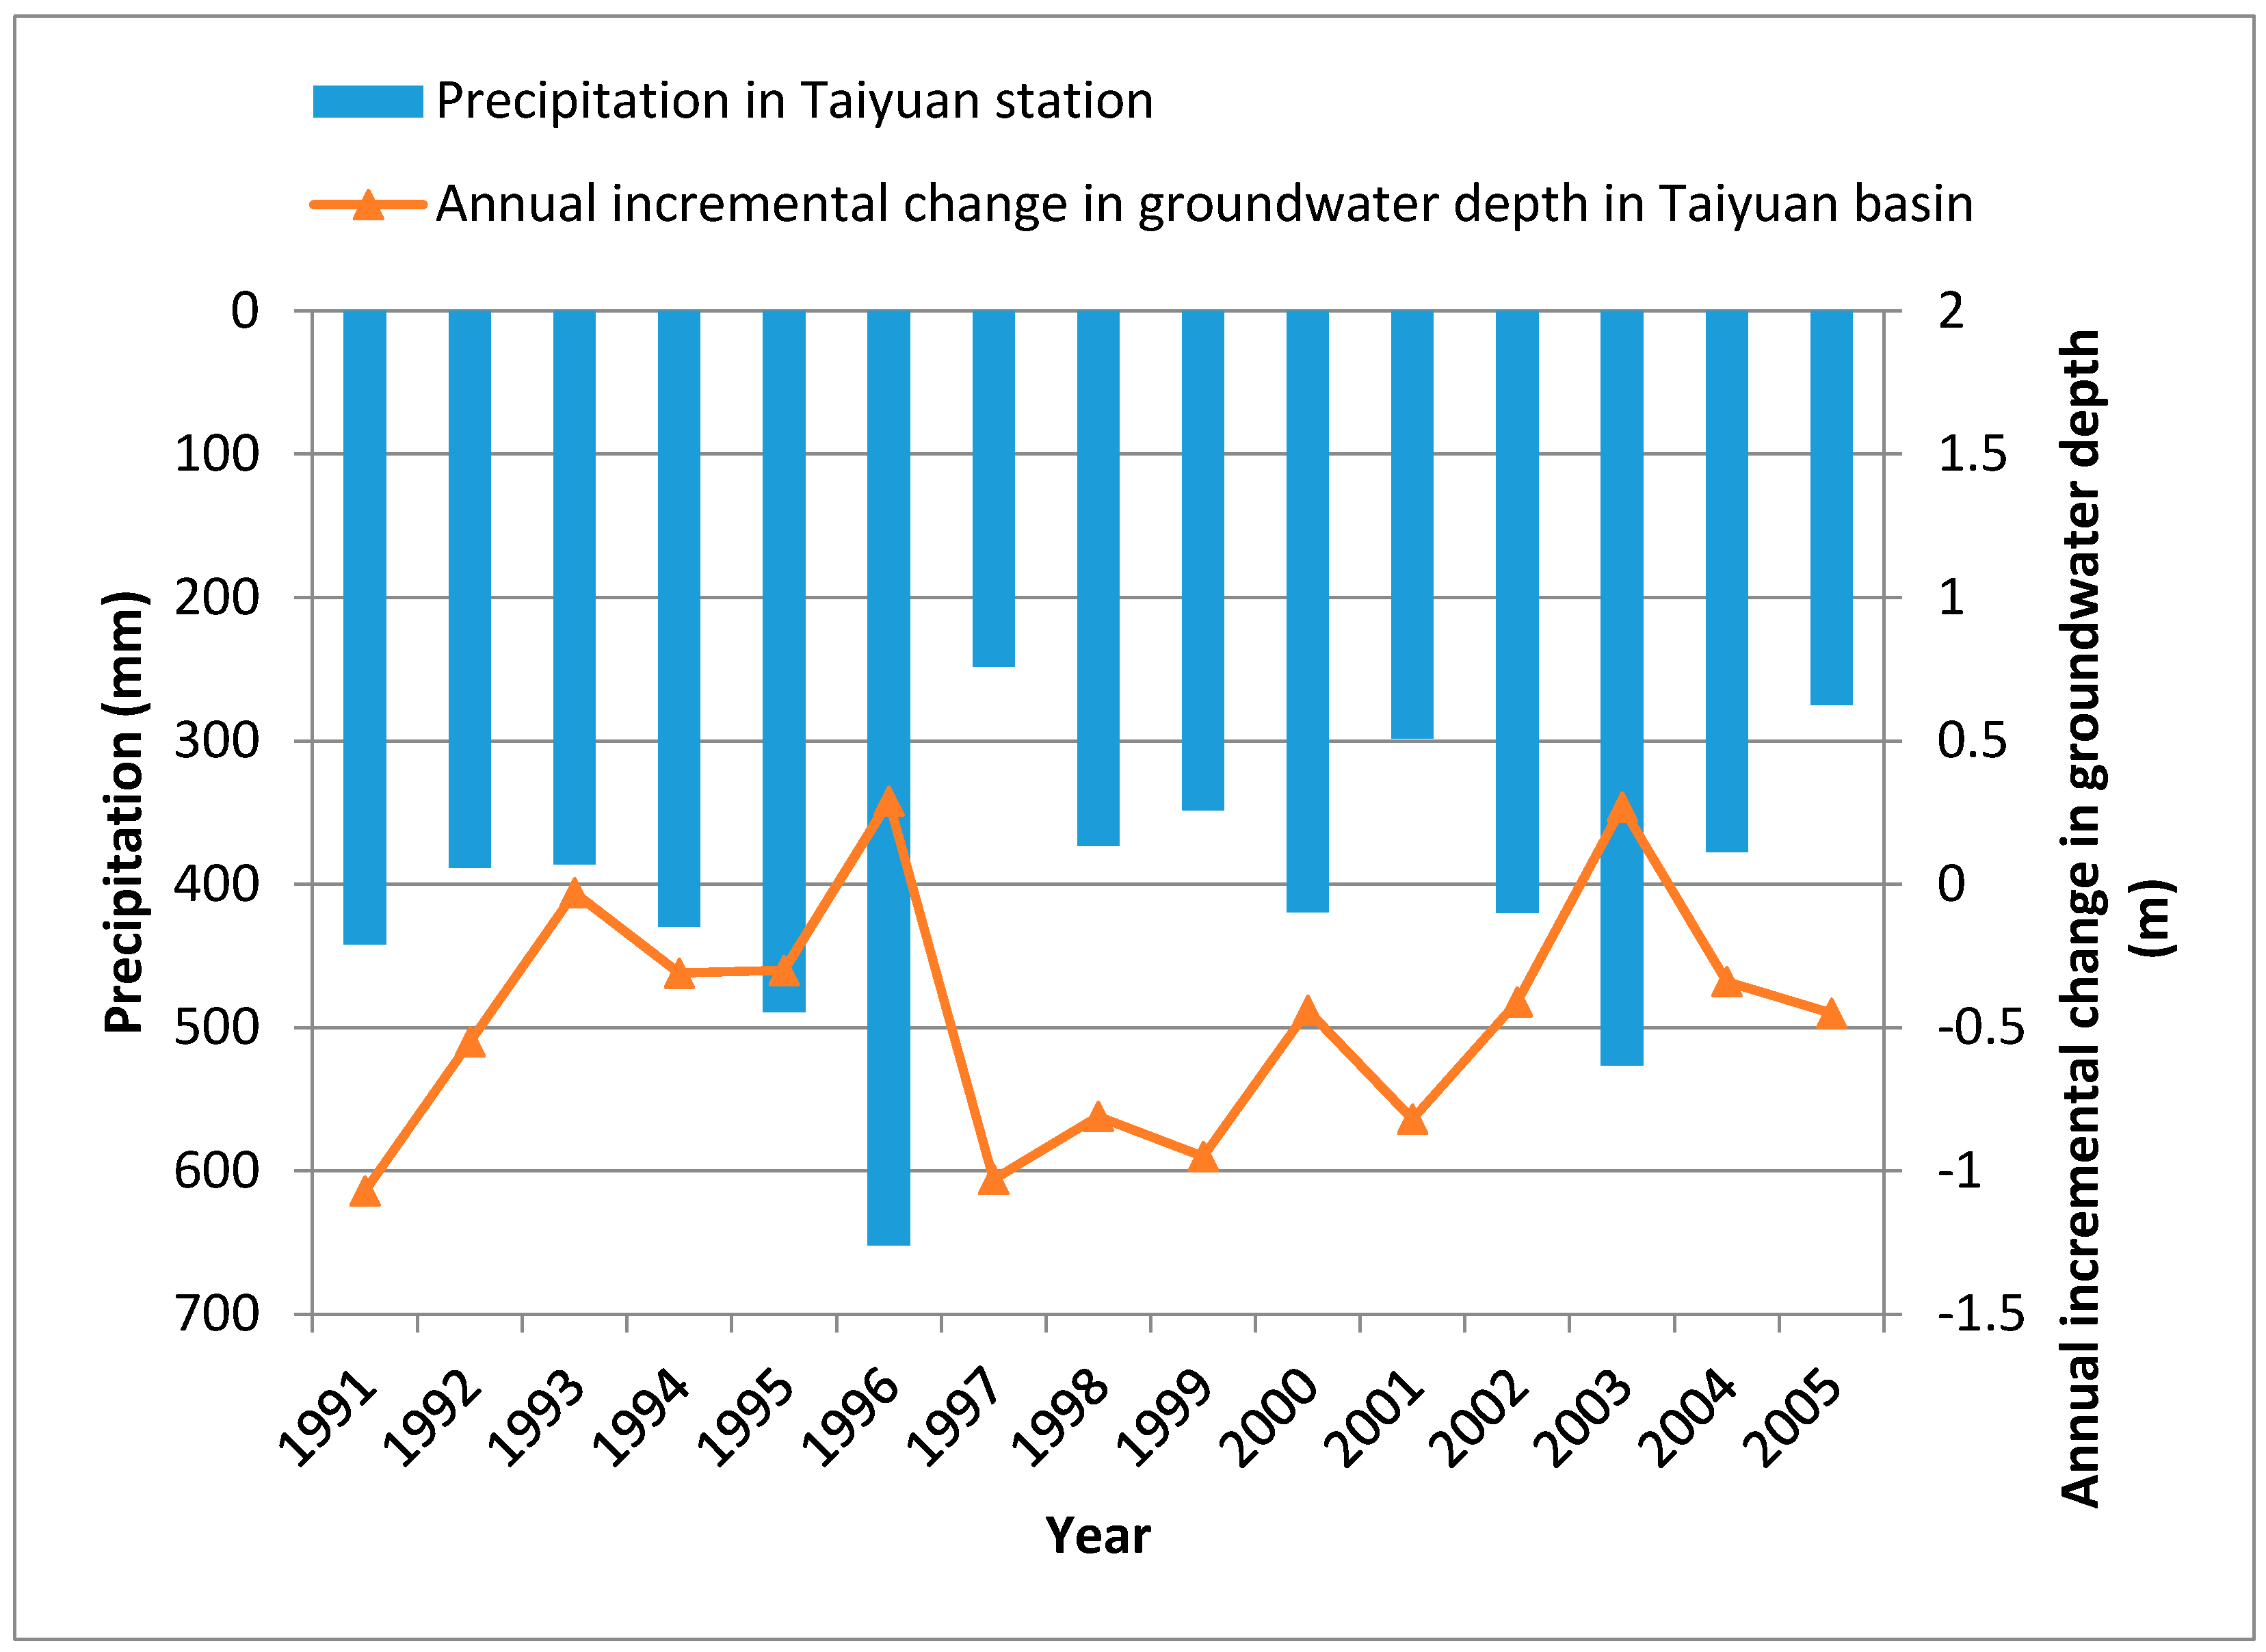
An analysis indicated that the average groundwater depth in the basin was approximately 19.24 m (1991–2005). The trend in groundwater depth, as indicated in
Table 12 and
Figure 9, is consistent with annual precipitation. Drought caused by reduced precipitation is the main factor that affects groundwater depth. The average annual decrease in groundwater depth of the Taiyuan basin, Linfen basin, and Yuncheng basin are 0.46, 0.19, and 0.23 m, respectively.
5. Mitigating Droughts in the Fenhe River Basin
The Fenhe River basin is an important area for crop and cotton production in Shanxi Province, as well as a national energy and heavy chemical industry base. The droughts in the basin have a potential impact on national food security and energy security. Therefore, an immediate solution is required. Based on the characteristics and impacts of droughts in the Fenhe River basin, the following solutions are proposed.
5.1. Water Demand Control
To control the water demand, the Fenhe River basin should develop water-economized and efficient agriculture and low-carbon and water-saving industries, as well as advocate water savings in daily life. Agricultural water use accounts for approximately 45%–55%of the total water use in the Fenhe River basin [
71]. In the future, the region must further adjust the crop structure and develop water-saving rain-fed agriculture practices. According to the effects of drought on local agriculture, the region should plant crops that consume less water. In some fragile ecological areas, the scale of agriculture should be controlled to buffer the pressure on the fragile environment.
Industrial water use accounts for approximately 25%–35% of the total water use in the Fenhe River basin [
72]. In the future, the region must further develop low-carbon and water-saving industries, especially within the energy industry, to eliminate high water consumption and high emission enterprises. Additionally, rainwater collection systems and utilization facilities must be constructed, the use of air cooling technologies must be emphasized, and industrial water must be re-circulated. In terms of domestic water savings, cities should reconstruct their water supply networks and promote the use of water-efficient home appliances, as well as improve sewage treatment and reuse practices.
5.2. Improve the Water Supply
There are four large reservoirs, namely, Fenhe Reservoir, Fenhe Second Reservoir, Wenyuhe Reservoir and Huihe Reservoir, 13 medium-sized reservoirs, and 50 small reservoirs in the Fenhe River basin. The total control area accounts for 45% of the entire basin area, with a total storage capacity of 1.581 × 10⁹ m
3 [
73]. The region should strengthen the intra-annual and inter-annual operation and regulation of water storage projects to increase the water availability. Water must be stored during wet years and flood seasons and supplied in dry years and non-flood seasons to regulate the uneven distribution of water resources at various time scales and reduce the effects of droughts in the basin. Furthermore, a water storage and supply system must be engineered based on the current water supply network. This system must combine natural rivers and the artificial water system using engineering measures. Such a network would increase water security and stability to overcome severe droughts [
74].
5.3. Drought Monitoring and Forecasting
Due to the effects of meteorological, agricultural and hydrological droughts, it is necessary to improve weather forecasting (especially long-term weather forecasts), soil moisture monitoring, river flow monitoring, and regional remote sensing, which can enhance drought forecasting and early warning systems [
75]. Additionally, the construction of a regional platform for sharing information should be emphasized, and a decision support system must be established as soon as possible to provide modern, scientific, and standardized drought relief measures. Additionally, such systems can enhance the accuracy of drought prediction in advance and reduce disaster losses caused by drought.
5.4. Emergency Water Supply
Emergency water resources must be established to improve the ability to cope with excessive and extreme regional droughts. It is necessary to enhance the capacity of the surface water supply and divert surface water underground during wet years and flood seasons to preserve water [
76]. Moreover, improving the water supply capability of springs is advised. In addition, enhancing the construction of sewage treatment plants in cities is required to increase the reuse of reclaimed water. Furthermore, drought contingency plans and emergency procedures should be established. During some dry years, emergency water resources may partially offset the effects of drought. Additionally, drought emergency planning and the construction of emergency response mechanisms must be emphasized at the regional scale.
5.5. Non-Engineering Measures
Non-construction approaches are required to improve the efficiency of water resources and the ability to cope with droughts through policies and regulations, economic measures, social management and other measures. According to the Regulations on Combating Drought in China, regulations regarding the management of water conservancy projects, drought early warning systems and information, and statistical reporting systems of regional floods and droughts must be established. In terms of economic measures, market regulation must be strengthened, including the adjustment of industrial structures, the rational use of a virtual water trade strategy, the improvement of drought security and relief strategies, etc. In terms of social management, a stringent water management system must be implemented, and water-saving techniques must be implemented immediately.
6. Conclusions
Through an analysis of the causes and characteristics of droughts in the Fenhe River basin, as well as their multiple influences, it was discovered that droughts are likely to occur frequently in the basin and have many severe impacts on socio-economic sectors and the environment. Therefore, in future work, both engineering approaches and non-engineering approaches for mitigating the effects of droughts should be improved. Suggestions for this are as follows. First, through the management of the water demand, including the promotion of agricultural, industrial and domestic water conservation, the demand for water resources must be decreased in all sectors. Second, strengthening water storage projects and emphasizing the construction and operation of water management systems can strengthen the water resources regulation in the region, specifically, the inter-annual and inter-regional regulation, which can increase the water supply security. Third, drought monitoring and early warning systems must be improved, and emergency water sources must be established, including through non-engineering measures (e.g., economic measures, policies, regulations and social management) to cope with droughts in the Fenhe River basin.


 ,
, 


