1. Introduction
A sudden valve closure has always created complex conditions capable of causing major problems and damages to the water conveyance systems. So far, many methods have been proposed and used to overcome these problems, e.g., surge tanks, air vessels and different types of valves. Of those methods listed, air vessels have been used more frequently with better application because of their economic and the stability advantages. An air vessel is capable of controlling both negative and positive pressures and usually, the outflow action from an air vessel to the pipe has less head loss than the inflow into the air vessel to control the negative pressure [
1]. Most of the previous and recent studies in air vessel sizing have investigated the entrance connection situation effect. Plenty of charts and graphs are presented by these studies for the air vessel sizing [
2,
3,
4,
5,
6]. However, most of them are rarely used for sizing purpose because of the simplification assumptions made for their preparation. Instead, a trial and error approach for checking the minimum and maximum pressure in the pipe is used. By means of throttling the entrance in the air vessel, smaller air vessel sizes can be achieved. Based on this concept, Martino and Fontana [
5] proposed a method for sizing air vessels based on optimizing the throttling. Nevertheless, the confined air in a hydraulic system can amplify the pressure peaks from a transient action and make the transient situation more complex due to the compressibility of the air. Hence, there is actually a great necessity for studies about air pocket (AP) behavior during a fast-transient occurrence that can provide great knowledge in the primary sizing of air vessels and more reliable final decisions in water pipe systems’ behavior and safety. Hatcher and Vasconcelos [
7] studied the behavior of an air pocket inside a pipe using an experimental approach, giving useful information to fill the gap between numerical models and real situations. They declared that few experimental studies focused on the effect of parameters related to the geometry of the system as well as air and flow conditions.
Several researchers have worked on the behavior of air in the rapid filling subject or entrapped air bubbles along a pipeline [
8,
9,
10]. There are some studies that investigate the thermodynamic prediction and behavior of an AP under slow-transient which consider the heat transfer process that is negligible in fast-transient cases [
1]. Usually, it is assumed that fast-transient thermodynamic behavior obeys the polytropic equation, while in experimental works, it was shown that this equation is not obeyed for a special range of AP sizes and Reynolds number (Re) [
11]. For that reason, more analysis of AP behavior, specifically for small APs, seems to be required.
This present work studies the behavior of an AP in a sophisticated experimental apparatus for different major governing variables. In this study, the outflow way at the air vessel entrance is closed using a check valve (CV) to store the surge pressure from a fast-transient action induced by a water hammer (WH) event. It helps to study the compression phase of an AP as in real conditions. Furthermore, the expansion phase investigation is also provided by means of a ball valve (BV) at the lower level of the air vessel. Placing a CV in the air vessel entrance allows the examination of a micro-CAES (compressed air energy storage) system for storing the surge pressure in small-scale (SS) size. A traditional CAES system stores energy from a cheap and sustainable source inside underground caverns which is a major limitation of this technique. Energy is stored as pressure in compressed air in low-peak hours and the stored energy is recovered during high-peak hours. SS-CAES systems are defined in the net power range of 10 kW to 10 MW [
12]. SS-CAES systems may present good alternatives for common generators without using electricity [
13]. A water-compensated micro-CAES or SS-CAES system is the focus of this study to examine the storage ability of confined AP within a compressed air vessel (CAV). The size of the air vessel needs exact investigation, in this case affecting the applicability and efficiency of the system. Mostly, the cylindrical shape is more economic and practical for air vessels. To achieve the most effective air vessel size, the most important parameters are the maximum pressure and the AP volume fraction within the air vessel. In a previous study, Kiam and Favrat [
14] proposed a SS-CAES system with constant air pressure using a column of water. In a review work, Budt et al. [
15] presented a wide review of CAES systems from past to future, addressing the main challenges for their development. One challenge that they indicate appears in the lack of appropriate tools for the detailed simulation of CAES systems [
15]. Experimental works can provide valuable background for similar challenges by examining various parameters, relating them together and presenting dimensionless variables.
Understanding the behavior of a confined air pocket (AP) under different events of WH seems to give substantial knowledge for future experimental studies or real field designs. In this study, a well-equipped experimental apparatus was used to test and measure AP reaction under three WH events’ conditions, namely the occurrence of one WH (1WH), five WHs (5WH) and nine WHs (9WH). In this study, the stored amount of pressure inside the AP for different flow conditions has been assessed. Also, the ability of WH to relocate water to another place with a similar action to the old ram pumps was also examined. To find the behavior of the system as a WH protection vessel, the effect of each parameter on the pressure and the velocity changes along the pipe system has also been investigated. The major considered parameters in this research are constituted by flow velocity, which in the presented graphs is related with Reynolds number (Re); volume fraction ratio (VFR) of air; the storage amount of pressure within each AP; and the relocated volume of water. The VFR is defined as the ratio of air volume to water volume inside the CAV, in percentage.
2. Measurements
The experimental apparatus, as shown in
Figure 1, is composed of PVC pipes and a transparent PVC compressed air vessel (CAV) with 0.10 m diameter and 0.60 m height. The CAV includes an air pocket (AP) at the top and a water column (WC) at the lower part. A pump creates a circulation flow with different flow velocities. A fast closure electro-pneumatic ball valve (EBV) has been used to create one or several consecutive WH phenomena in the system. Three check valves (CV) are installed to block the returning way of the flow. A pressure transducer (PT) and an ultrasound velocity profiler (UVP) were used for recording the pressure and flow velocity during the tests. The UVP represents both a method and a device for measuring an instantaneous velocity profile in the water flow along the ultrasonic beam axis by detecting the doppler shift frequency of echoed ultrasound as a function of time. The doppler was installed on a horizontal pipe before the EBV location. There are two PT in the system; one located at the top of the CAV and the other upstream of the EBV. Tests are fulfilled in two different conditions of the BV located at the lower level of the CAV for discharging the water; (i) closed BV for measuring the stored pressure within the AP; (ii) open BV for measuring the relocated water volume. An open water tank is placed downstream of the outflow pipe from the CAV, which provides a tool to collect water and measure the relocated water volume after each test.
Different AP sizes (and related VFRs) and flow velocities are considered during the tests. To cover a wide range of AP sizes, seven AP lengths, i.e., 2, 3, 4, 5, 10, 20 and 40 cm were tested with corresponding VFRs of 3.17%, 4.75%, 6.33%, 7.92%, 15.84%, 31.67% and 63.35% respectively. Also, seven flow velocity values of 1.00, 1.50, 2.00, 2.50, 3.00, 3.50, 4.00 and 4.50 m/s and Re of 36,000, 56,000, 75,000, 93,000, 115,000, 132,000 and 155,000 are used for testing each VFR value with different combinations of VFR and Re.
Several WH tests, i.e., 1WH, 5WH and 9WH have been fulfilled, induced by EBV for different Re and VFR magnitudes. The numerous part of 1WH, 5WH and 9WH symbols shows the number of WH repetitions during each test. During these series of tests, the surge pressure obtained in WH action is conducted toward the CAV to store the pressure in the AP. Measurements for different tests were carried out in similar initial conditions of velocity and pressure in the pipe system and AP. The initial AP pressure was adjusted to a constant value equal to the atmospheric pressure throughout all the tests to achieve the maximum pressure during the transient action [
16].
3. Results
3.1. Tests with Closed BV
When the BV is closed, the WH allows the observation of the storage ability of each AP. This type of transient action is important in protection vessels and also in SS-CAES applications. The measured pressure shows that the AP is able to retain an amount of pressure as stored energy after finishing the tests due to the compressibility and confinement effects.
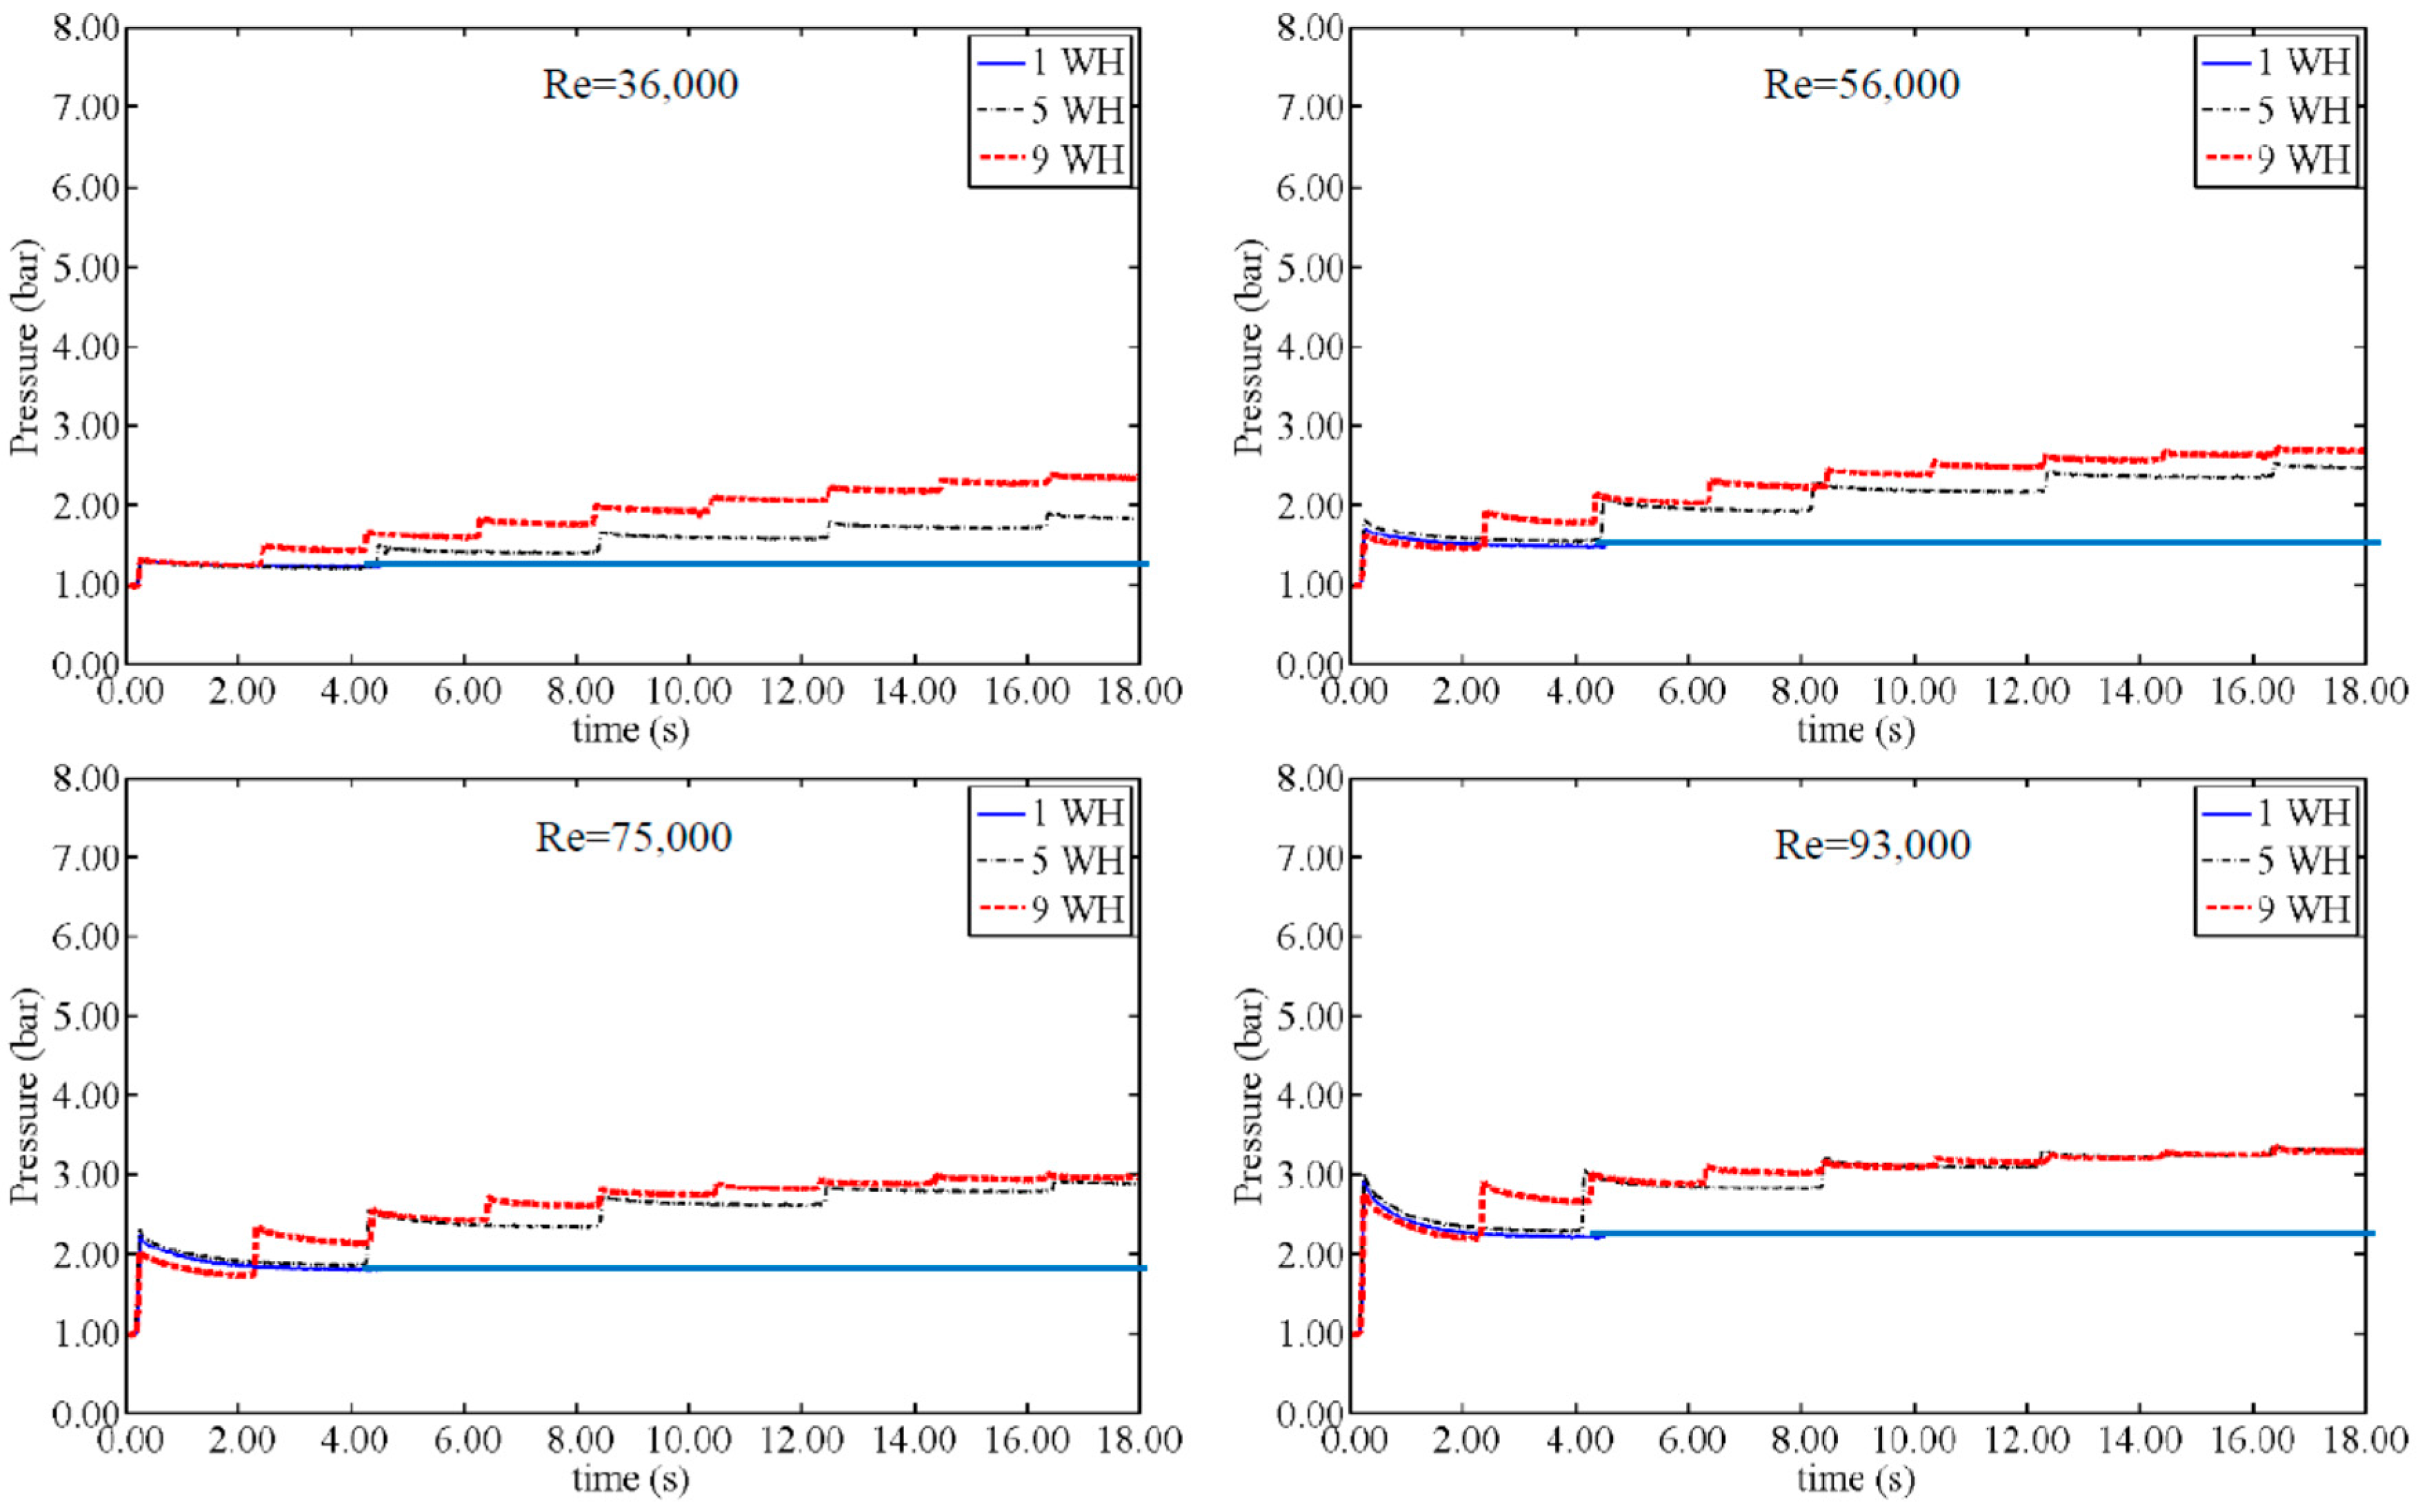
Figure 2 shows the pressure change for different velocities of an AP = 3 cm (VFR = 4.75%). The pressure related to the first peak is called “peak pressure” and is referred by P
1p. As in
Figure 2, an amount of pressure has been stored in the air pocket after the test which is called “stored pressure” and is shown by P
s. Graphs show a large growth in the peak pressure with increasing Re, while similar growth does not occur in the stored pressure. As it can be seen in
Figure 2, from Re of 36,000 to 155,000, the peak pressure is changed from 1.33 bar to 6.25 bar. However, the stored pressure in the AP varied from 2.33 bar to 4.51 bar. Previous work [
17] showed that either decreasing the VFR or increasing the Re will amplify the peak pressure considerably. Similar behavior exists for the stored pressure change, i.e., stored pressure with direct correlation to the flow velocity, but this is in contrast to the VFR. Results show that decreasing the VFR will continuously increase the stored amount of energy. For the VFR = 4.75% shown in
Figure 2, the pressure change during 5WH and 9WH tests starts by increasing steeply and eventually ends up at the final stored pressure with smaller increases. The final magnitude of the stored pressure is also directly related with Re.
When comparing the stored pressure and peak pressure, in most of the tests the magnitude of the stored pressure is higher than the peak pressure, as expected. However, in some tests related to small AP and high Re, the amount of peak pressure is extremely high and even after the pressure storage cycles, the stored pressure remains smaller than the peak pressure. Some general rules can be stated based on results from these tests for all the Re and VFR as shown in
Figure 3:
For Re of 36,000, 56,000 and 75,000, the stored pressure is always higher than the peak pressure (Ps > P1p);
For large values of an AP, i.e., VFR > 11%, the stored pressure is always higher than the peak pressure (Ps > P1p).
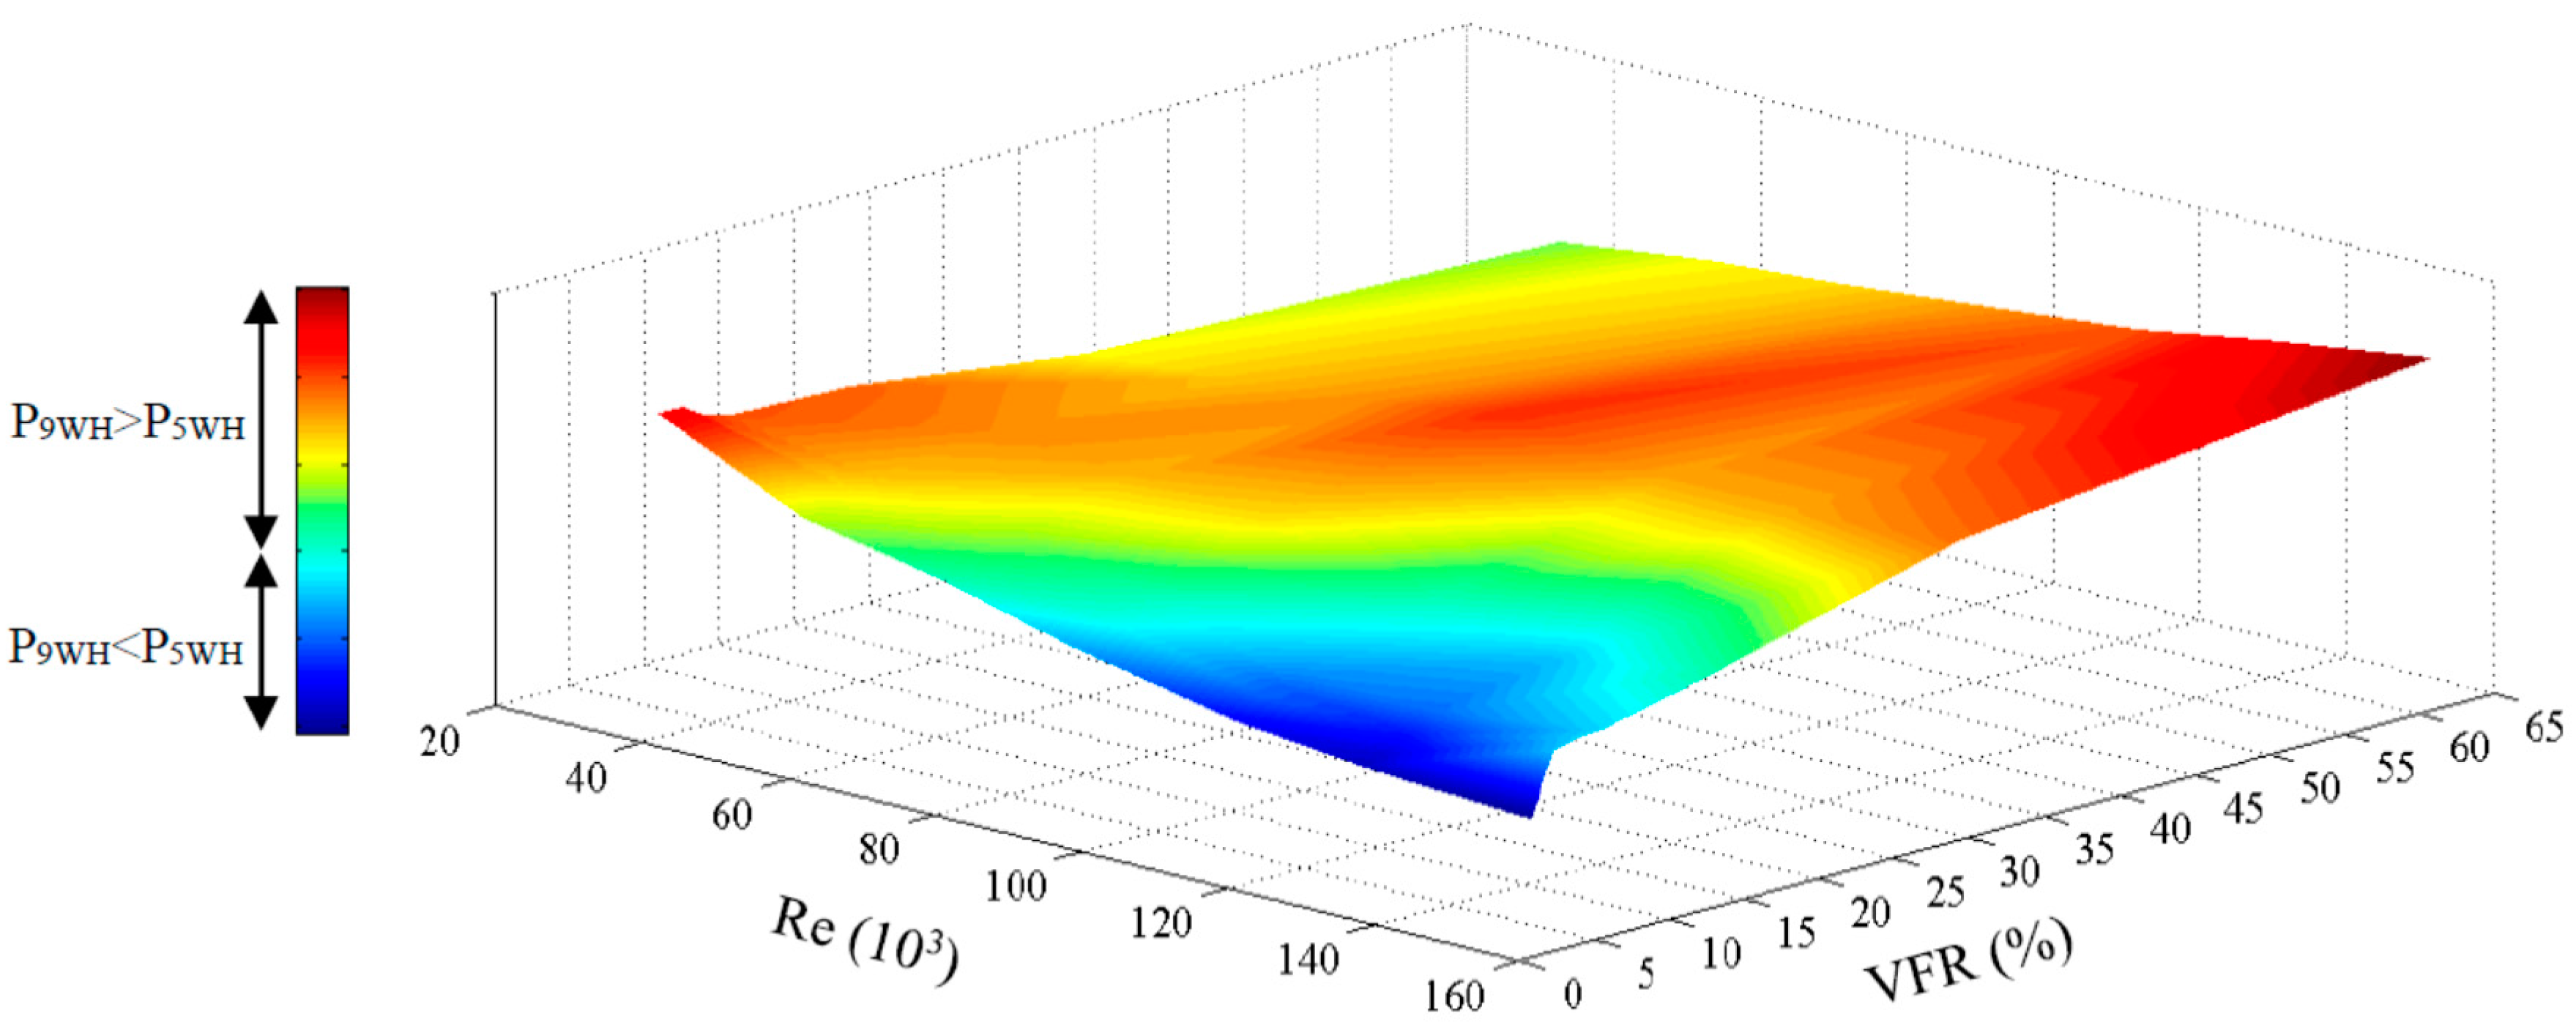
As a logical expectation, the final stored pressure should be higher in the 9WH test in comparison to the 5WH test as a consequence of more WH events. Nevertheless, graphs show higher pressure storage magnitudes in 9WH tests when Re is low while for higher Re, the recorded pressure magnitudes of 9WH tests become less than or equal to 5WH pressure magnitudes. Large AP lengths of 20 cm and 40 cm (VFR > 30%) do not obey this rule; in other words, for these two APs, the recorded pressure of 9WH is always higher than for 5WH values. A comparison of the pressure magnitudes of 9WH and 5WH is presented in
Figure 4, demonstrating the non-conforming behavior of a small VFR and high Re values.
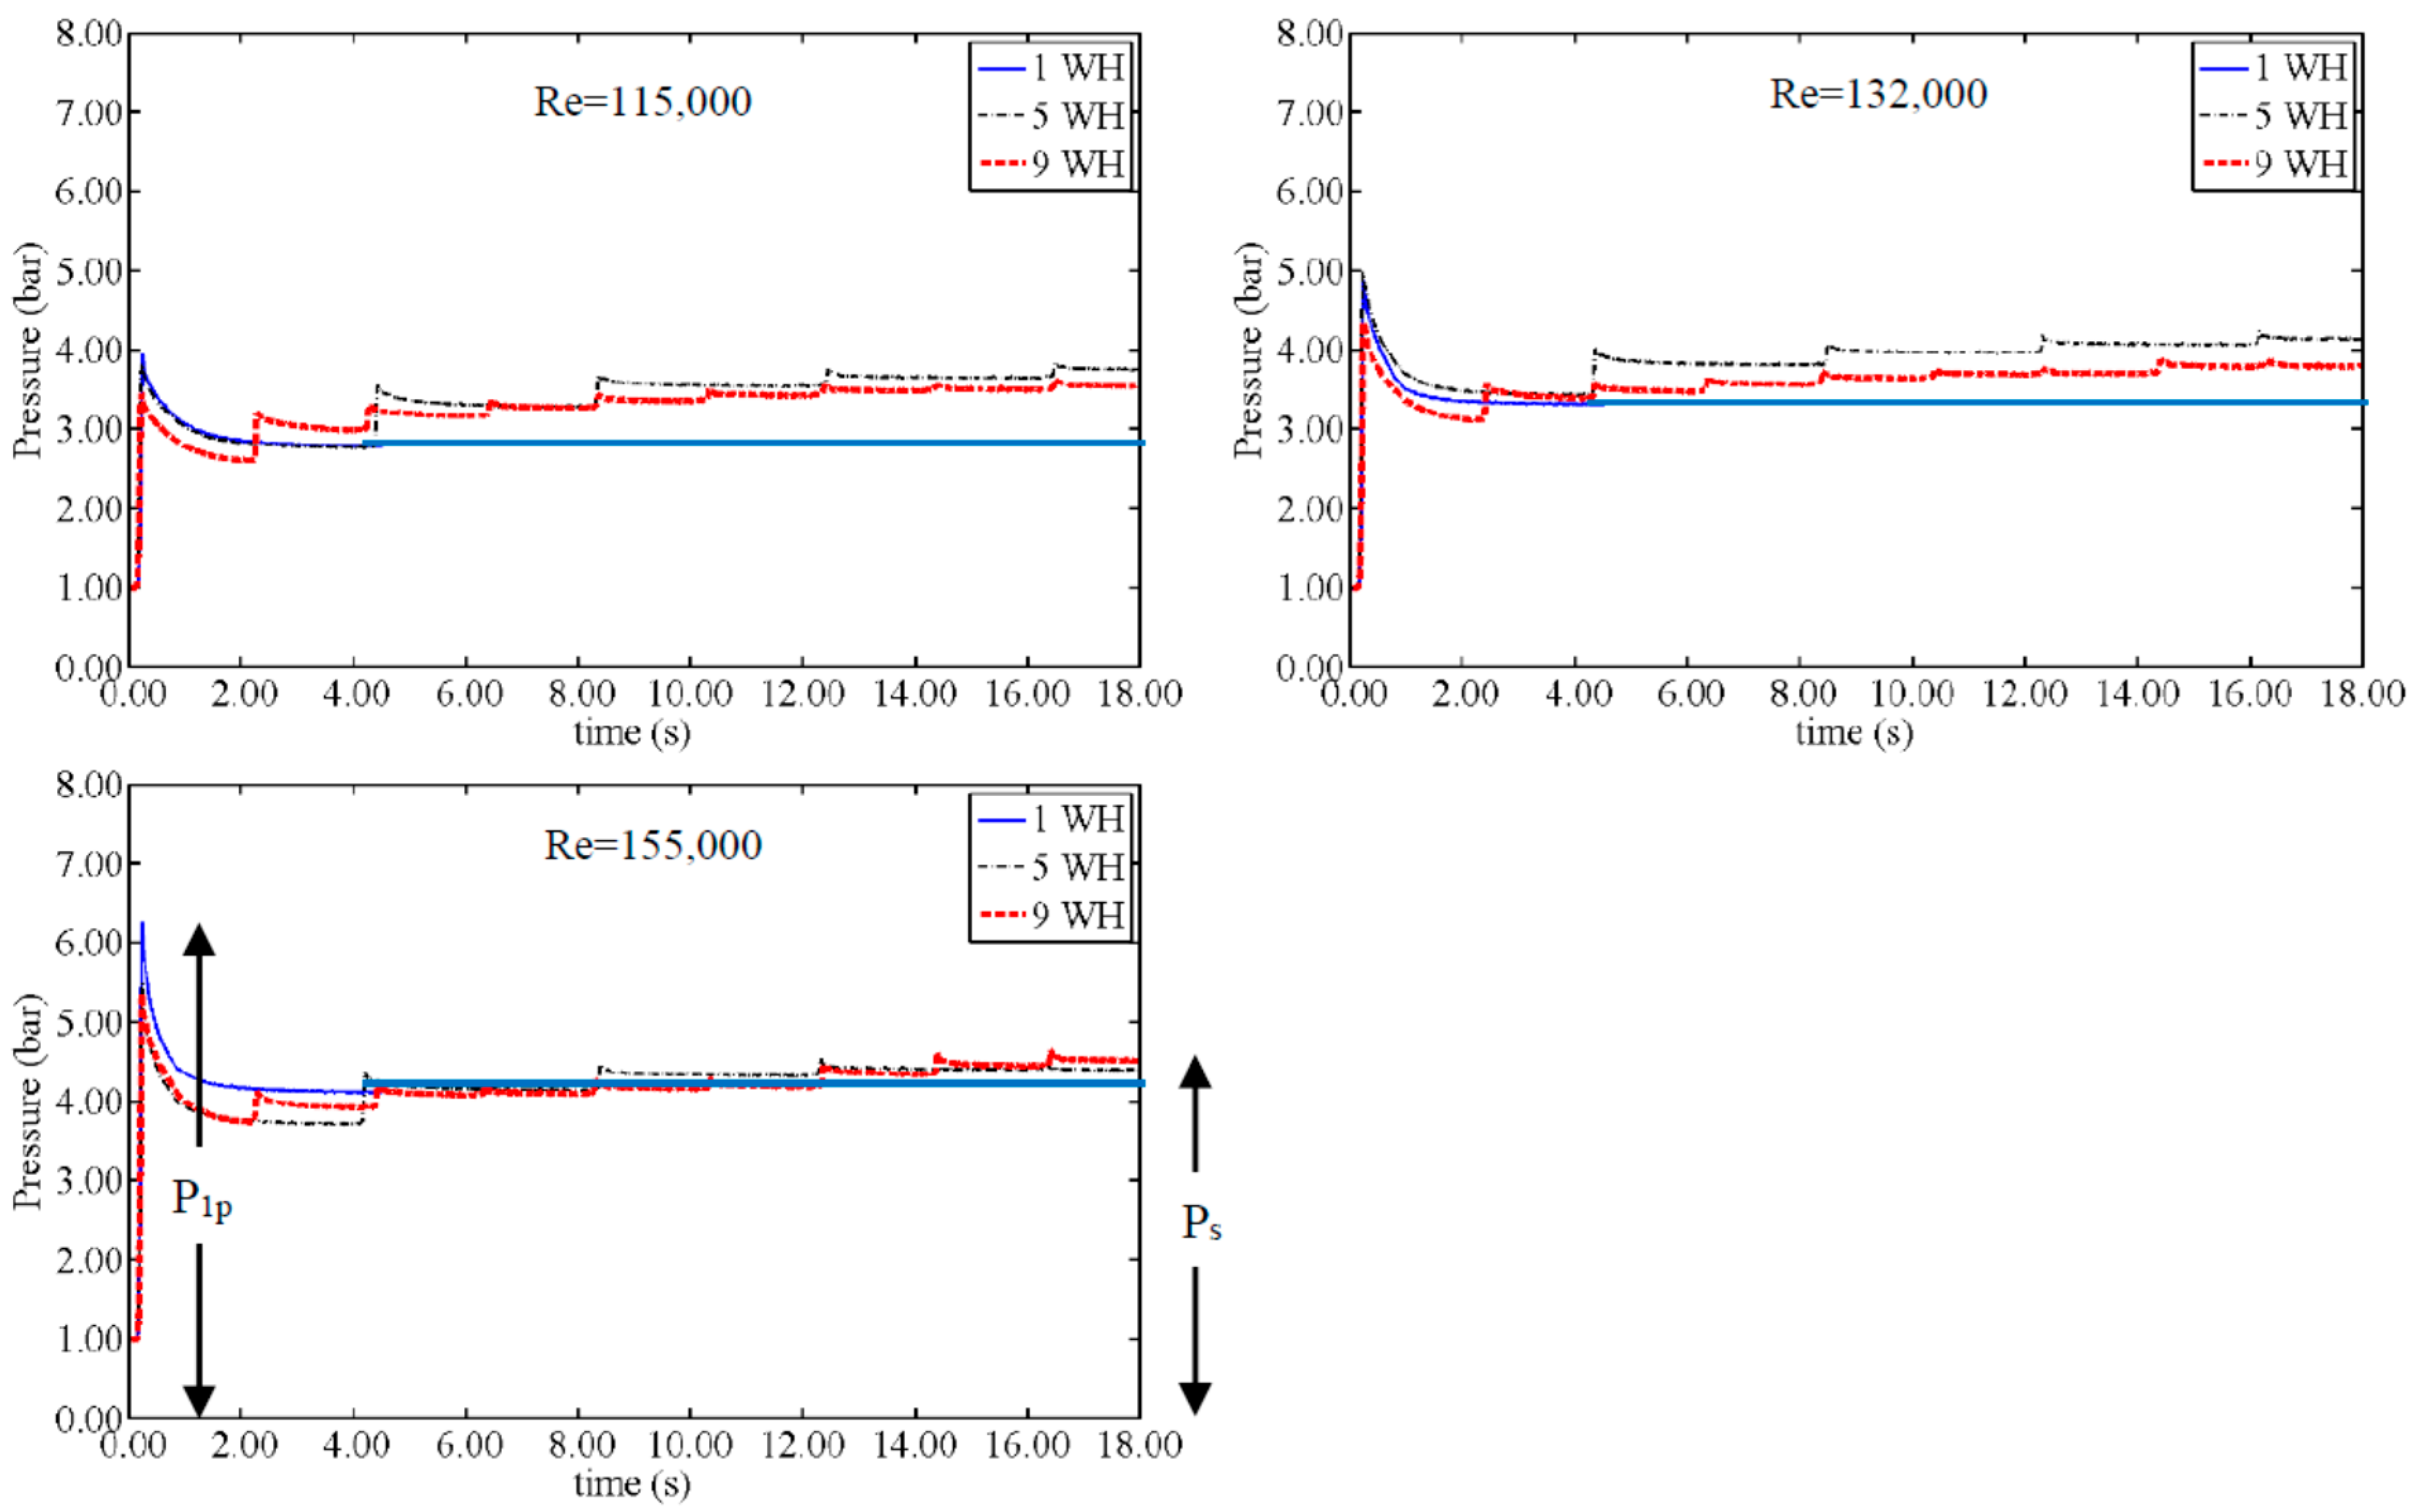
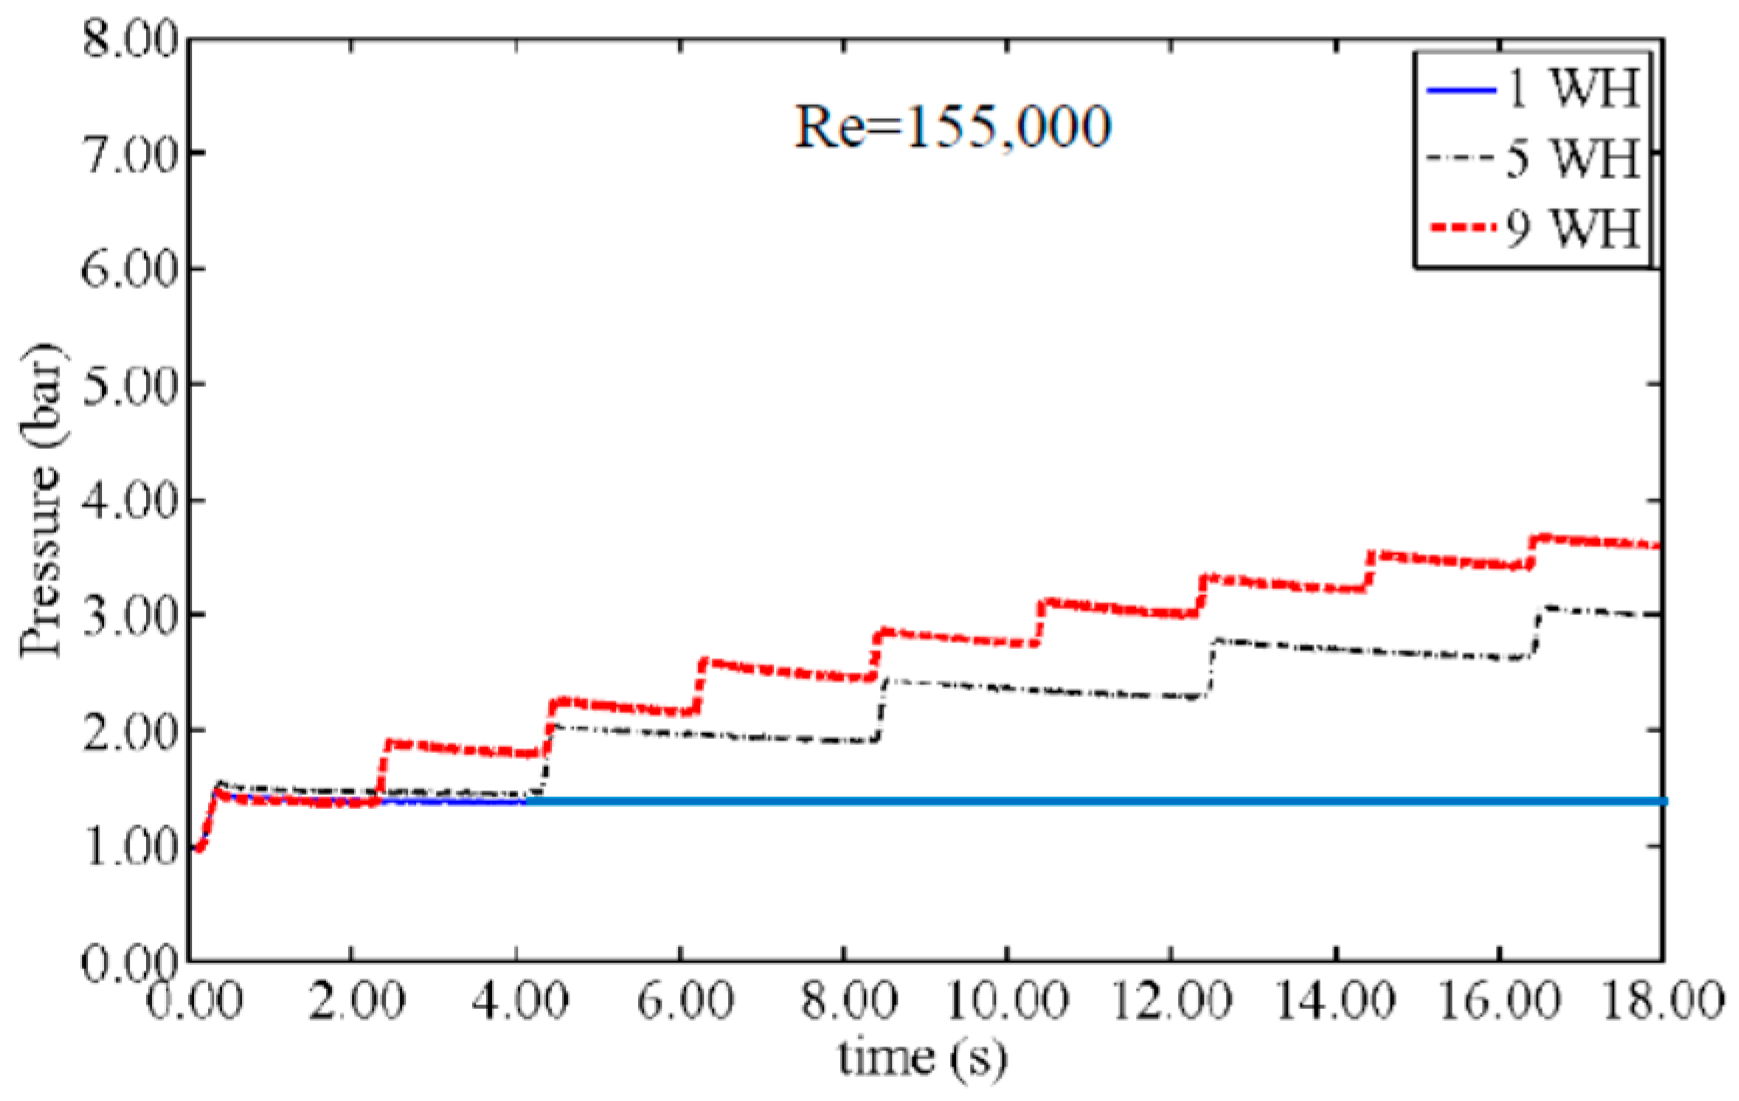
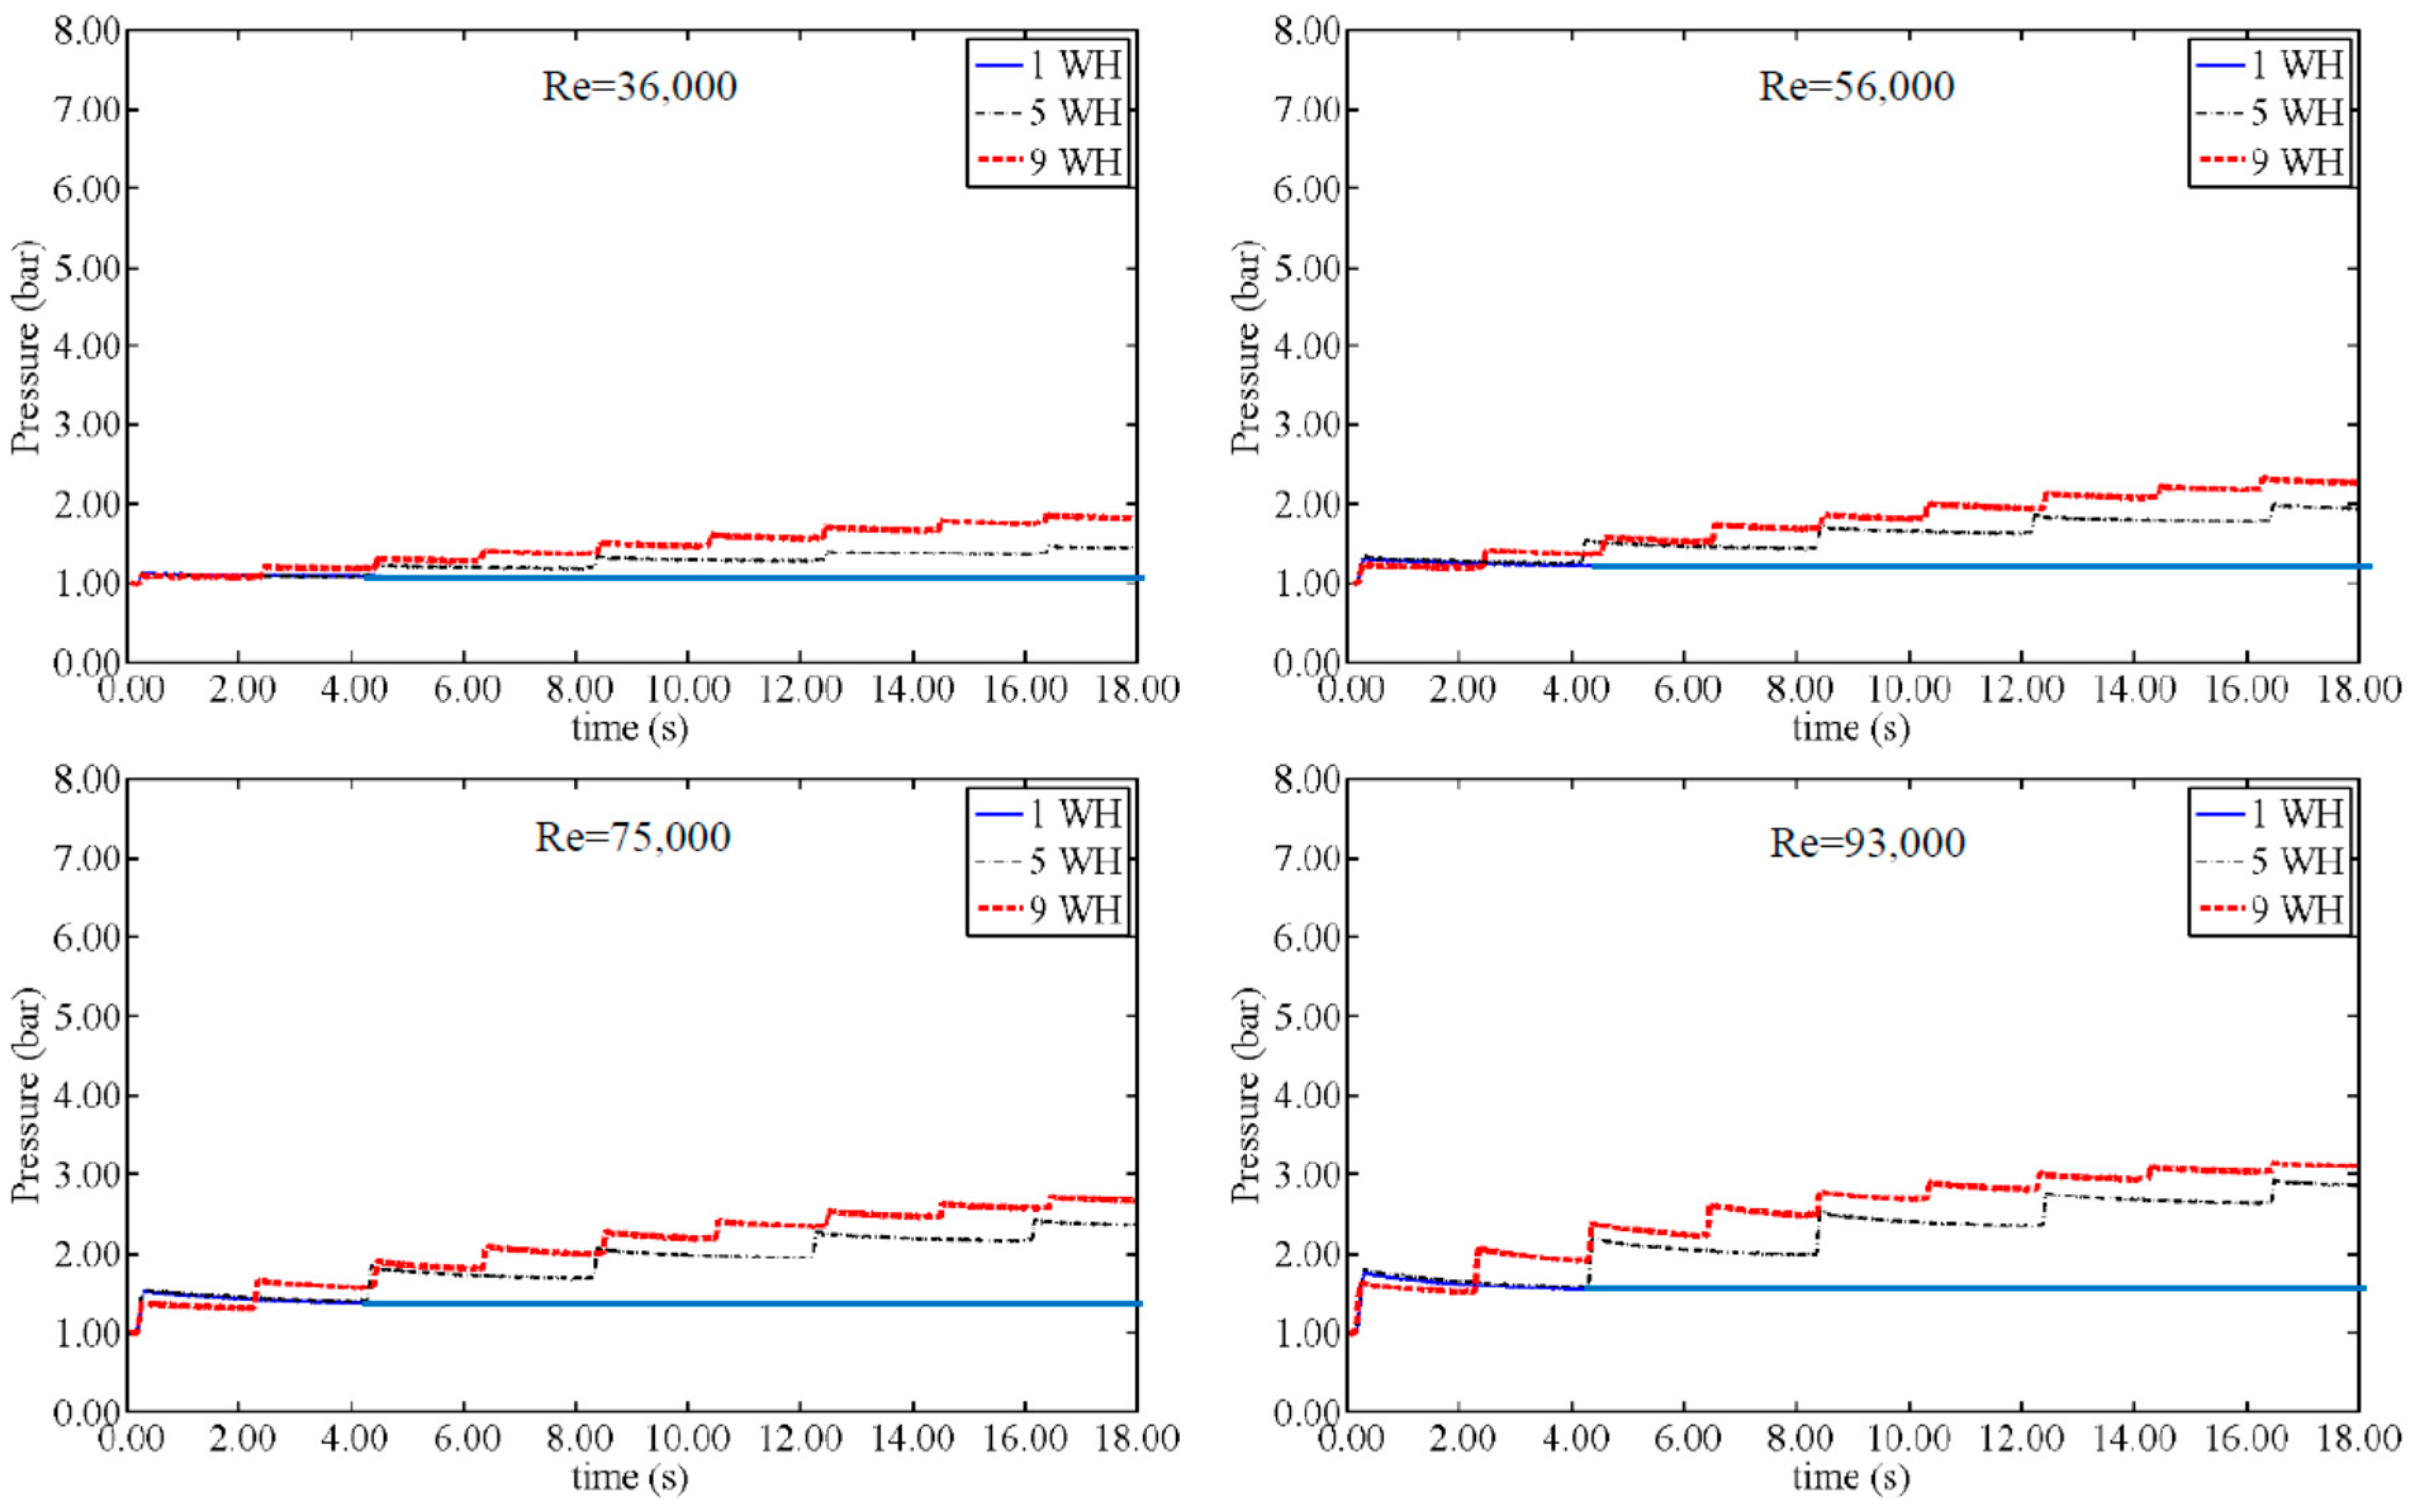
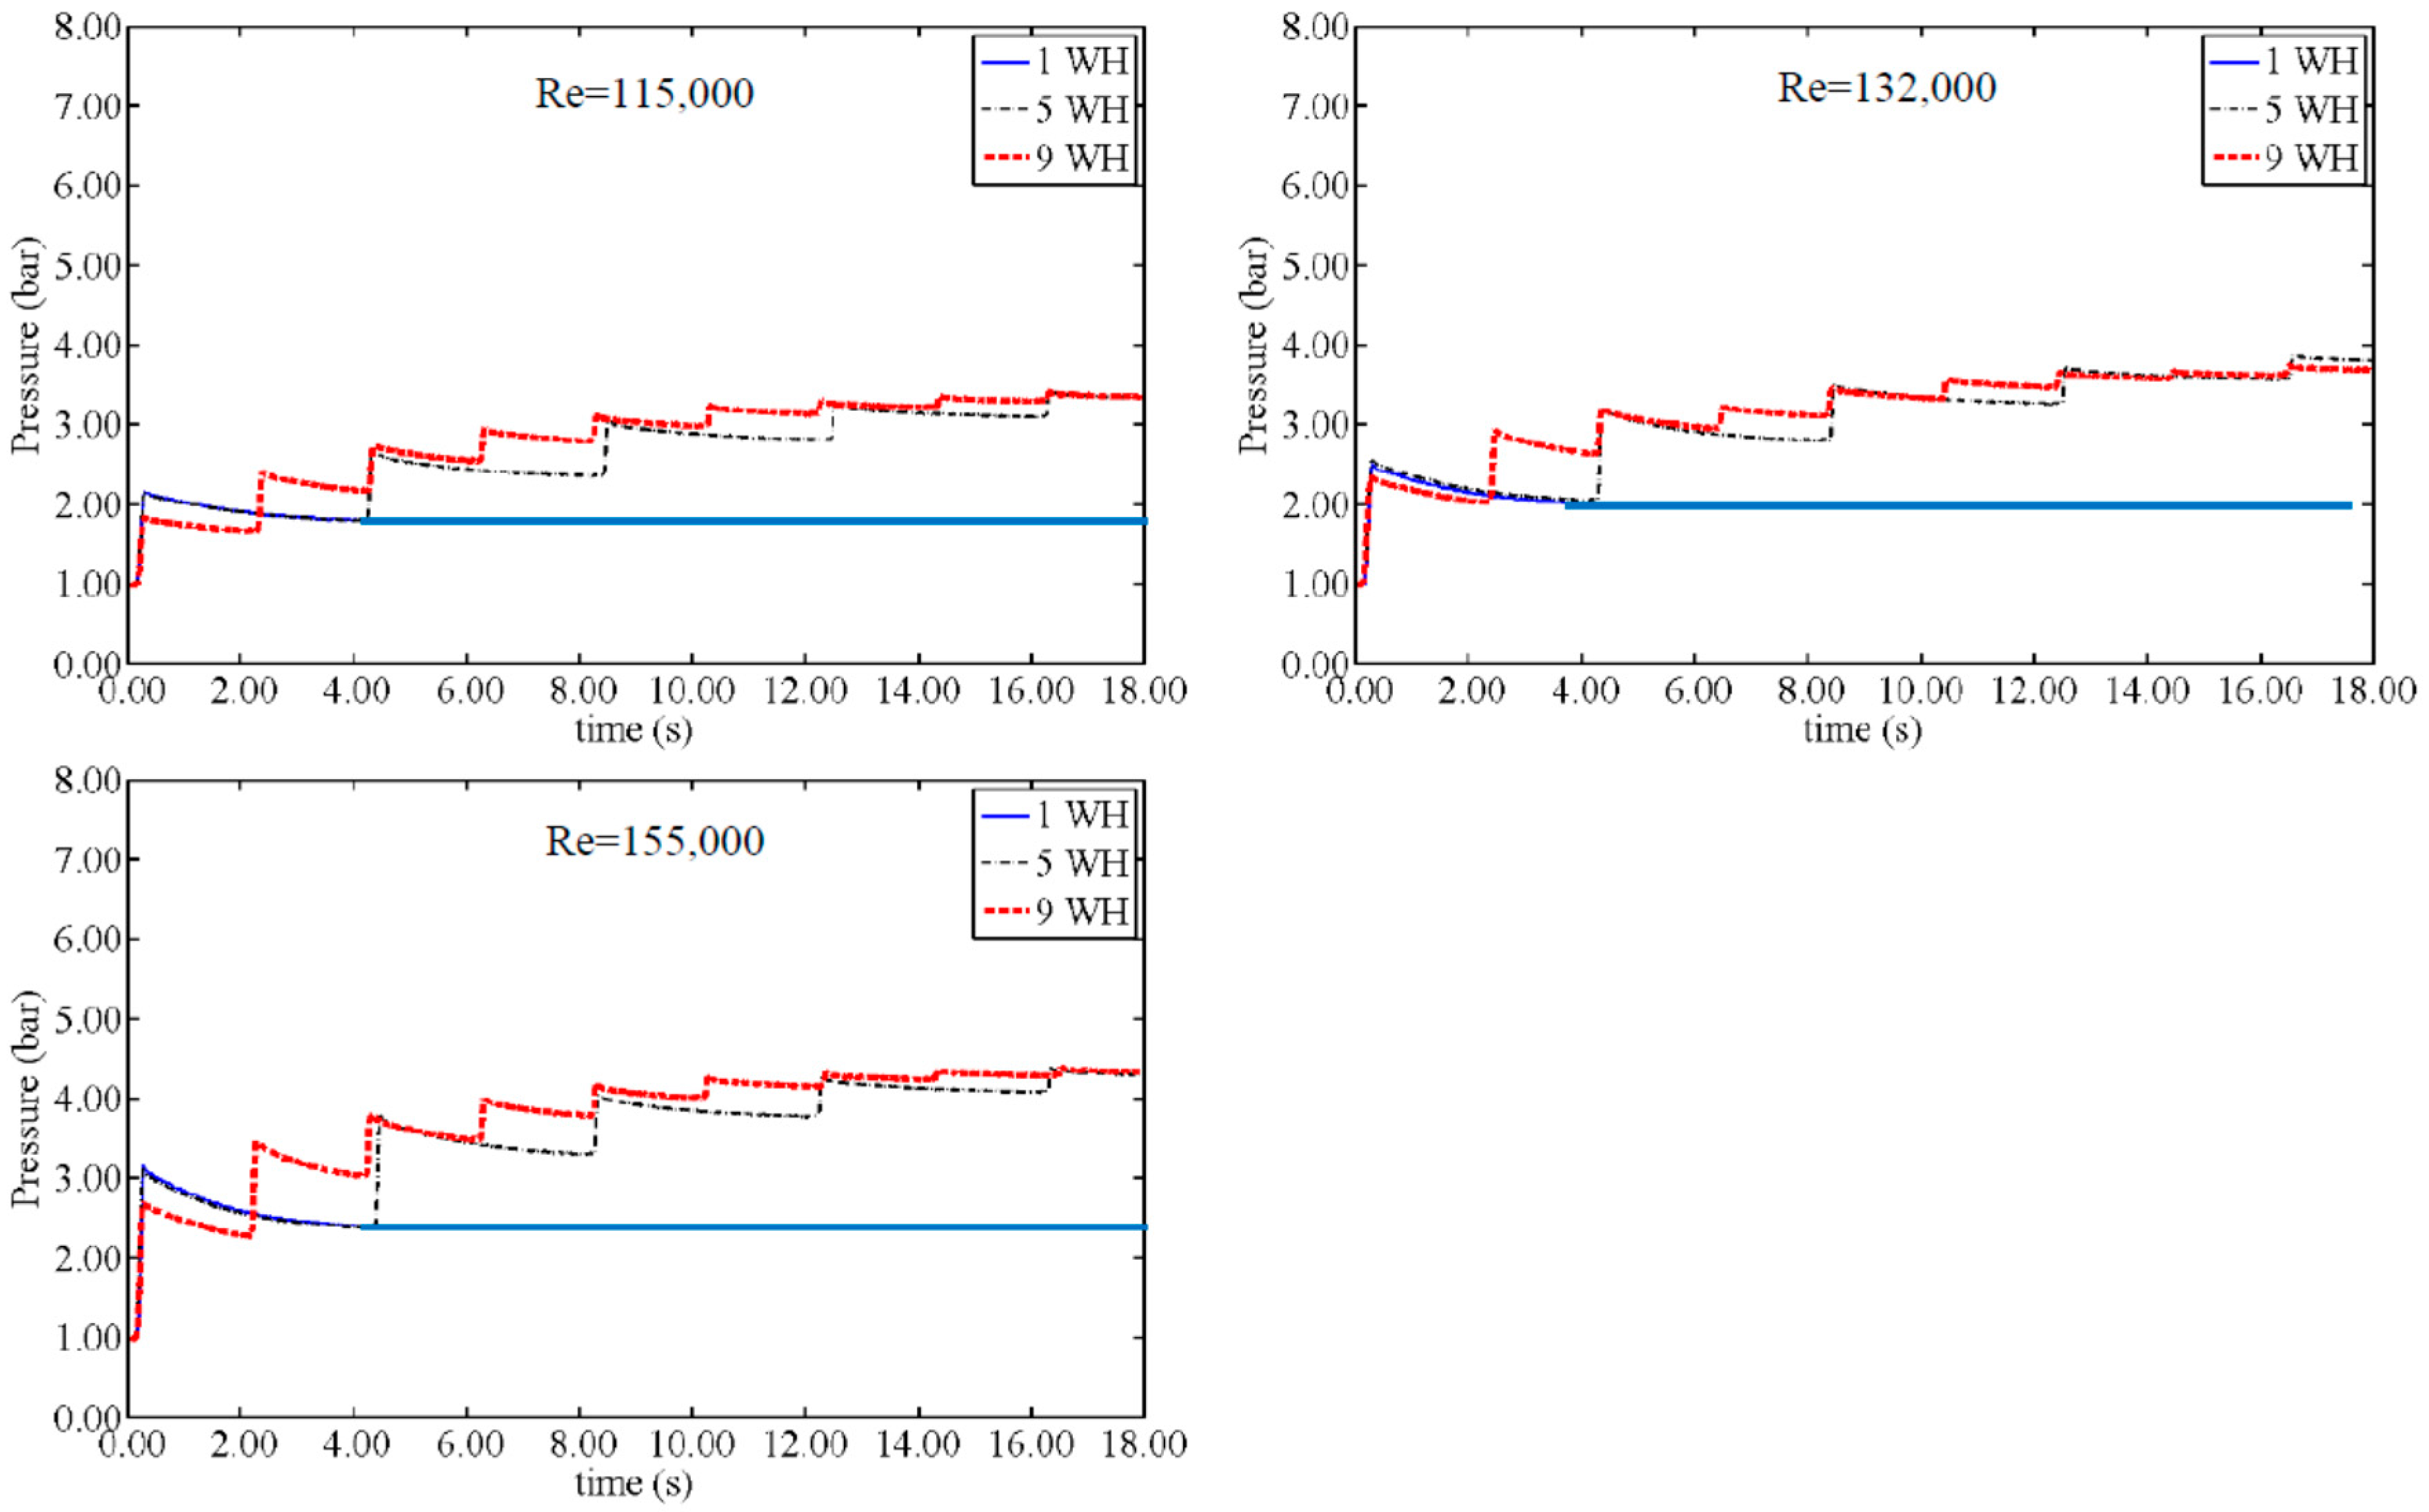
Figure 5 and
Figure 6 show the route of change in pressure recorded from 1WH, 5WH and 9WH tests for AP lengths of 10 cm and 40 cm (VFR of 15.84% and 63.35% respectively) in order to demonstrate the behavior of an AP in more detail. For small values of VFR, as in
Figure 4 and
Figure 5, pressure variation shows irregular steps during the WH events. In the case of low Re values, small and almost equal steps have been recorded for all VFR. The larger values of Re show big increments at first WH steps and fast dissipation steps at the final events. In addition to irregular steps, considerable higher stored pressure was not recorded for the 9WH in comparison with the 5WH test, representing behavior against the usual expectation for obtaining higher stored pressure as a consequence of more WH events. On the other hand, the magnitude of pressure steps remains nearly constant for every Re value related to a high VFR in measurements similar to
Figure 6. Furthermore, in this range, the stored pressure of 9WH tests always stays larger than the 5WH stored pressure, as explained before. Accordingly, 1WH tests are shown to be regular and constantly increasing in the stored pressure when increasing the Re number.
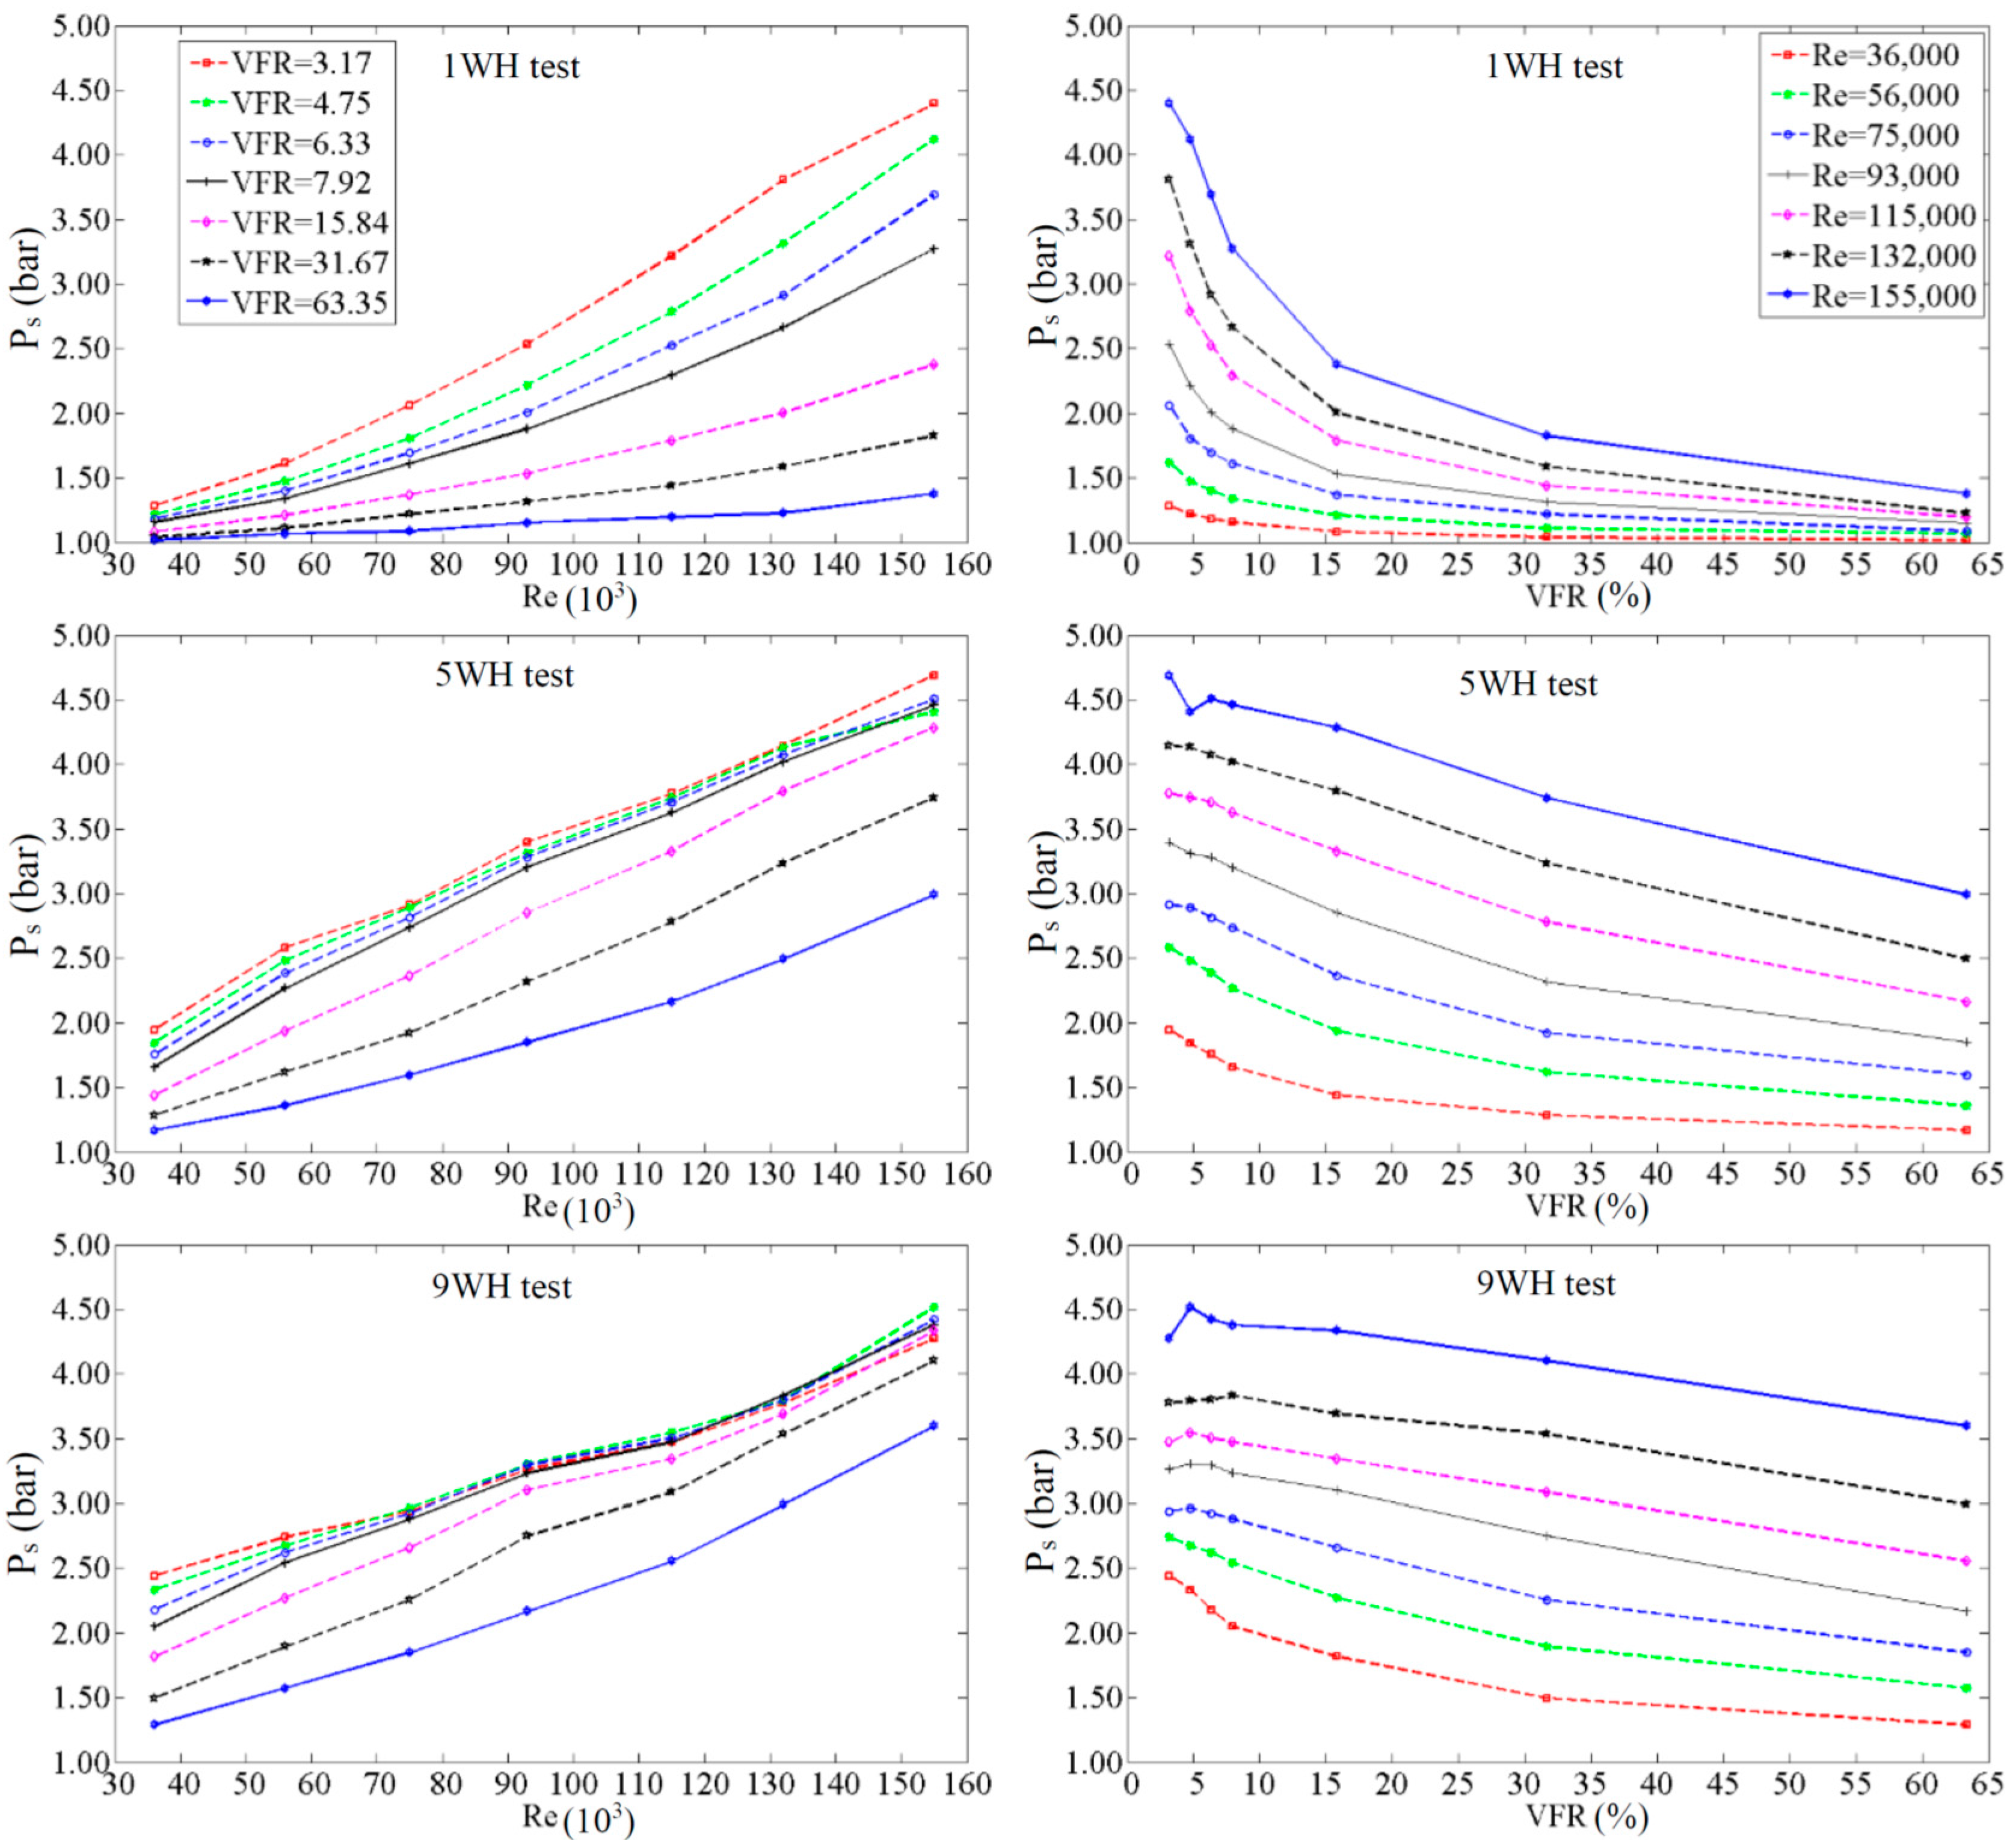
In fact, the rules for changing the stored pressure with VFR and Re are the same in all the tests, as stated below and shown in
Figure 7:
Finally, the curves in
Figure 7 show that for the VFR < 15%, the stored pressure of all three groups of tests, i.e., 1WH, 5WH and 9WH do not show a substantial difference in magnitude and the WH events do not appear to play an important role in pressure storage. However, for VFRs > 15%, the stored pressure is significantly higher for 5WH and 9WH than for 1WH tests, showing the importance of number of WH events.
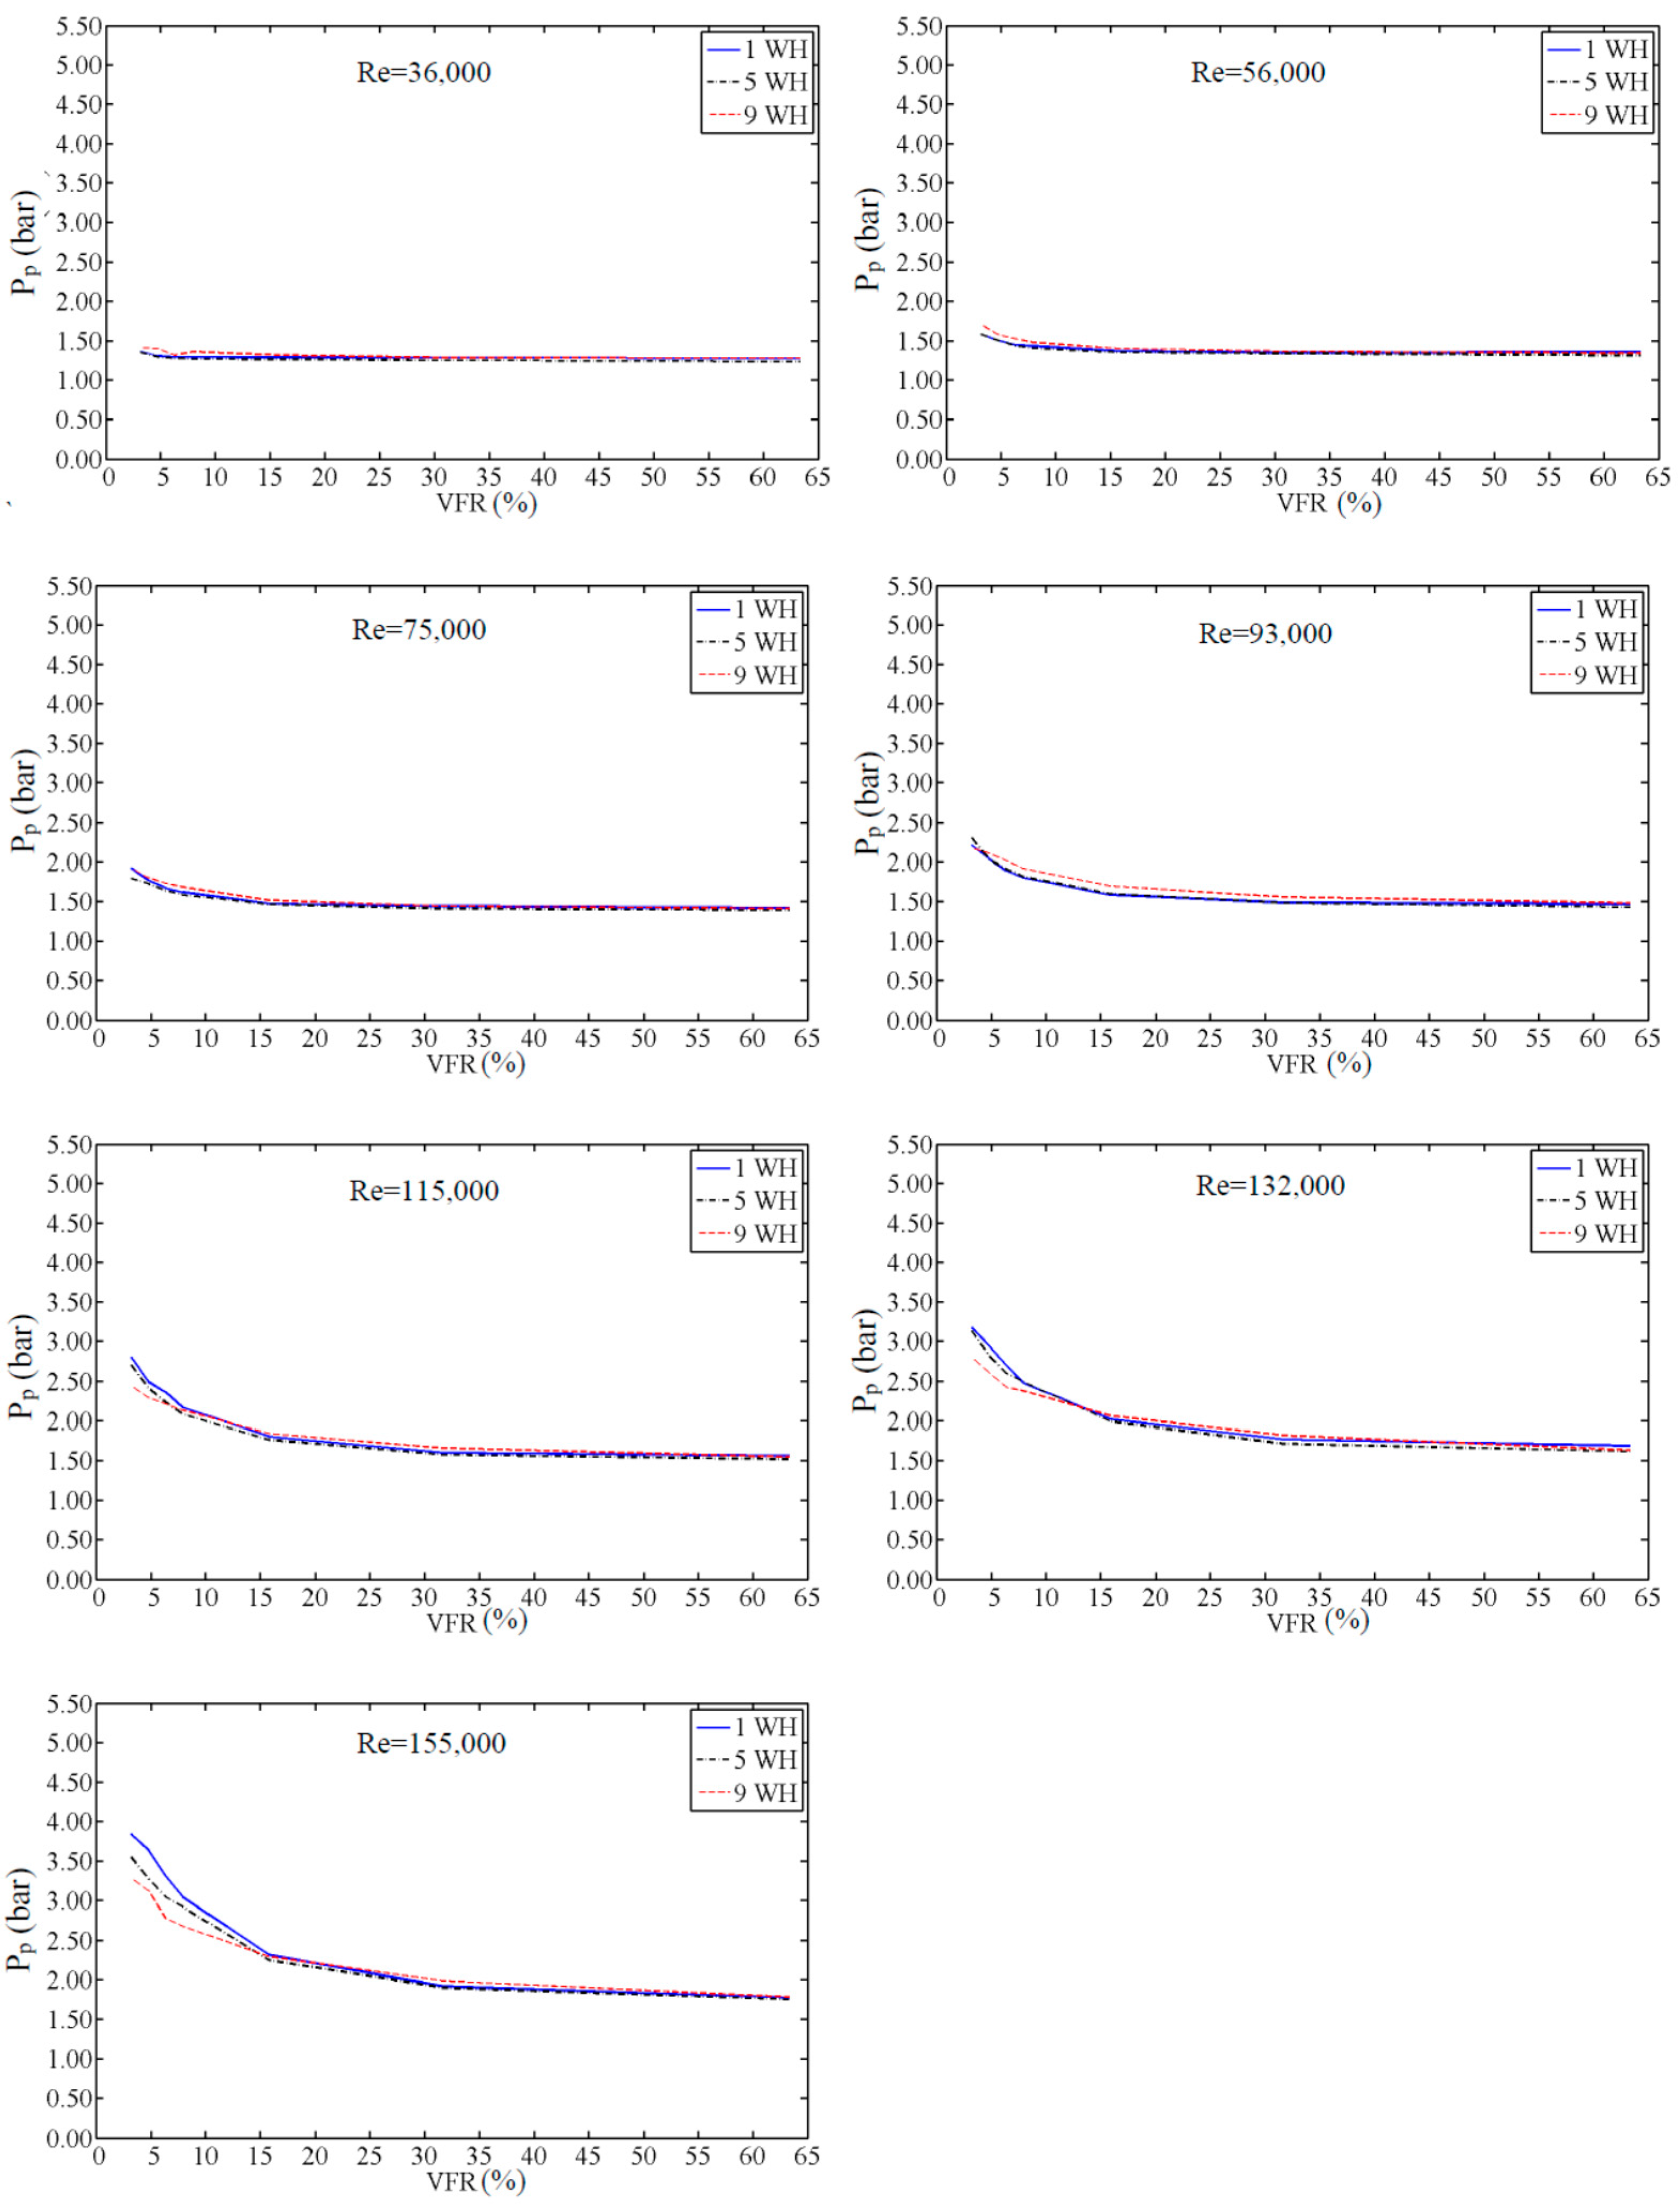
To keep a pressurized system in a safe and stable condition during transient events, controlling the pressure along a pipe from the transient source position plays a major role. For that purpose, the pressure inside the pipe at the PT
2 point is measured and its maximum value is named P
p.
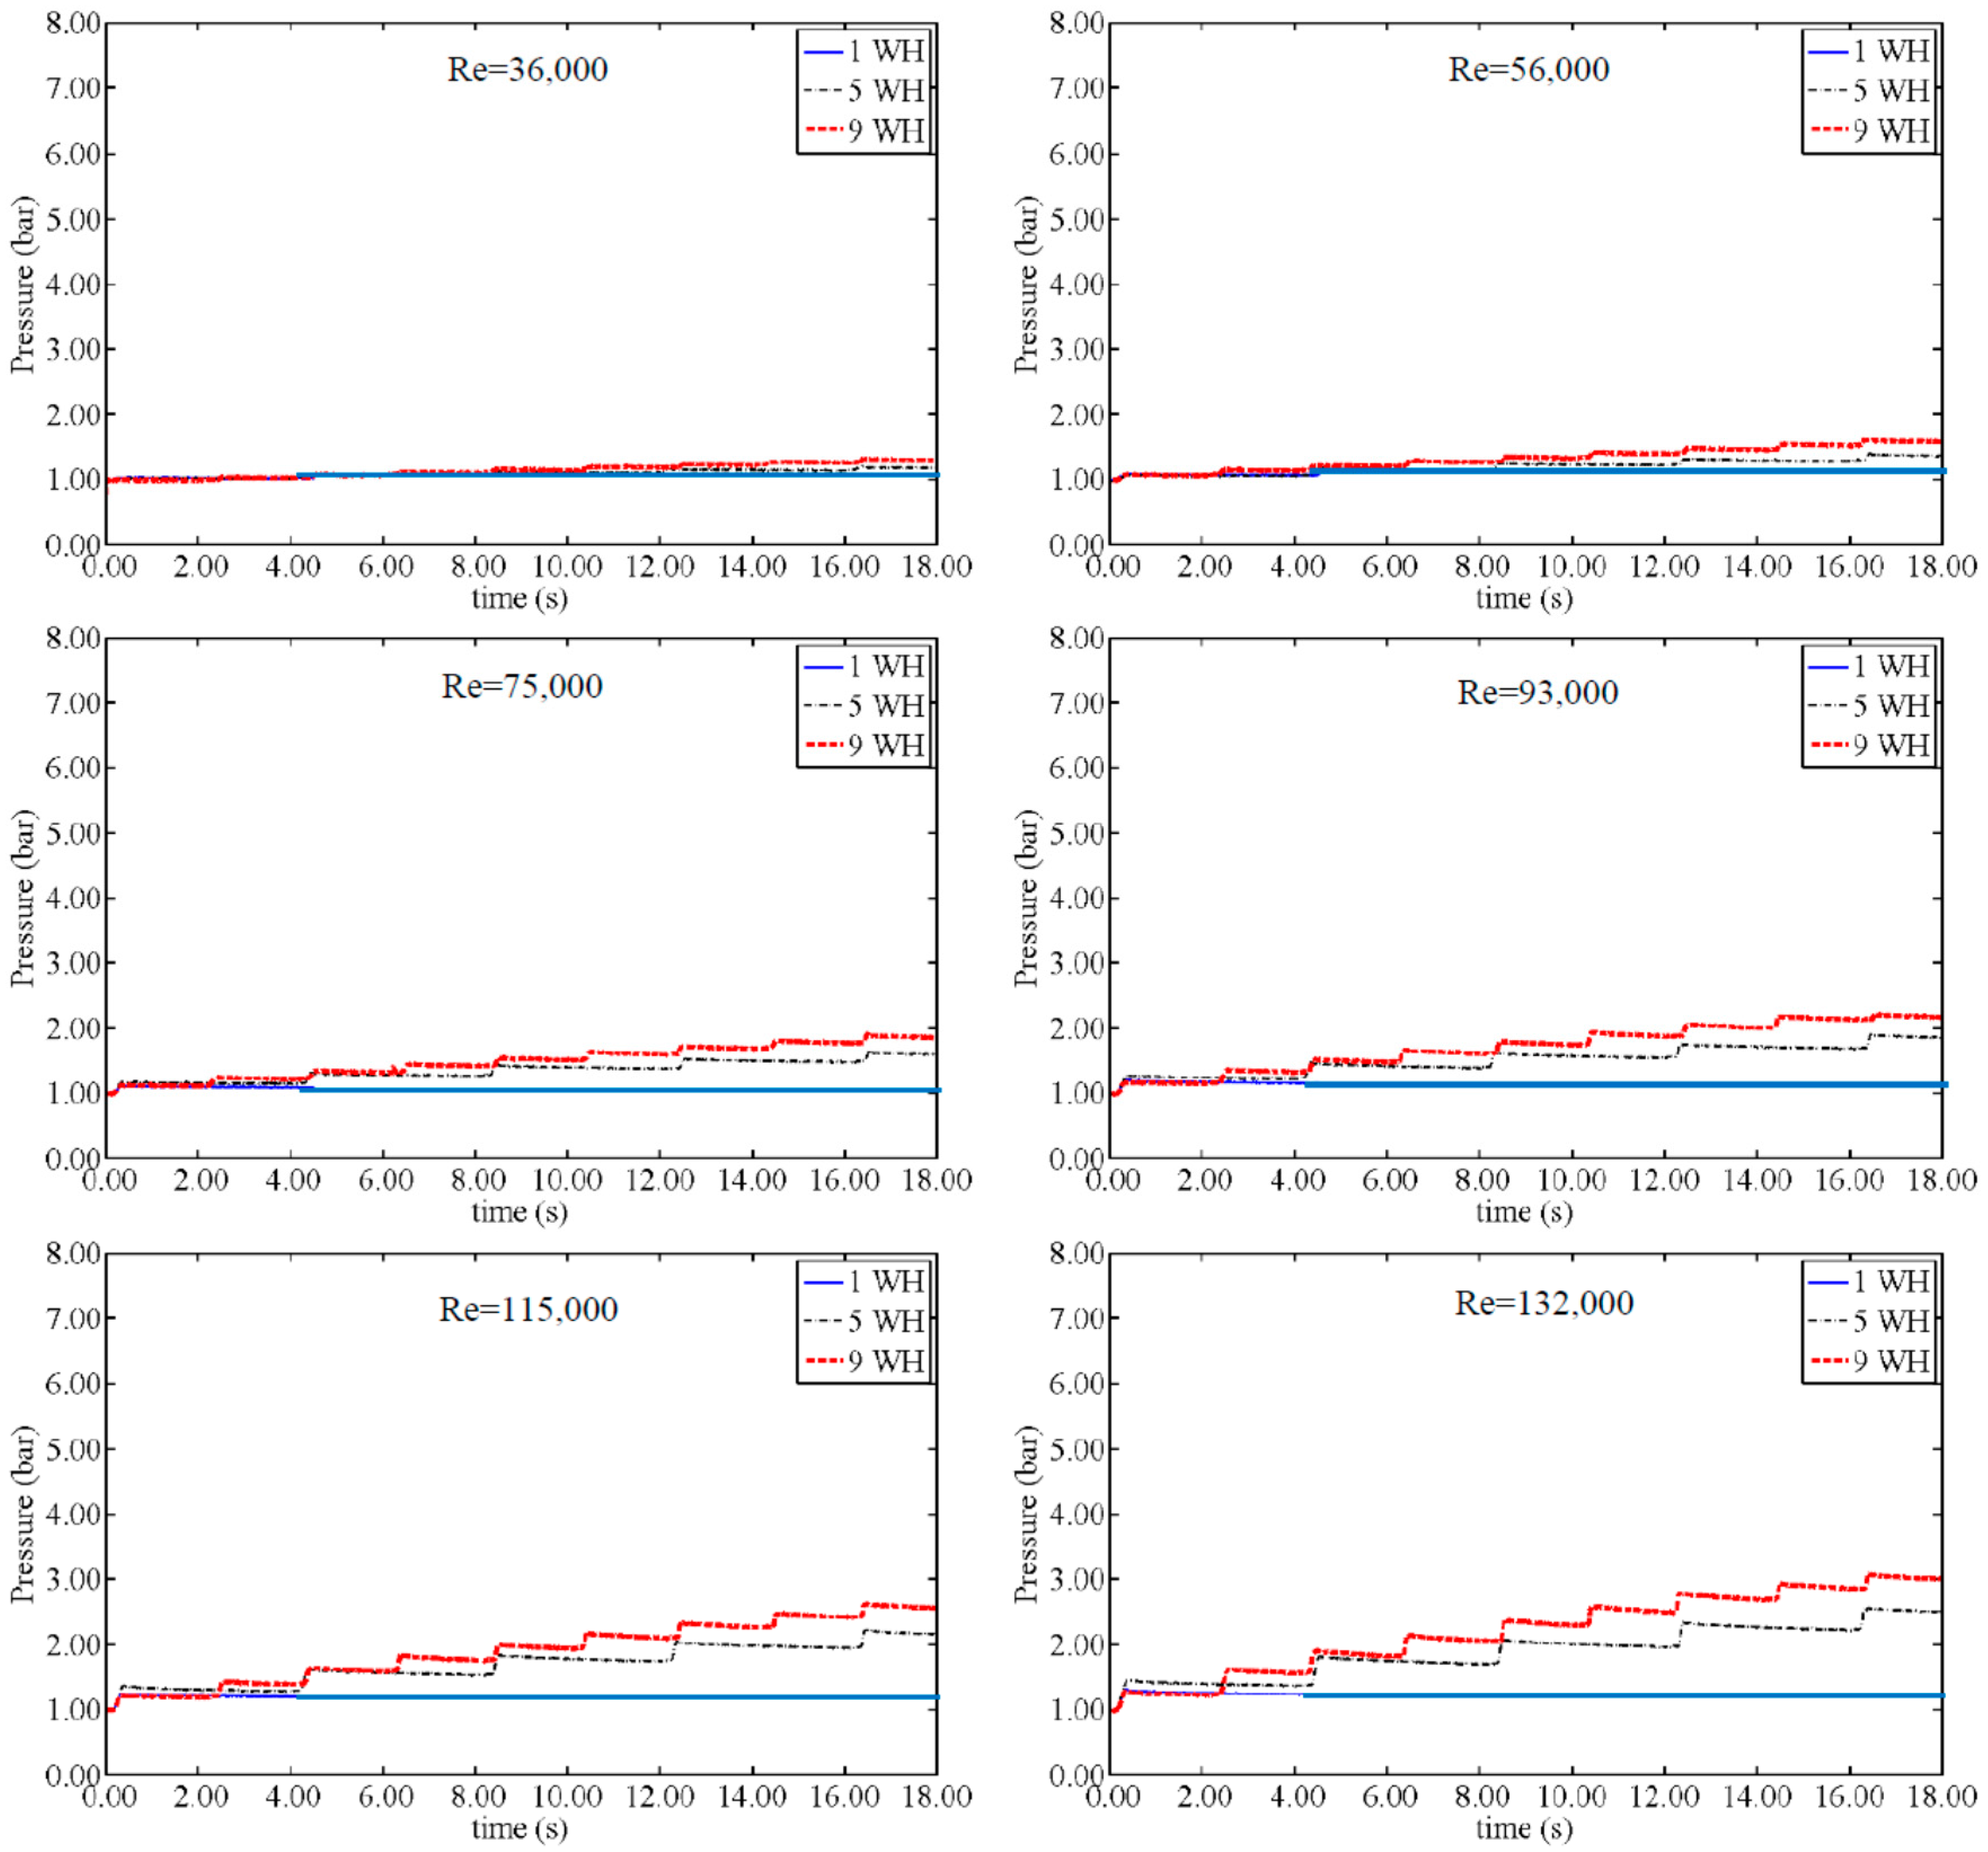
Figure 8 shows the change of maximum pressure in the pipe system for different Re values. Although the CAV does not have any discharge to the main pipe of the system, results in
Figure 8 show that increasing the AP size will significantly decrease the pressure peak inside the pipe (P
p), specifically for higher Re. All WH events show the same behavior. Since the safety of pressurized systems under transient conditions matters most for high Re, a high VFR seems to be a better option to control pressure surge. However, smaller CAVs are more economic and easier to apply. Regarding this concern,
Figure 8 shows the constant magnitude of pressure for the VFR > 30%.
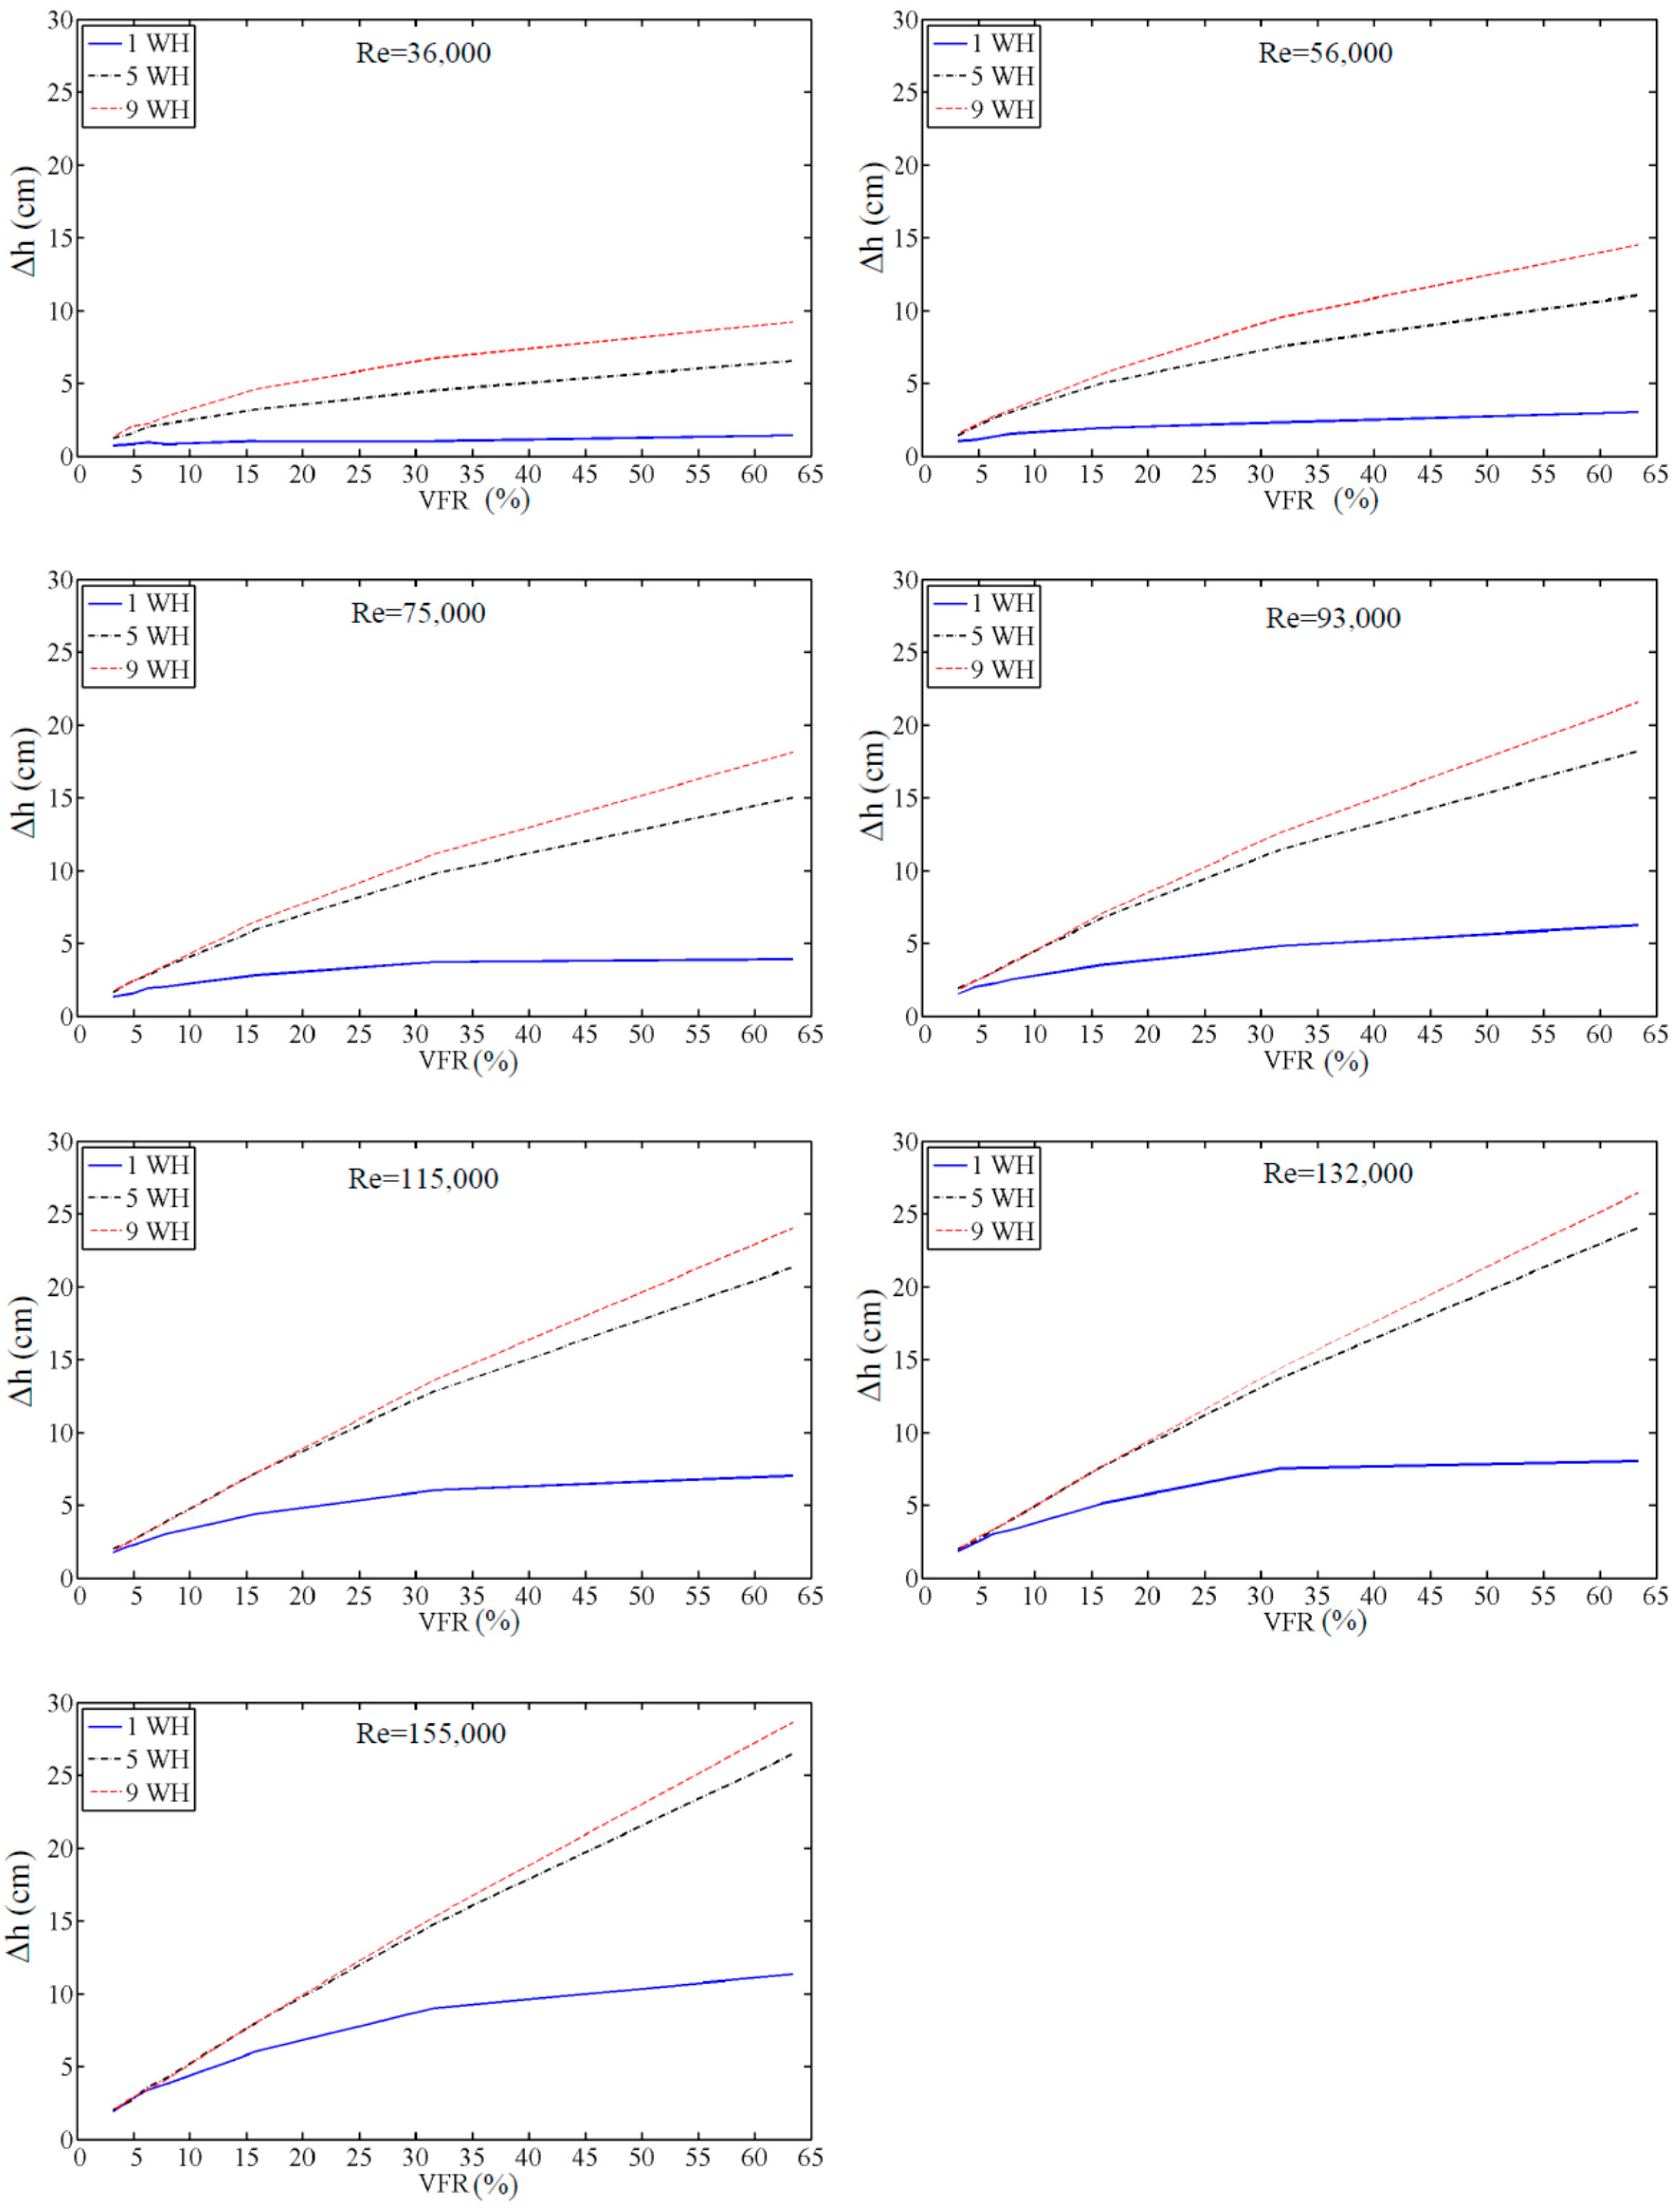
The water level in the CAV will rise during the WH tests as a consequence of pressure increasing by each WH action. The rising height of the water level is called Δh, a parameter that is calculated with Re and the VFR. The Δh shows a wide range of change from lower to higher values of Re and VFR (
Figure 9).
The Δh magnitude starts at around 1.2 cm for a small VFR and goes up to around 28 cm for the biggest VFR and Re in the 9WH case. The VFR > 30% showed good performance as presented in
Figure 8 for controlling the pressure surge in the pipe system. Since, for the purpose of controlling the pressure surge by a CAV, only one WH can occur, the Δh remains in an acceptable range for the worst case, i.e., remains below 20% of the CAV length.
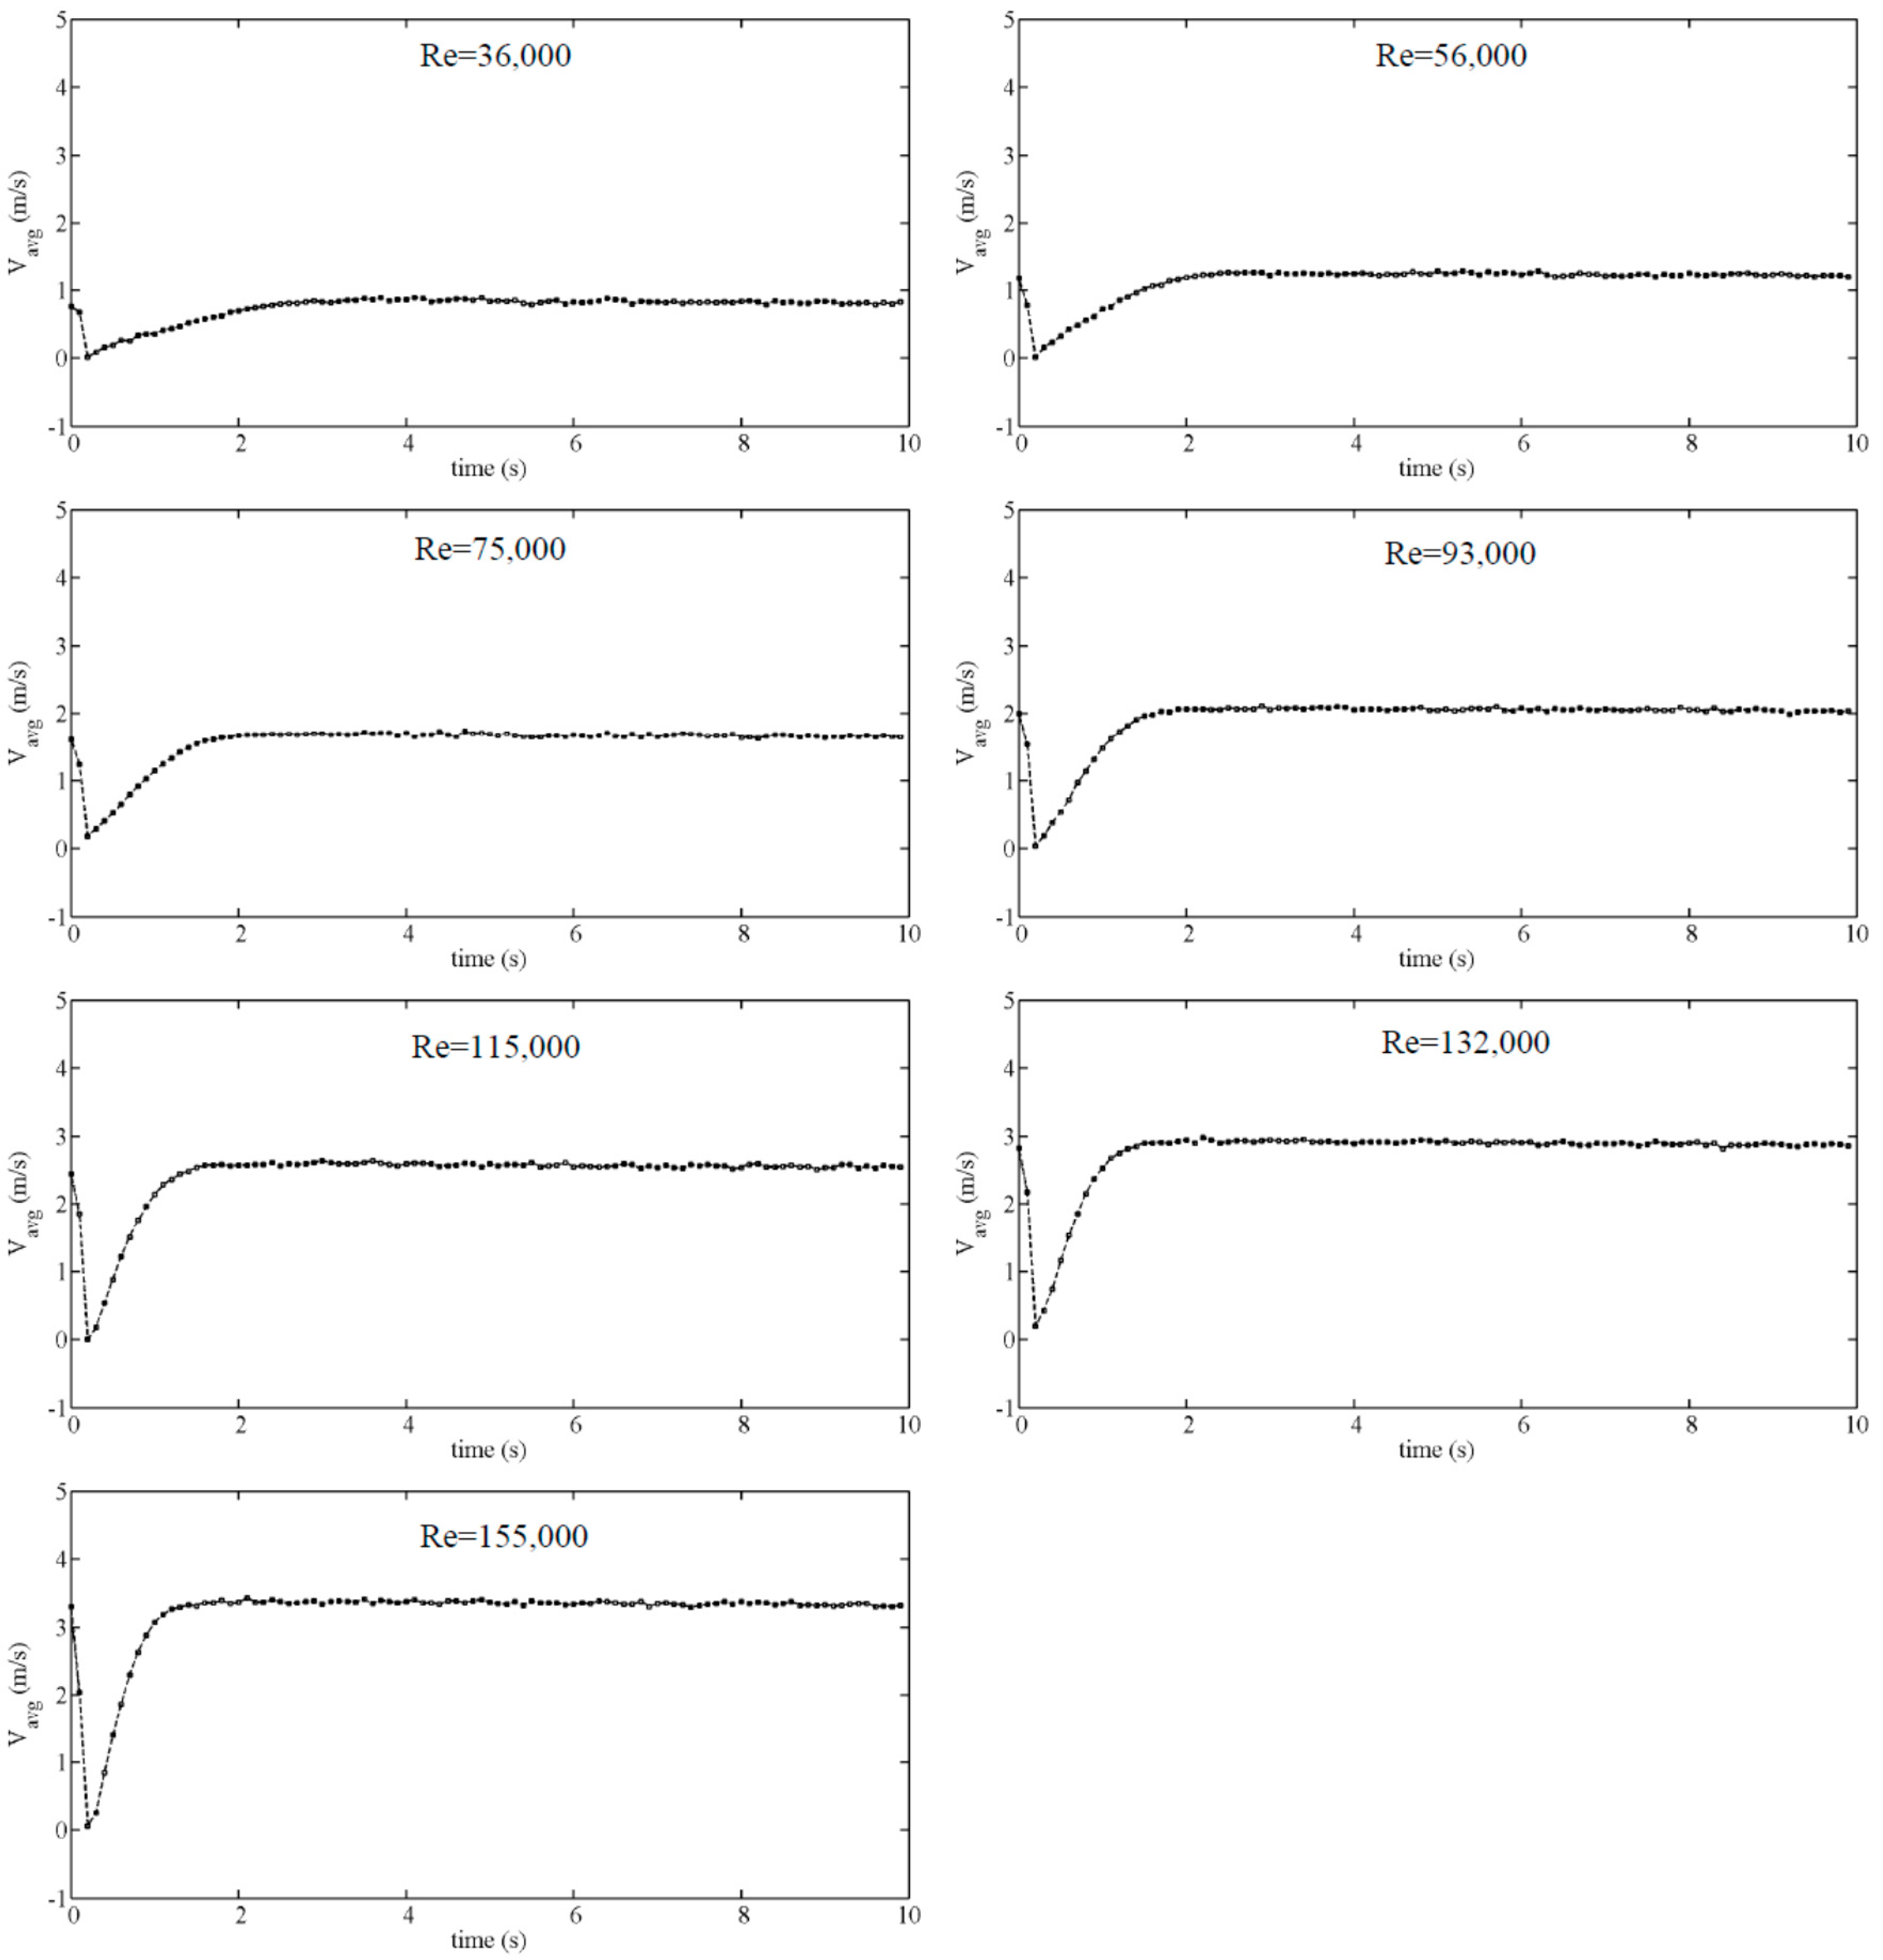
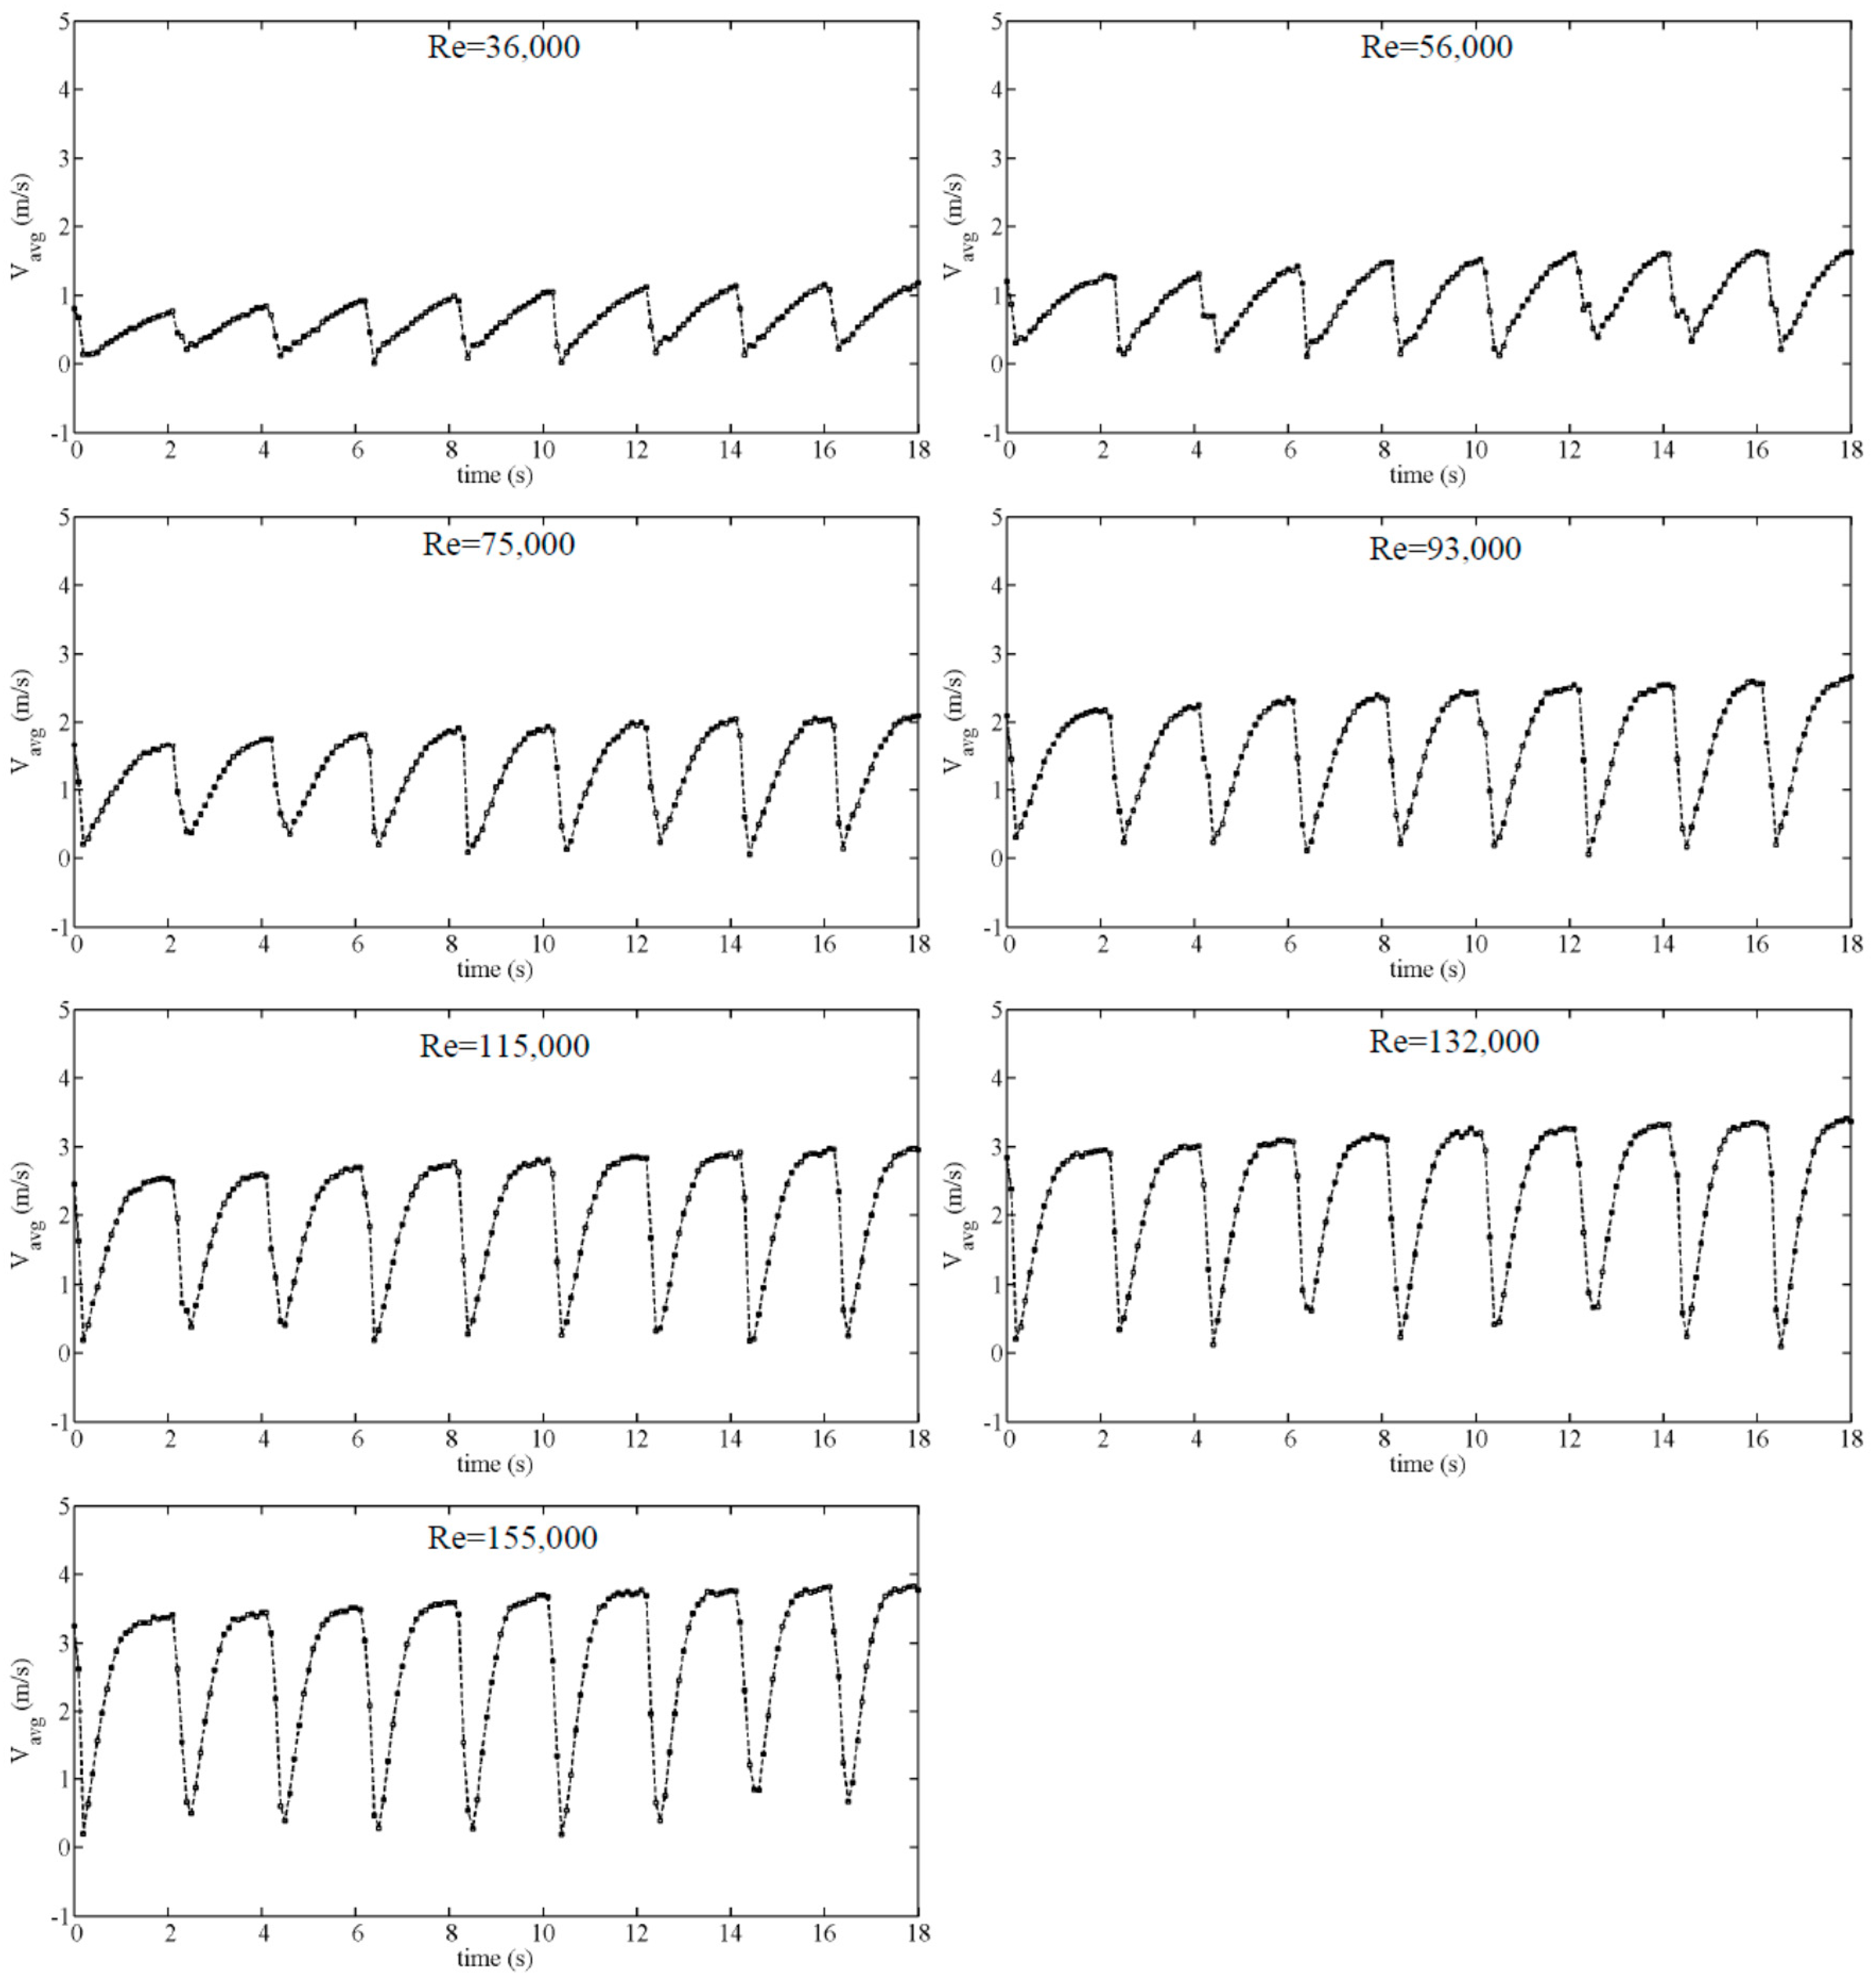
Figure 10 and
Figure 11 present average velocities (V
avg) for different Re for the 1WH and 9WH tests, where V
avg around zero indicates a WH occurrence. Since the V
avg does not show less than zero values, it can be concluded that the velocity vectors in reverse direction are not significant compared to the remaining flow. When repeating the WH to store energy in an AP, it is important to preserve the required flow rate in the pipe. During the “closed BV tests”, the flow rate downstream of the system is not altered.
3.2. Tests with Open BV
In these series of tests, the BV located in the lower level of the CAV is left open to discharge water into an open water tank (
Figure 1). The water level should be adjusted before each test to have the predefined AP length. Since the CAV is completely confined, opening the BV before starting a test does not affect the water level in the CAV because of an emerging vacuum state in the AP. After each upsurge in the AP induced by the WH, a volume of water was dislodged. After finishing the test, the water level in the CAV returns to the initial level. In fact, no change takes place in the water level when comparing the start and end of each test. As a result, the pressure of the AP returned to initial pressure at the end of every WH.
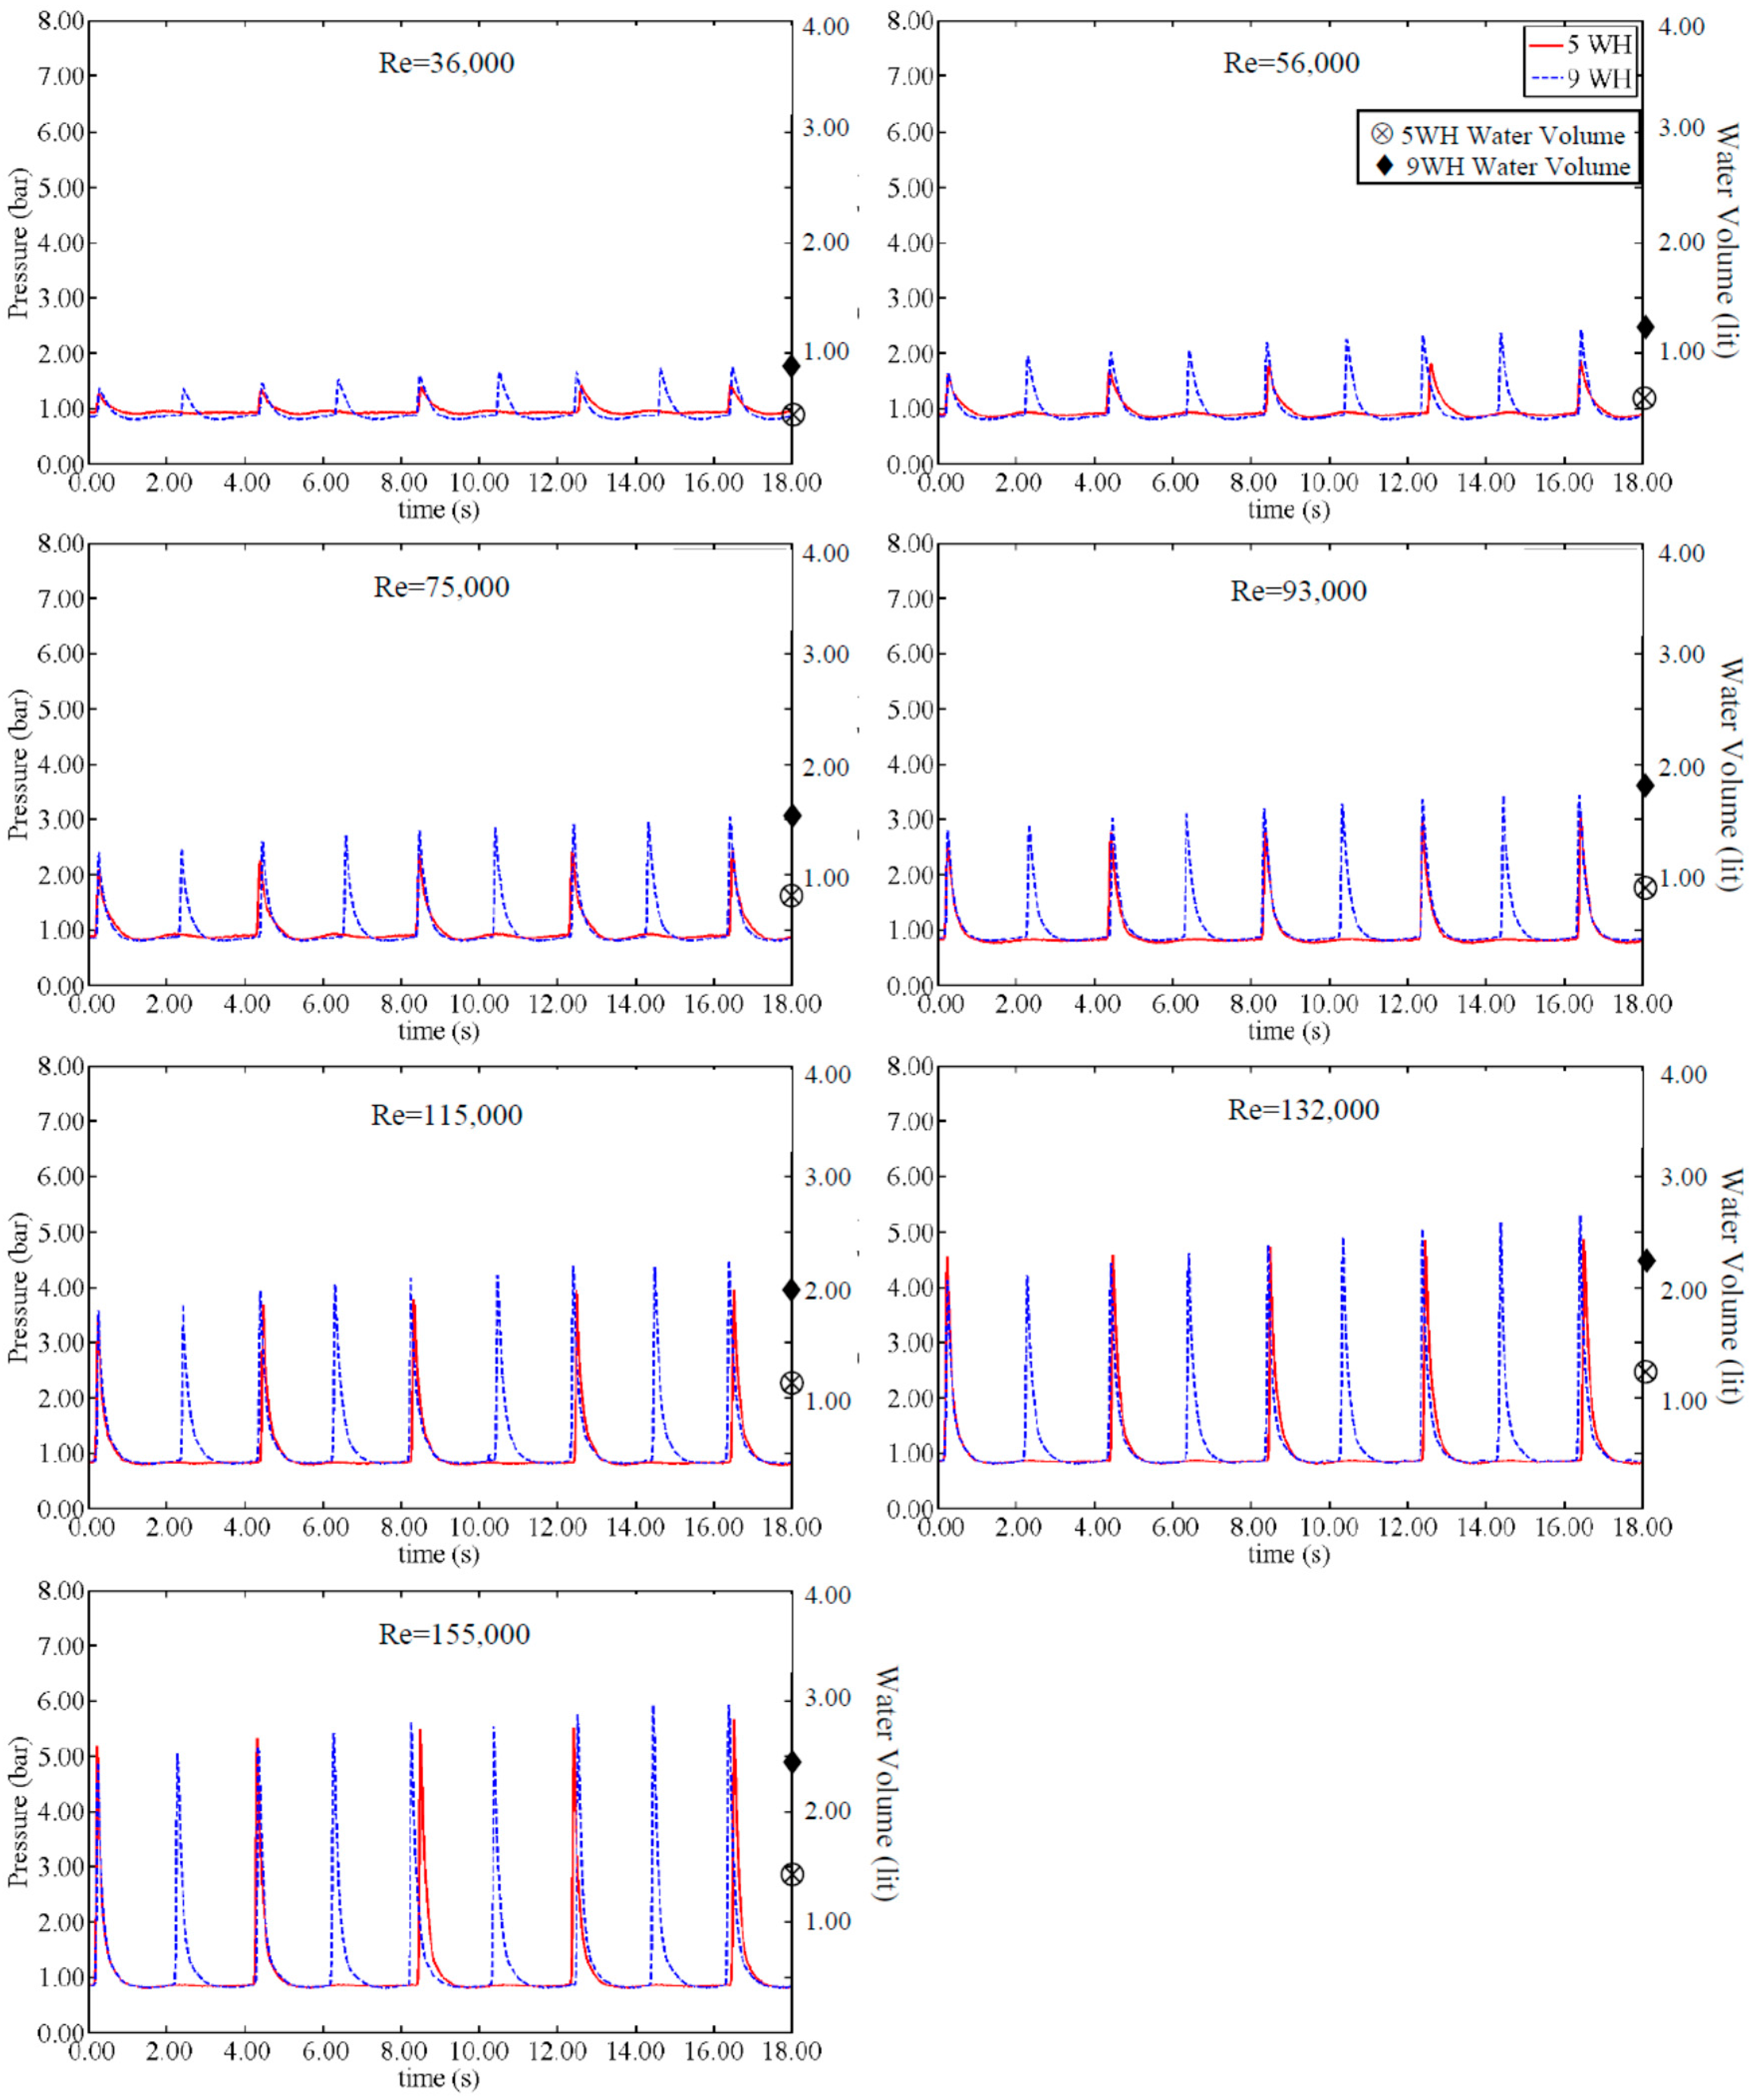
Figure 12 demonstrates the pressure changing way for 5WH and 9WH tests for AP length of 3 cm (VFR = 4.75%). The results from 1WH tests are not presented in
Figure 12 since they do not make a sensible change in the measured parameters. The discharged volume of water at the end of the test is shown in each graph too. The peak pressure is almost constant during the repetition of WH and the magnitude of peak pressure is approximately equal to the tests with closed BV presented in
Figure 3. As expected, by increasing the Re value, the magnitude of discharged water from the CAV rises.
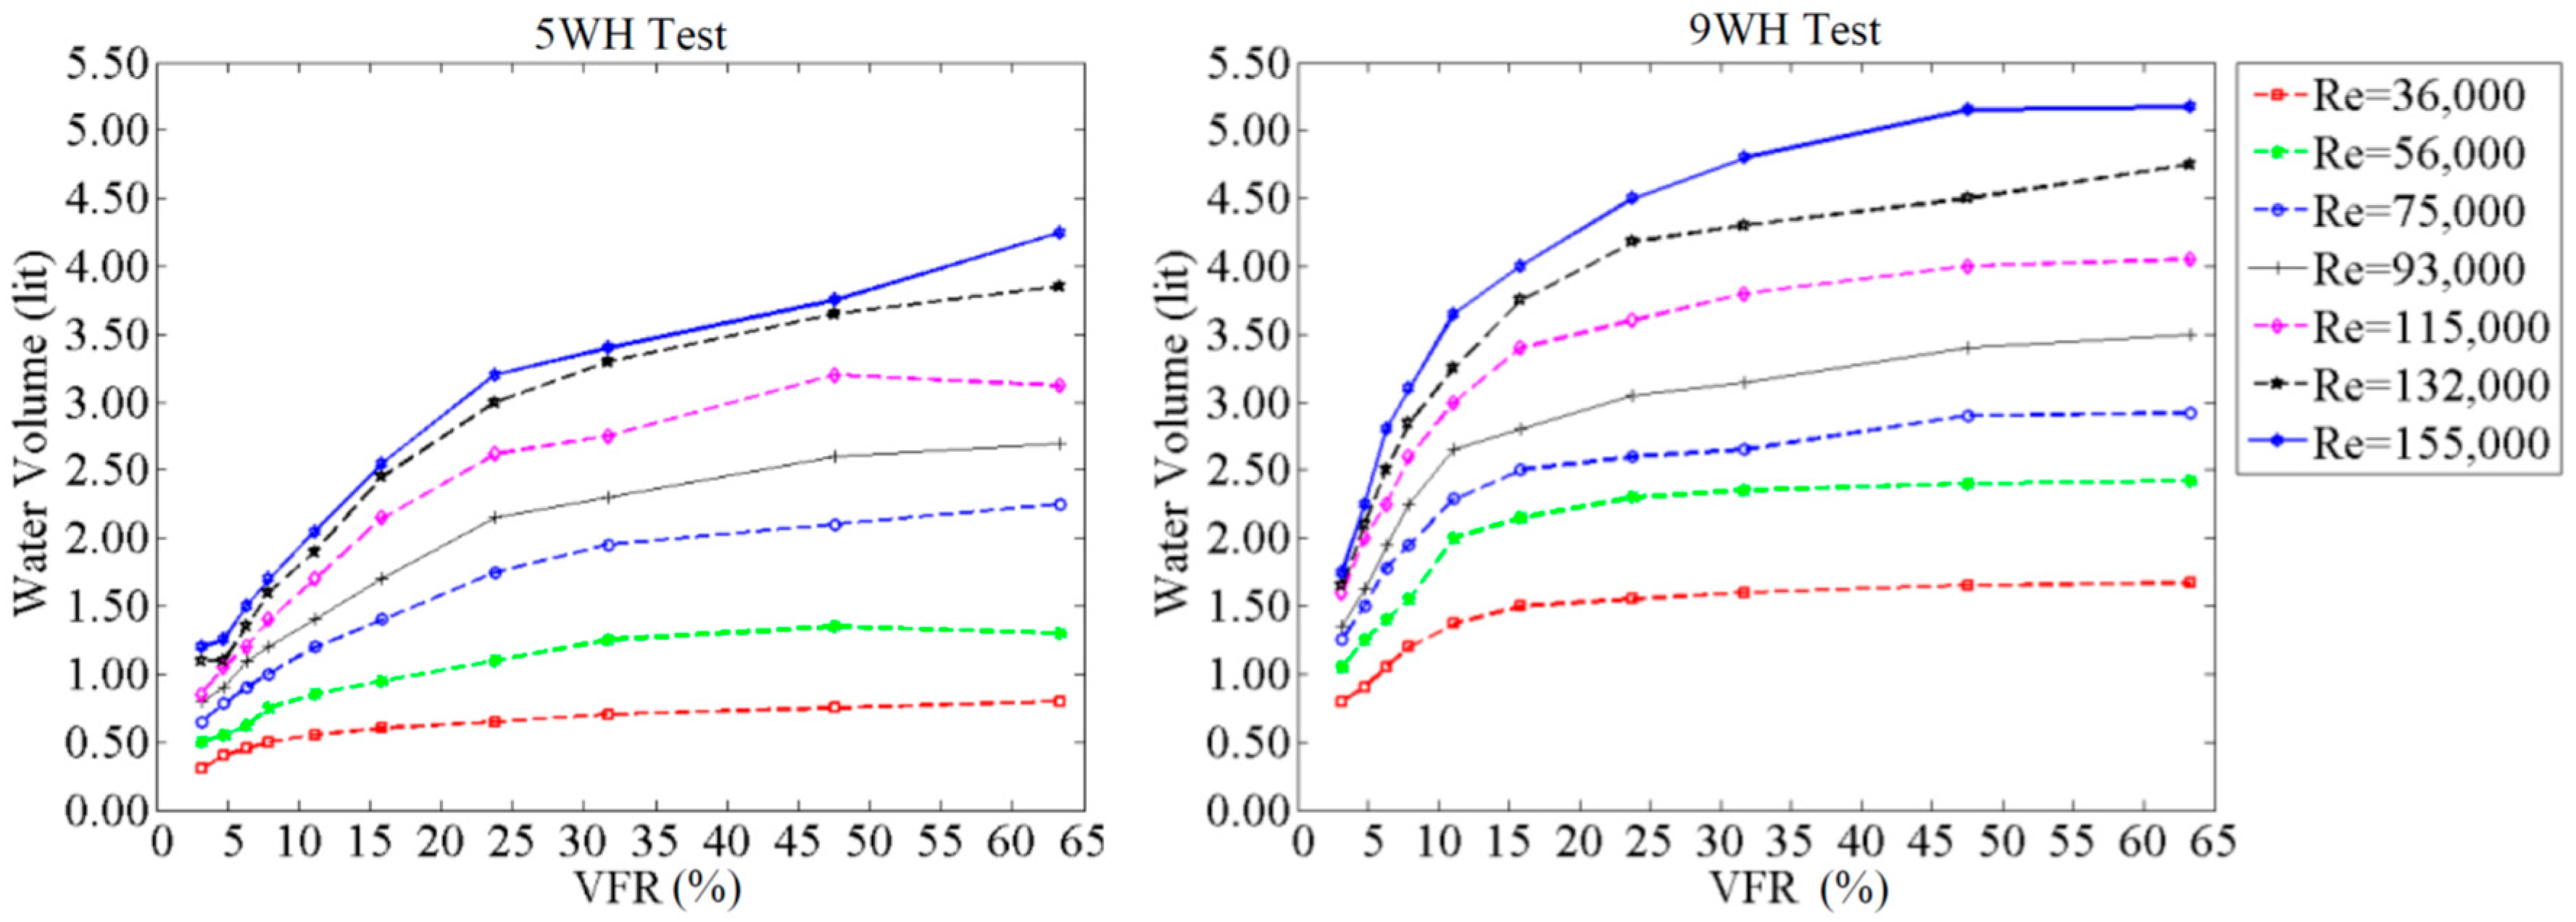
Figure 13 shows the amount of discharged water volume after each test for different VFR, Re and WH events. There is a fast increase in discharging water volume for small VFR while it rises slowly for bigger VFR. Working with a small VFR needs more attention due to its high sensitivity to the pressure.
Figure 13 shows that the discharged water volume for 9WH is considerably higher than for 5WH. In “open BV tests” the 9WH event creates a constant discharge from the CAV, while for the 5WH the discharge is not constant. In fact, the AP acts as a means of pressure storage and recovery, as a regulating flow system that adjusts the outflow from the CAV to create a constant discharge (see
Supplementary Materials).
After finishing the “open BV tests”, the discharge from the CAV stops and the water level returns to the initial level. For the VFR > 32% (AP length > 20 cm), the 9WH test leads to a constant discharge from the CAV which is less evident for the 5WH test. A high VFR shows very useful capability. This range of VFR seems to be very effective in SS-CAES systems when connected to the main water conveyance system.
4. Discussion
An extensive experimental work for AP behavior cognition has been carried out in Instituto Superior Técnico (IST) experimental laboratory. Tests are done with three WH events: 1WH, 5WH and 9WH. Also, two situations of the BV in the CAV, i.e., closed BV and open BV were conducted. In the closed BV tests, both peak pressure and stored pressure were raised by increasing the Re number and decreasing the VFR. In addition, stored pressure is much lower than peak pressure for small VFR, i.e., VFR < 11%. The pressure storage process is very regular and predictable for the VFR > 11%, but for smaller VFR values, the pressure storage starts with a high peak at the first WH occurrence. The stored pressure is always higher than the peak pressure (Ps > P1p) for Re ≤ 75,000. Also, the stored pressure is always higher than the peak pressure (Ps > P1p) if VFR > 11%. Despite being more frequent in 9WH tests, the stored pressure is not always higher than for other events. In fact, for the VFR < 30% and Re > 93,000, the stored pressure from 9WH is smaller than for 5WH. For reasoning, it can be stated that in one level of WH repetitions, the air reaches maximum compression for this pressure range. After that, more WH actions do not compress the air but lead to pressure loss by solving some portion of air into the water. Regular and equal pressure steps can be seen in the rising pressure of several WH events for Re < 75,000. For higher Re numbers, the pressure change route starts with a peak and dissipates fast, continuing with smaller steps. The stored pressure is in correlation with Re but in contrast to the VFR.
The pressure in the pipe system shows that increasing the VFR or AP size will diminish the pressure rising within the pipe. The final pressure in the pipe is more or less the same for the VFR > 20%. So, it seems that the VFR in the range of around 20% to 30% presents good ability to control the pressure without expanding the air vessel size.
It is very important for the optimal size of a CAV that the rising water level (Δh) stays in an acceptable range. The VFR from 20% showed good performance in controlling the pressure surge of WH events. For this range of VFR, the Δh remains below 20% of the CAV length.
In the “open BV test”, the condition of using the pressure energy of the WH to supply water as a ram pump was examined. By increasing the Re number, the outflow water volume will be increased too. The water level inside the CAV keeps the same elevation due to confinement and vacuum conditions. For the VFR > 32%, the WH events create a constant outflow from the CAV with regular compression and expansion in the AP in the 9WH tests.
This work presents an extensive experimental study of different WH events that can be used as a benchmark for future calculations using WH equations.
Finally, authors believe that the main effective parameter in pressure change inside the AP is the volume of the AP and flow velocity which have been referred by the dimensionless parameters VFR and Re respectively in the graphs. However, for different CAV sizes, namely diameter or height, the results may change. As a suggestion, researchers may examine the effect of different air vessel sizes on pressure change and other variables of an AP.
Supplementary Materials
The following videos from “open BV test” and “closed BV test” for 5WH and 9WH events are available showing the continuity of the flow discharge for APs of 20 and 40 cm in case of 9WH events. Videos AP = 5_5WH, AP = 5_9WH, AP = 10_5WH, AP = 10_9WH, AP = 20_5WH, AP = 20_9WH, AP = 40_5WH, AP = 40_9WH. The videos are available online at
www.mdpi.com/2073-4441/9/1/63/s1.
Acknowledgments
Authors appreciate the financial support from Ph.D. grant ref. PD/BD/114459/2016 issued by FCT under the IST-LNEC Joint Doctoral Initiative supported by the Civil Engineering, Research, and Innovation for Sustainability (CEris) Center, Department of Civil Engineering, Architecture and Georesources, Instituto Superior Técnico (IST), University of Lisbon (ULisbon), Portugal and providing the experimental facilities for conducting the tests.
Author Contributions
Mohsen Besharat has fulfilled the experimental activities. Results are analyzed and the paper is written with the contribution of Helena M. Ramos and Maria Teresa Viseu.
Conflicts of Interest
The authors declare no conflict of interest. The funding sponsors had no role in the design of the study; in the collection, analyses and interpretation of data; in the writing of the manuscript; and in the decision to publish the results.
Nomenclature
| AP | Air Pocket |
| WC | Water Column |
| CAV | Compressed Air Vessel |
| CAES | Compressed Air Energy Storage |
| WH | Water Hammer |
| VFR | Volume Fraction Ratio |
| Re | Reynolds Number |
| PT | Pressure Transducer |
| CV | Check Valve |
| EBV | Electro-Pneumatic Ball Valve |
| BV | Ball Valve |
| P1p | Maximum pressure related to the first peak of pressure oscillation |
| Ps | Stored pressure in the AP after finishing the tests |
| Pp | Maximum pressure in the pipe at PT2 point during WH test |
References
- Chaudhry, M.H. Applied Hydraulic Transients, 3rd ed.; Springer: New York, NY, USA, 2014; pp. 351–352. [Google Scholar]
- Ruus, E.; Karney, B. Applied Hydraulic Transients; Friesens Corporation: Altona, MB, Canada, 1997. [Google Scholar]
- Stephenson, D. Simple guide for design of air vessels for water hammer protection on pumping lines. J. Hydraul. Eng. 2002, 128, 792–797. [Google Scholar] [CrossRef]
- Izquierdo, J.; Lopez, P.A.; Lopez, G.; Martinez, F.J.; Perez, R. Encapsulation of air vessel design in a neural network. Appl. Math. Model. 2006, 30, 395–405. [Google Scholar] [CrossRef]
- De Martino, G.; Fontana, N. Simplified approach for the optimal sizing of throttled air chambers. J. Hydraul. Eng. 2012, 138, 1101–1109. [Google Scholar] [CrossRef]
- Ramalingam, D.; Lingireddy, S. Neural network-derived heuristic framework for sizing surge vessels. J. Water Resour. Plan. Manag. 2014, 140, 678–692. [Google Scholar] [CrossRef]
- Hatcher, T.M.; Vasconcelos, J.G. Peak pressure surges and pressure damping following sudden air pocket compression. J. Hydraul. Eng. 2016. [Google Scholar] [CrossRef]
- Pozos-Estrada, O.; Sánchez-Huerta, A.; Breña-Naranjo, J.A.; Pedrozo-Acuña, A. Failure analysis of a water supply pumping pipeline system. Water 2016, 8, 395. [Google Scholar] [CrossRef]
- Malekpour, A.; Karney, B.; Nault, J. Physical understanding of sudden pressurization of pipe systems with entrapped air: Energy auditing approach. J. Hydraul. Eng. 2015, 142. [Google Scholar] [CrossRef]
- Apollonio, C.; Balacco, G.; Fontana, N.; Giugni, M.; Marini, G.; Piccinni, A.F. Hydraulic transients caused by air expulsion during rapid filling of undulating pipelines. Water 2016, 8, 25. [Google Scholar] [CrossRef]
- Besharat, M.; Ramos, H.M. Theoretical and experimental analysis of pressure surge: In a two-phase compressed air vessel. In Proceedings of the 12th International Conference on Pressure Surges, Dublin, Ireland, 18–20 November 2015; Code 119785. Available online: http://www.scopus.com/inward/record.url?eid=2-s2.0-84966351254&partnerID=MN8TOARS (accessed on 17 January 2017).
- Proczka, J.J.; Muralidharan, K.; Villela, D.; Simmons, J.H.; Frantziskonis, G. Guidelines for the pressure and efficient sizing of pressure vessels for compressed air energy storage. Energy Convers. Manag. 2013, 65, 597–605. [Google Scholar] [CrossRef]
- Ibrahim, H.; Younès, R.; Basbous, T.; Ilinca, A.; Dimitrova, M. Optimization of diesel engine performances for a hybrid wind-diesel system with compressed air energy storage. Energy 2011, 36, 3079–3091. [Google Scholar] [CrossRef]
- Kim, Y.M.; Favrat, D. Energy and exergy analysis of a micro-compressed air energy storage and air cycle heating and cooling system. Energy 2010, 35, 213–220. [Google Scholar] [CrossRef]
- Budt, M.; Wolf, D.; Span, R.; Yan, J. A review on compressed air energy storage: Basic principles, past milestones and recent developments. Appl. Energy 2016, 170, 250–268. [Google Scholar] [CrossRef]
- Martins, S.C. Dynamic of Hydraulic System Pressurization with Entrapped Air. Ph.D. Thesis, Instituto Superior Técnico, University of Lisbon, Lisbon, Portugal, 2013. [Google Scholar]
- Besharat, M.; Tarinejad, R.; Ramos, H.M. The effect of water hammer on a confined air pocket towards flow energy storage system. J. Water Suppl. Res. Technol.-AQUA 2015, 65, 116–126. [Google Scholar] [CrossRef]
© 2017 by the authors; licensee MDPI, Basel, Switzerland. This article is an open access article distributed under the terms and conditions of the Creative Commons Attribution (CC-BY) license (http://creativecommons.org/licenses/by/4.0/).


